Thursday April 13th – Breaking Free Again
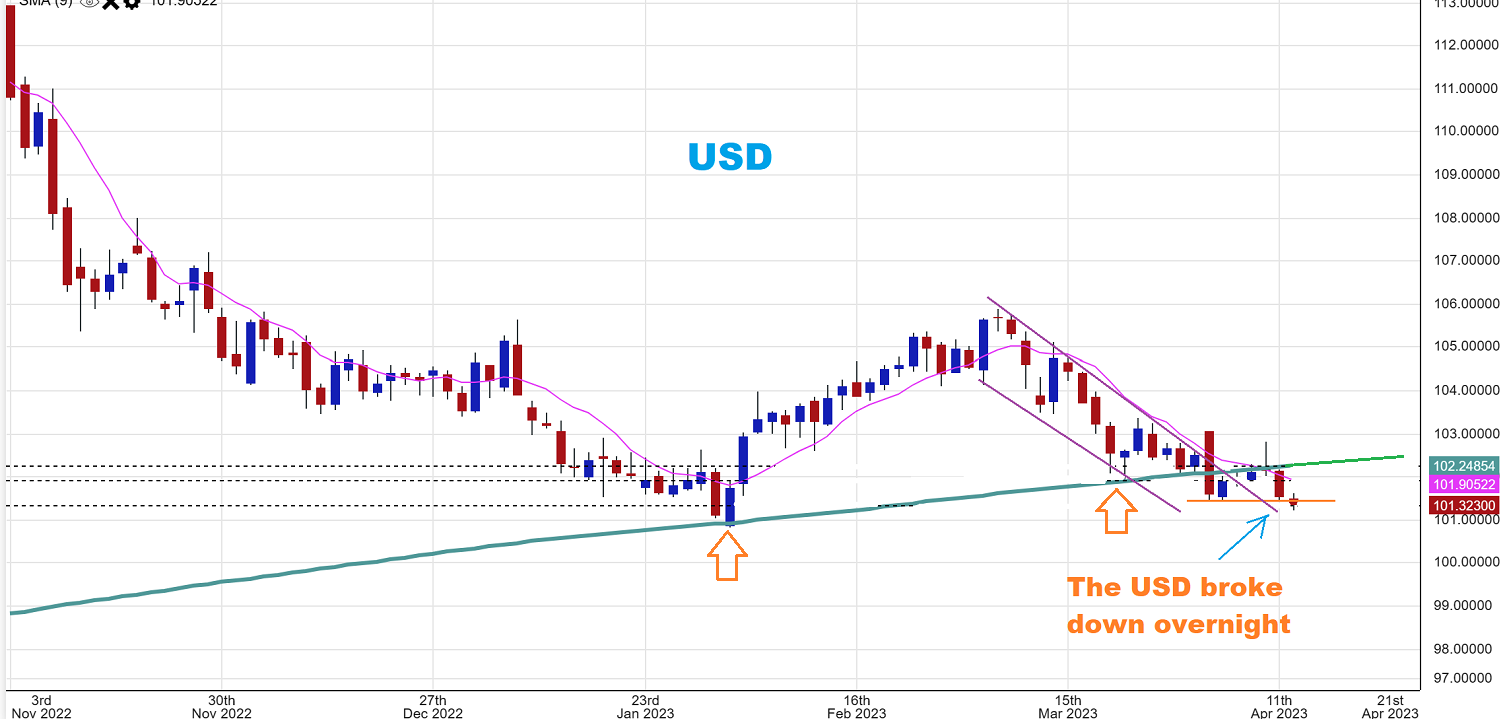
On Wednesday we had the CPI Numbers released and all of the Futures took off higher as the USD dropped sharply. As the day went on, however, they released the Fed Minutes, and the markets all sold off. I have to wonder if the end of the day ‘Fed Minutes’ sell down was the false move. Why? Because The USD slammed down and stayed down, so that will usually help the Markets. A LOT LIKELY DEPENDS ON THE USD FROM HERE, so let’s take a look…
.
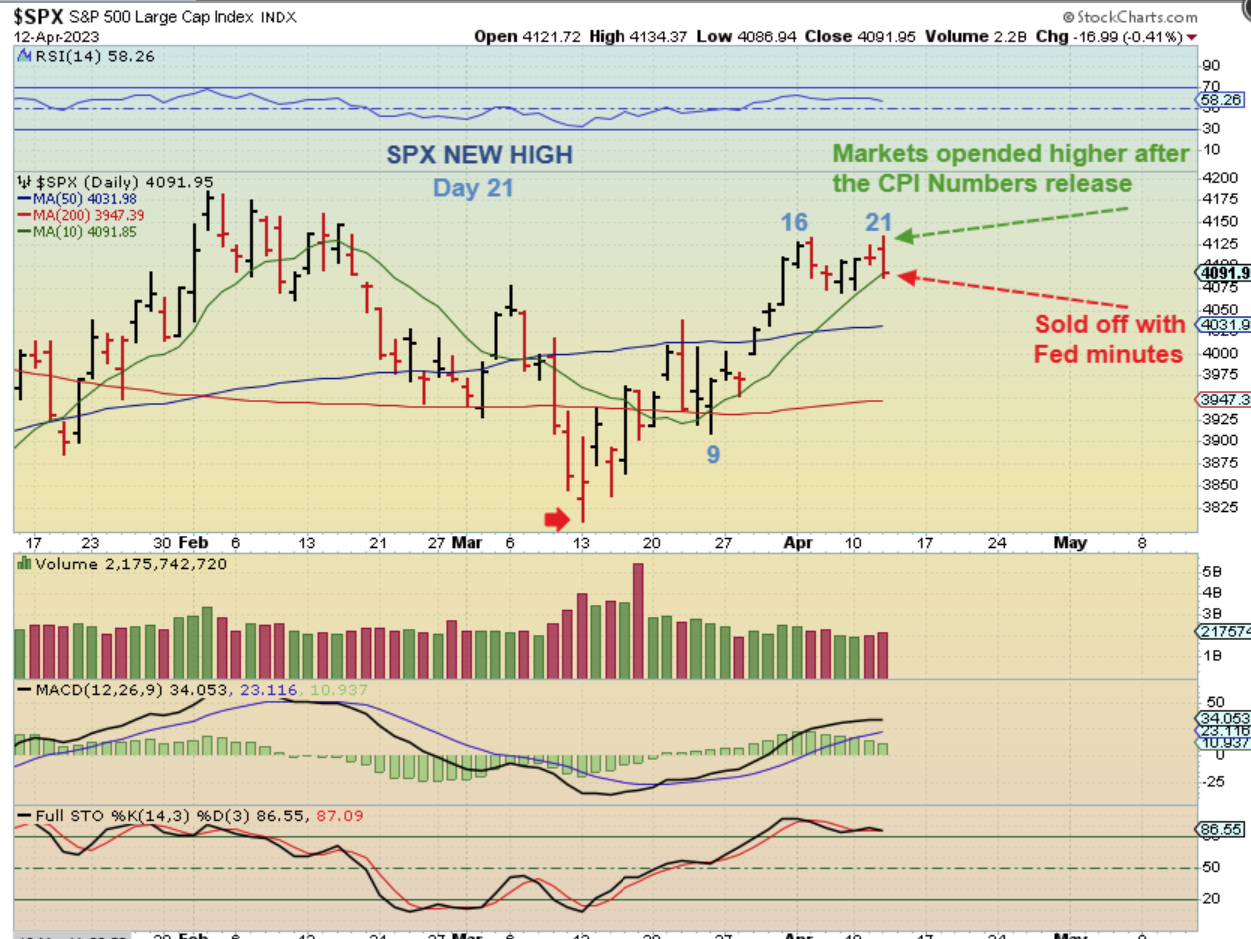
So The SPX gapped up with the inflation numbers, but sold off into the close. It is on support, so Thursday will tell us if we are likely to continue to drop into a dcl soon, or not. We DID get a slightly new high on day 21, so that is still reflecting a bullish market.
.
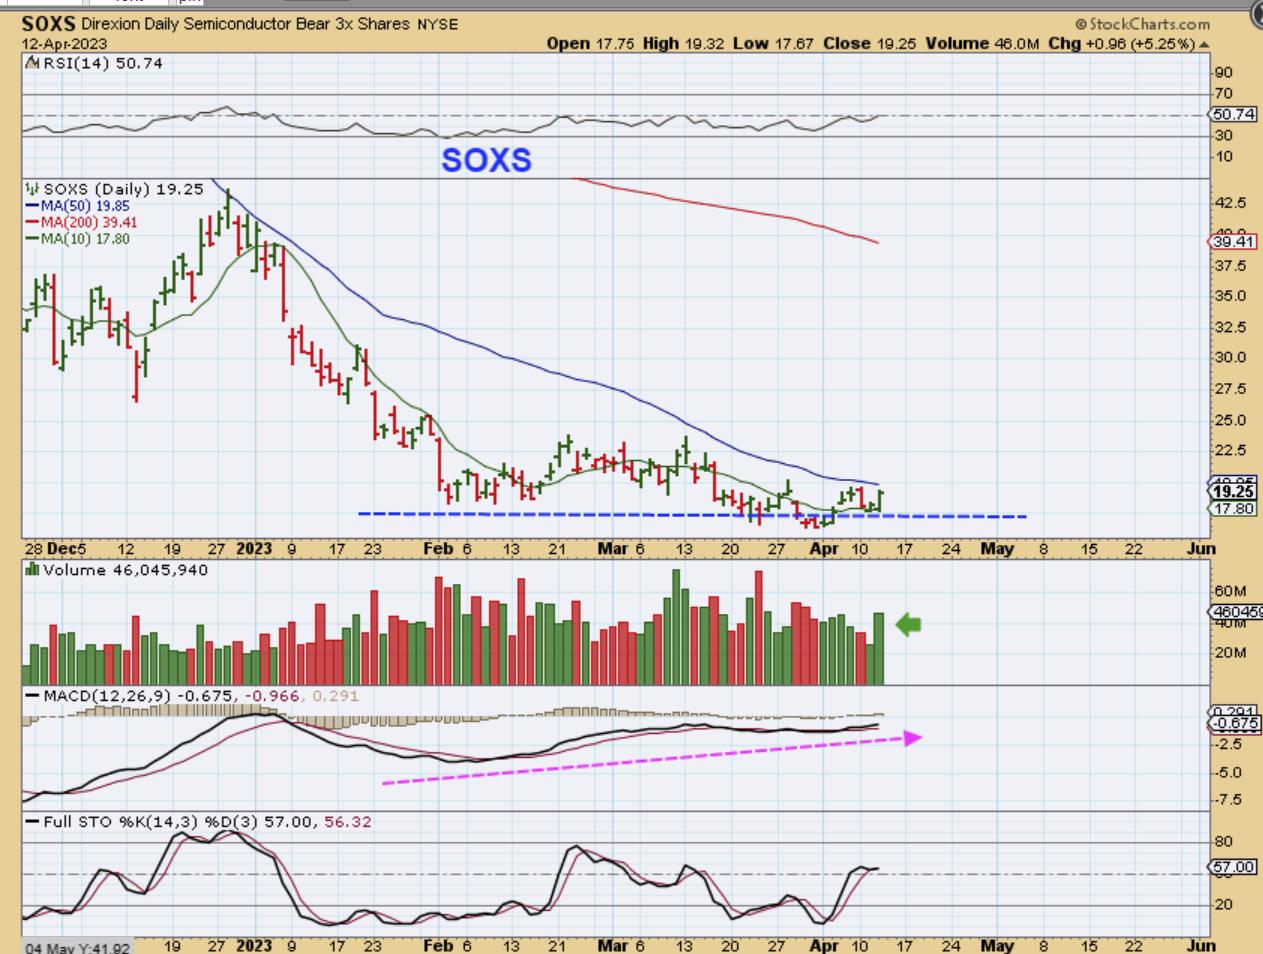
SOXS ( 3x Bear ETF) This does look bullish and would run higher if the markets sell down unto a dcl. I’m watching that 50sma.
.
Yesterday I wrote :
.
.
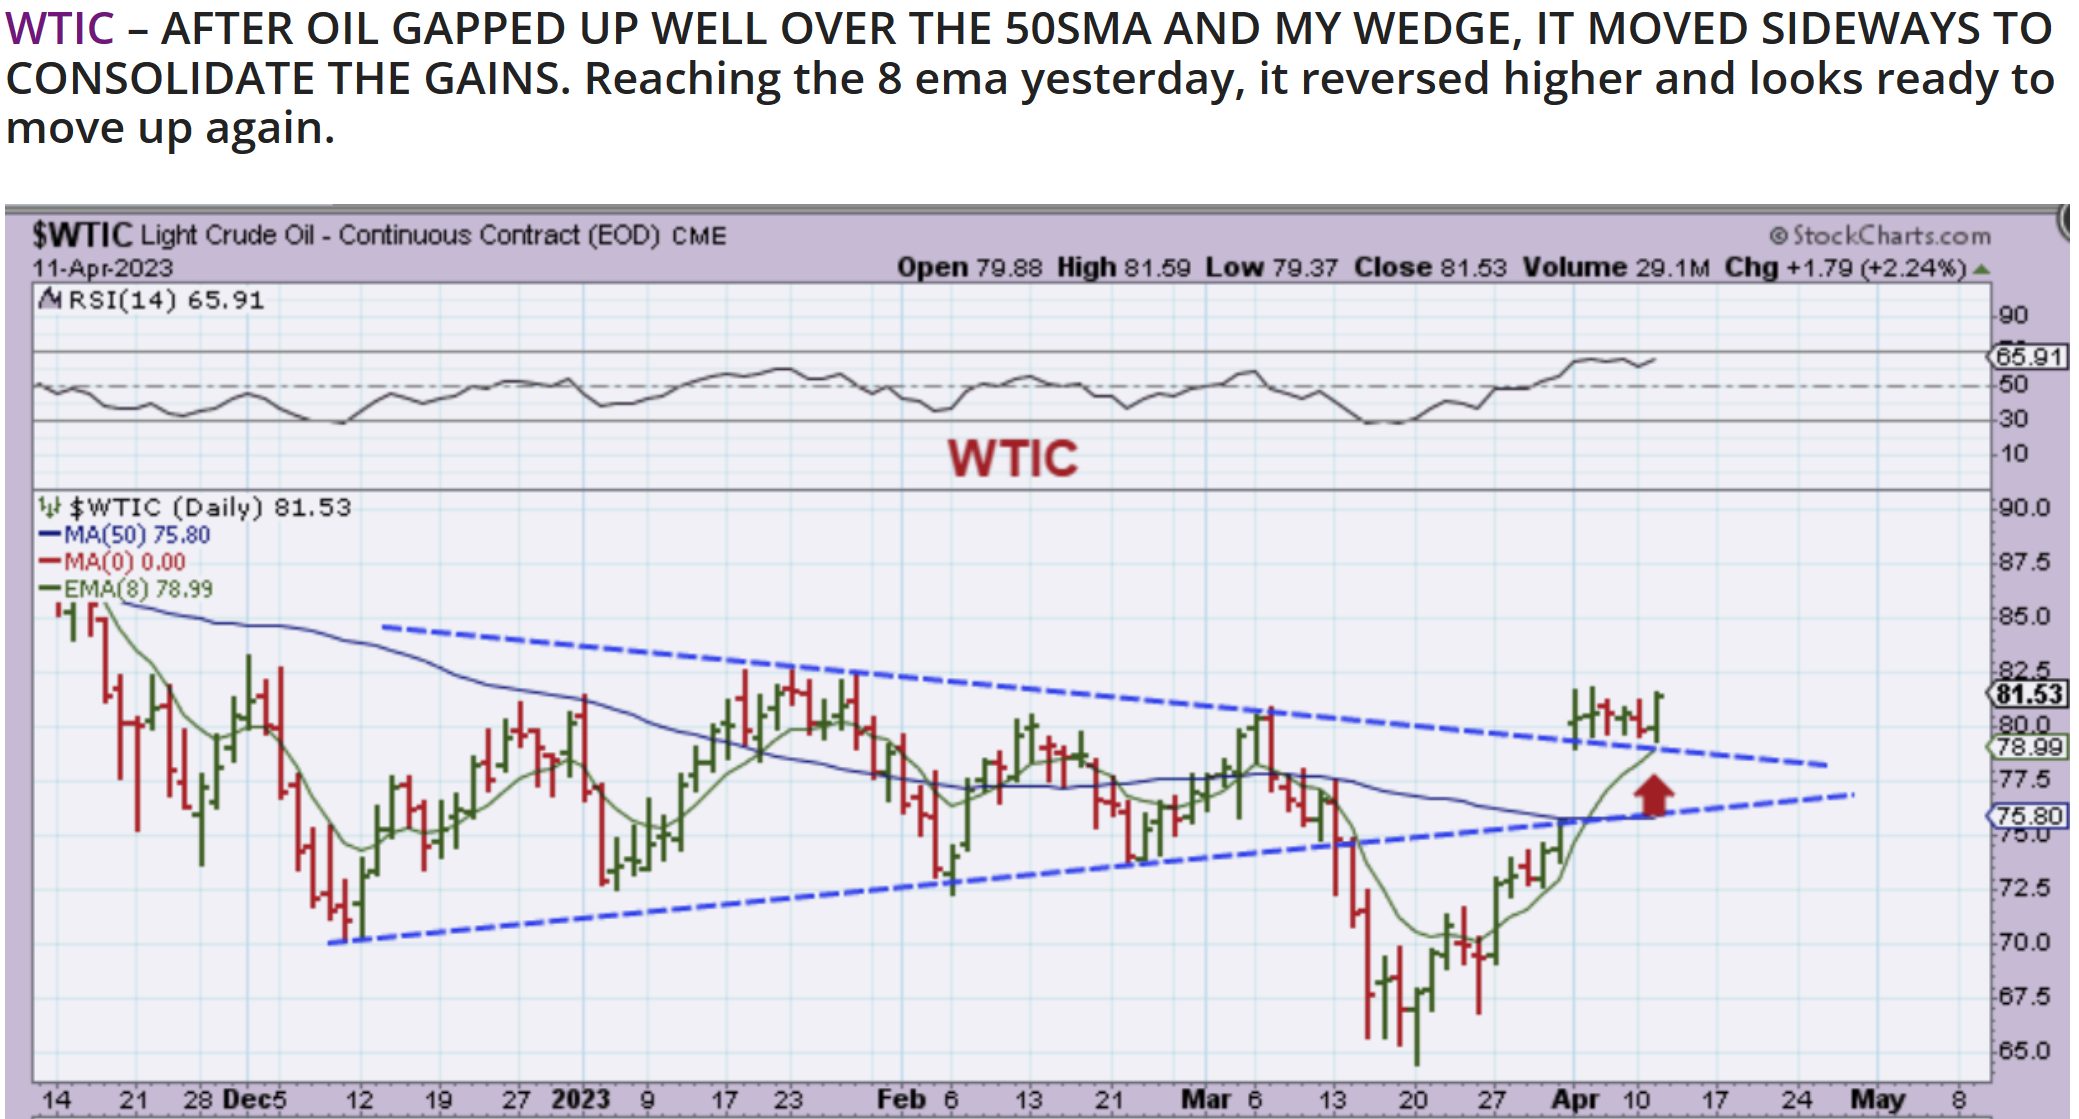
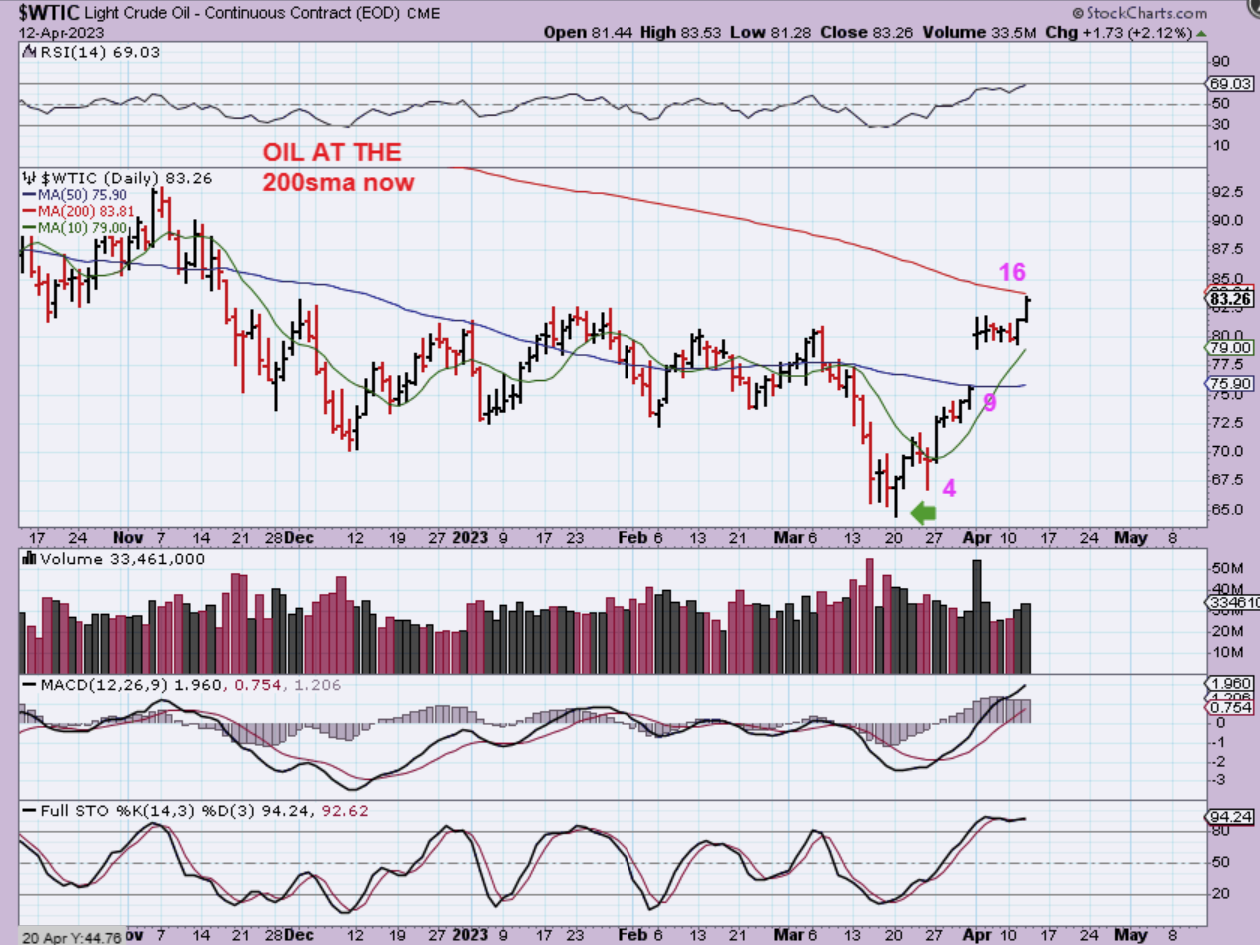
WTIC – So Oil did push higher, but it is right at the 200sma now. It is possible that it will break out after the recent consolidation, but we also have to expect that this might ‘stall and crawl’ at the 200sma (we’ll see).
.
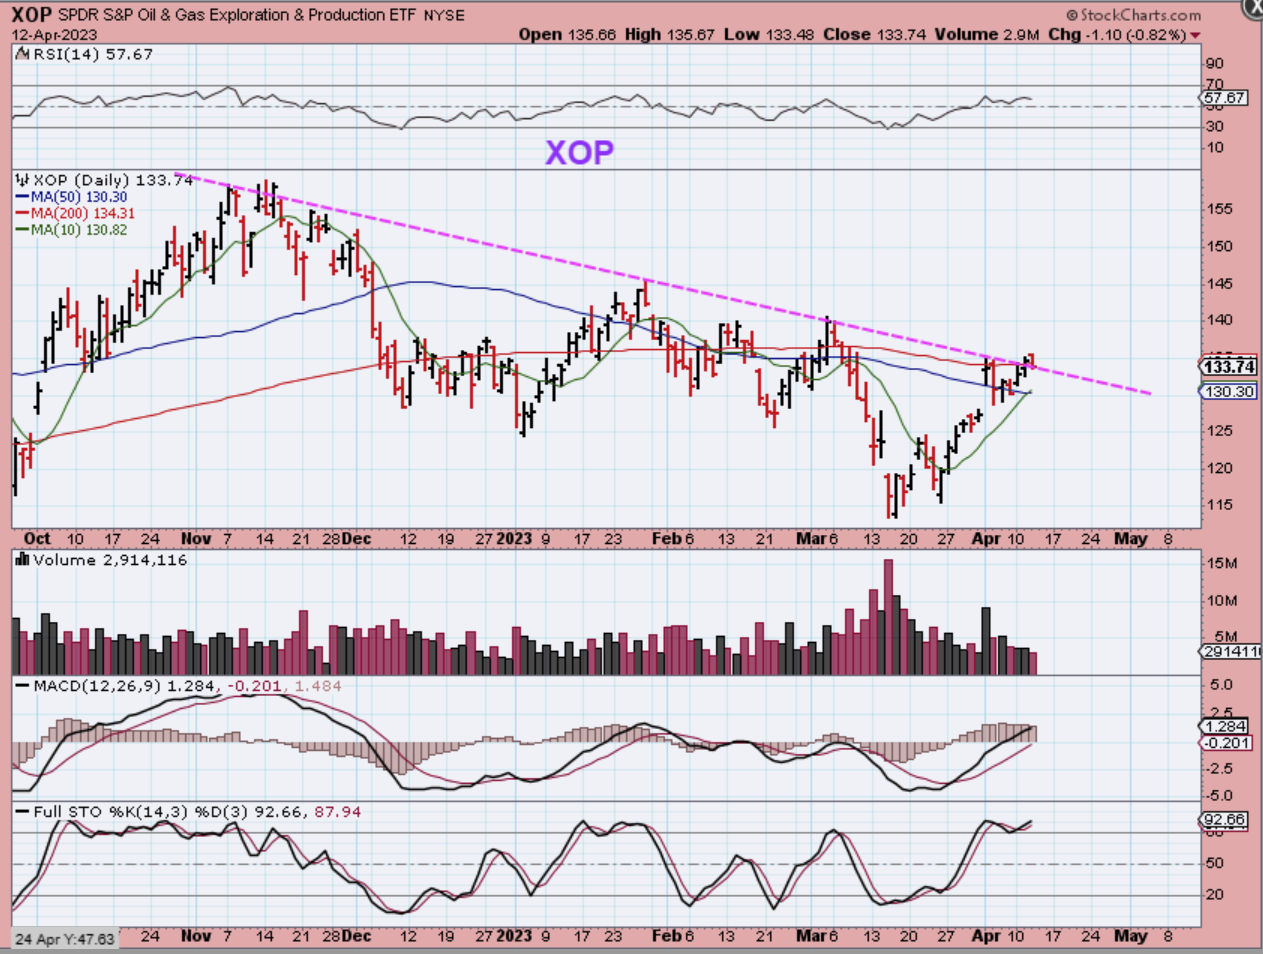
THE XOP Popped and dropped and is chopping along the 200sma & the 50sma support area. The XOP and oil stocks remains bullish and I mentioned it and Oil stocks as a buy at the higher low reversal.
.
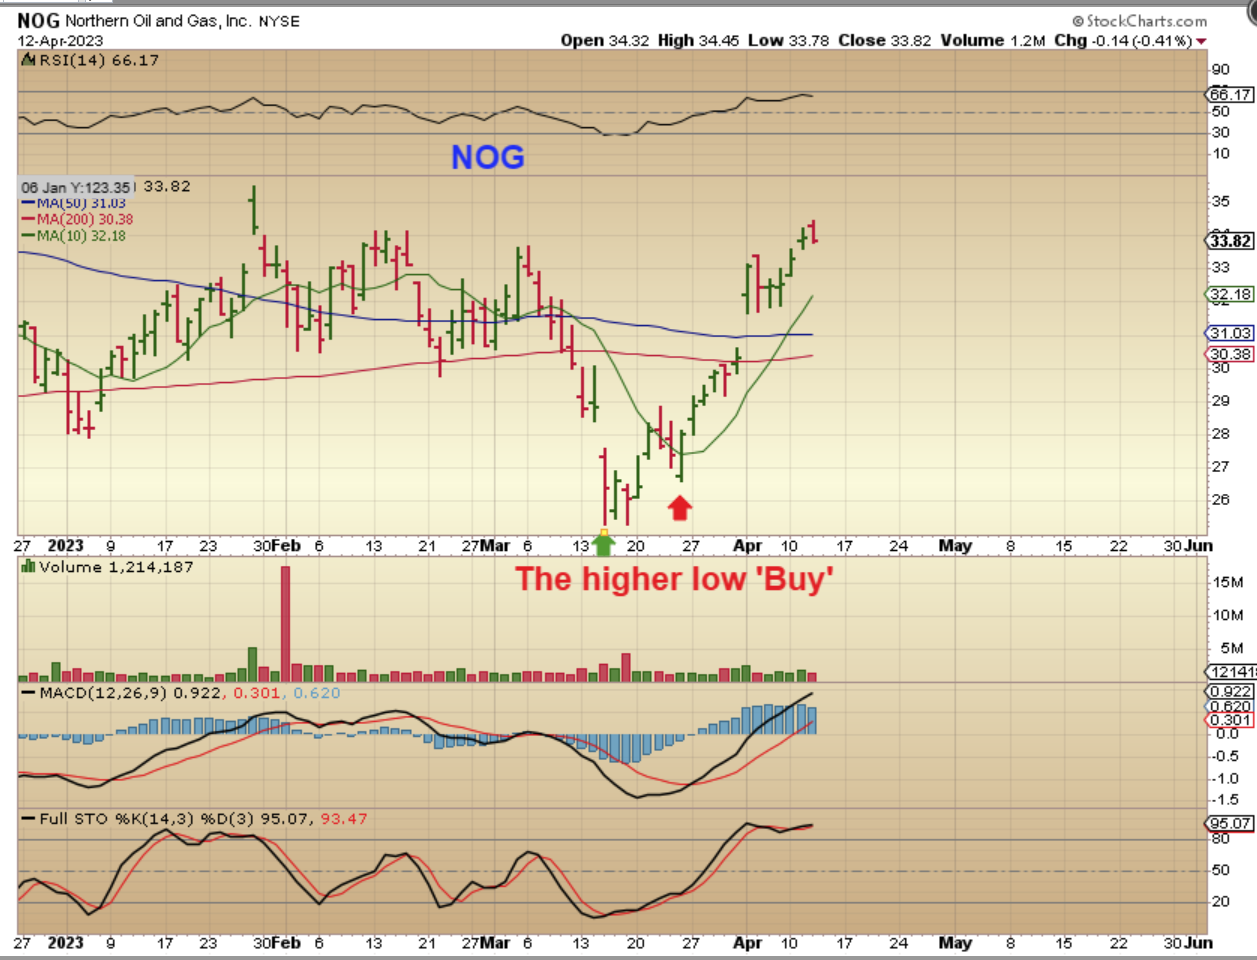
NOG- Some of the Oil stocks took off quickly higher, like NOG. Others like ERF, WTI, CPE are at the 50sma, and they can be bought like the silver stocks at the 50sma. Let’s take a look at a lagger…
.
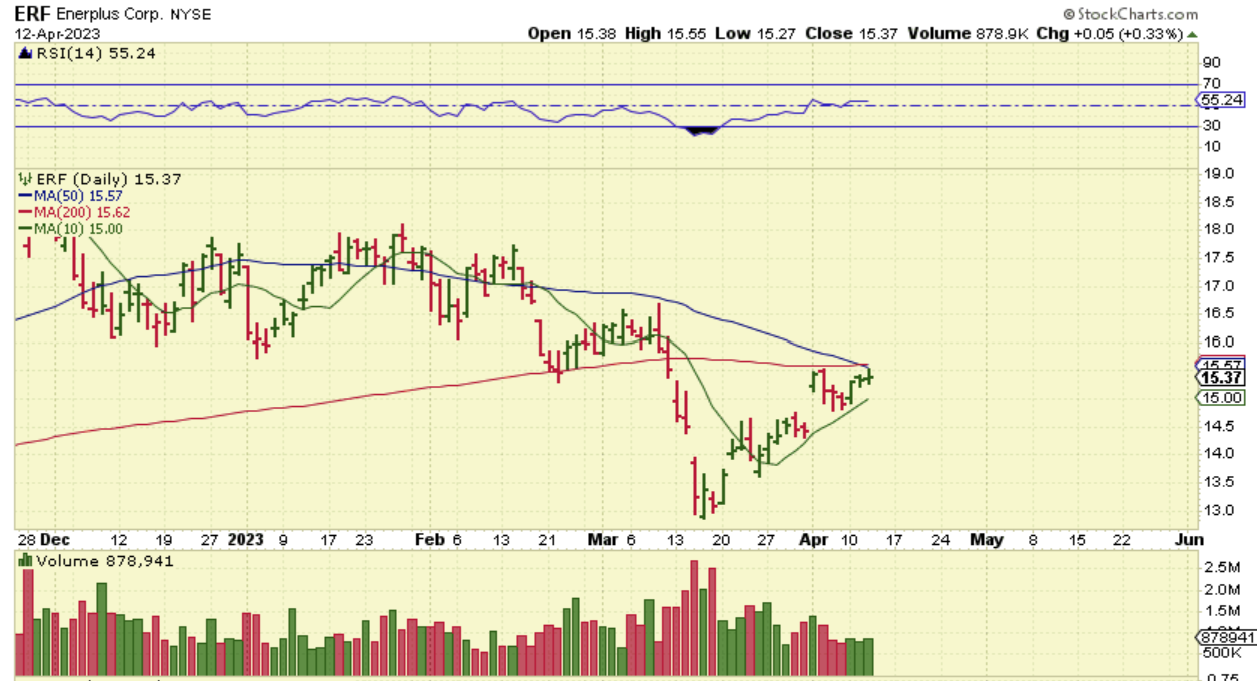
Let’s take a look at an Oil lagger:
.
You will see that some Oil Stocks are still under resistance, so this can be bought here or as it breaks out.
.
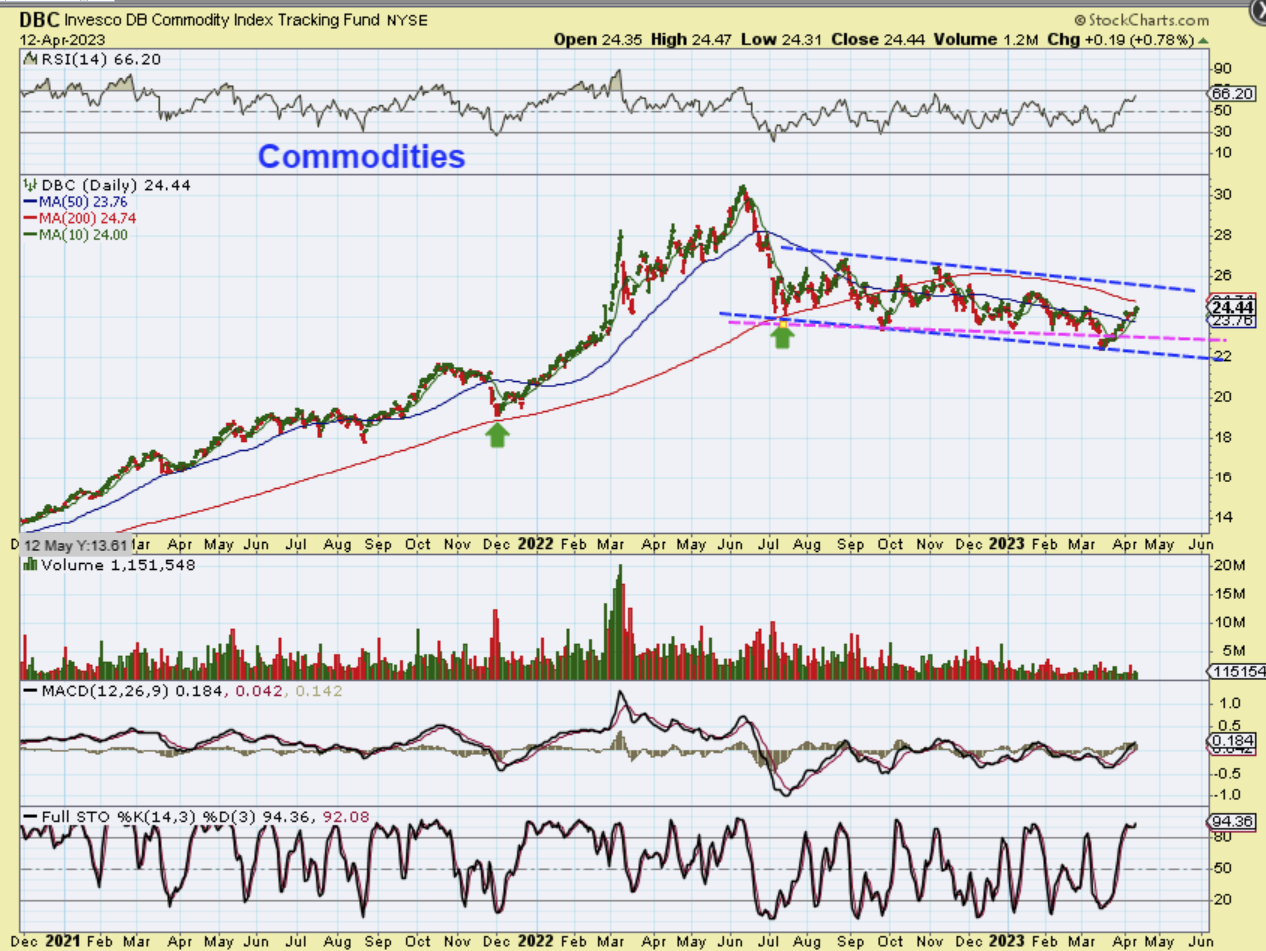
DBC (Commodities) – This chart resembles Oil out of the recent low, because it has OIL ( BRENT AND WTIC) , GOLD,SUGER, CORN, etc. This was a buy at the 50sma and now the 200sma like Oil.
.
.
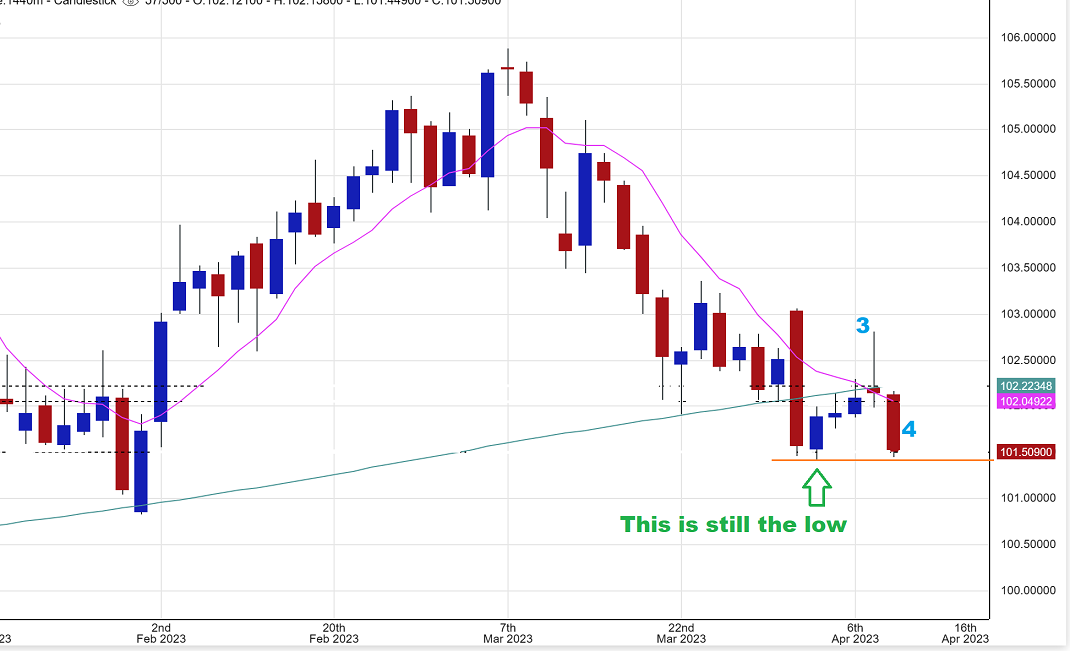
This was amazing to see. The USD slammed down and came within a fraction of breaking the lows. So far this has a day 3 peak and this was day 4, but a break of those lows is a dcl failure. The USD will begin to just continue to drop lower if those dcl lows break down.
 .
.
The USD really looks weak here, but it can still bounce. What the Dollar does from here will likely affect Gold & Silver.
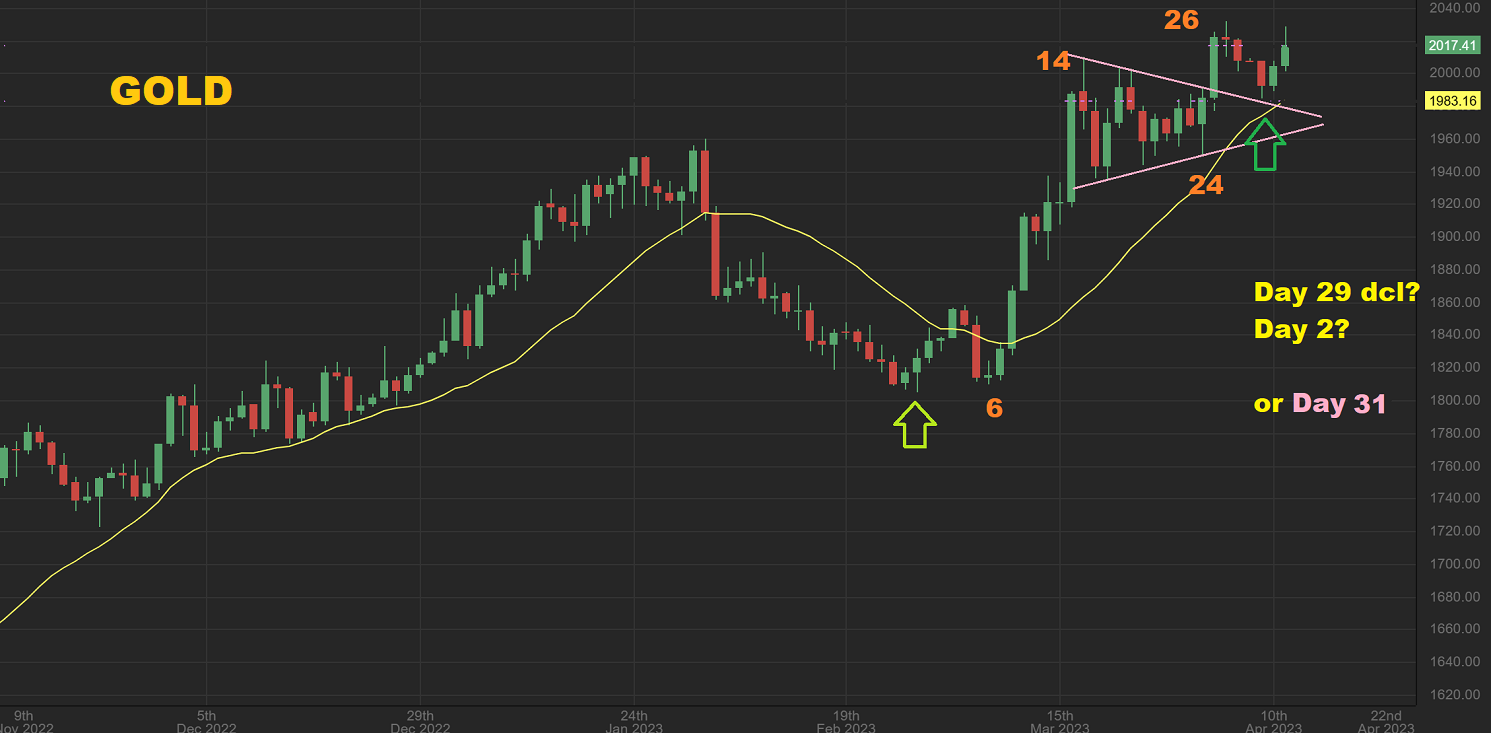
GOLD popped as the USD dropped. What we have here in technical analysis is actually a picture-perfect break out of a triangle and a back test. This may be a very shallow DCL too. That back test was on day 29, so was that a very mild dcl again? I still think that this all depends on the USD Thursday and Friday.
.
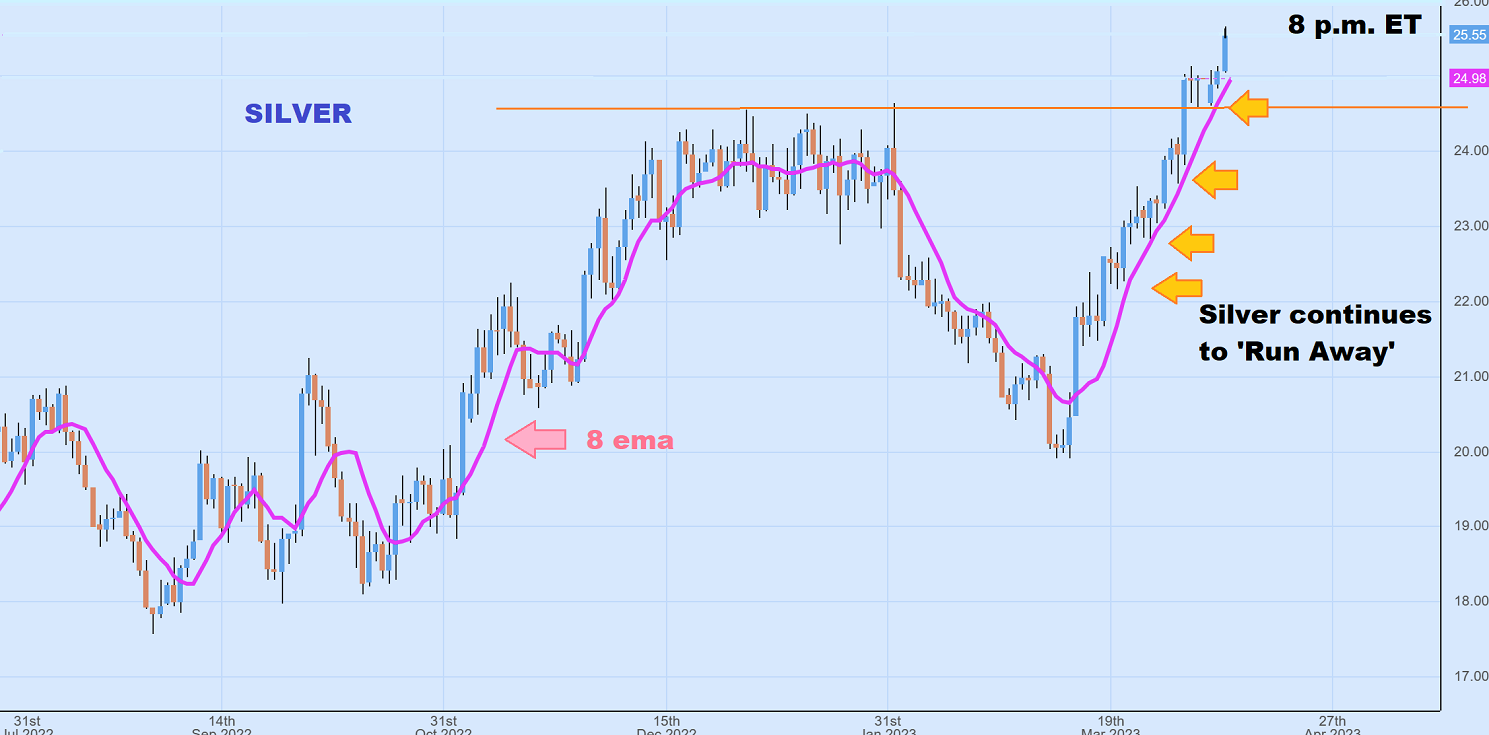
The story is the same with SILVER.
This is at 8 p.m. as I write and this is just looking like a very strong bull run. I warned that when Silver gets going, it often leaves people behind in the form of ‘a runaway move’. Currently Silver does not break the 8 ema, so it is very strong. Silver could do a back test for a dcl, if the USD bounces, but for now we’ll just have to see what the USD does this week.
.
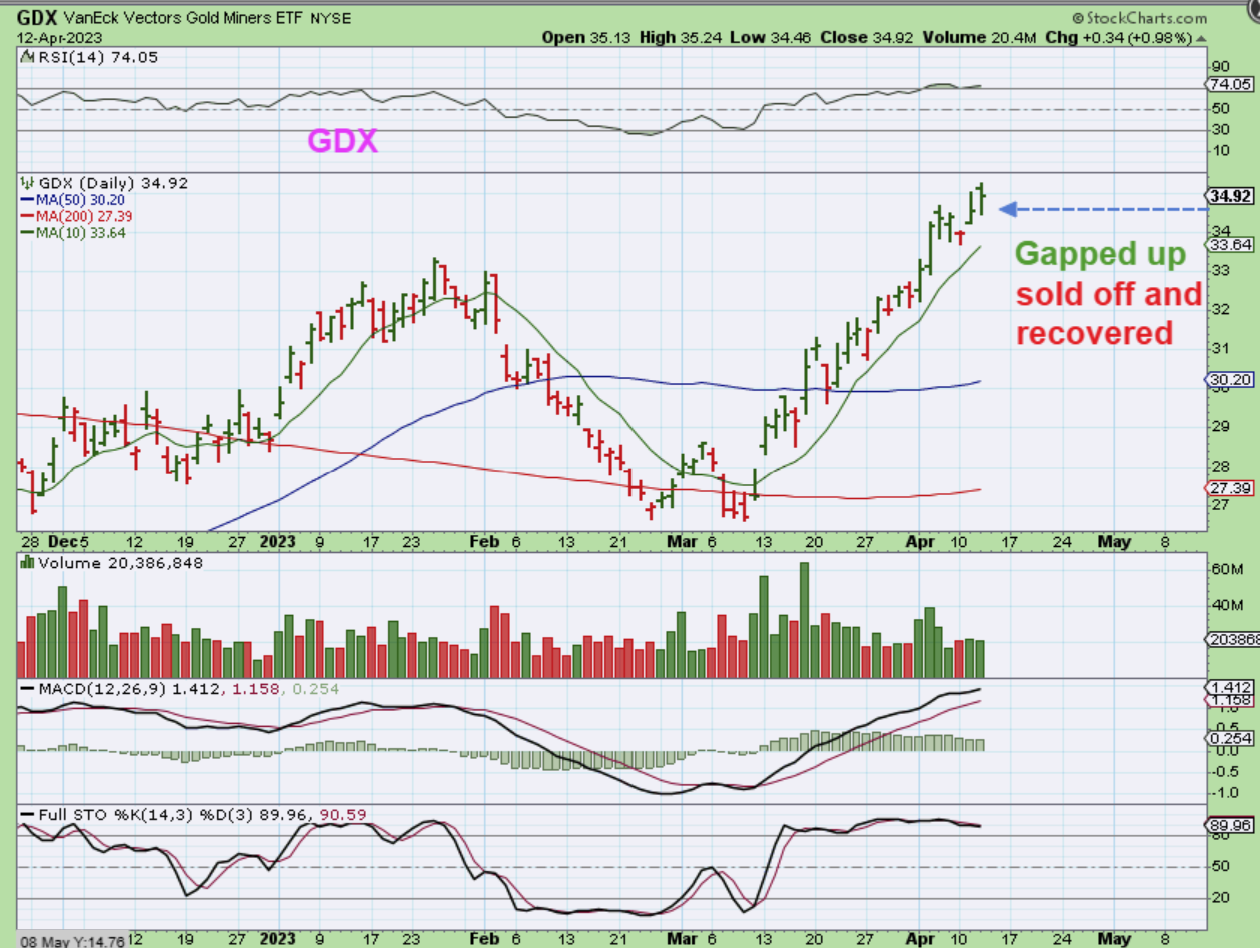
GDX is also in a runaway move. This was a buy at the 50sma when Gold was already back at the highs forming a triangle. Silver and Silver stocks were a buy at the 50sma too, and so far they are running away and playing catch up as expected.
.
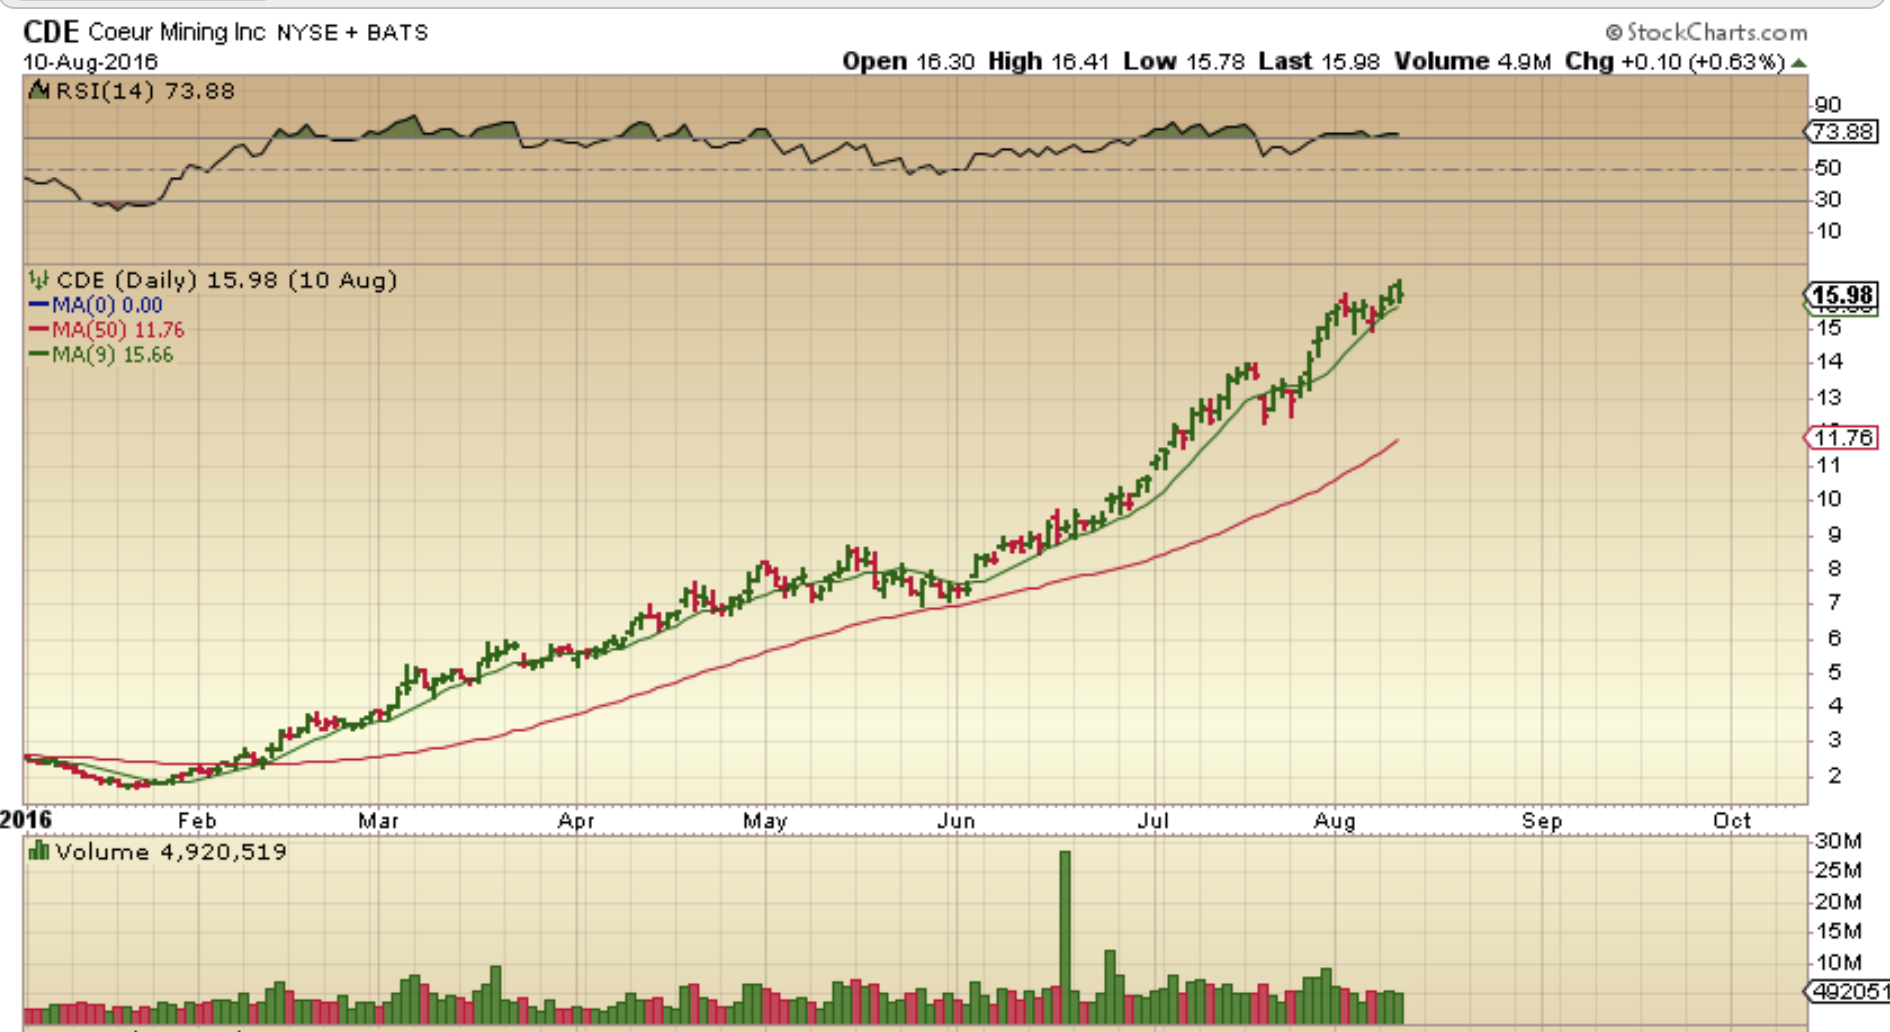
CDE 2012 – In a recent report I pointed out how CDE and a few other miners ran back in 2012. I wanted to point this out because other than a small sideways dip in May, you really hardly see a large dip (or dcl) for 8 months. CDE ran up the 9 sma like a champion. I was trying to point out that “If you bought the silver stocks at the 50sma a couple of weeks ago as instructed, the buy and hold may be much more helpful than jumping in and out”.
.
So all eyes are on the USD. It is very close to failing, and if that happens we should see more upside over time for the Markets and Precious Metals. So far we are seeing a runaway move in many miners since they crawled and broke above their 50sma and that can continue.
.
Enjoy your Thursday Markets!
.
~ALEX
.
THE USD actually broke below the lows overnight. This can chop around and bounce, but I have to view this as a failed daily cycle, since price closed above the 10sma and the downtrend (a channel in this case) to confirm that a dcl formed around day 34. This means that Gold is likely on day 2 and formed a dcl on the back test of that triangle.
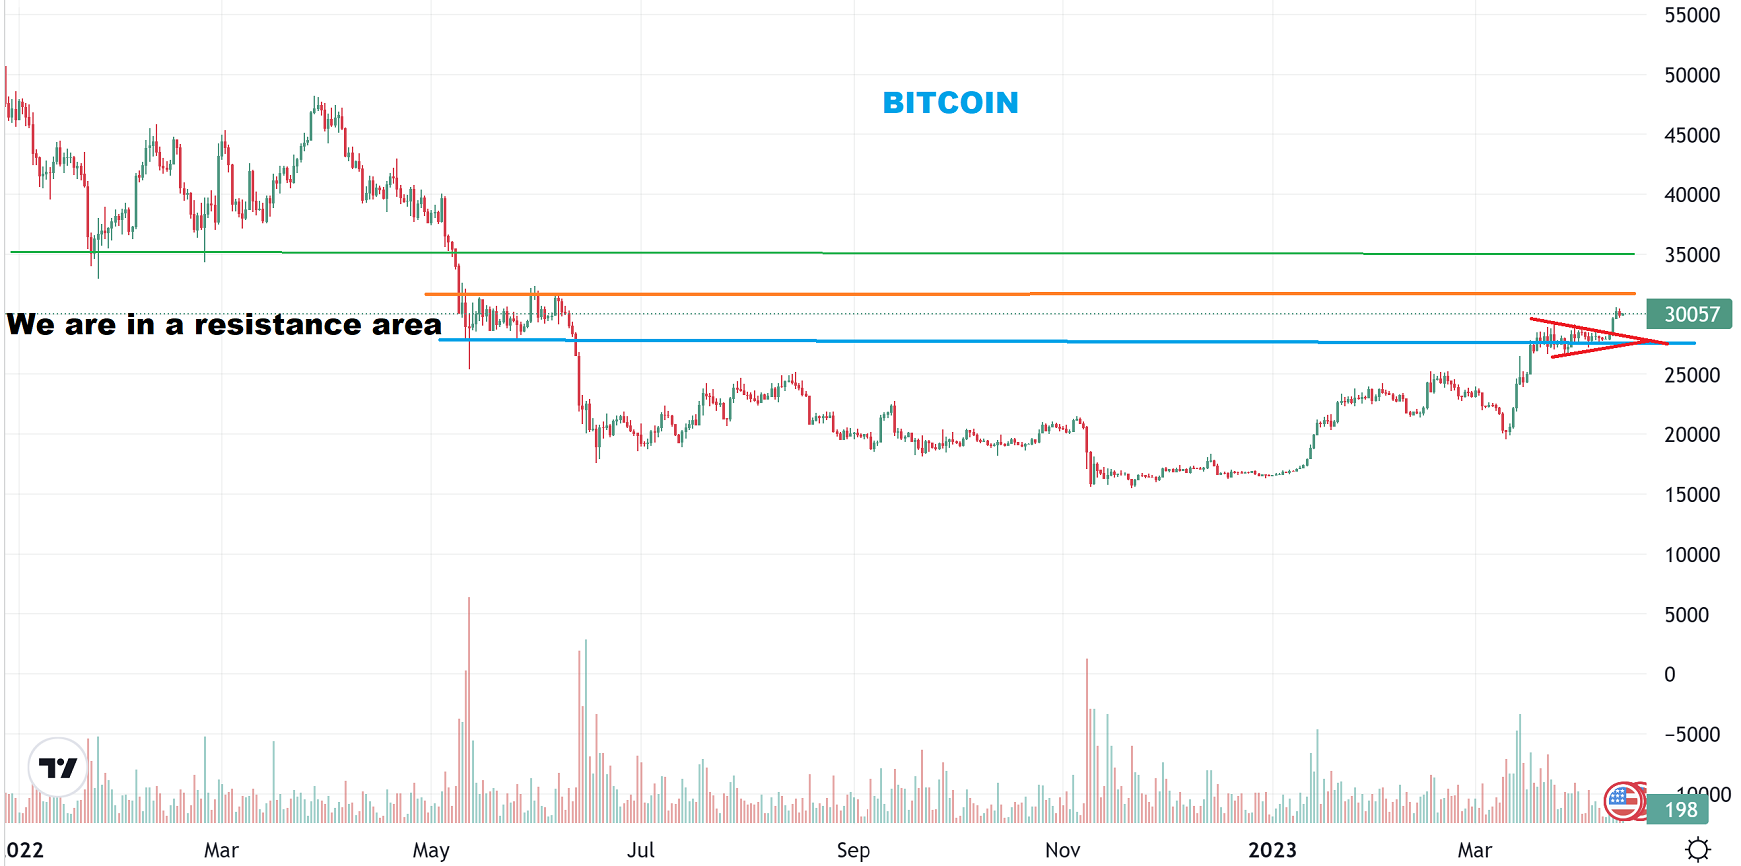
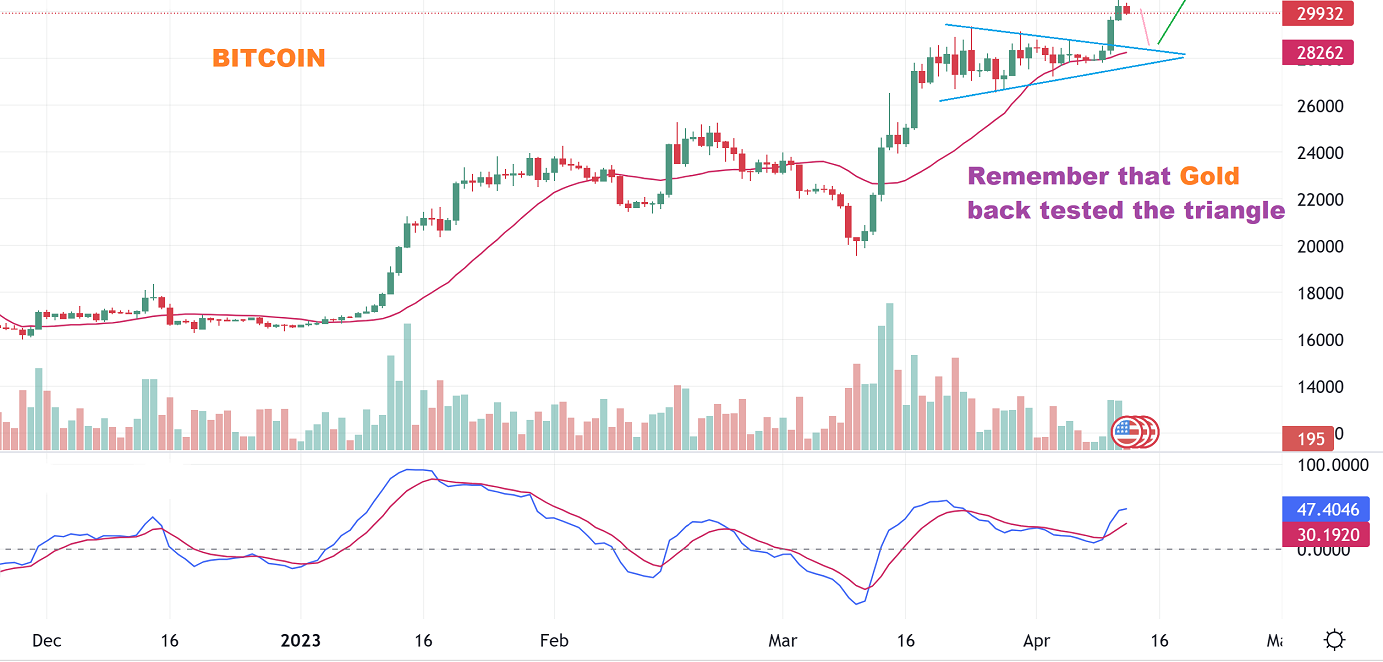
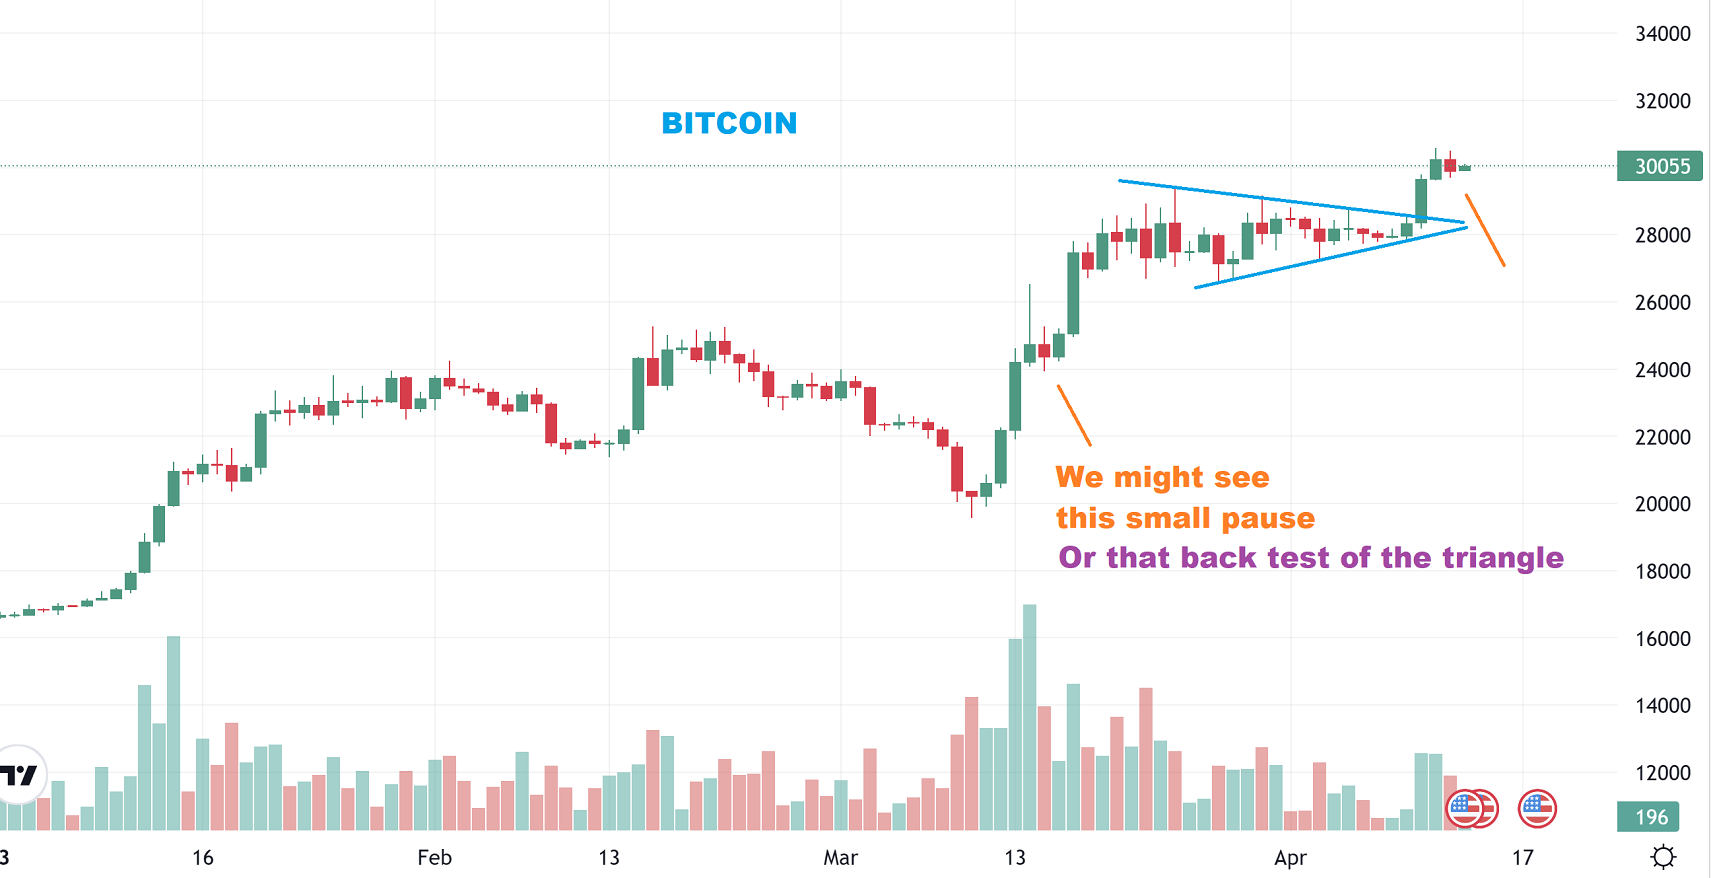
YESTERDAY I MENTIONED THAT WE COULD POSSIBLY SEE BITCOIN PAUSE AND EVEN BACK TEST THE TRIANGLE. I WROTE:
.
BITCOIN broke out of the triangle that I have been pointing out and the Crypto Miners have put in some fast solid gains. It is possible that Bitcoin just keeps running, but if it dips back down like Gold did, a nice buying opportunity would develop in MARA, RIOT, HUT, etc again.
.
BITCOIN – If the USD fails, Bitcoin might just pause and then continue to run. Here I am pointing out how Bitcoin ‘paused’ for 3 days sideways with 1 red candle at March 15. We could see that here with a failed dcl in the USD, and…
.
BITCOIN longer term view shows that we are trying to work through a resistance area that leads to roughly $31,700. AFter that I don’t see why Bitcoin can’t just run to that $35,000 area (possible next resistance).