Friday April 28th
This Thursday Financial data was released at 8:30 a.m. ET. The futures started to rise a little after the release…

.
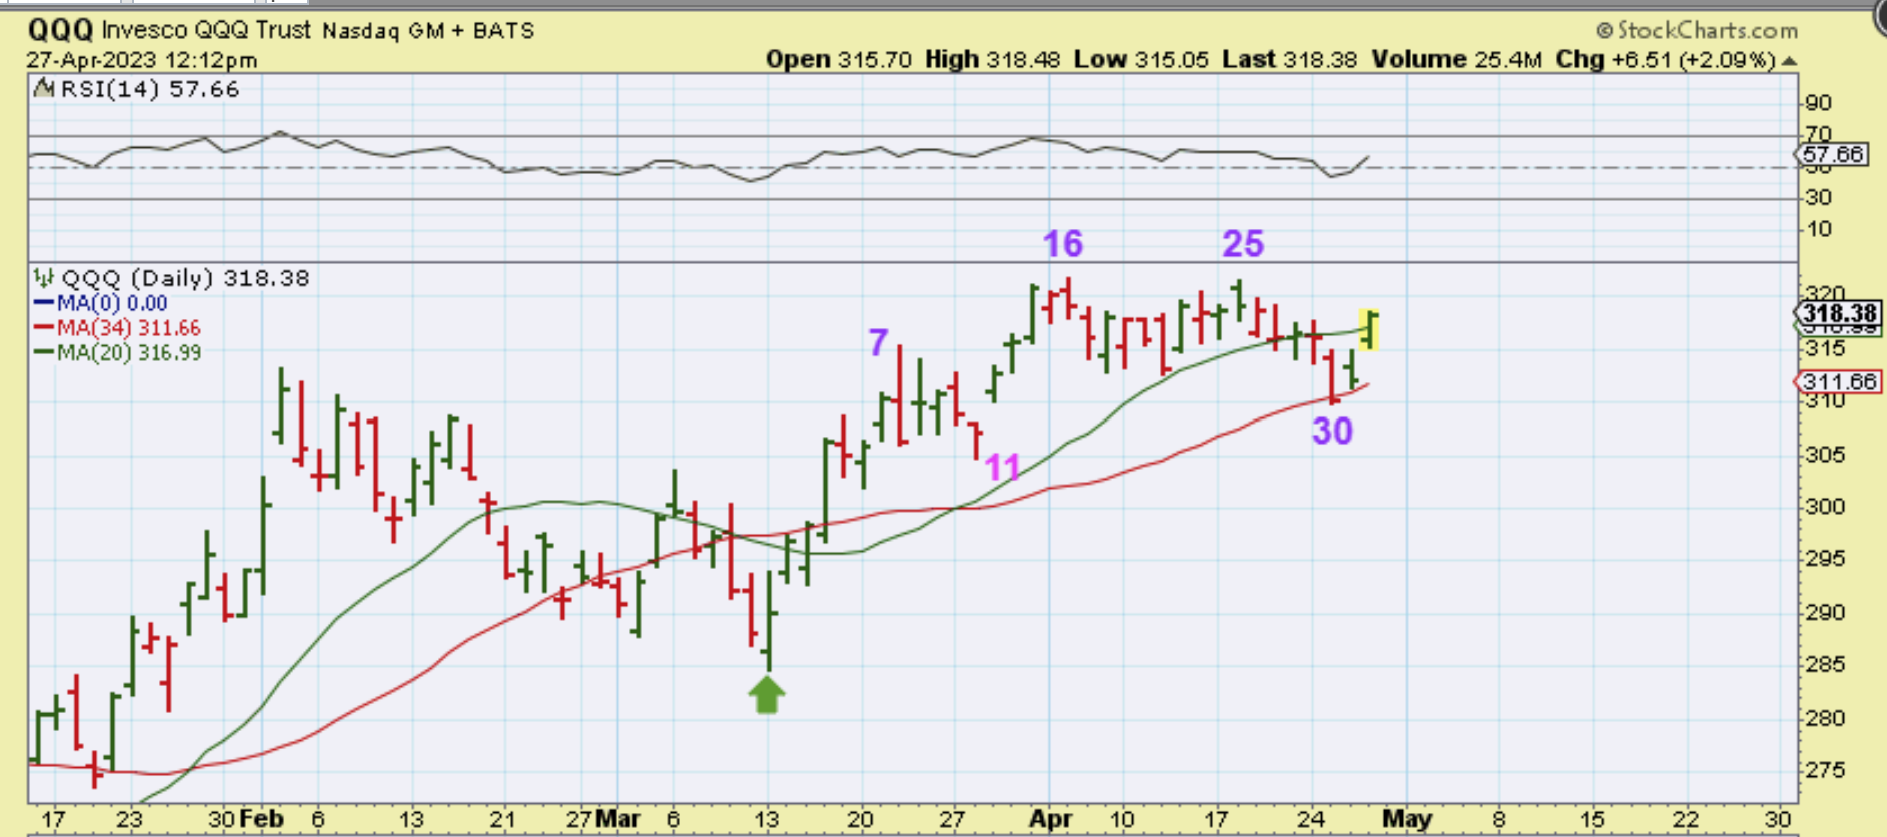
QQQ MIDDAY – The markets gapped up higher and by lunch time E.T., the General Markets were pushing higher after gapping open. In fact, the QQQ or NASDAQ is almost at the recent highs again, so…
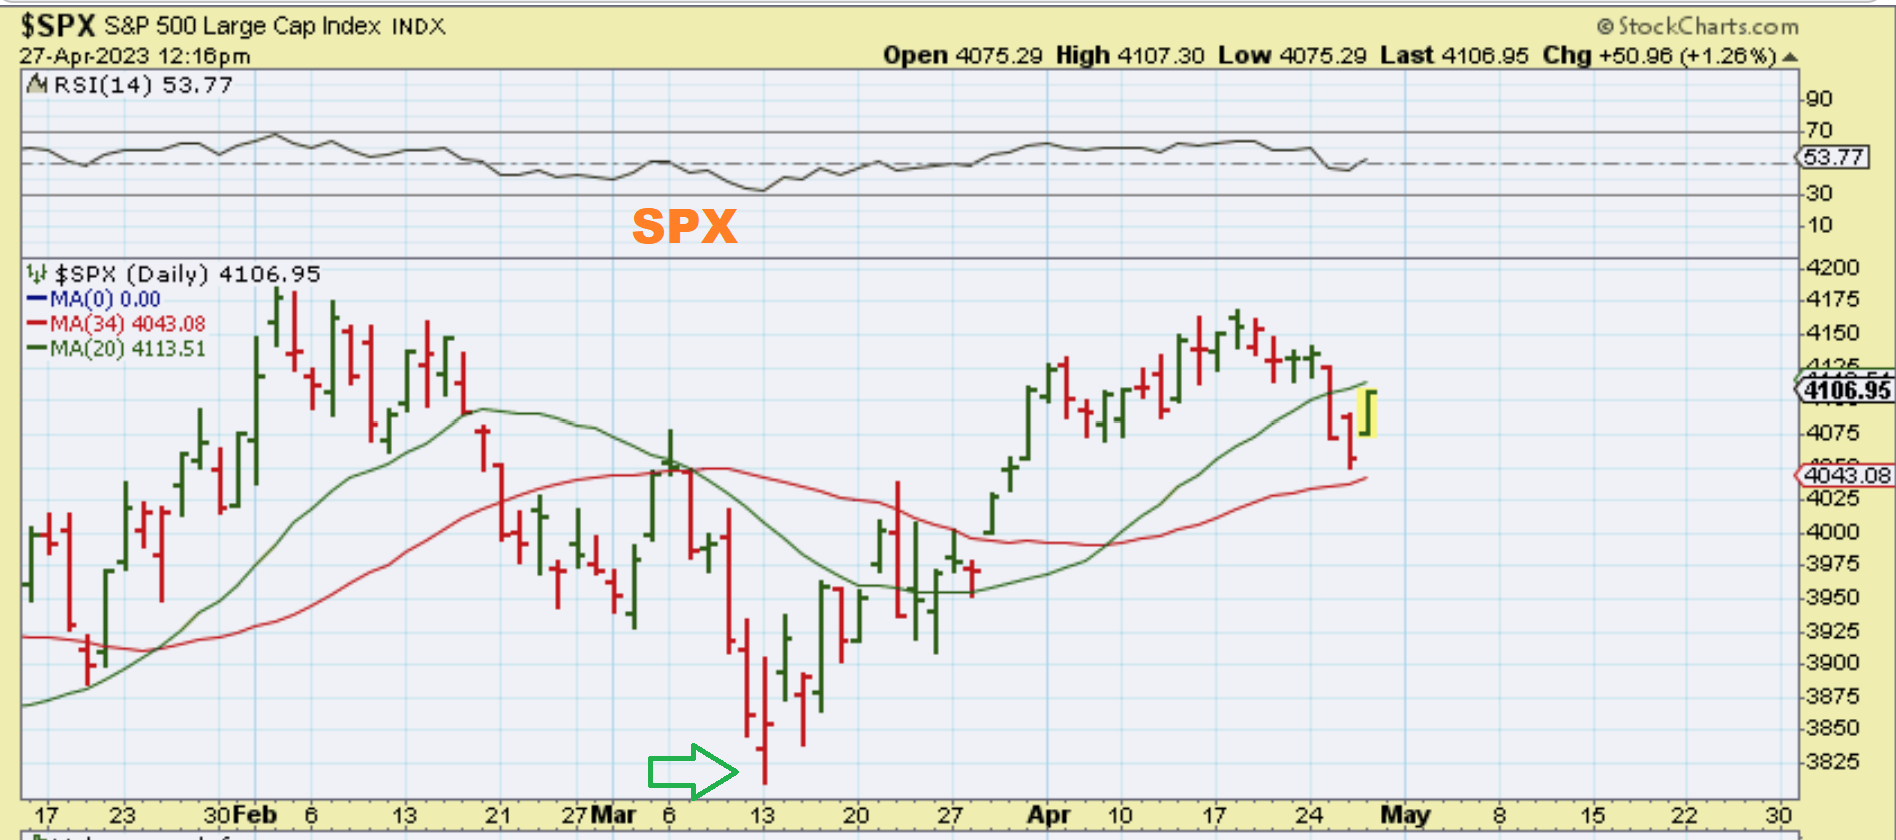
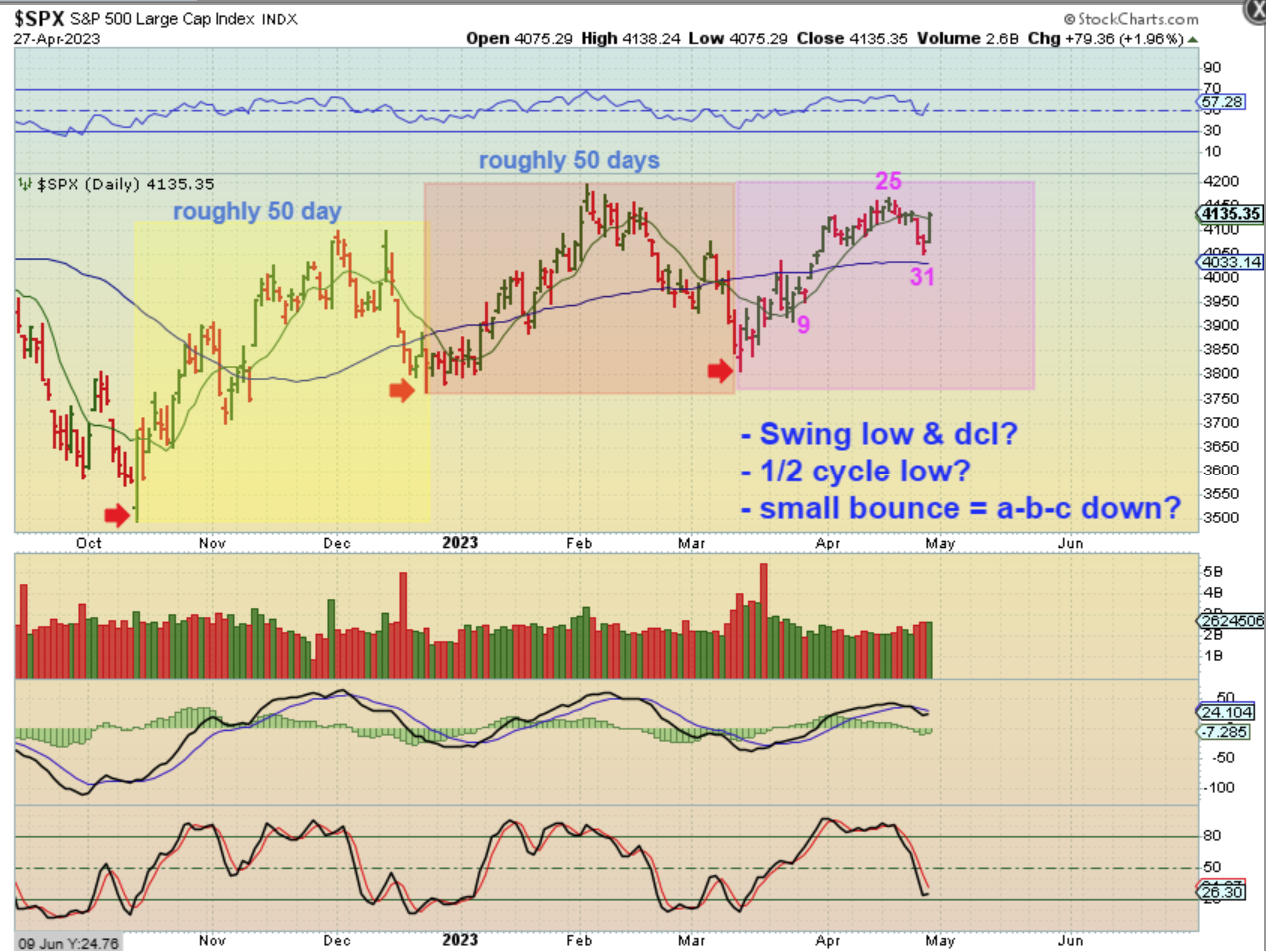
I also wanted to point out The SPX MIDDAY– It was looking like it might be on day 1 after reversing at the 34 sma. Remember, I thought that we MIGHT see a shorter daily cycle after the first 2 were longer ones at 50 days long. This MIGHT be a dcl forming (or a 1/2 cycle low in another 50 day long daily cycle?).
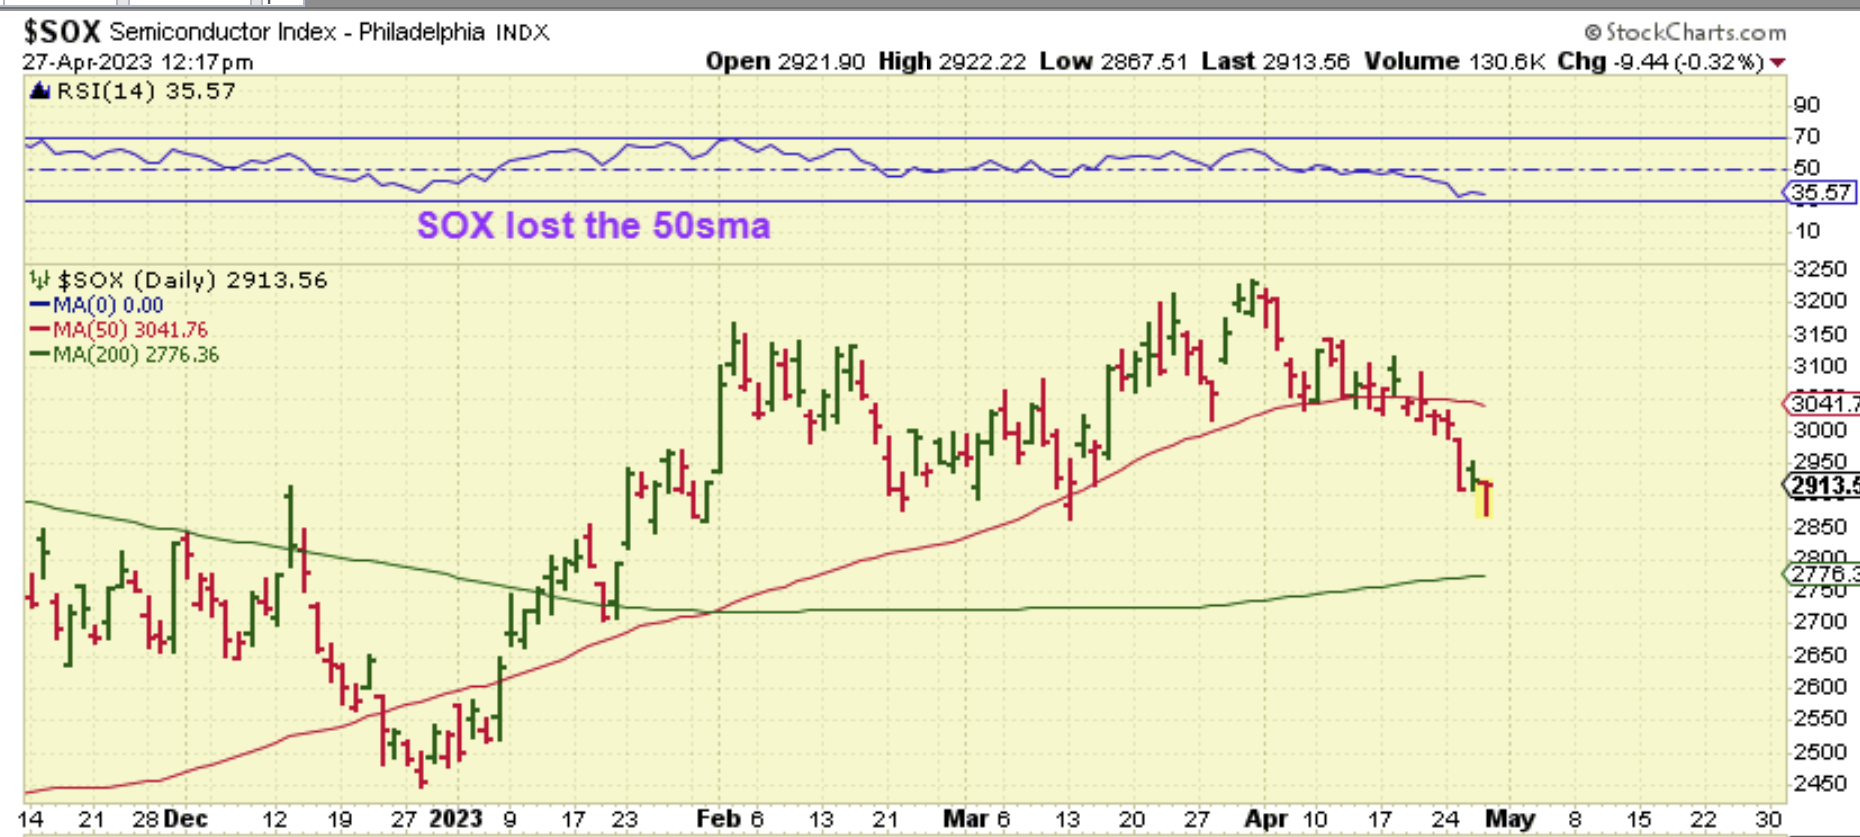
When I looked at The SOX MIDDAY, however, it was a reversal down at the lows and still red. This did follow through to green, but the SOX and IWM have been lagging.
.
So how did the day end? Did we hold on to the gains?
.
SPX AT THE CLOSE – The SPX tacked on 30 more points and closed at the highs. This put the SPX (& NASDAQ) above the 10sma. With a day 31 low, it is possible that we do have a slightly early dcl, since the last 2 daily cycles were 50 days long (normally near 40+).
.
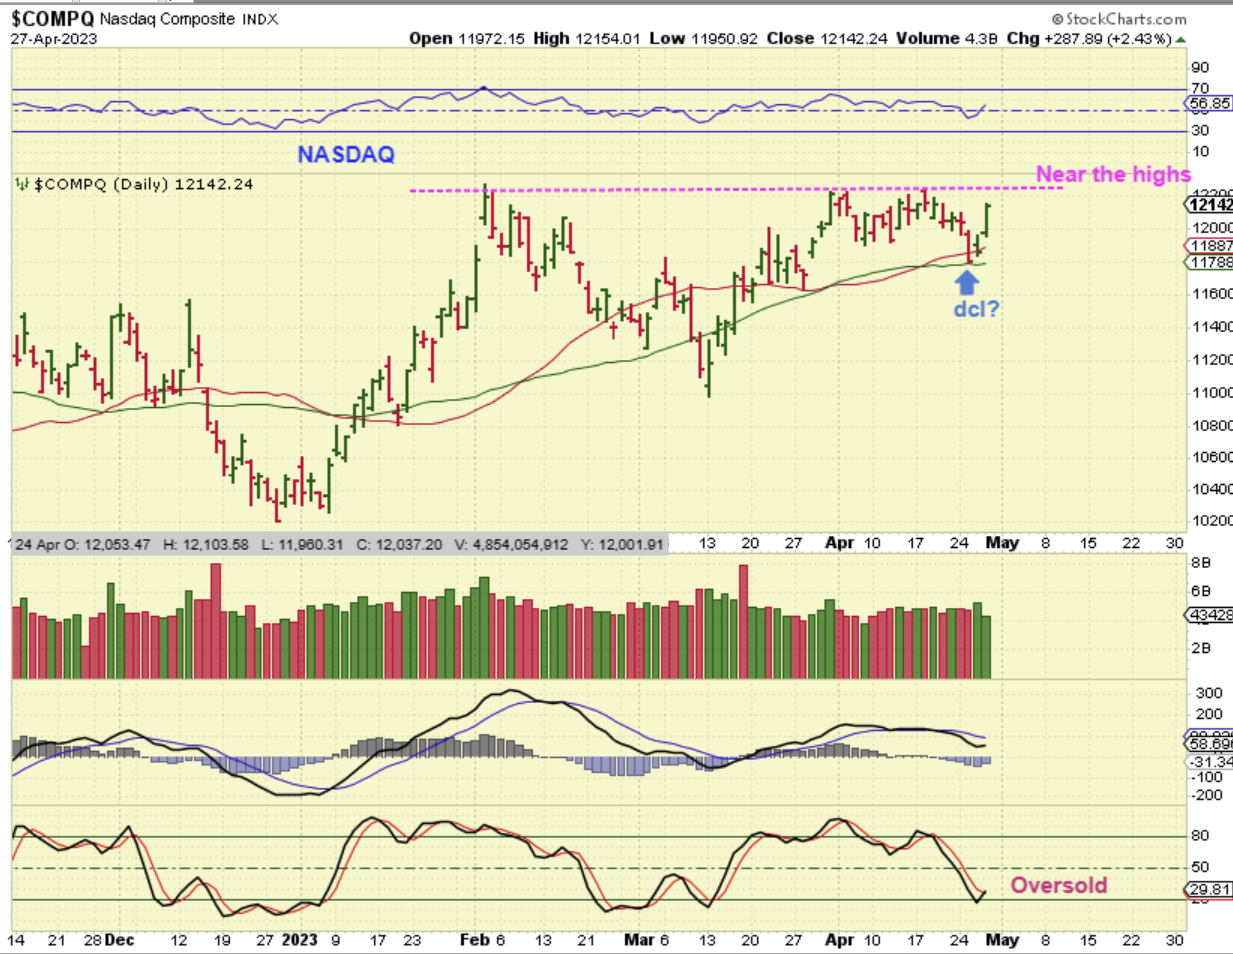
THE NASDAQ closed at the highs of the day and that put it near the recent Feb & March highs. This could easily break out before the Fed mtg next week.
.
The General Markets have been choppy, but they remain bullish heading into the Fed Mtg. If the USD eventually rolls over and sells off lower, the General Markets, Crypto, and Precious Metals should be making us some good money in 2023. A continuation of what we have already seen.
.
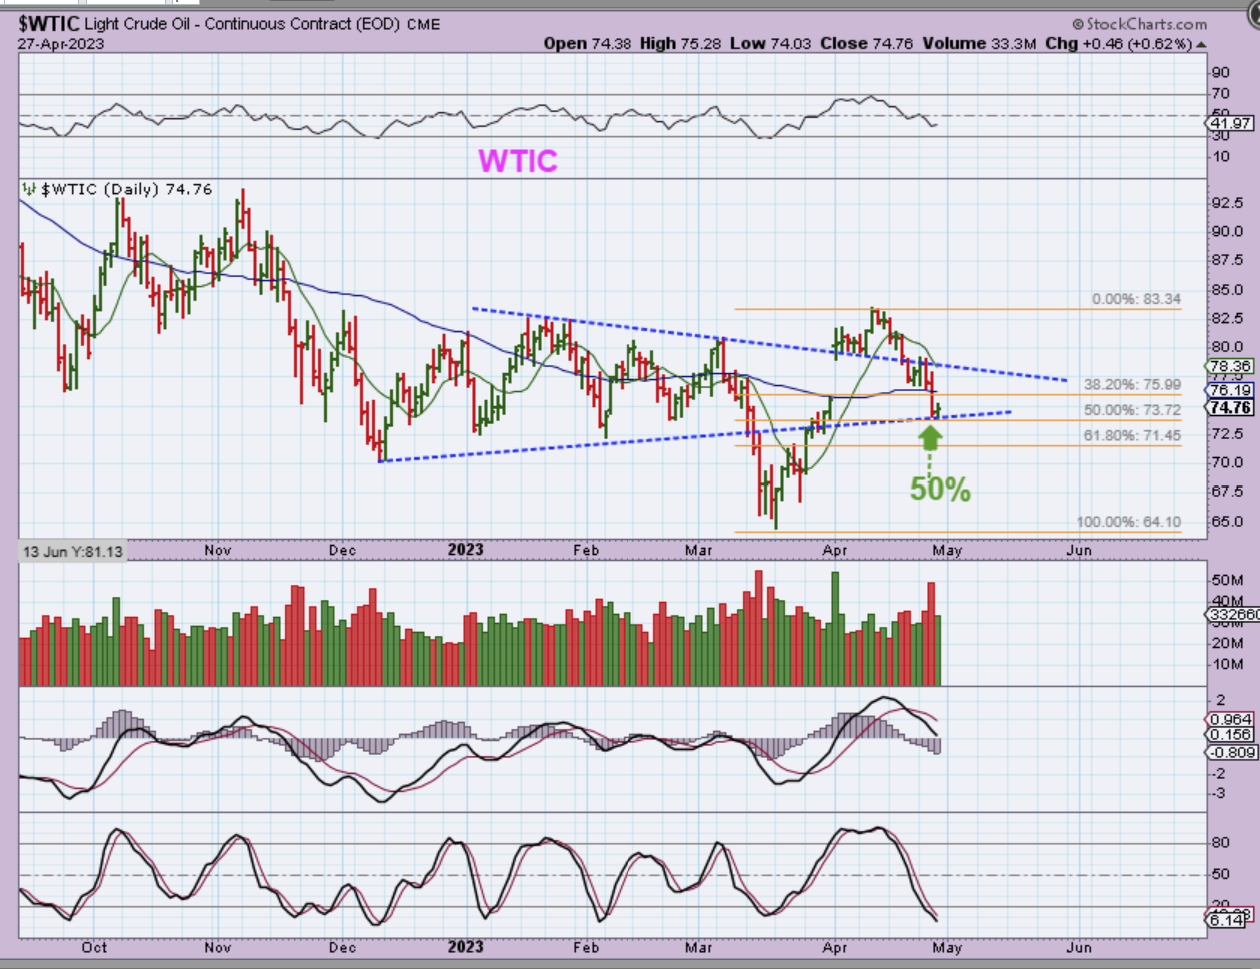
WTIC – Oil reversed at support, now it needs follow though. It dropped to the 50% Fib line, so buying here with a tight stop is an option ( UCO, USO, futures, etc). This may be the 1/2 cycle low.
.
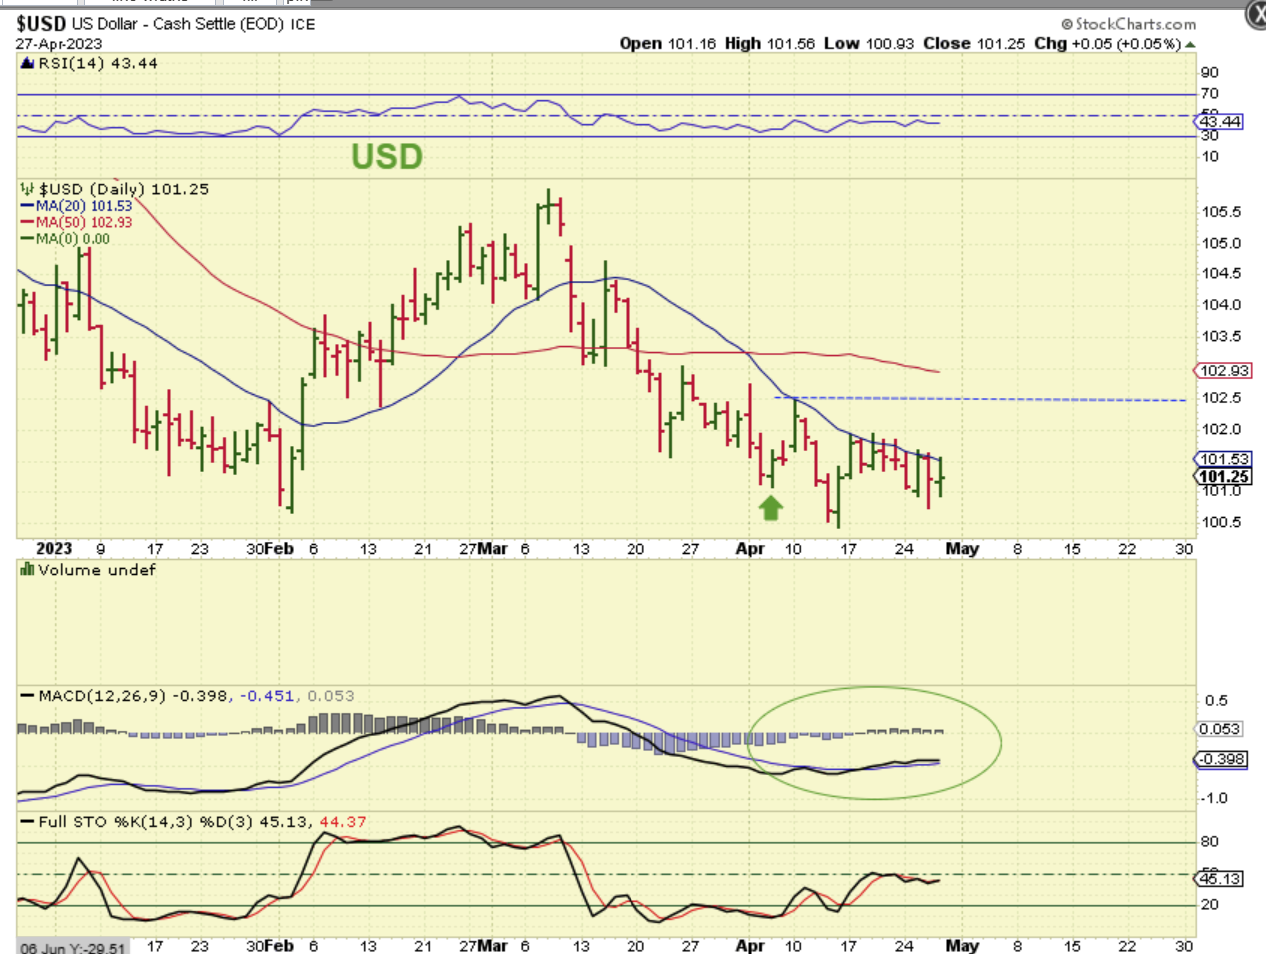
The USD popped and dropped and put in a doji under the 20sma. If the dcl is where the green arrow is, then we shouldn’t see the USD move above the blue line ( that is the day 2 highs of the daily cycle).
.
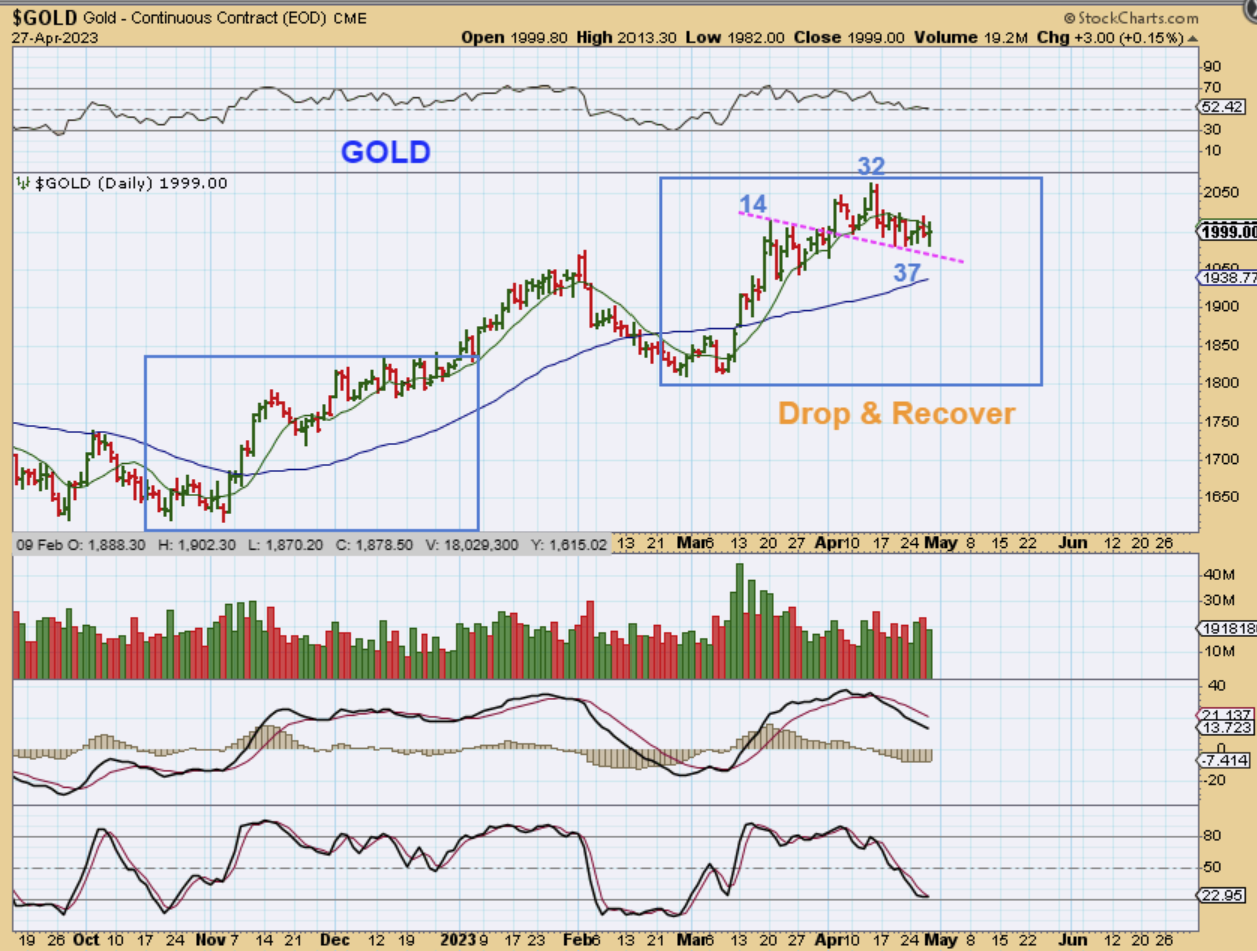
GOLD – More of the same choppiness, but if the USD drops at the Fed mtg (or heading into it) This is ready to take off higher. I think we have a day 37 dcl and Miners do look like a buy with good risk / reward.
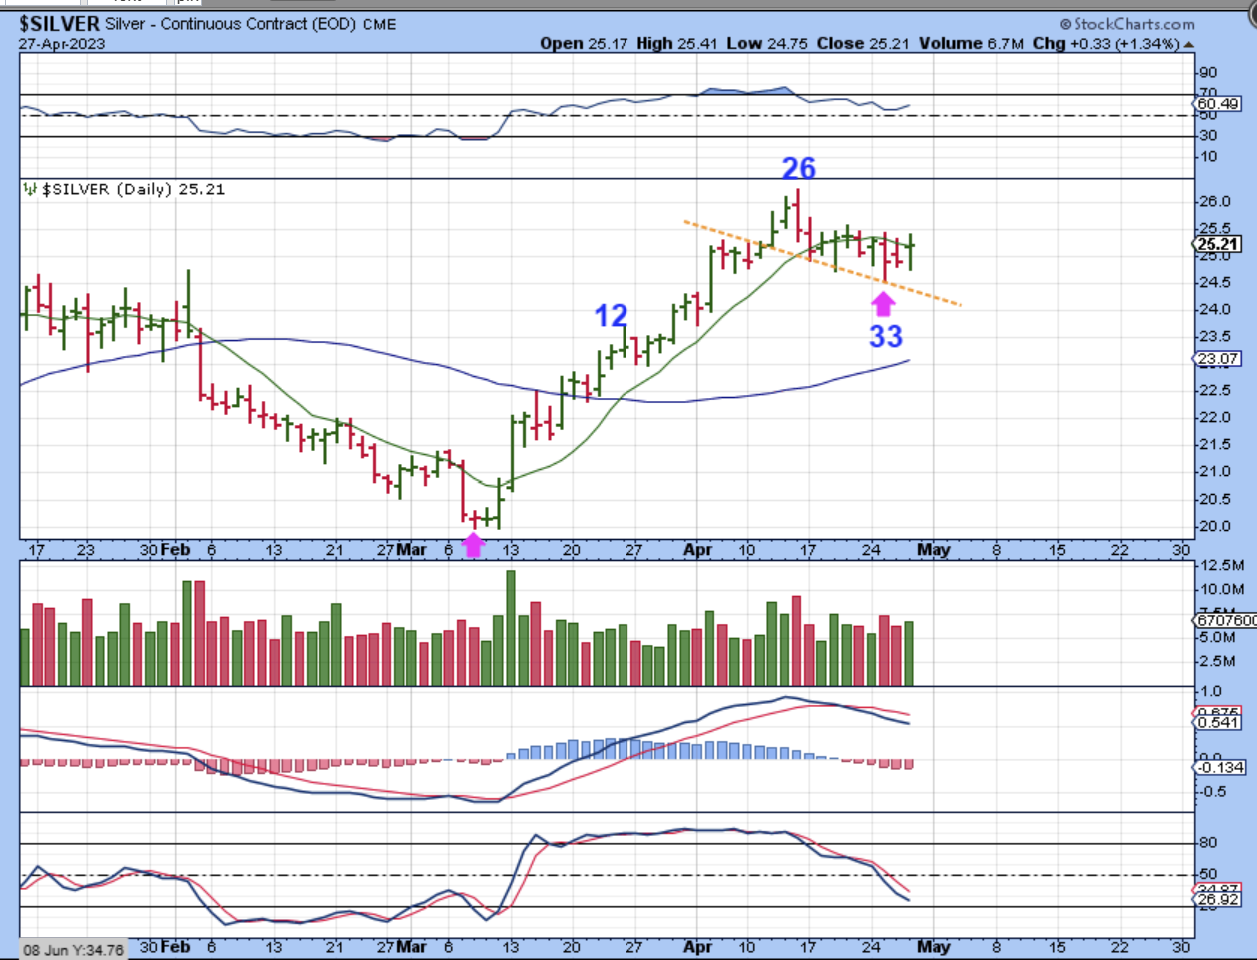
SILVER – Also more of the same chop here, but the daily cycle count is lower since it bottomed later. It too seems to have a dcl , but at day 33 (normal). Silver ALMOST took out the lows on Thursday, but it then rallied back 2 cents above the day 33 lows. So far, so good. 🙂
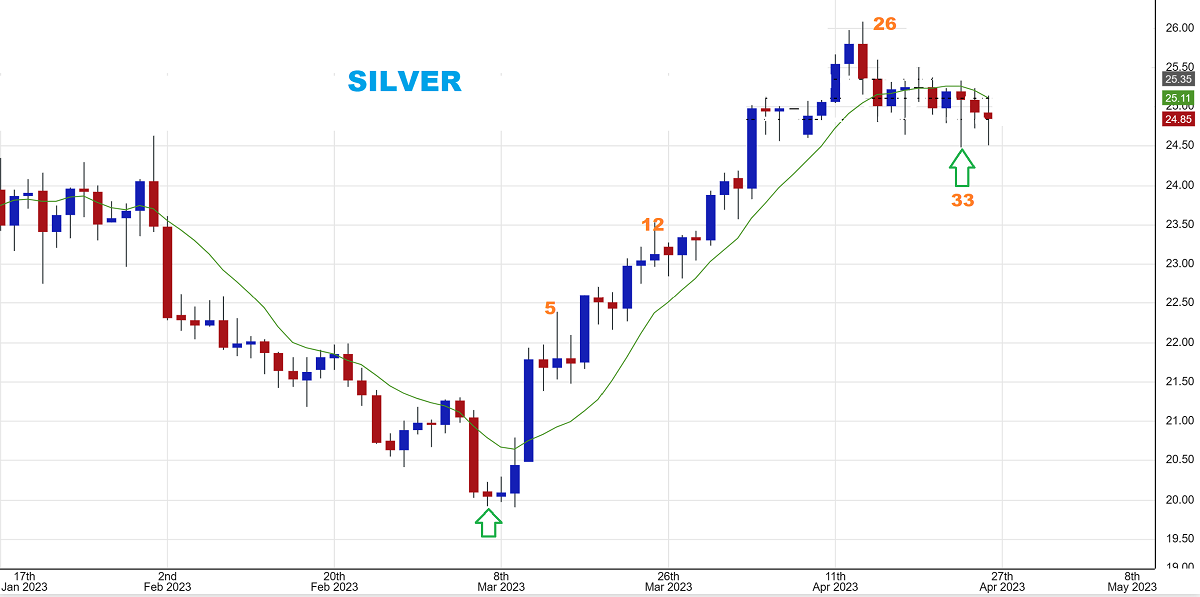
SILVER is almost oversold, did a back test on day 33, and this shows the 10sma right where price closed. I think that we probably do have a dcl forming here, but we need more confirmation. The pull back has been very minimal, very bullish, so I would guess that the Silver stocks would do very well on the next rally.
.
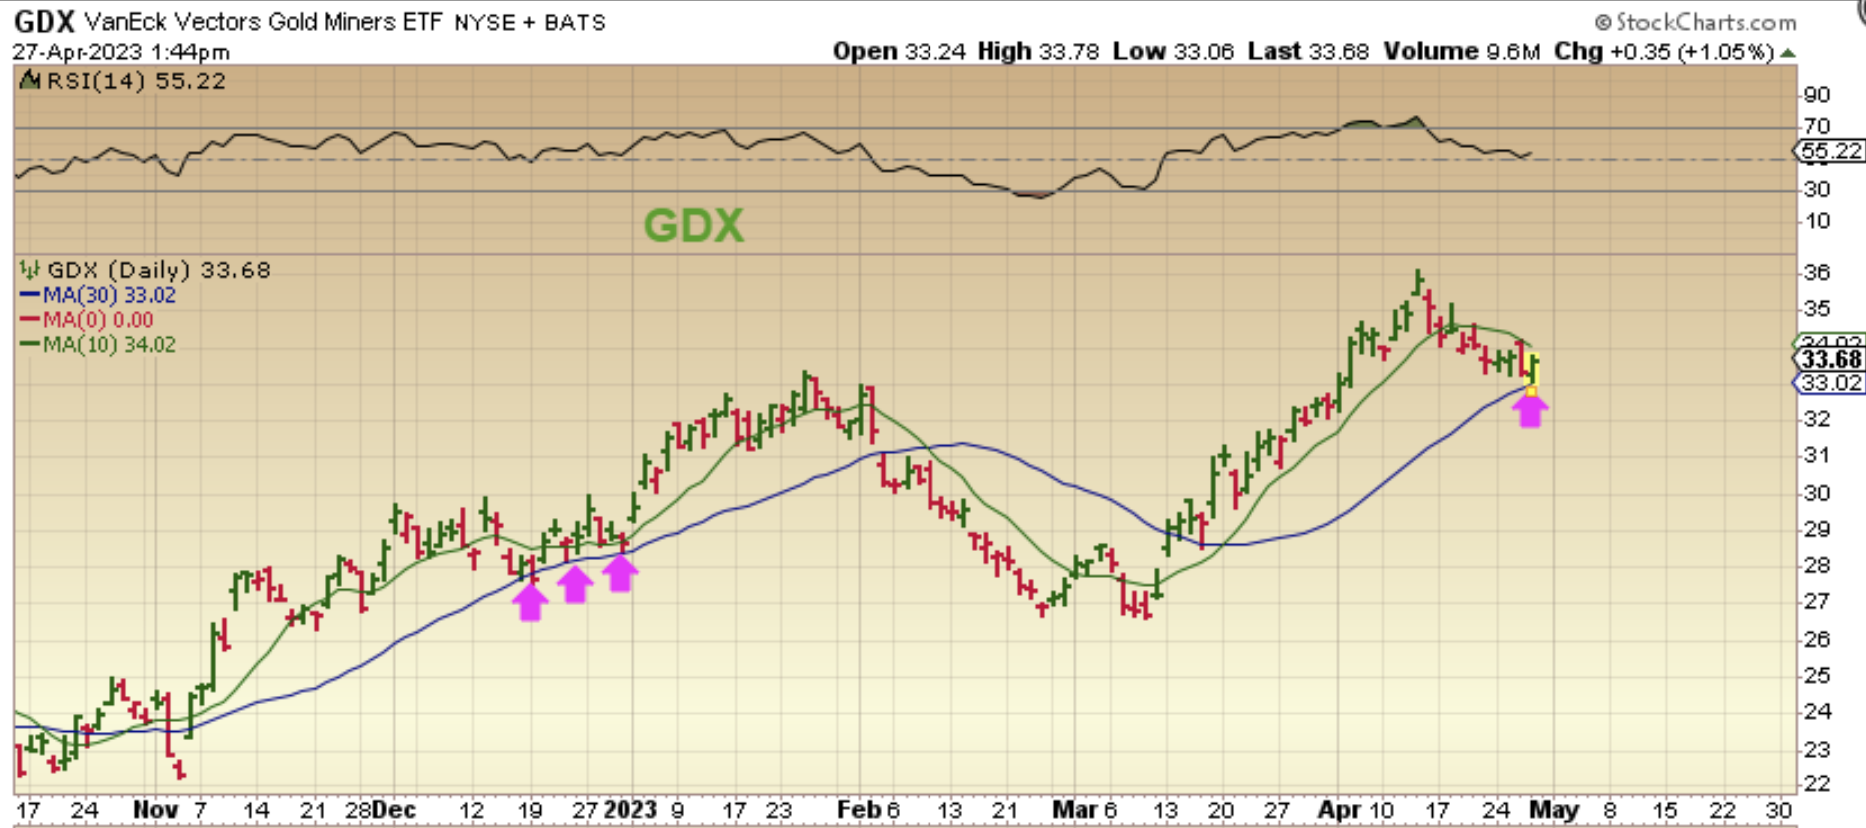
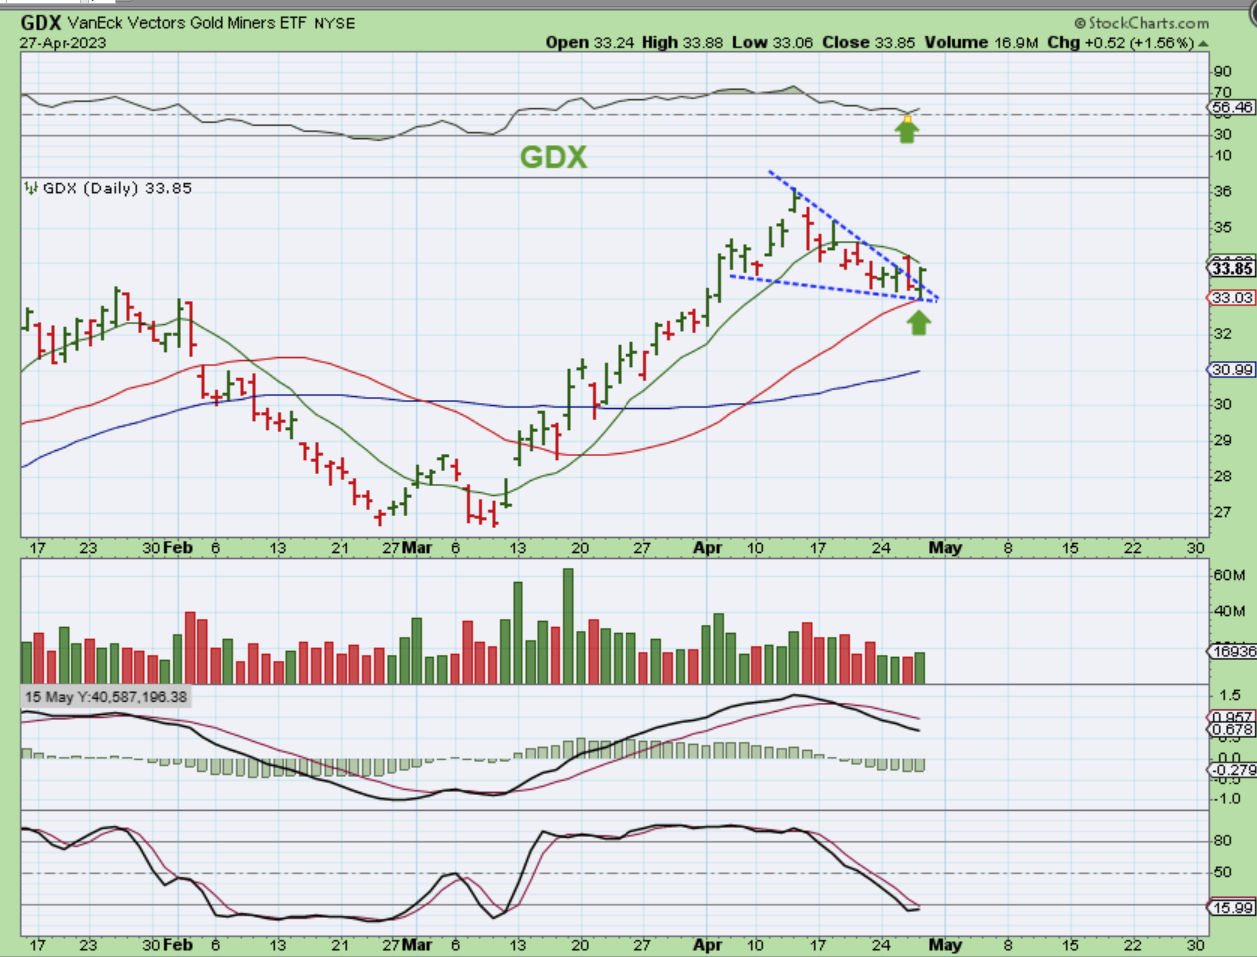
The GDX dipped and flipped higher too. I captured and posted this with some Miners in the live area midday to show the progress. GDX is still making new lows, but look at the dips, as they are being bought up all this week. This isn’t similar to the bloodbath selling in March. GDX was at $33.68 midday and…
.
GDX made a new low and then closed at $33.85, 3 pennies under the highs of the day.
A push above that 10sma helps to confirm that a dcl should be in place and the ‘timing’ is right. GDX is finally oversold and the set up appears to be saying that Miners will rally into or after the Fed Mtg. This looks like a buy and…
.
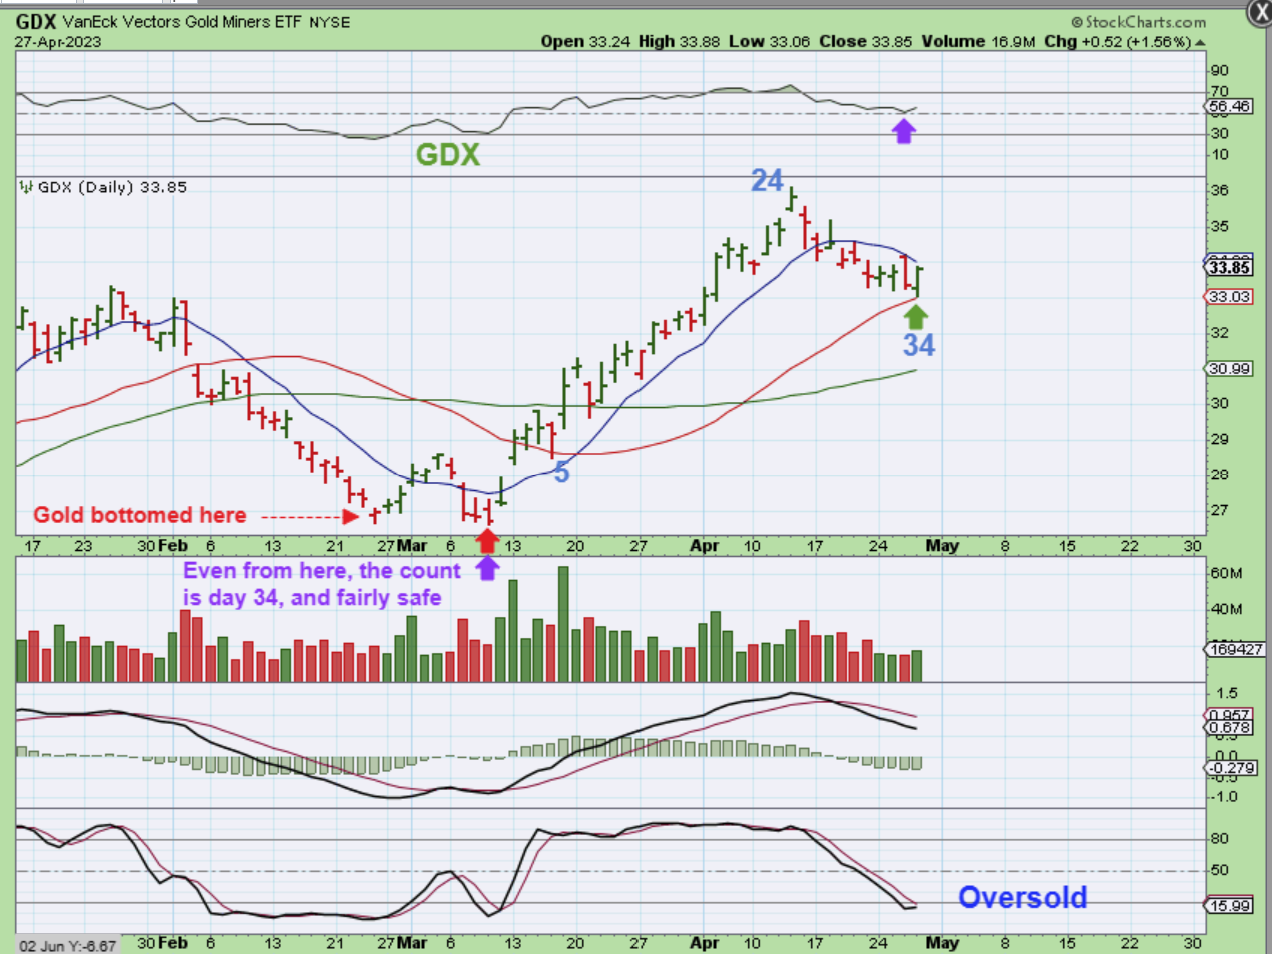
GDX is on day 34 if we count from the second low. This really looks like a mild bullish pullback in a bull market, and many Miners do look like a ‘buy’.
.
HMY just doesn’t want to drop and stay down, so I posted this reversal yesterday in the live area. These S. African Miners are still holding up well, they are a buy.

.
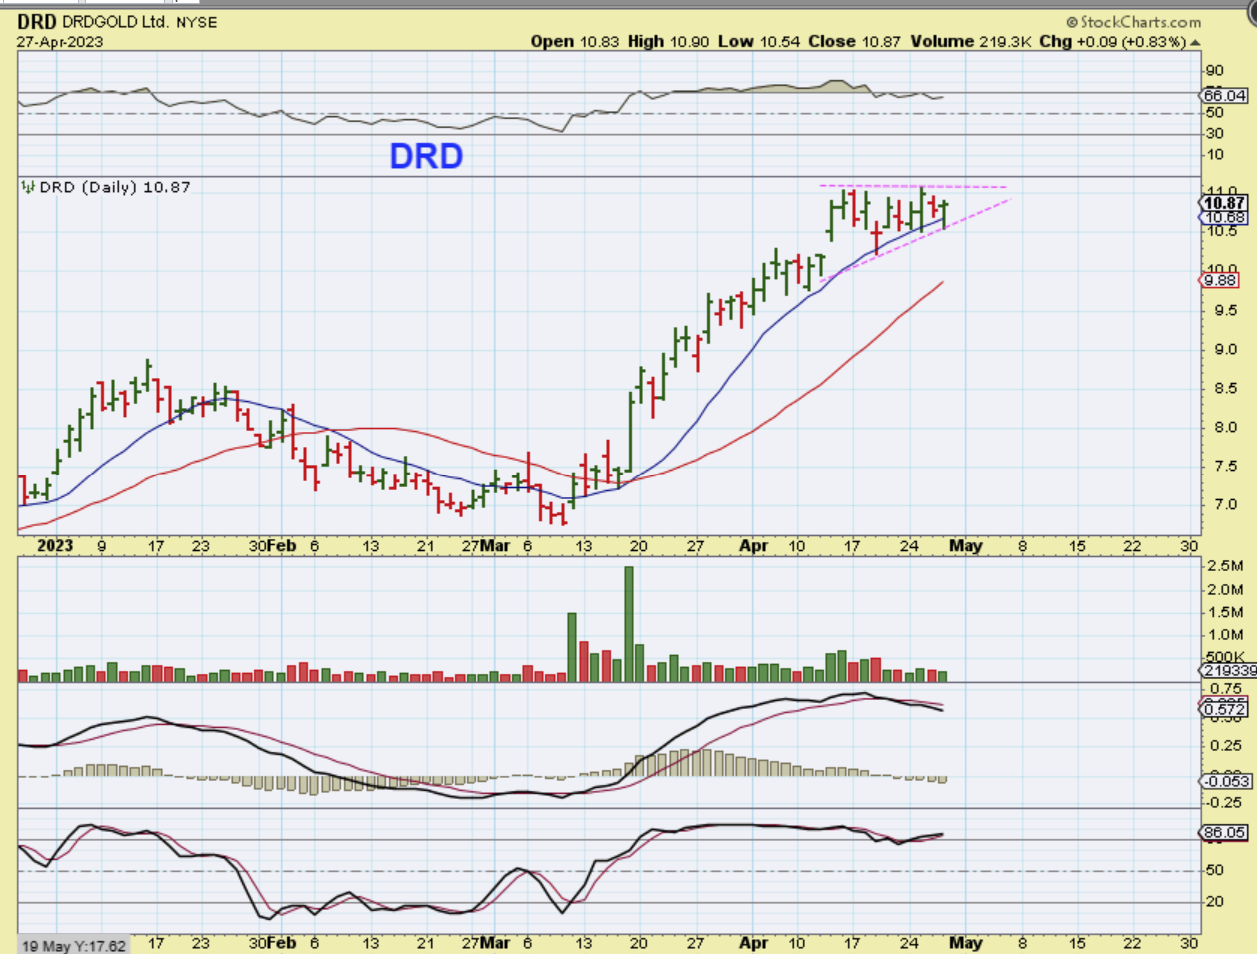
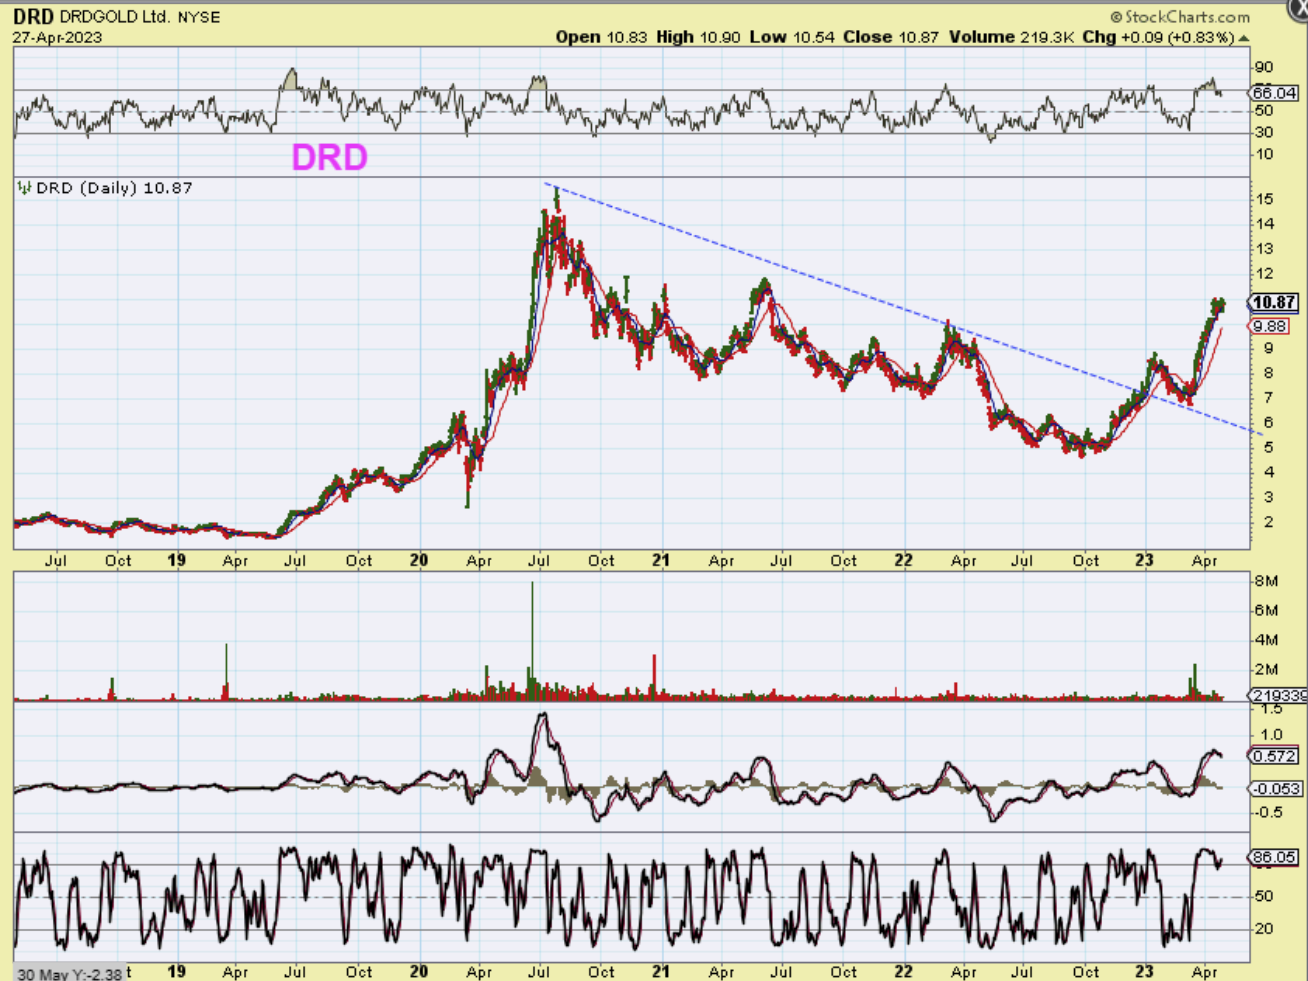
DRD #1- yesterday I showed the strength or resilience of DRD too, using this chart. it dropped and reversed higher, and looks like it has a dcl with Golds dcl.
.
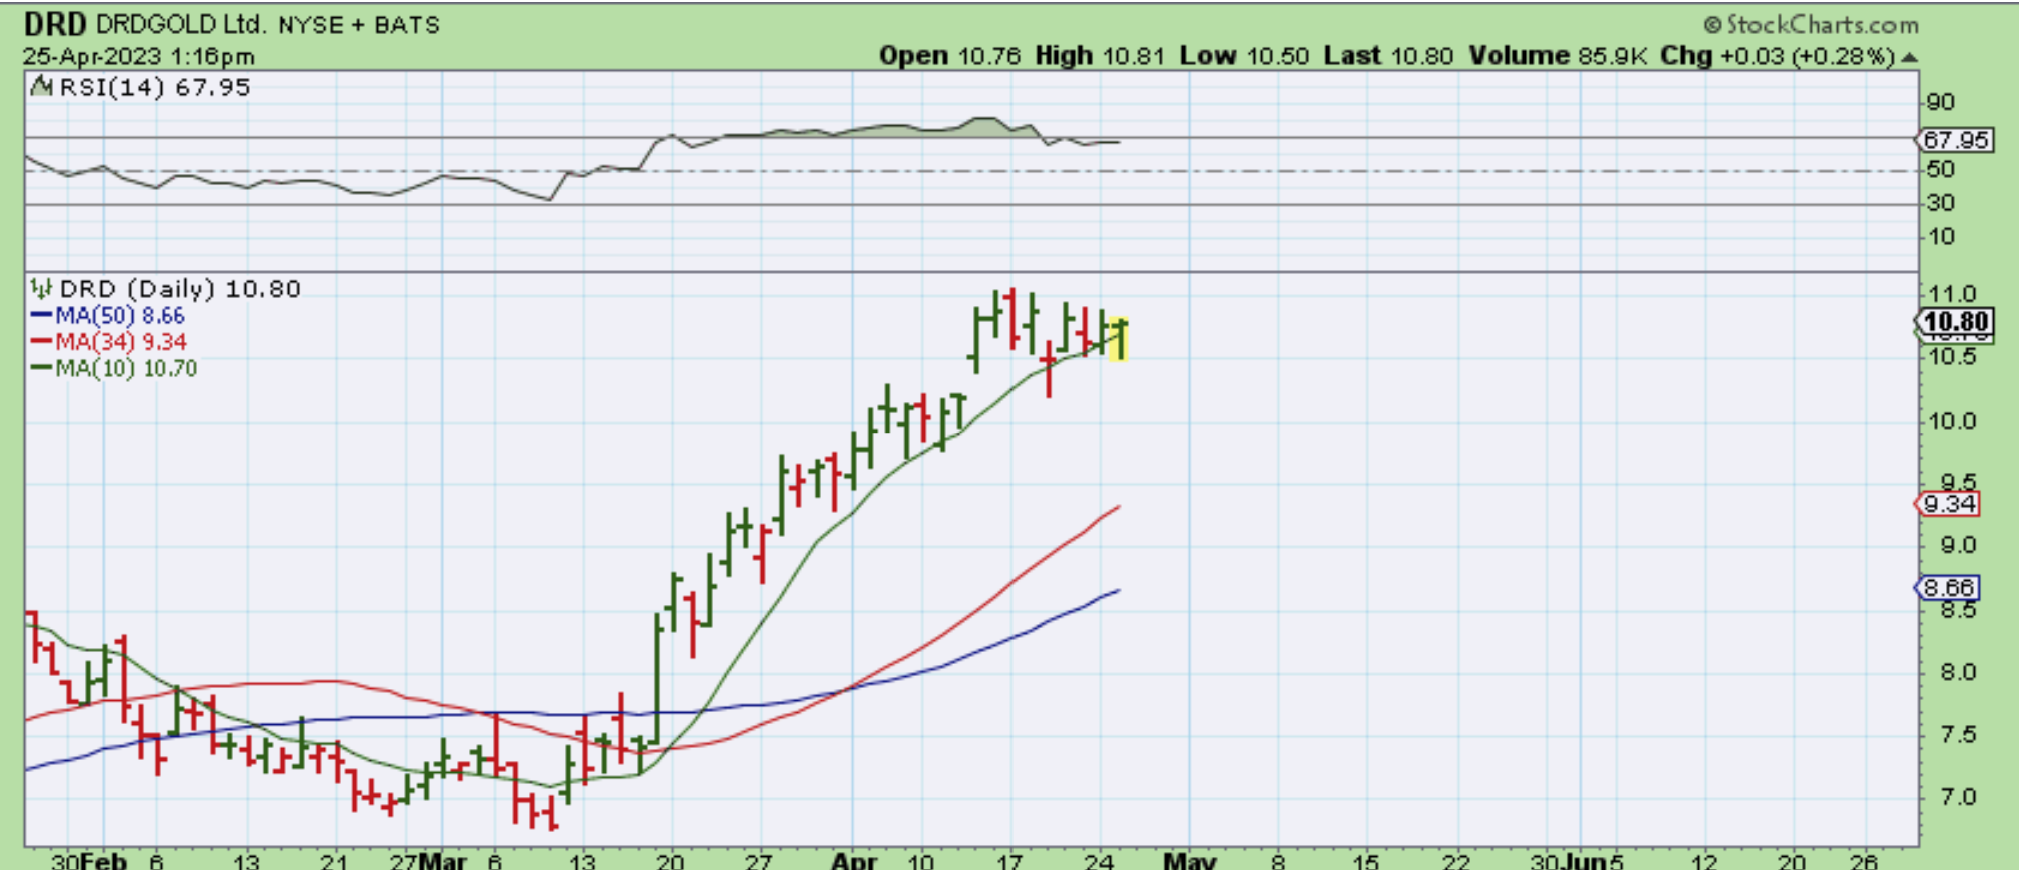
DRD #2-DRD dropped again on Thursday, but also recovered again, so Buyers are stepping in and buying the dips. I see a flat-topped wedge forming. But some might ask, ” Isn’t this extended?” ‘The Stochastics is very overbought; can it really go higher?”
DRD #3 – Stepping back to the bigger picture, DRD ran from $1 to $15 in the past and it was pretty much straight up in 2020. It should be able to run back up there (or more) now too.
.
With the cycle counts set up the way that they are, we must be ‘at’ or ‘close to being at’ the dcl. If that is the case, then that would mean that currently Miners are on sale and should move higher sooner than later. I know that it is very difficult to buy heading into a Fed Meeting, but you can always start small and add after the Fed. Enjoy your Friday trading and the upcoming weekend!
.
~ALEX
.
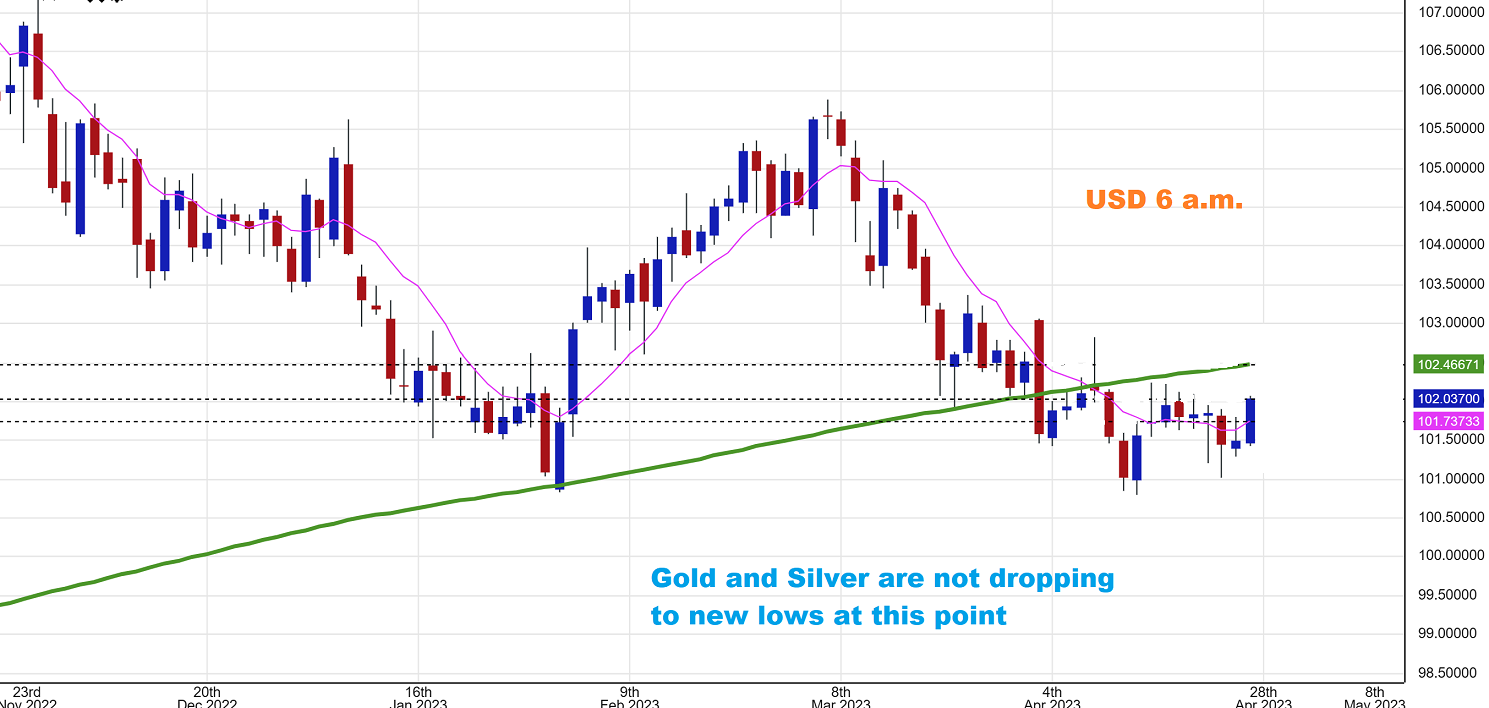
LIVE 6 a.m. ET – The USD has Popped this morning, but Gold and Silver are not breaking to new lows at this point. Silver almost broke the lows yesterday, but it is not dropping back to the lows at this point, despite this USD pop.
.
This is Bitcoin live at 6 a.m. too. It is dropping slightly right now. You can see where it sold off on Wednesday and gave us that large Doji, but then recovered yesterday too.
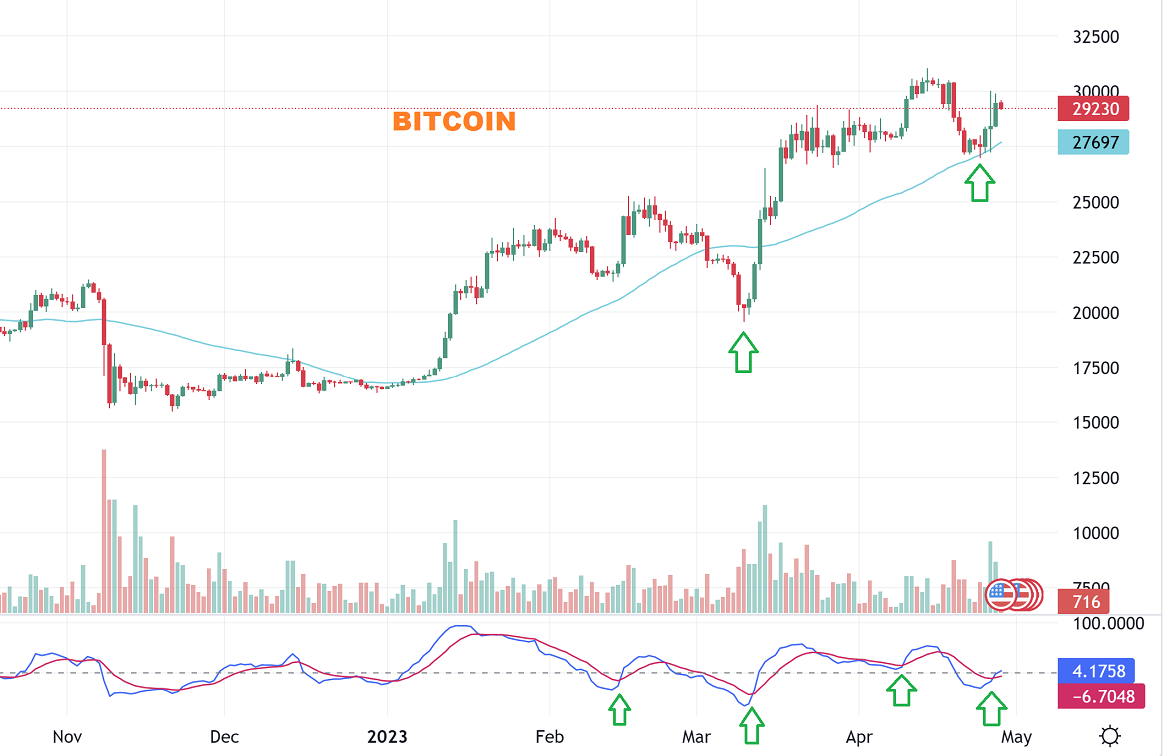
The Crypto stocks reflected that move.
.
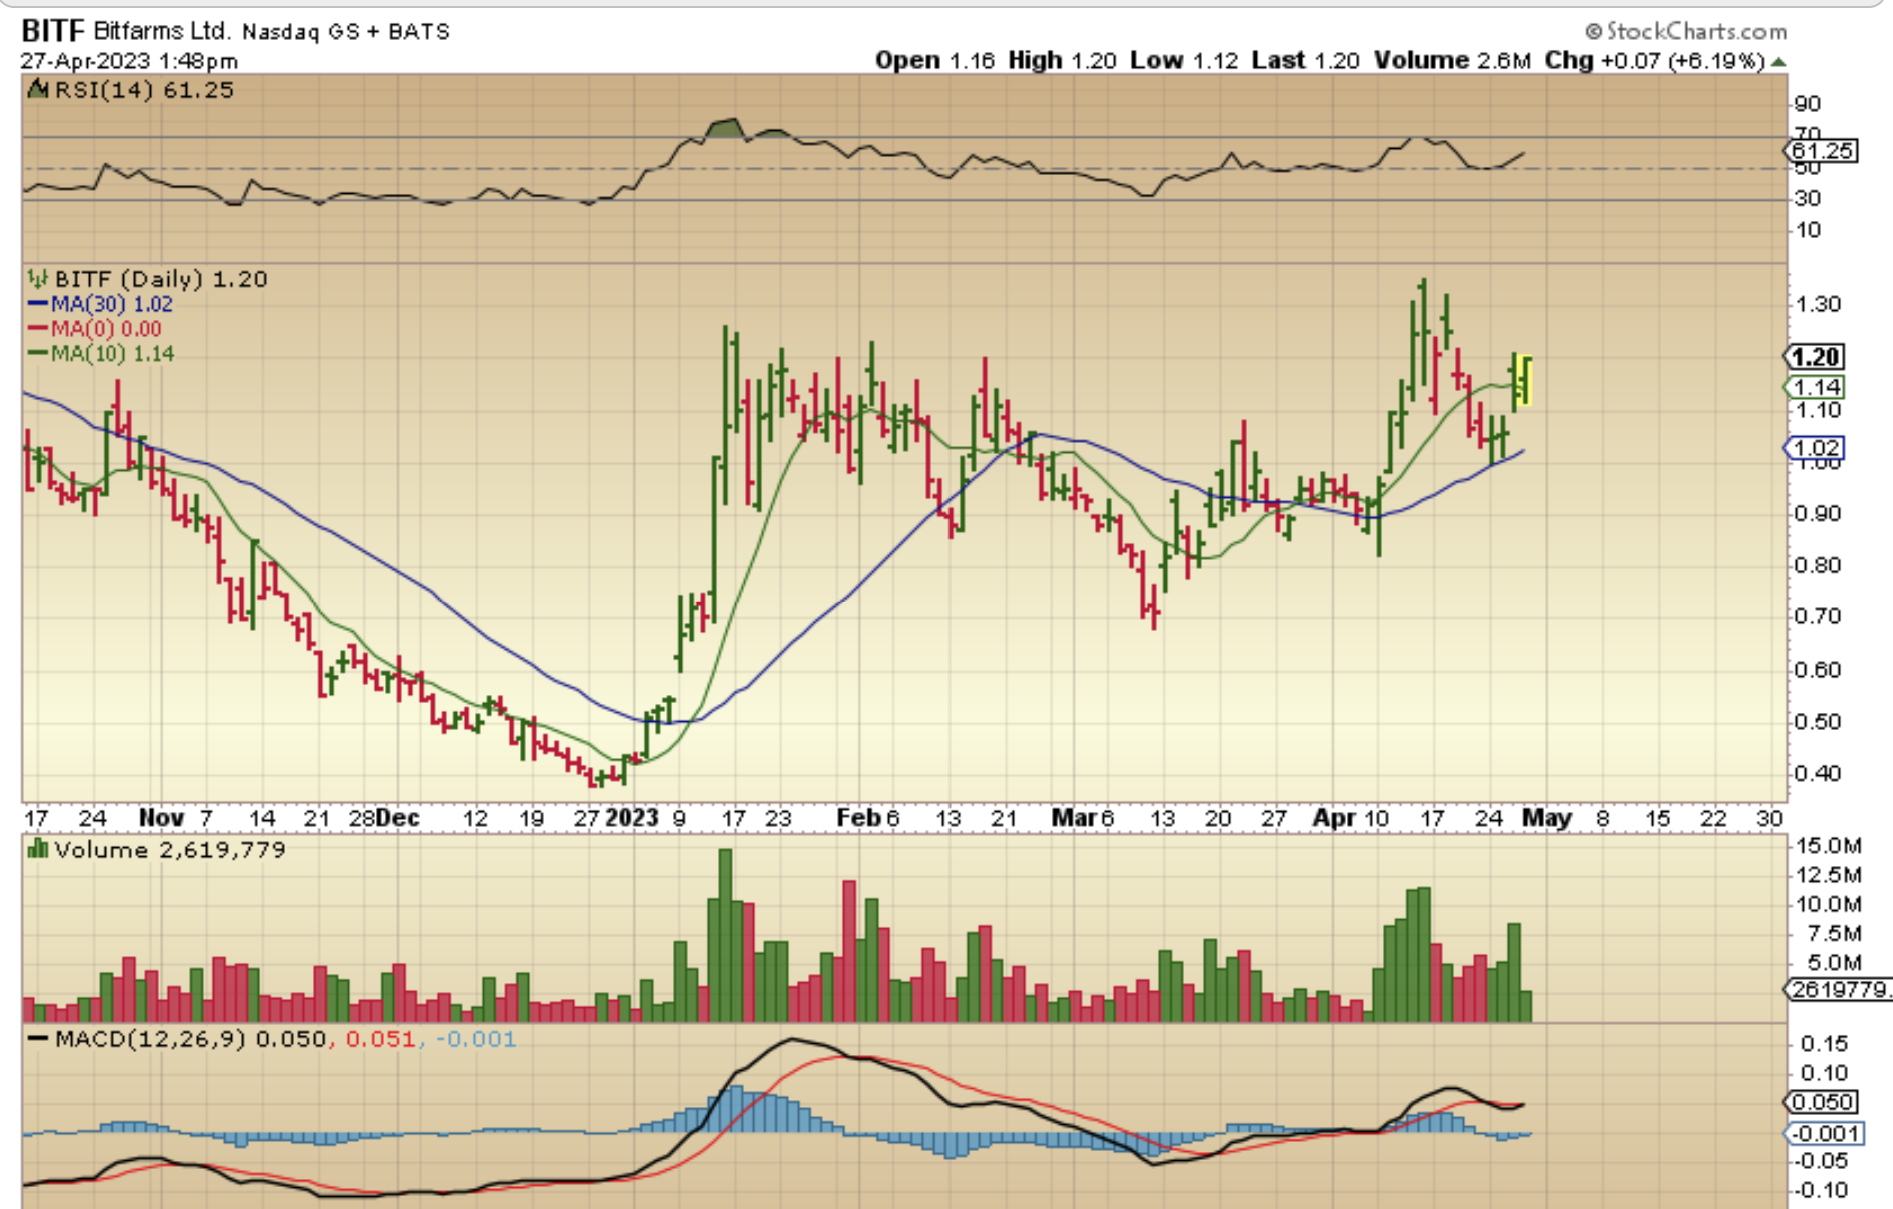
BITF reversed bullishly at the 30sma on Monday and Tuesday. It then gapped open Wednesday and dropped as Bitcoin sold off, but nothing changed on the chart, it remained bullish. Thursday it was up 6% by midday and closed up 8%.
.
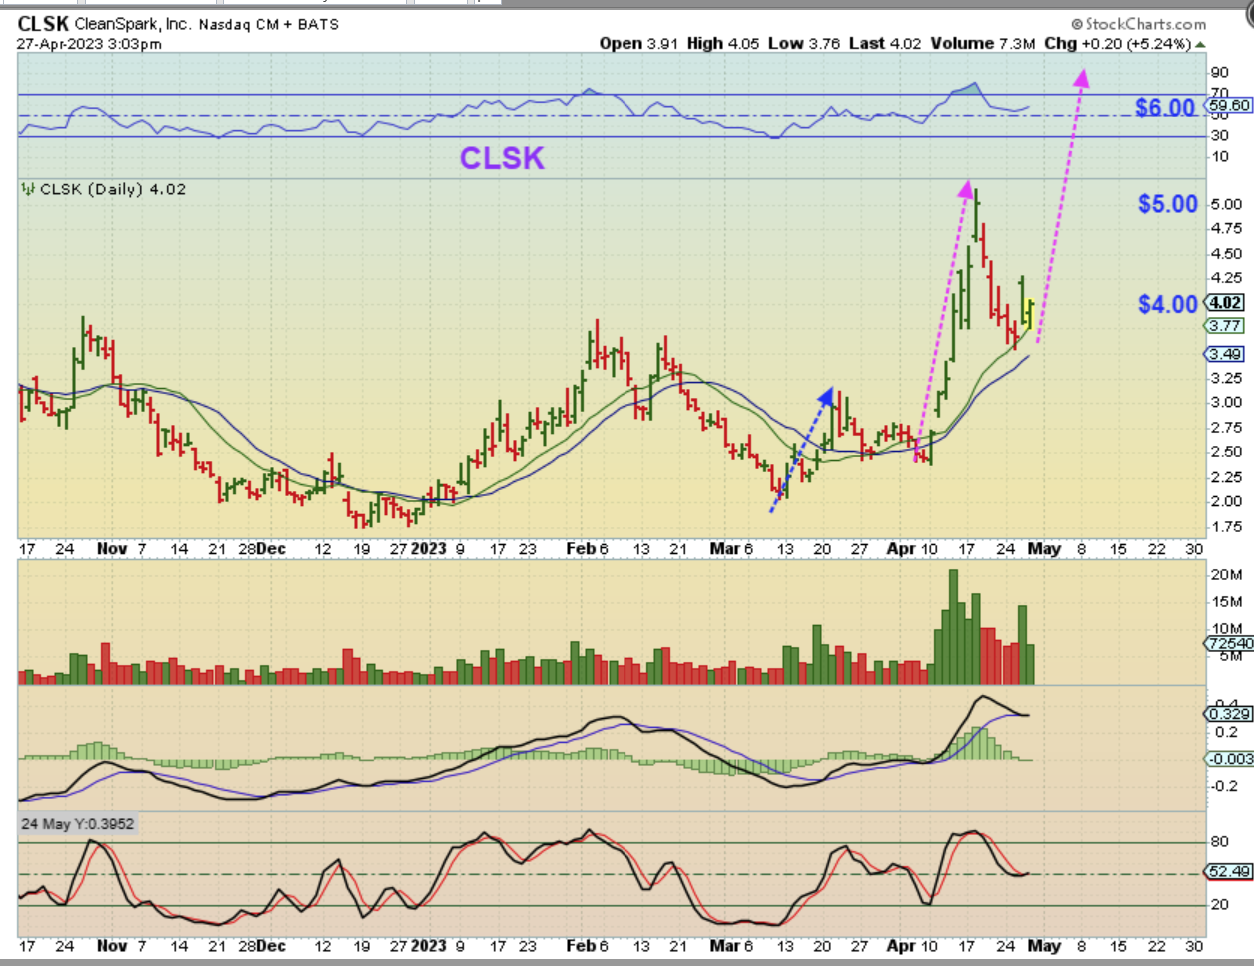
I drew this chart for CLSK to show that it really surged nicely on that first and 2nd run higher. If that 2nd run repeats, CLSK could run past $6 from this $4 area.
.
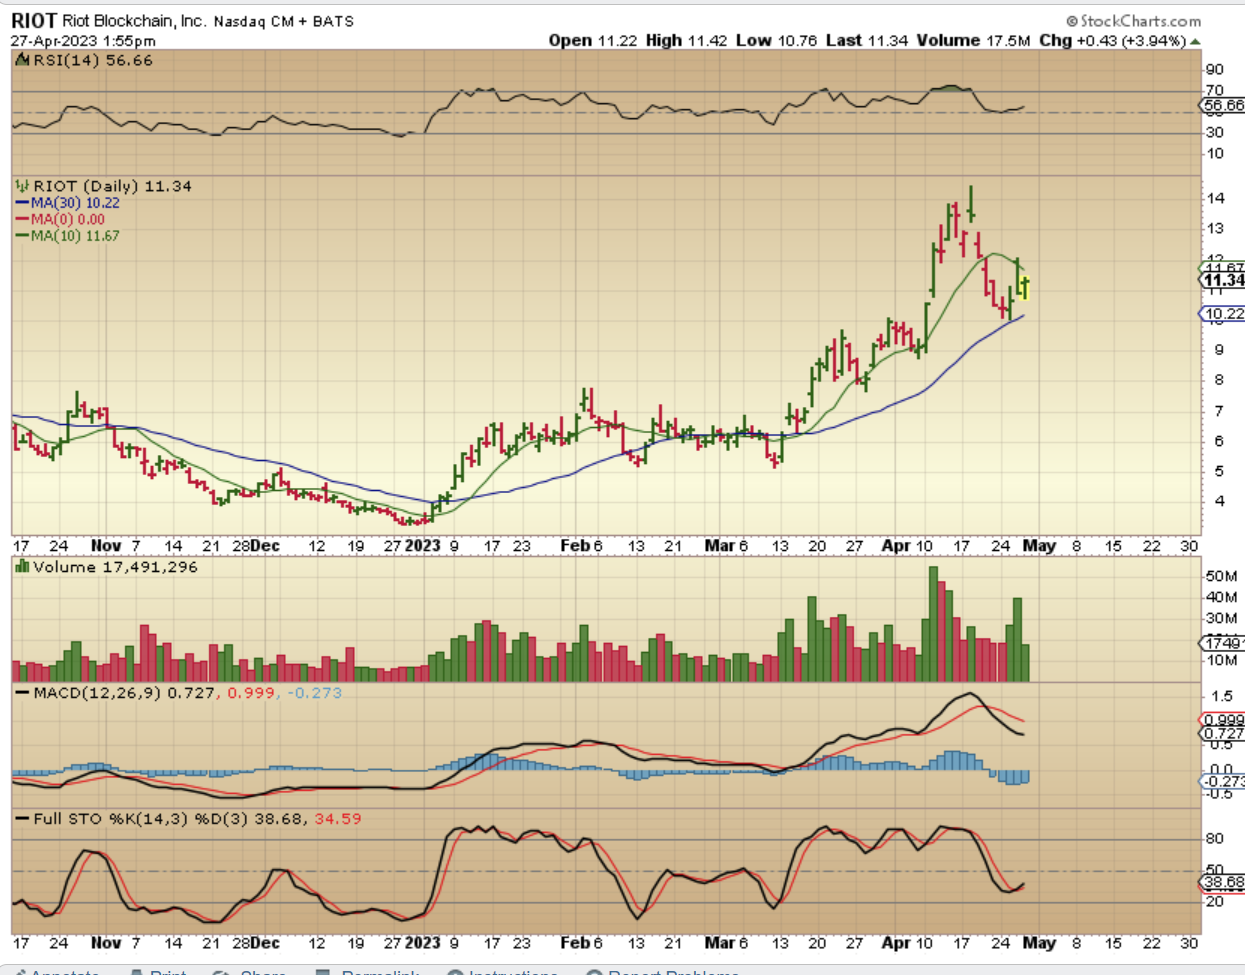
This was RIOT midday yesterday. I wanted to show that after Wednesdays large gap open and dip lower, it continued higher with a reversal.
.
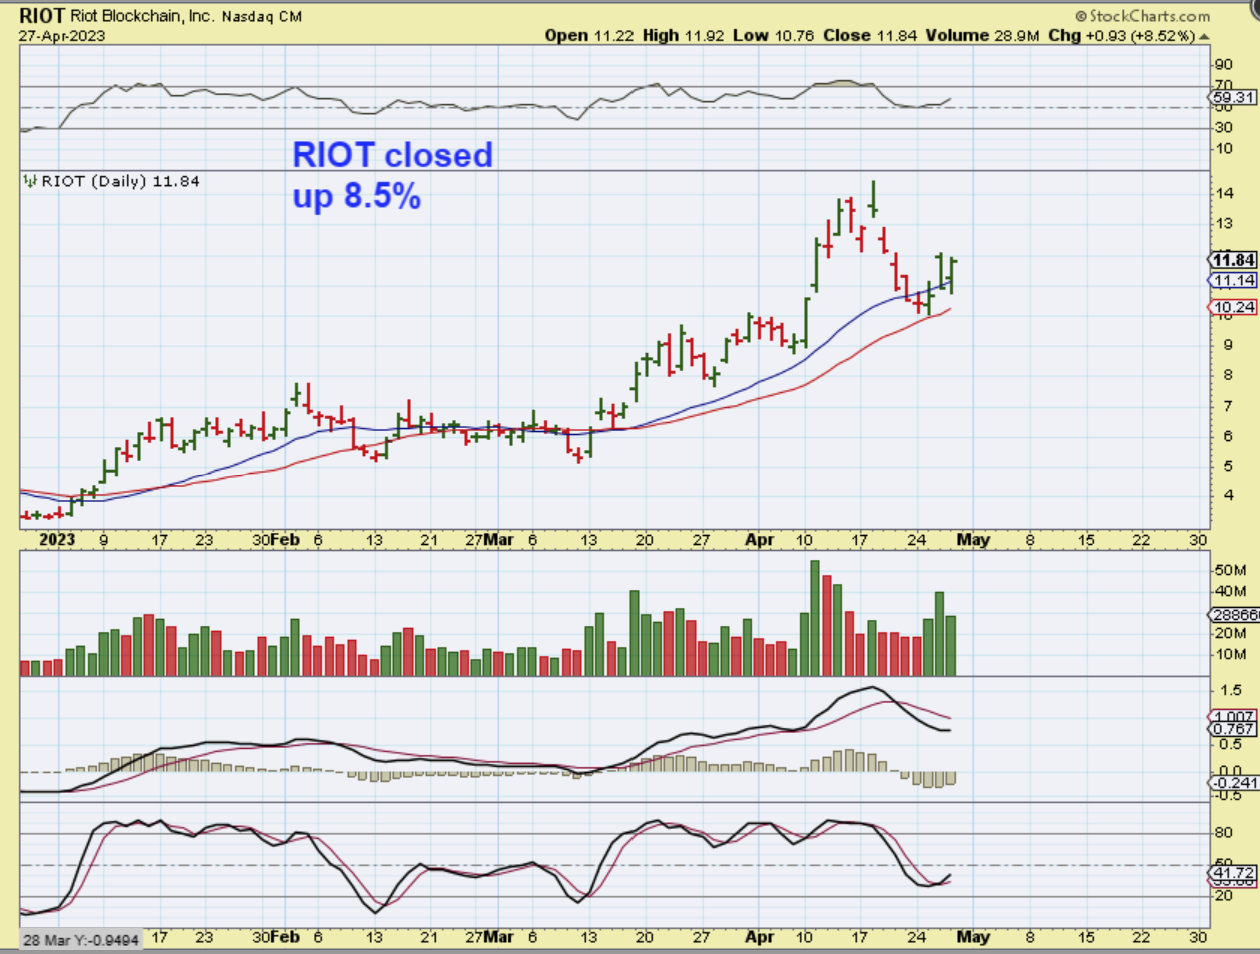
Riot then went on to close up 8.52%. I have mentioned that these can be very hard to ride and even though this chart looks totally normal, it was a tough ride Wednesday & Thursday.
.
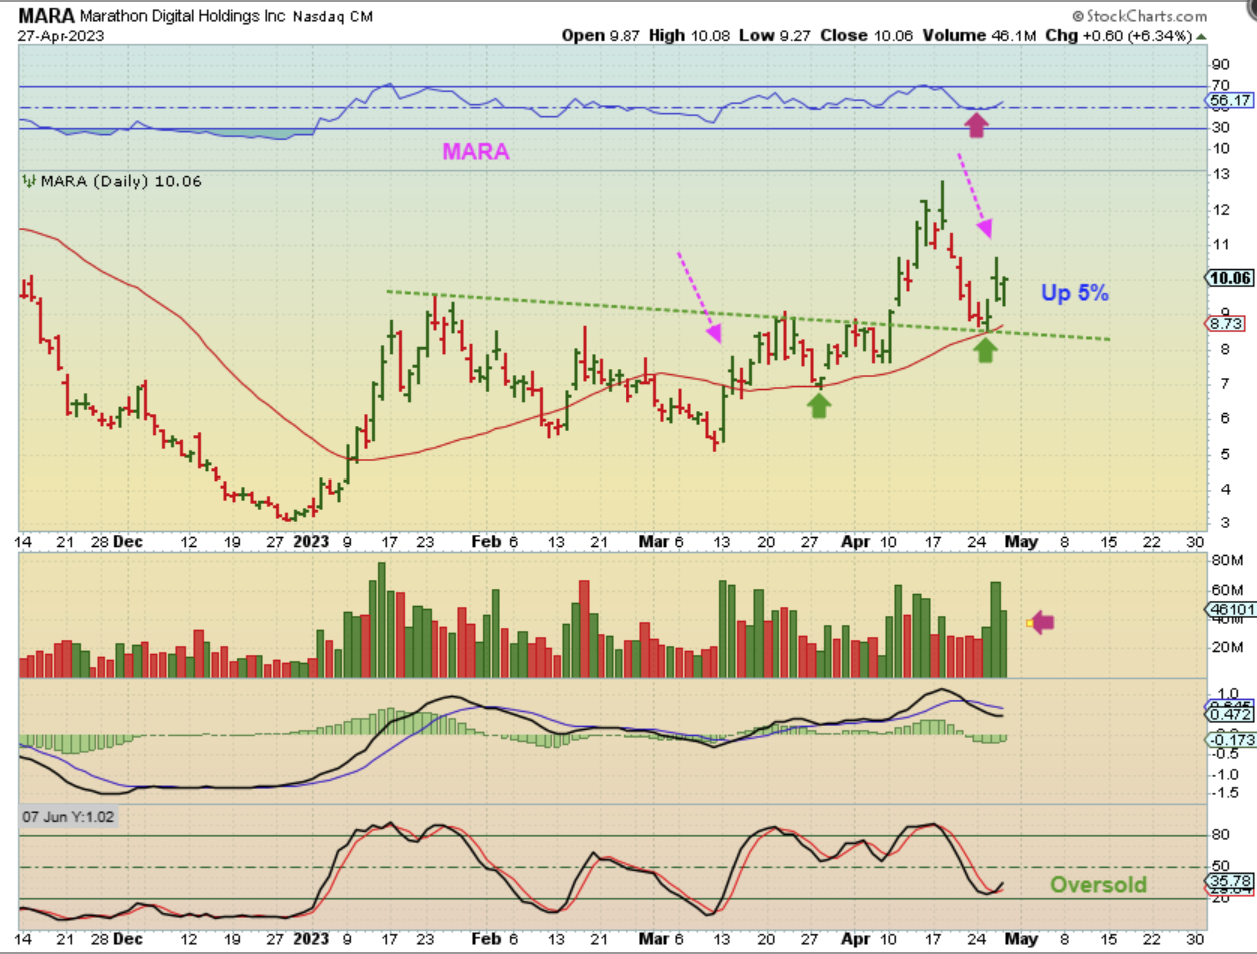
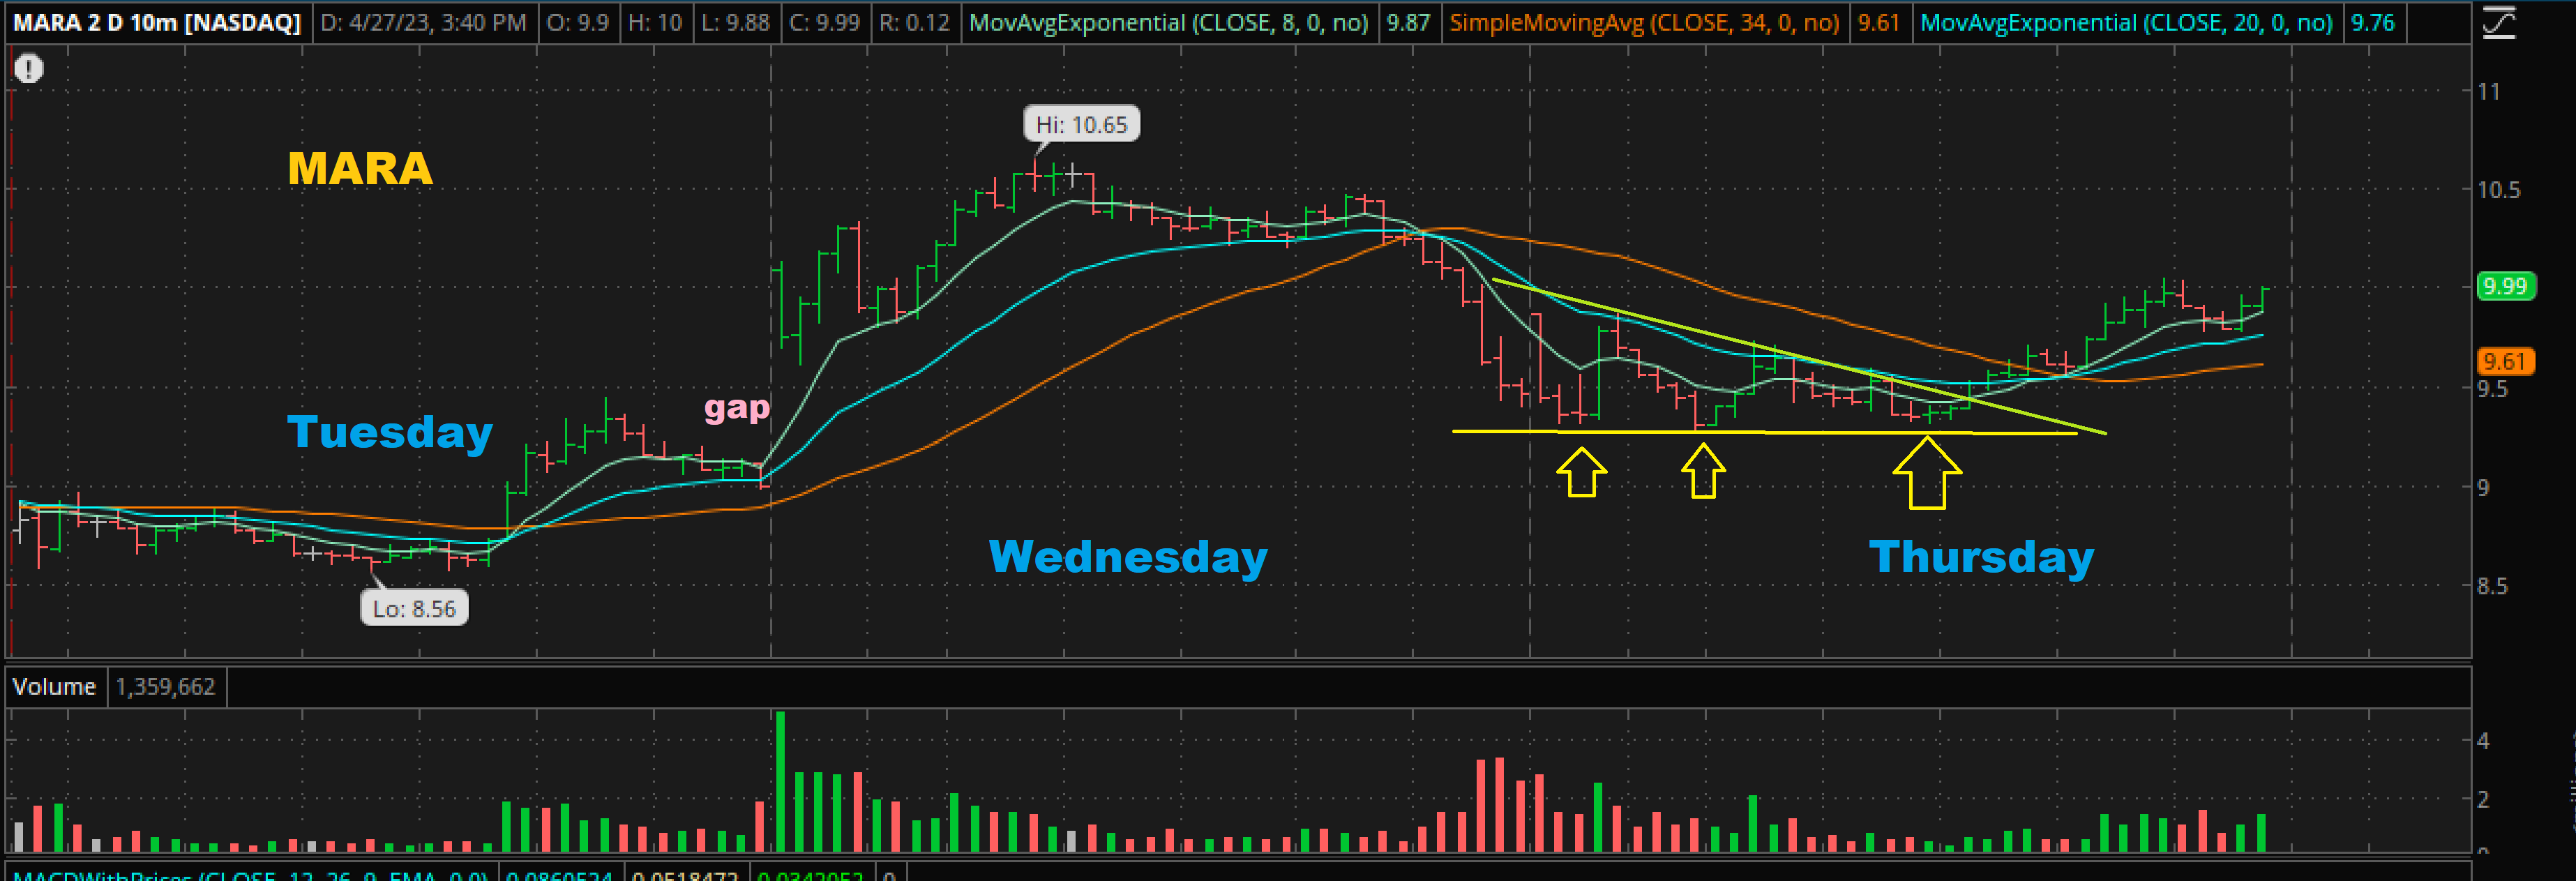
By midday we saw MARA gap up and sell off to that 50sma. I mentioned that this is really a buy not a sell. For example: If I showed you this chart in 6 months, price could be in the higher teens and this would be a ‘buy’.
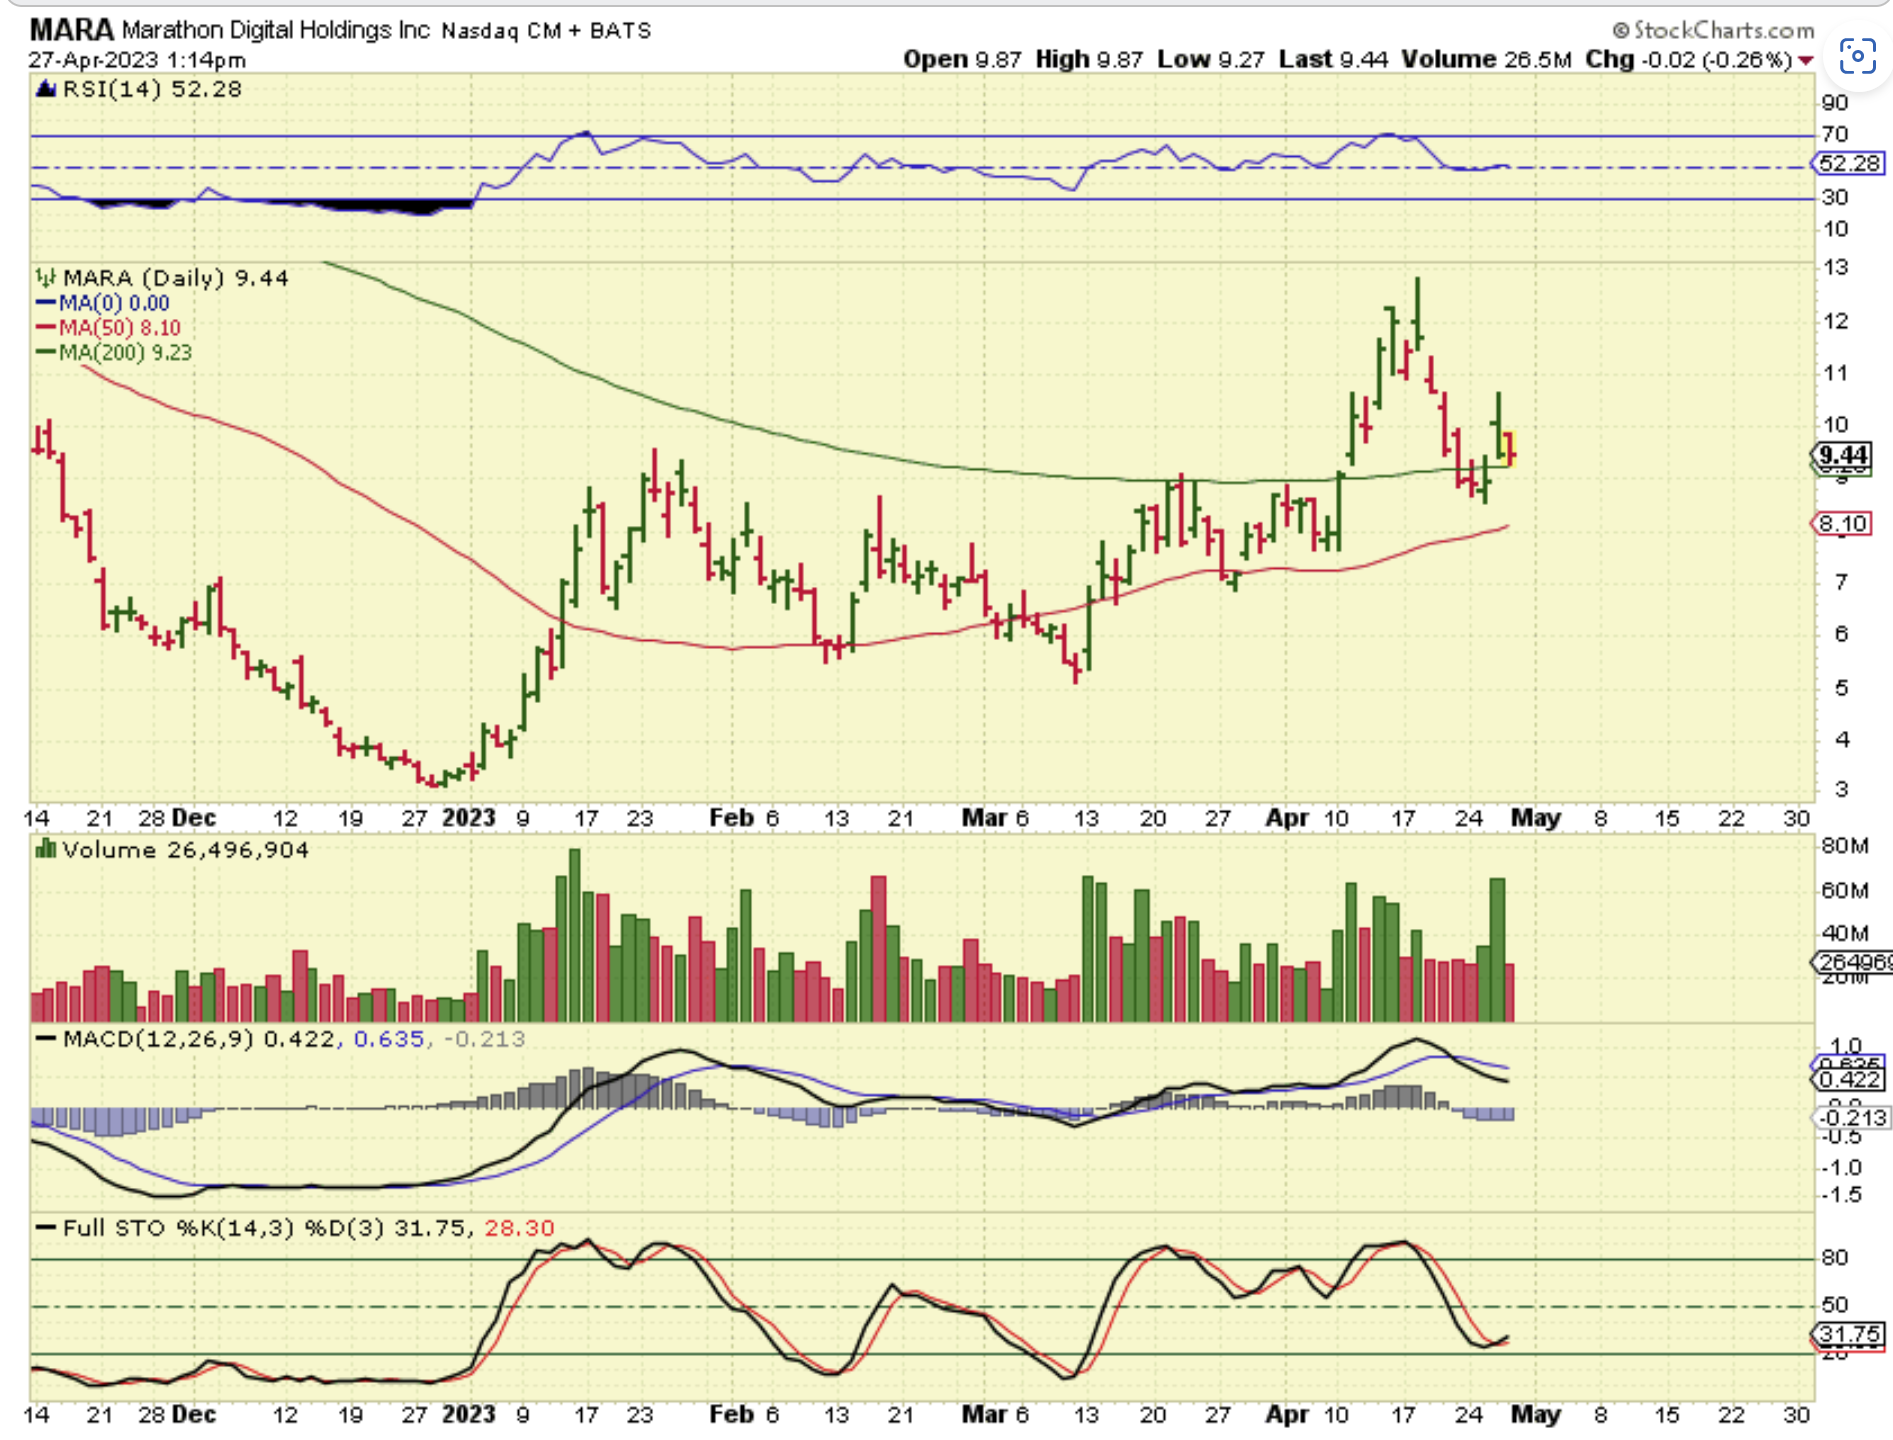
Then I pointed out how MARA looked intraday.
1. It sold off with Bitcoin at the end of Wednesday
2. It triple bottomed -or- formed a base that developed into a wedge.
3. The break upward of that triangle was a buy or ‘add’ point intraday. It then continued higher…
ON WEDNESDAY MARA closed up 5.23 % when these all gapped up and reversed lower with Bitcoin. I pointed out yesterday that I have seen this before and we may simply be repeating what I saw in March with a gap open reversal drop to the 20sma. See the arrows. IF SO, we’d eventually still see this continue higher.
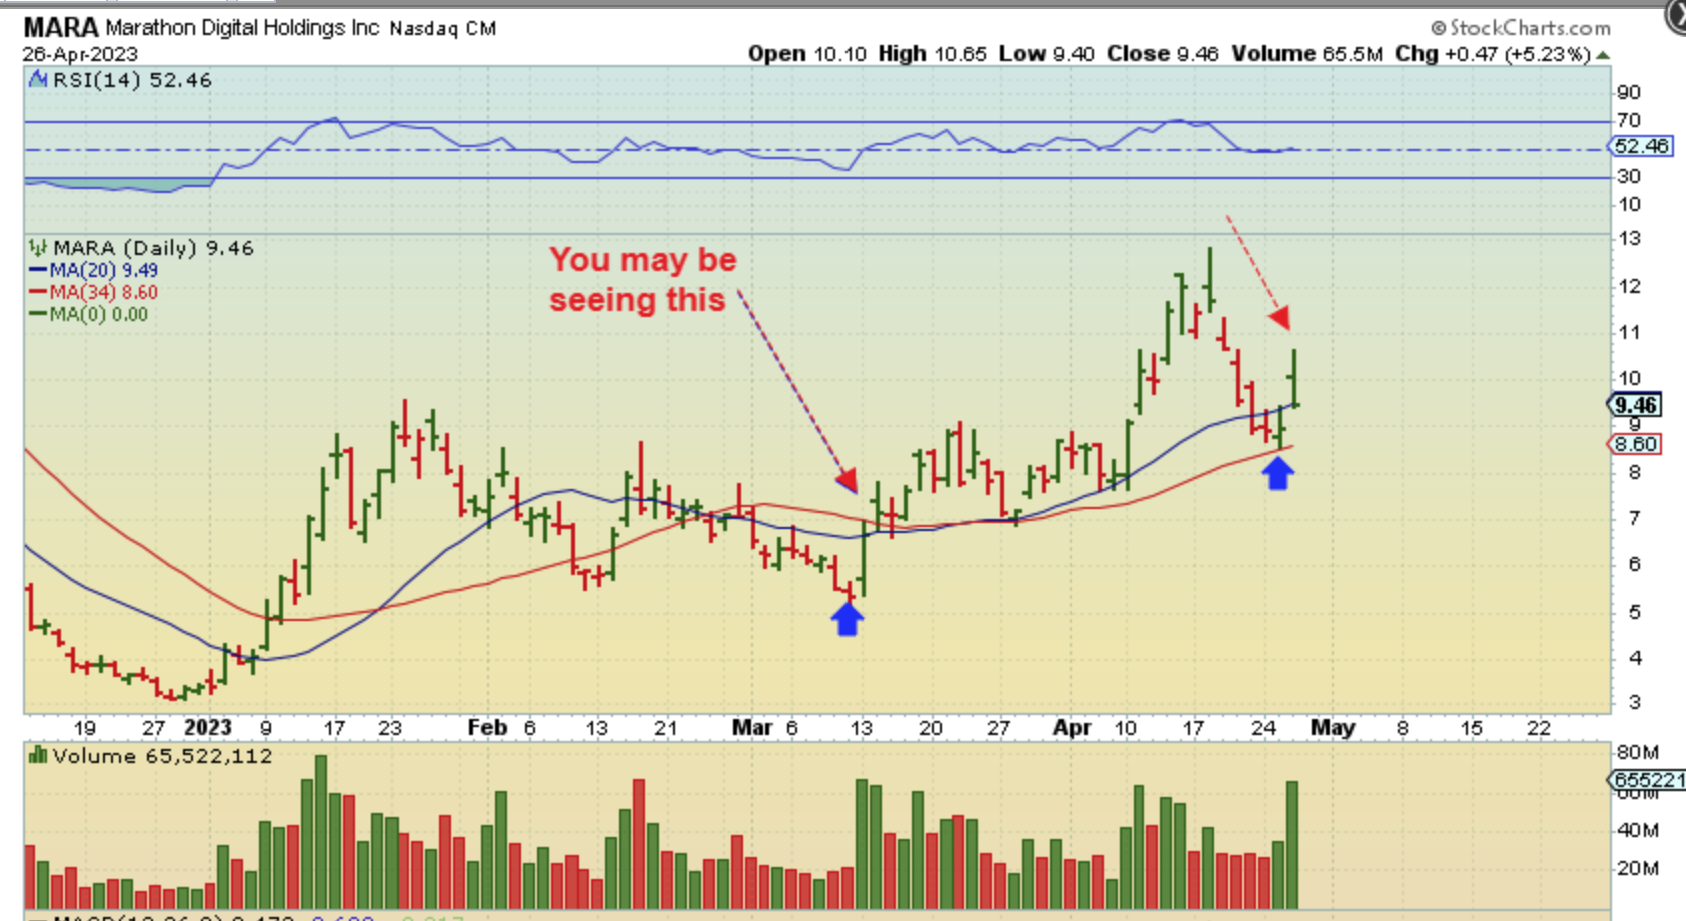
MARA then closed up 5% yesterday, so it remains a bullish chart.