April 29th – The Weekend Review
The SPX Weekly – Back at the end of 2022 I started to mention that the bear market was 1 year long and usually that can be enough to kill frothy sentiment and re-set things. I was thinking that the Bear ended and The Bull may begin again. So …
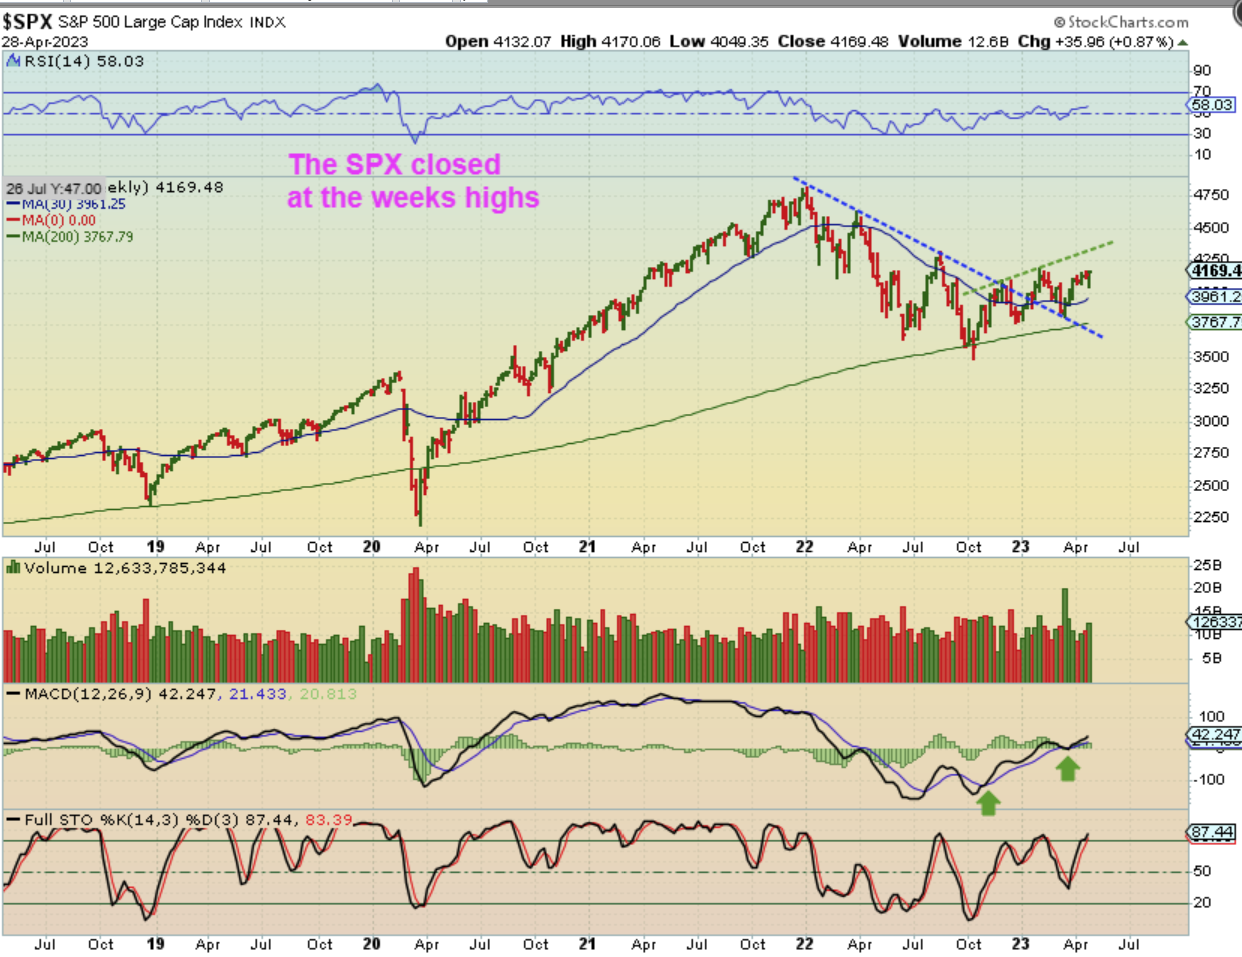
Here we are 5 months later and the Bear has ended for now, but so far it is not running straight up to the highs again. This has been more of a
1. Chop higher as it broke out from the downtrend,
2. It dropped back down and tested that downtrend, and
3. Now it has started to push higher again, closing at the weeks highs.
4. This is a bullish set up, but so far it has been a little slanted / sideways.
5. With Data showing signs that a recession could come by years end, I am wondering if we just run up and do a double top as the USD dips into the 3 yr cycle low? That is kind of what I am thinking we’ll see.
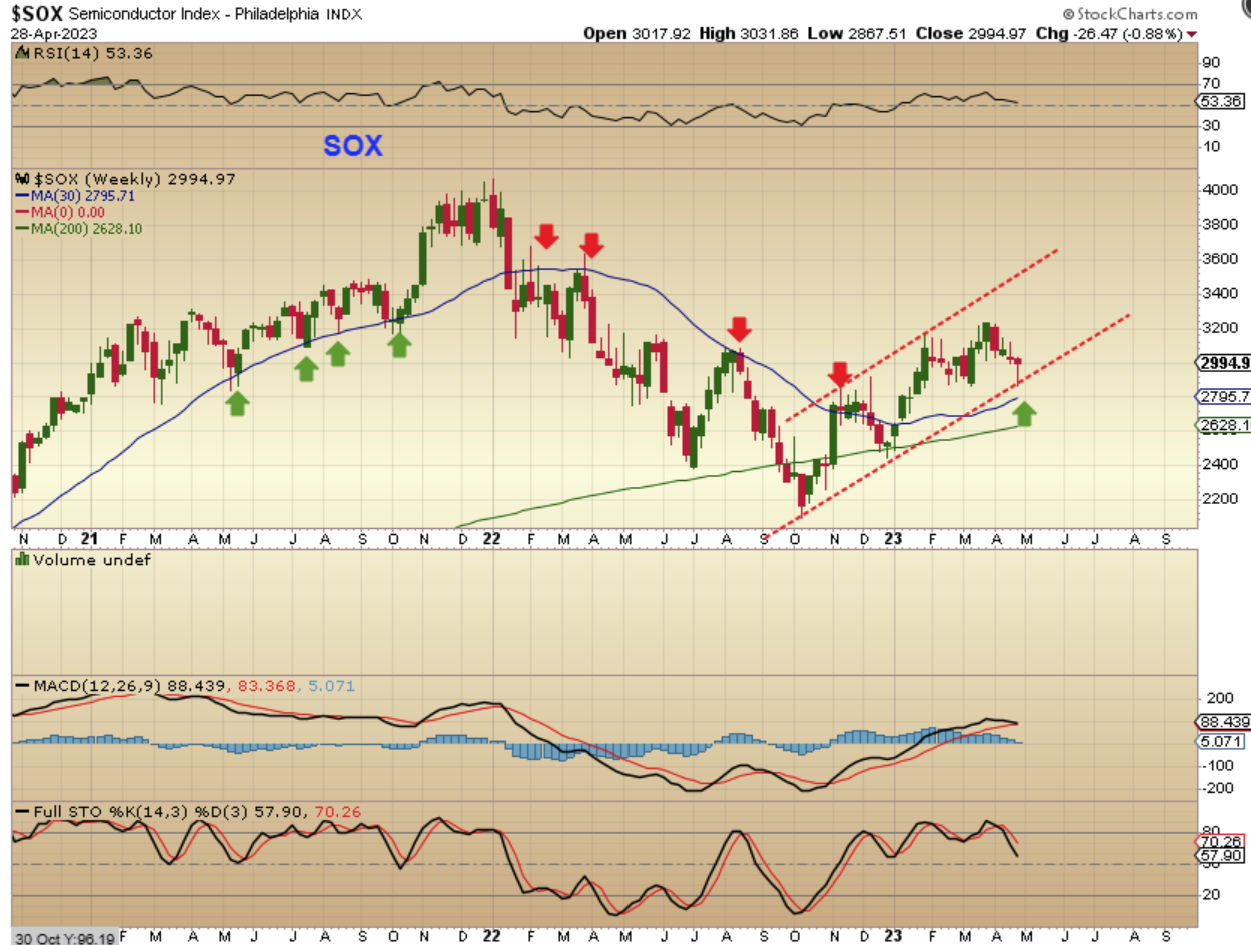
Did you notice that the SPX (& Nasdaq) ran higher for the past couple of weeks? Well, The SOX, which used to lead the way, did not. The SOX dropped for a few weeks and simply gave us a reversal off of a lower trend line this week. I am thinking that this may rally into the Fed Mtg and then continue higher. SOXL May be a good trade if the SOX plays catch up over the next couple of weeks.
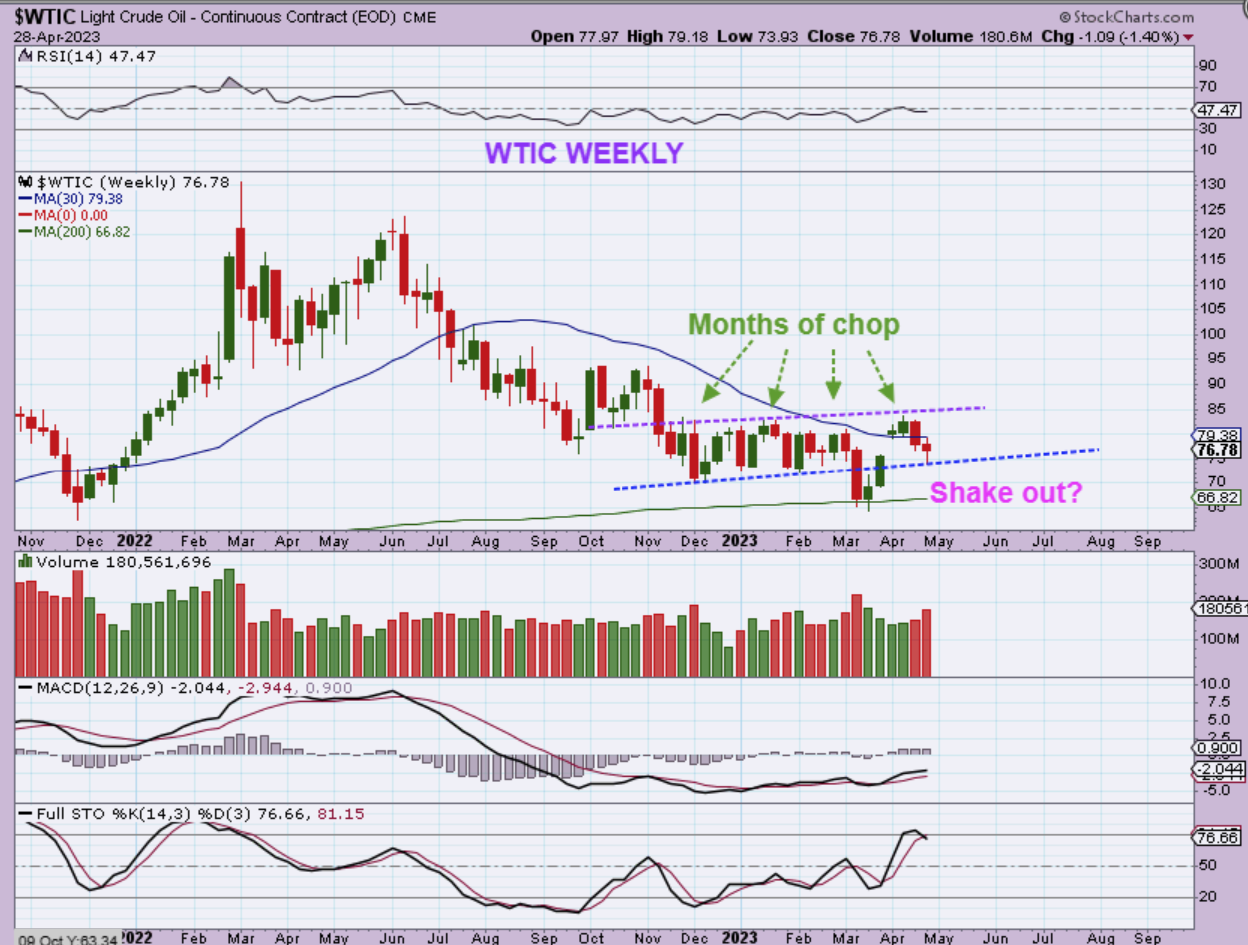
WTIC – Oil has simply been in a choppy sideways pattern. We saw price gap over the 30 week line 3 weeks ago when opec announced cuts, and I thought that we should run higher, but so far Oil is filling that gap and now we have a reversal at the lower trend line here too. I mentioned this week that Oil can be considered a ‘buy’ ( USO, UCO) with a tight stop the weekly low, but it surely has been frustrating when I tried a few trades inside of this chop & the Oil Stocks.
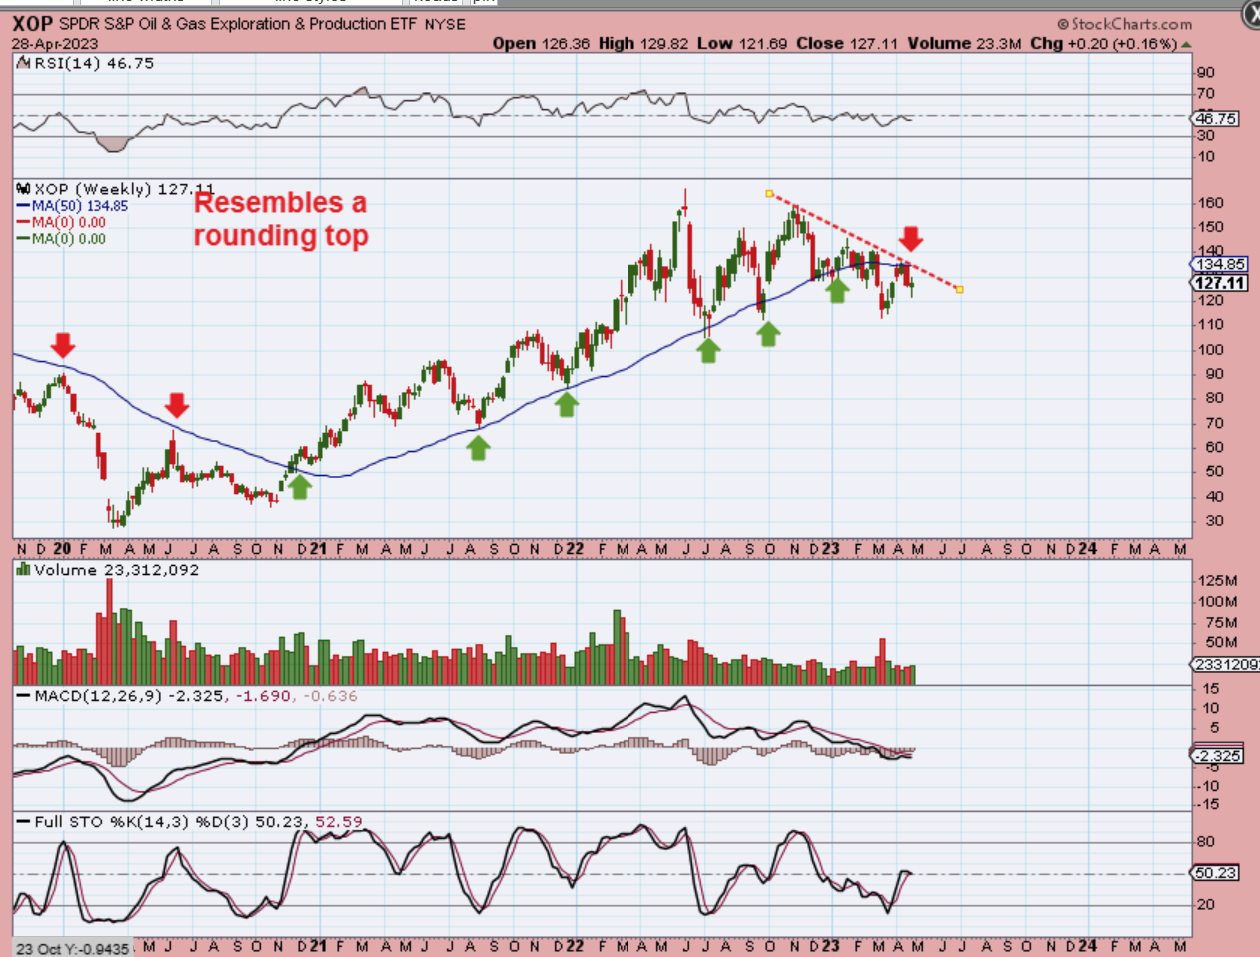
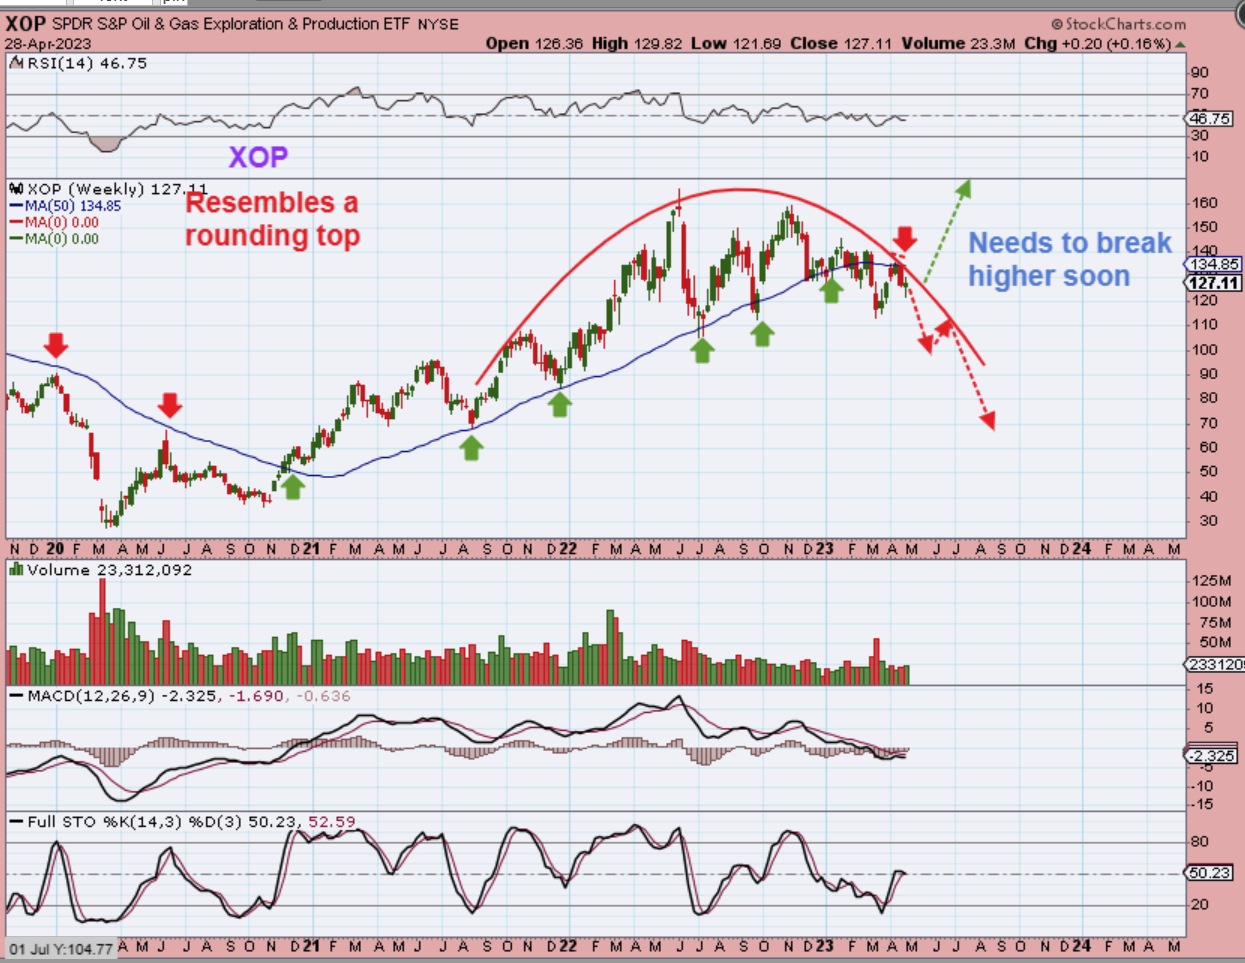
The XOP – Since I was expecting Oil to run higher after that Gap up caused by Opec production cuts, I thought that the XOP would break out above that 50 week ma and downtrend line by now. That CAN still happen and especially now that we have a higher low reversal candle here, so that is the expectation. I will, however, draw the more bearish view next.
.
A true rounding top is bearish and I have to admit that this is what I see as possibly developing here ever since the XOP was rejected at the 50 week ma. Basically, this needs to break out above that 50 week ma to negate this topping pattern, and that could happen as soon as next week too.
.
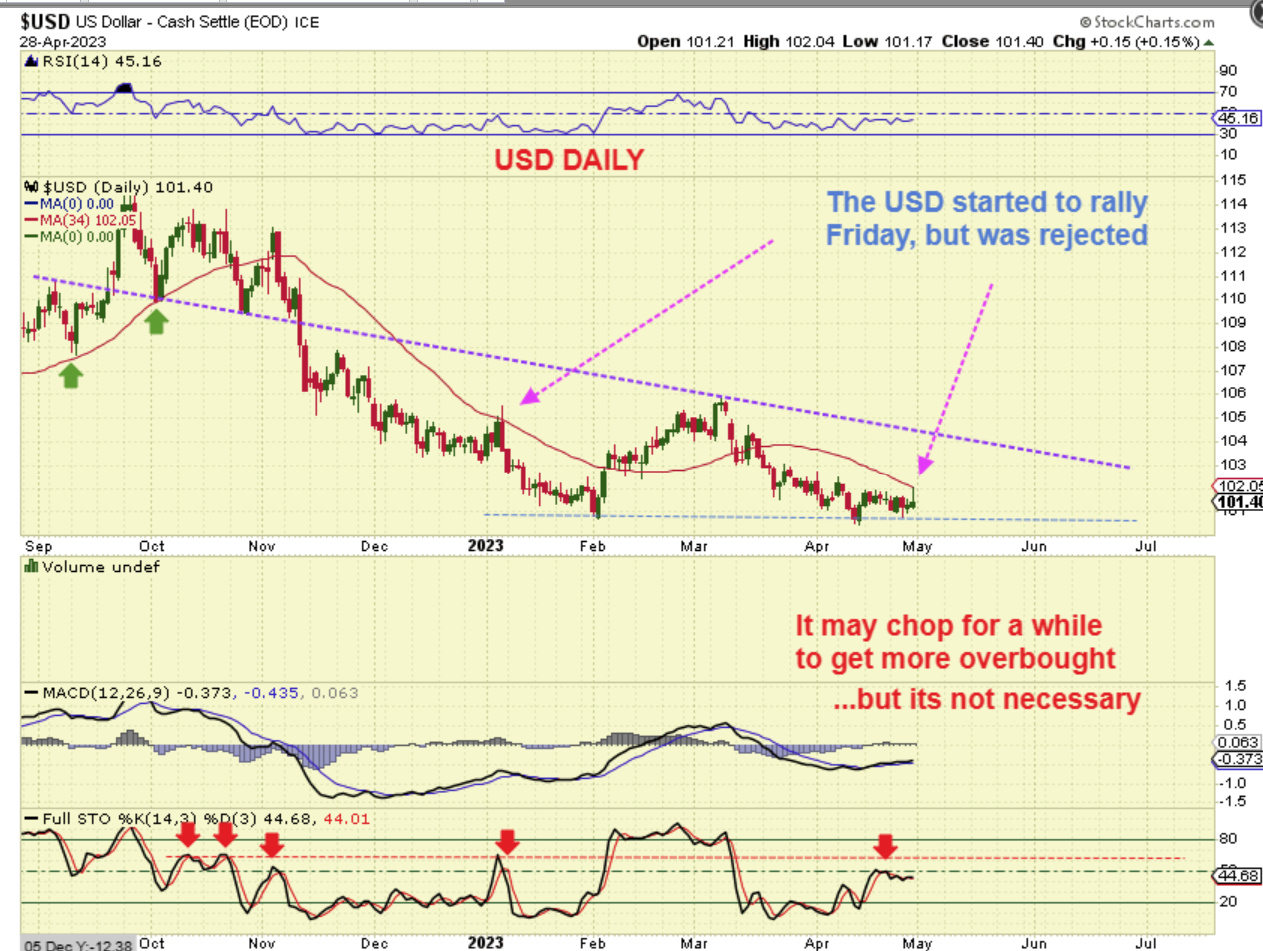
USD DAILY – The Dollar Popped up on Friday, but it was interesting to note that Gold and Silver did NOT drop all that much when the USD was up nicely. Soon after the markets opened in the U.S., The USD sold off again and as you can see here, it tagged the 34 sma and was rejected.
.
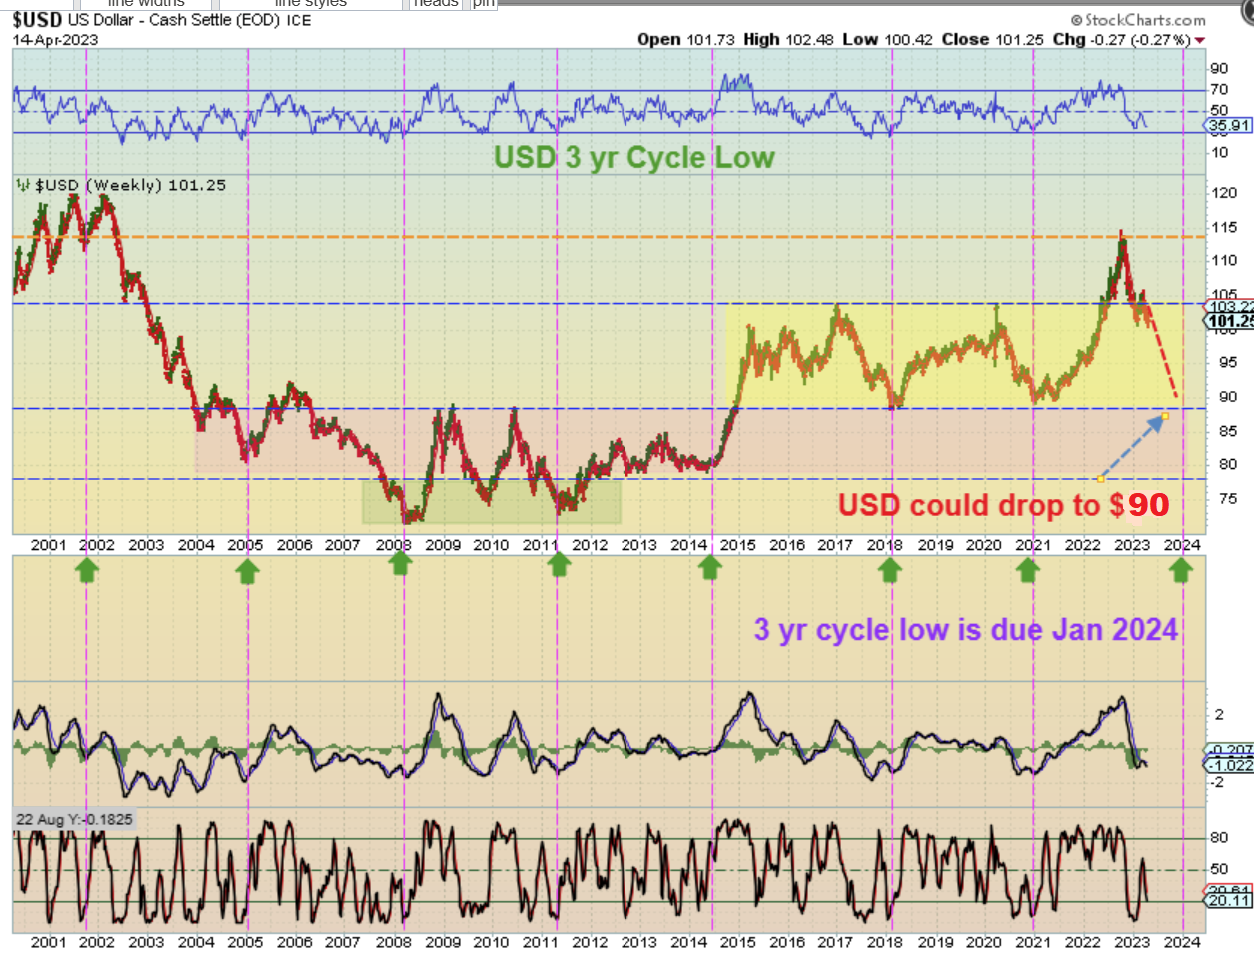
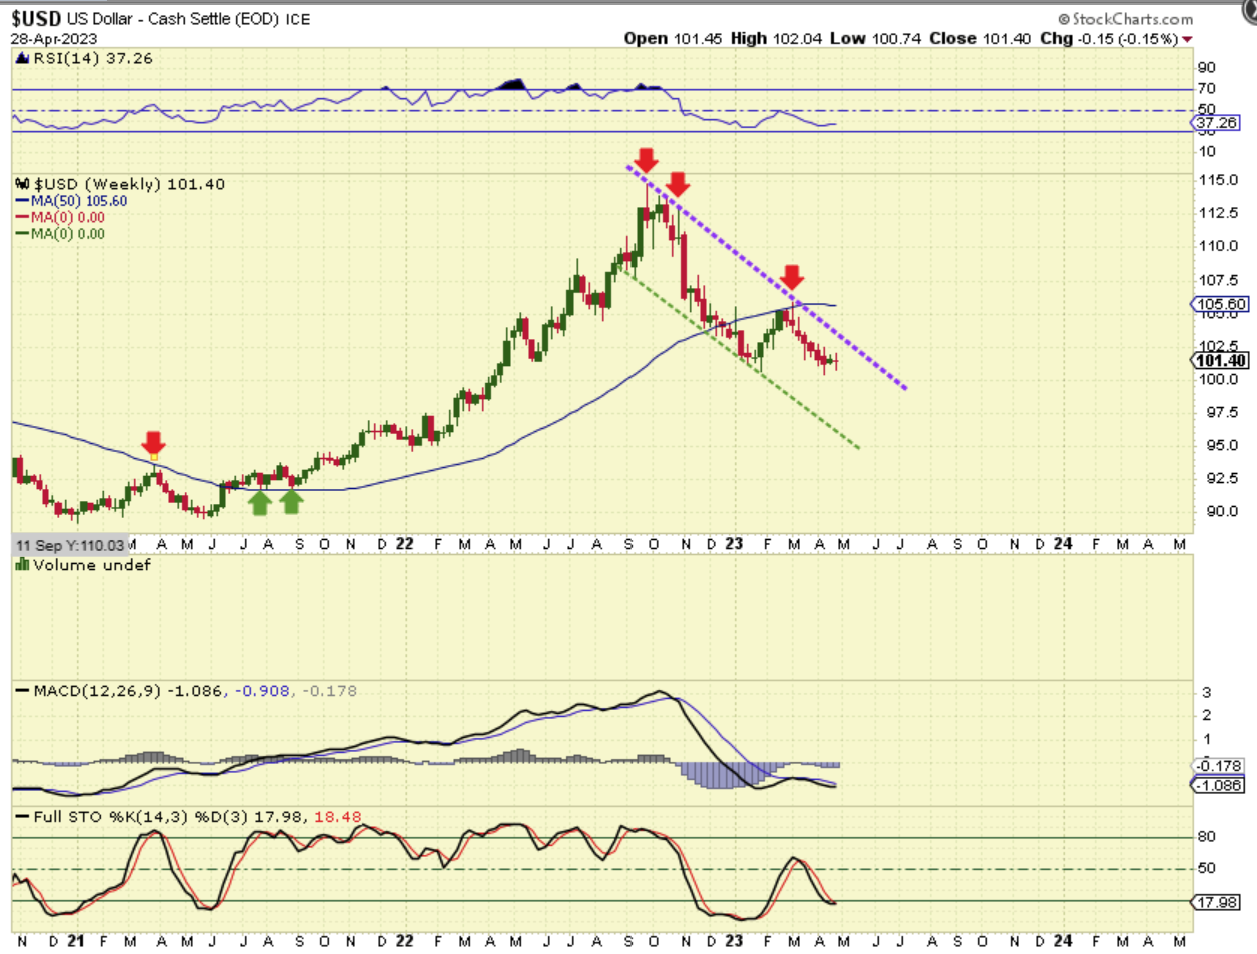
I have been calling for a drop to possibly $90 as the USD falls into a 3 yr cycle low. That low is not due until Jan 2024, but with all of the fed Manipulation of Rate hikes and monetary policy, I cannot rule out that it arrives a little earlier or later. So far, as seen here, the 3 yr cycle low has been a consistantly reliable tool.
THE USD WEEEKLY Bounce in February peaked in March and formed an upper trend line. It has been unable to close over that 50 week ma, but a bounce or sideways move to the trend line from here on Fed week is not out of the question ($102.50). This weeks high was $102.04. We have a weekly doji with that Pop and Drop Friday.
GOLD DAILY – Gold dipped to the 34 sma and bounced back on Friday to close green.
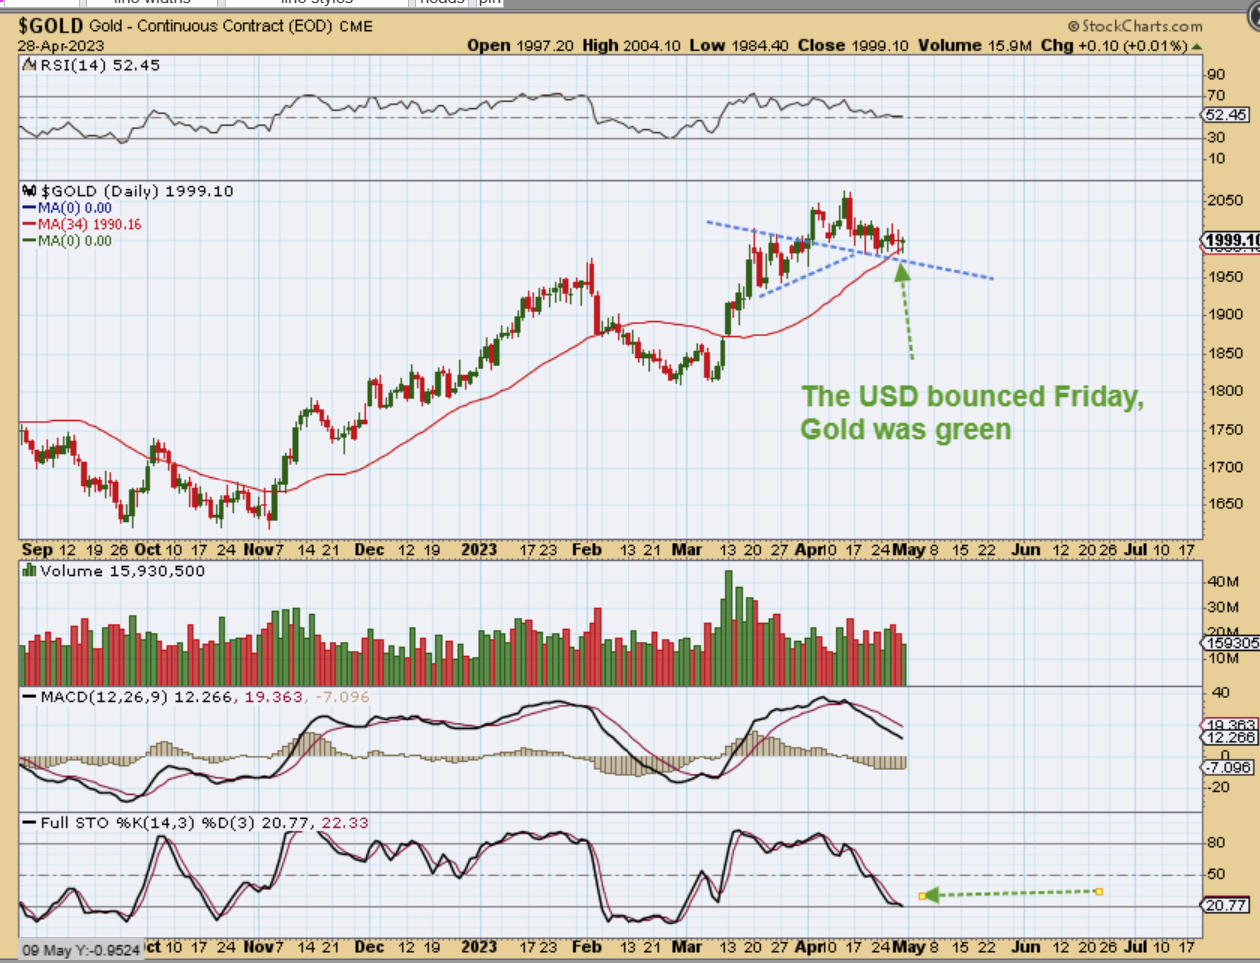
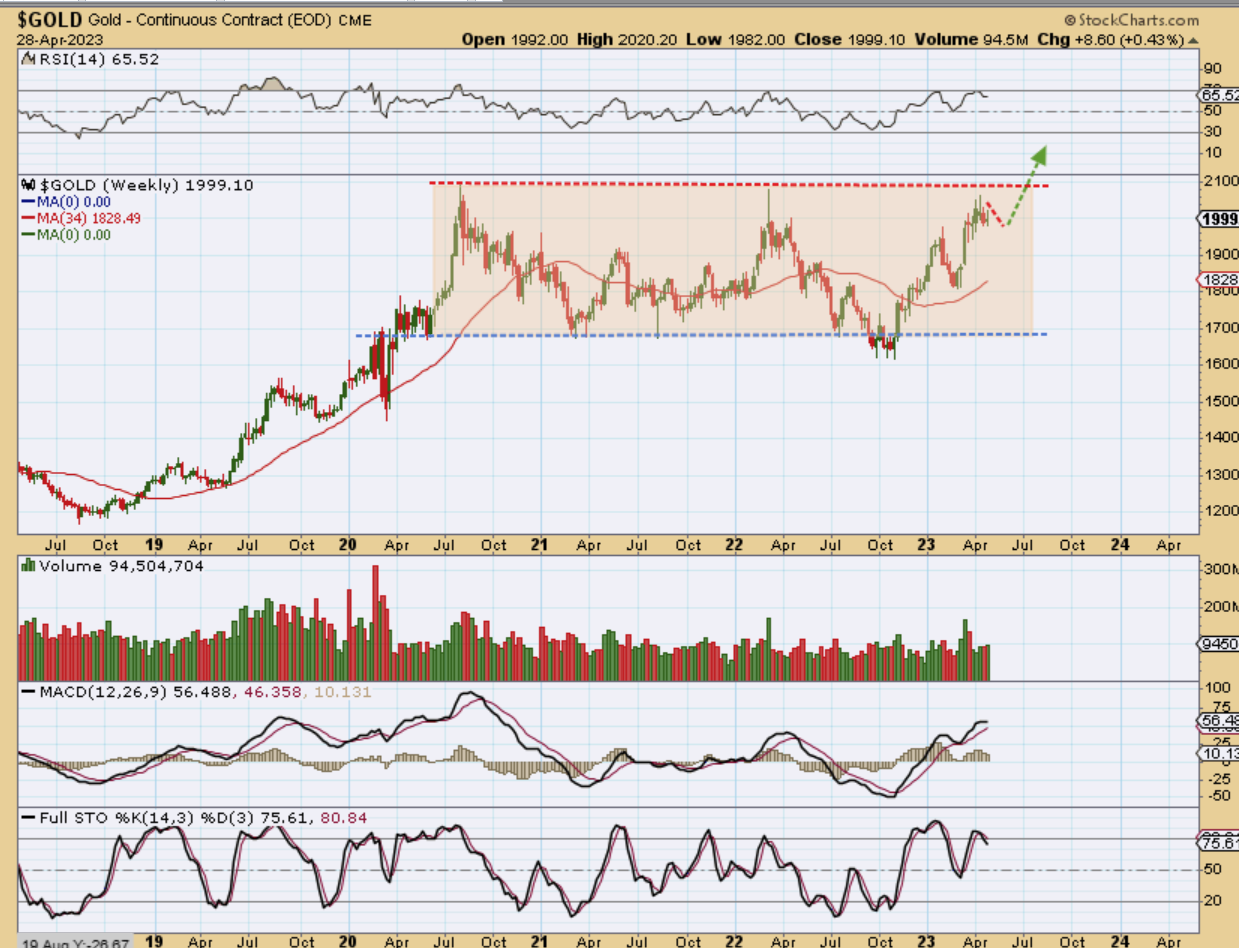
GOLD is up near the all-time highs and pausing in this area as it became due for a dcl. Sideways chop can build energy for a breakout.
.
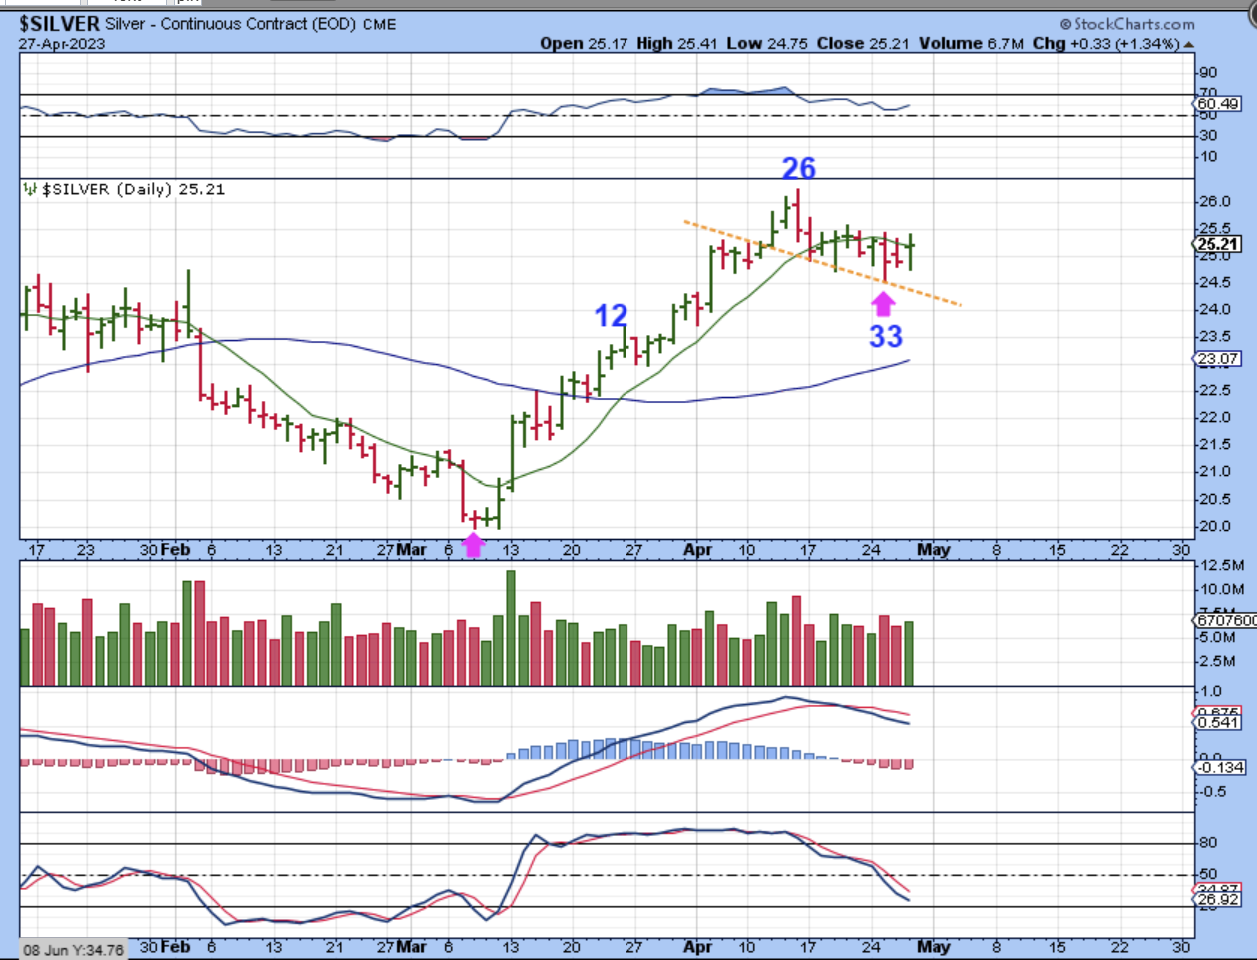
From Fridays report, THE SILVER DAILY: Silver is due for a dcl. Day 33 may be that dcl. The pull back has been very minimal, very bullish, so I would guess that the Silver stocks would do very well on the next rally.
.
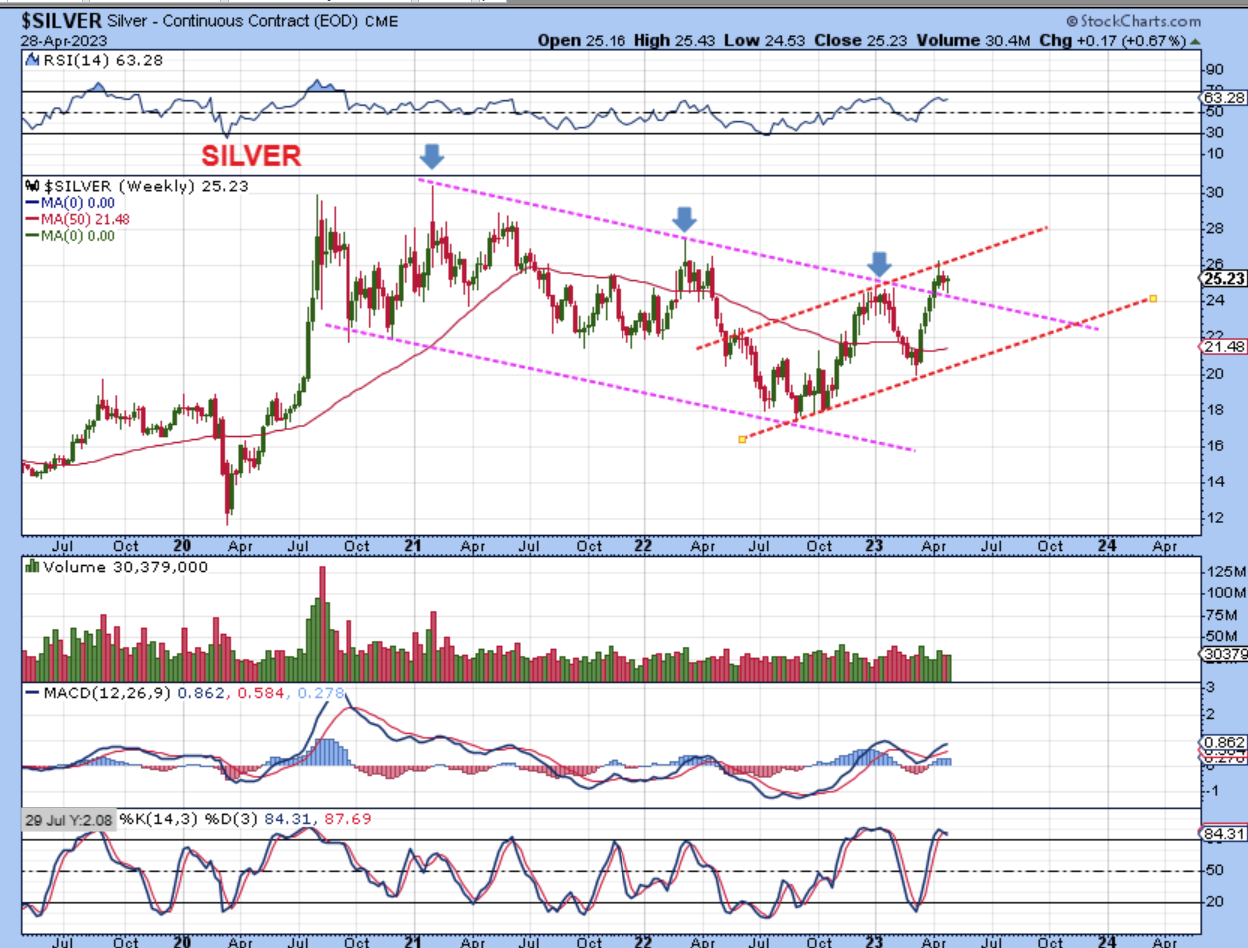
SILVER WEEKLY – Silver broke out from a downtrend and this weeks dip to find a dcl on day 33 caused a back test. If we just got a dcl on the daily chart, Silver should push higher to prior highs, but…
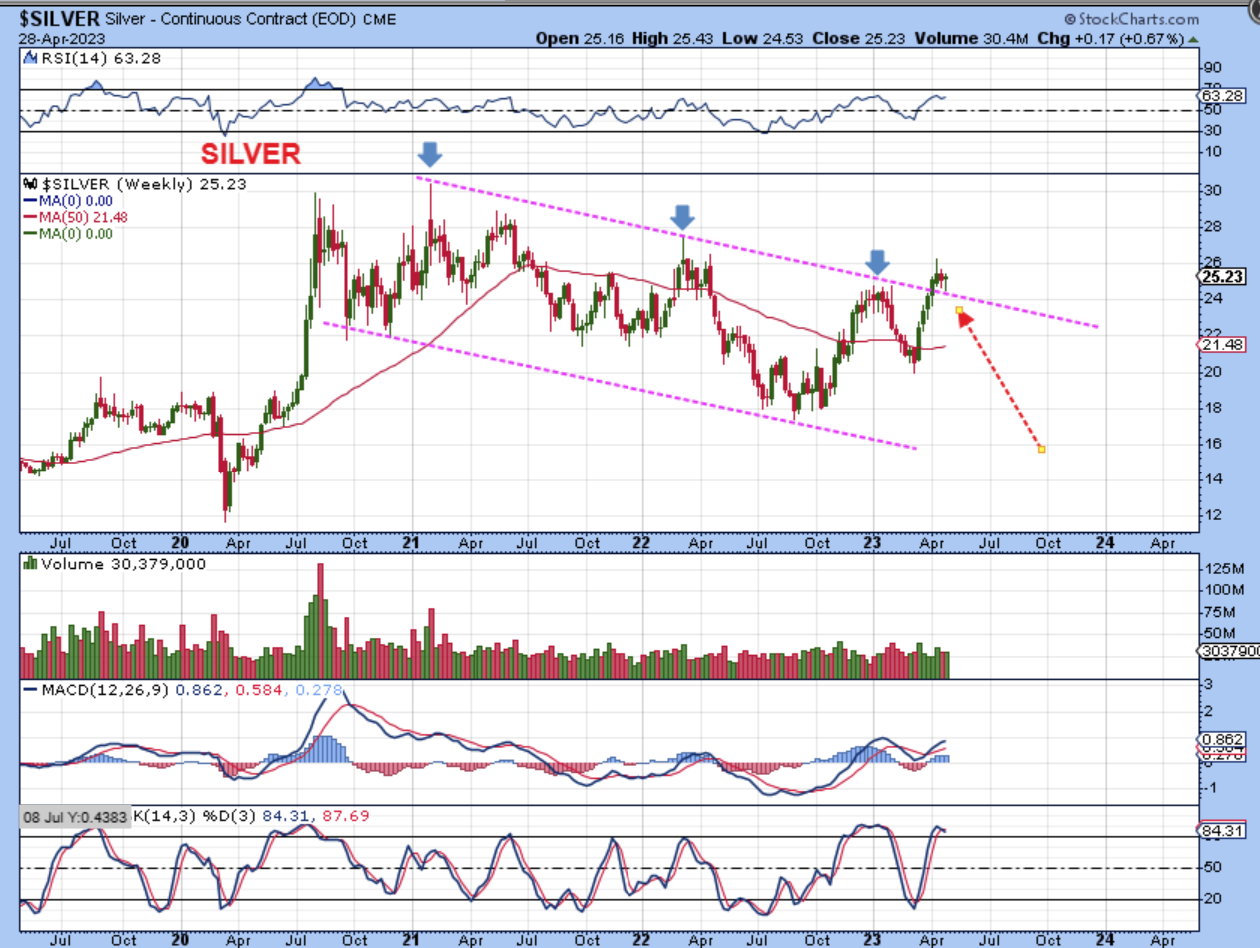
SILVER – Will silver just ‘chop’ higher, running along the upper trend line that just formed? Or will it blast through and leave this behind as a basing pattern? Stay tuned.
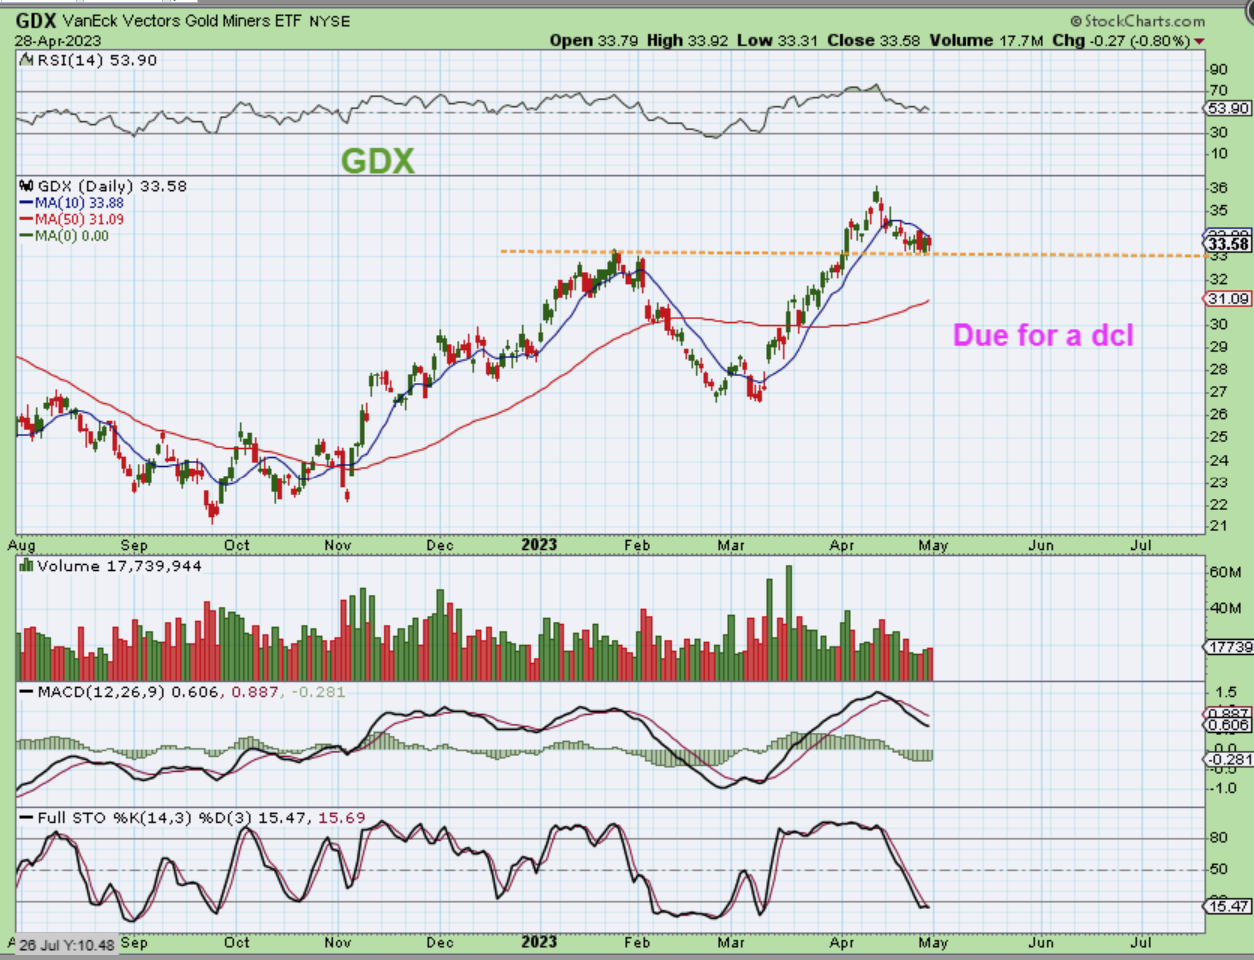
THE GDX daily is due for a dcl right now. A move above that 10 sma should signal that the lows are in place. That means that instead of a deeper dcl, it may have simply back tested the prior January highs. Notice that the RSI pulled back to 50% and the Stochastics made it to oversold. This is textbook bullish price action so far.
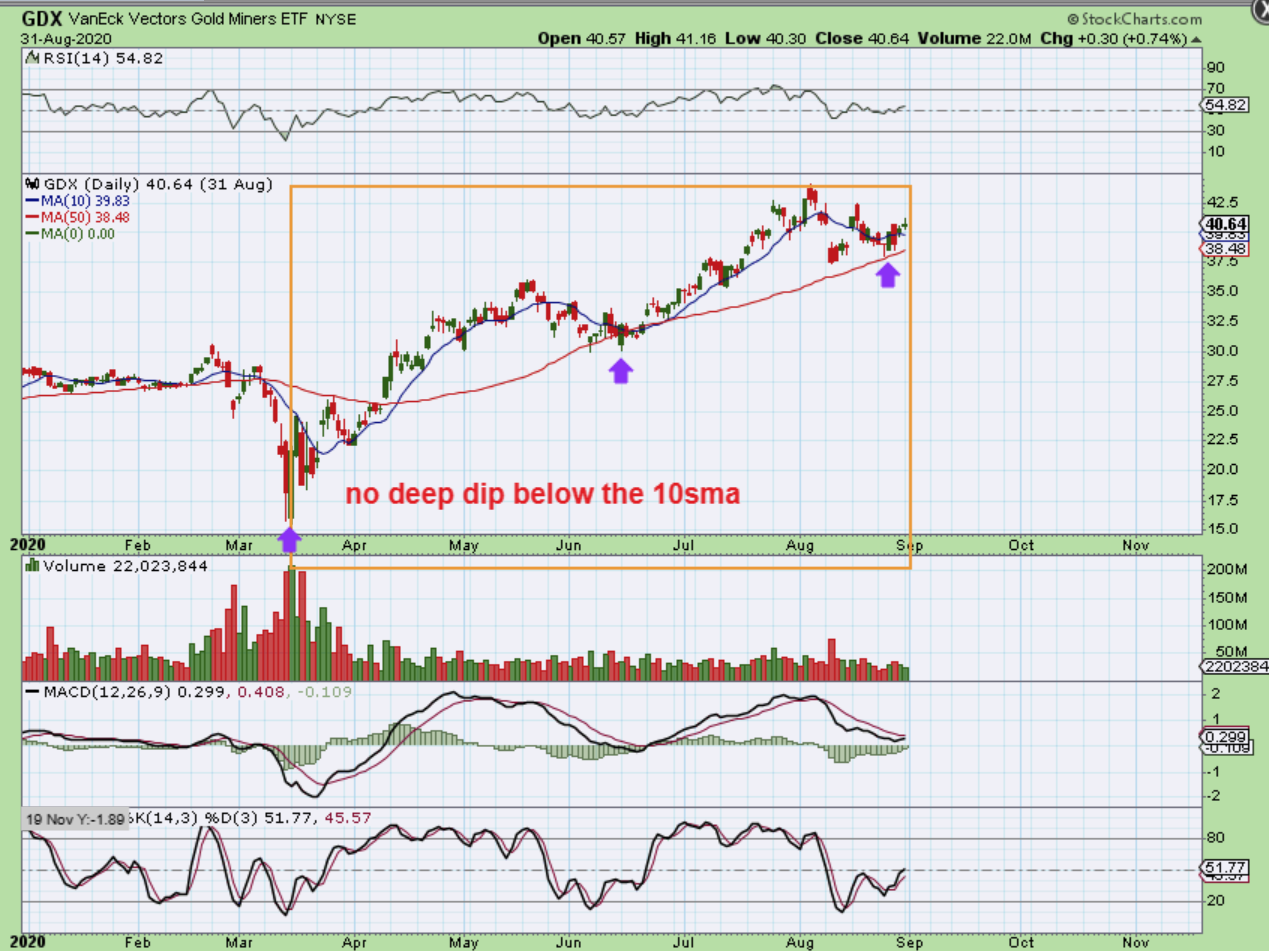
THE GDX WEEKLY CHART shows a doji, but with a dcl likely in place, this should run higher on Fed Week, and as you can see, it has room to run. Some may think that this dip was too shallow to be a dcl, but when I look at the run from 2020 March to August, I hardly see 4 visible DCLs, but we should have roughly 1 per month during that time.
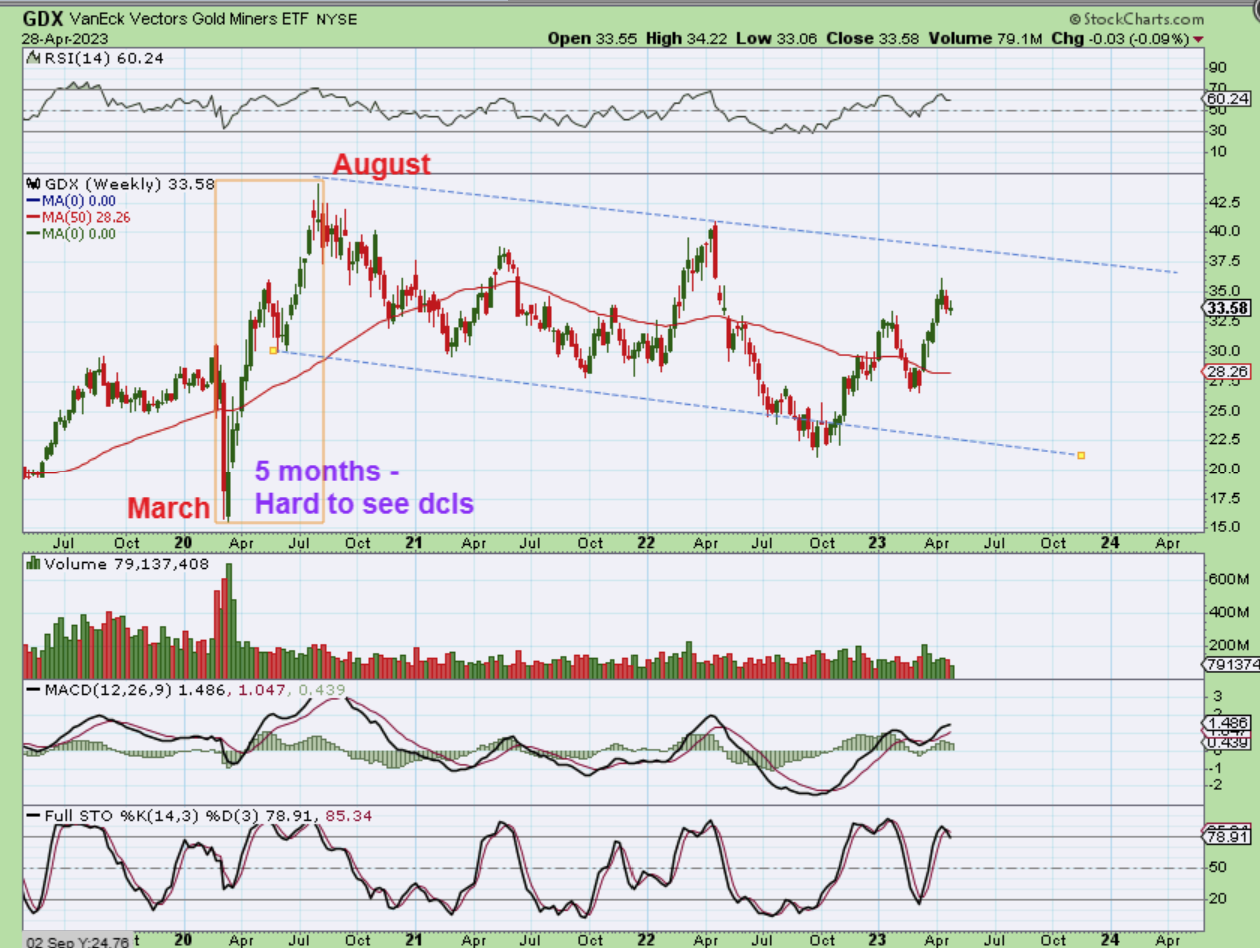
So when I look at that time with a daily chart, I also do not see deep dips each month below the 10sma for dcls, except for in June & August.
.
Over the past several weeks and even months these charts have become more and more bullish with the follow through. The weekend reports have consistently been saying that things are bullish, with the occasional dips into dcls. With that, we have at times definitely seen choppiness, which can be frustrating and difficult, and that has been what we had this week with Silver and the Miners seeking out a dcl. With that choppiness, however, this weekend report remains bullish and the Choppiness that we saw this week in Gold , Silver, and The Miners should be due to come to an end. Why? We are now in the day 33+ area for Gold, Silver, and the Miners! We are looking for a dcl, and that search for dcl should come to an end now or soon…on the week of The FOMC MTG. I usually do hate the wild swings that can come with the Fed Mtgs, but things should be lined up for a low in precious metals with this one, so I look forward to seeing how things play out.
.
For now, Rest Up and Enjoy your weekend everyone!
.
~ALEX
.
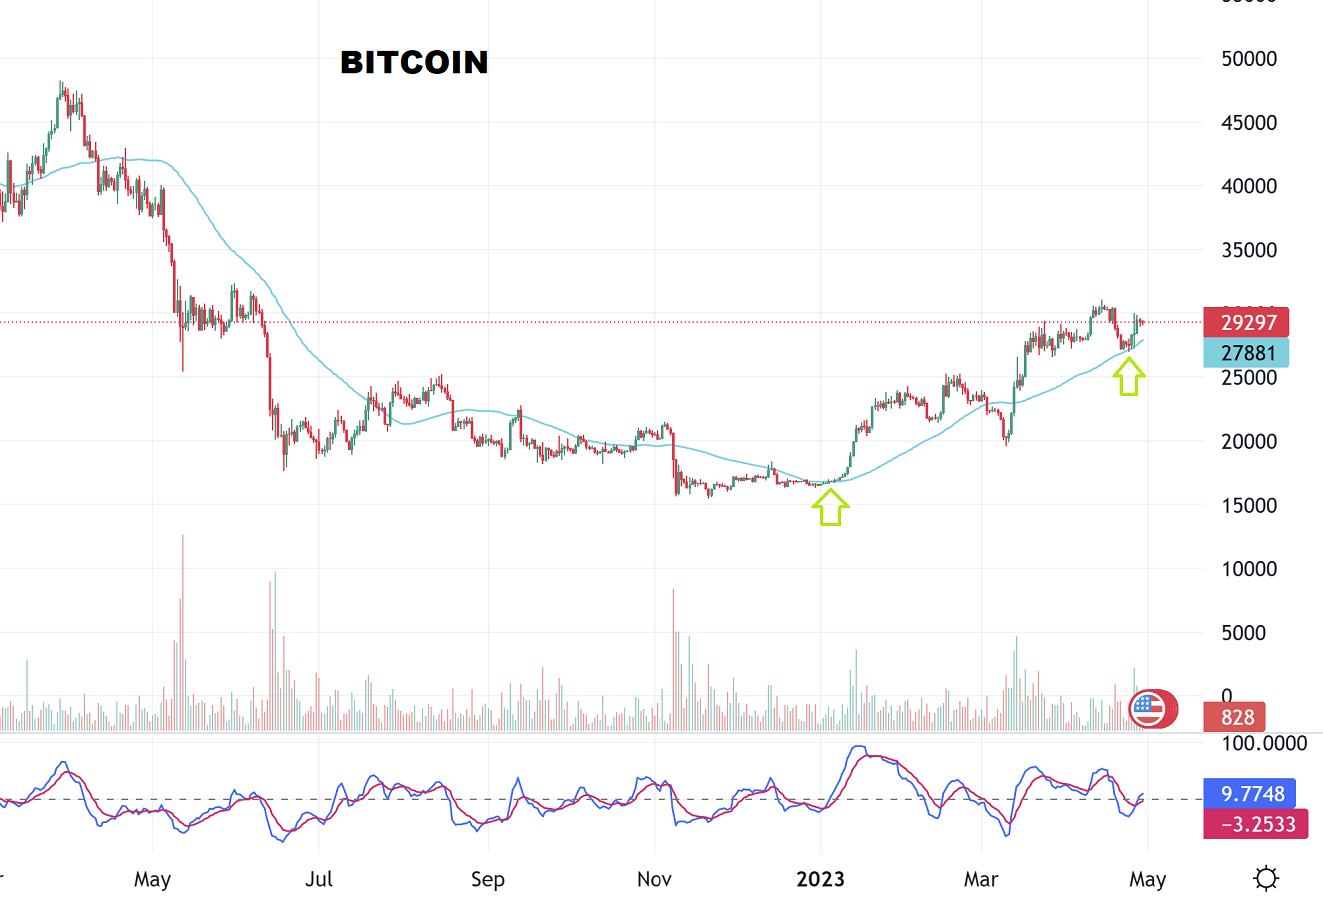
I usually expect Bitcoin to do something similar to what the General Markets do. Right now I would expect it to continue higher to $35,000 as mentioned in past reports. I have had charts of MARA, RIOT, HUT, CLSK, BITF, etc in the reports recently. They are NOT easy to buy and hold, but that can pay off over time.