April 20th – Pullbacks
SPX– I wanted to point out prior cycle counts, just to help us to see that once the cycle got to day 25, it didn’t climb much higher. The first was the strongest and it peaked on day 42, but that peak was choppy and not much higher than peaks 23 and 34. The last daily cycle peaked on day 27, right about where we are now even though it had many days left, HOWEVER…
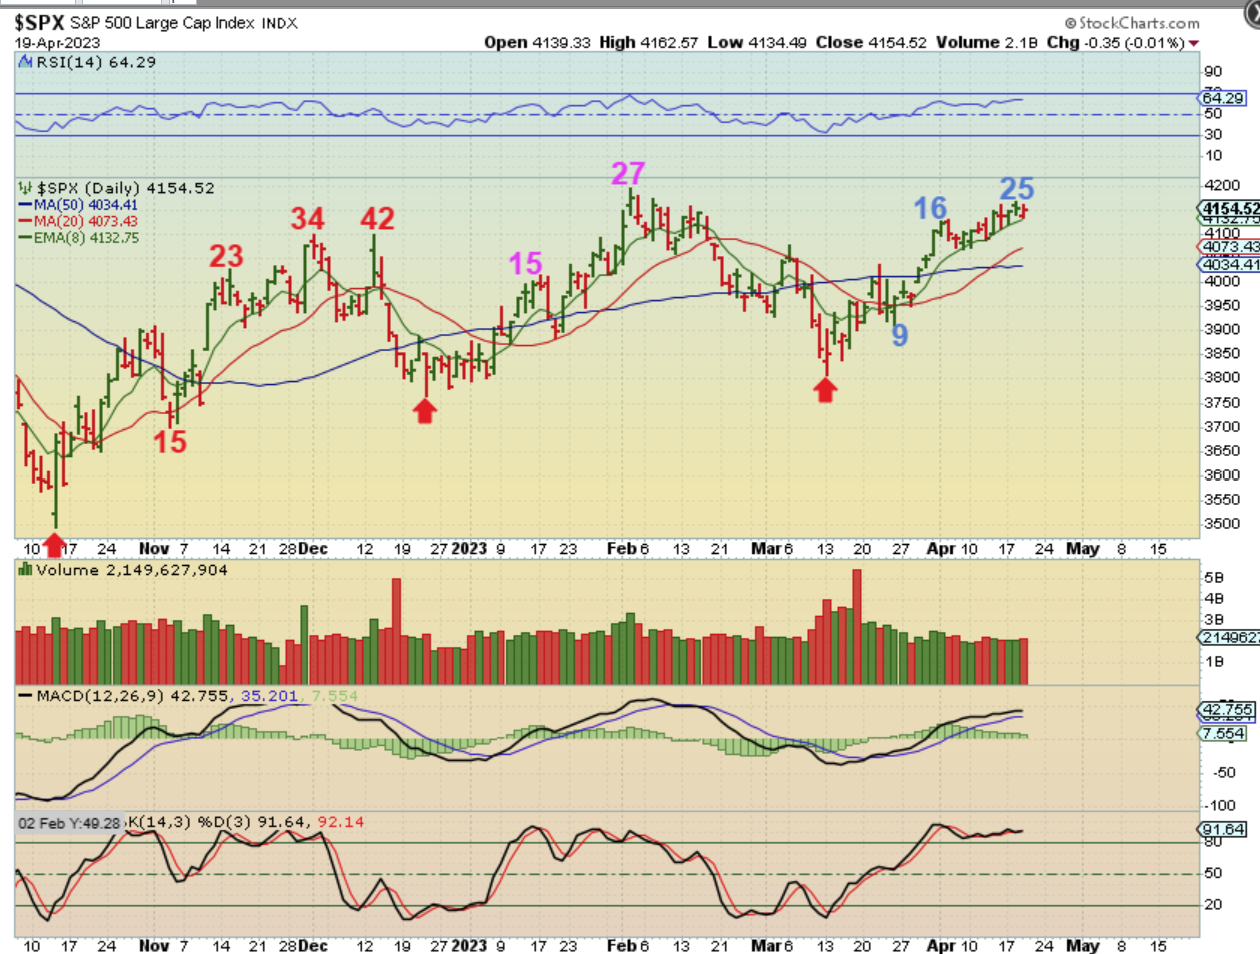
The last daily cycle peaked on day 27 right about where we are now, even though it had many days left, HOWEVER:
The drop in February -March was likely the result of the strong USD bounce out of the ICL, right? So again, all eyes on the USD, and
1. If the USD remains weak and starts to drop, We might see the markets run a bit higher.
2. If the USD continues to chop and not break down then the markets could temporarily top here. ALSO, the first and 2nd daily cycles were long ( 50 days) and this one may chop sideways and be shorter (35-40days).
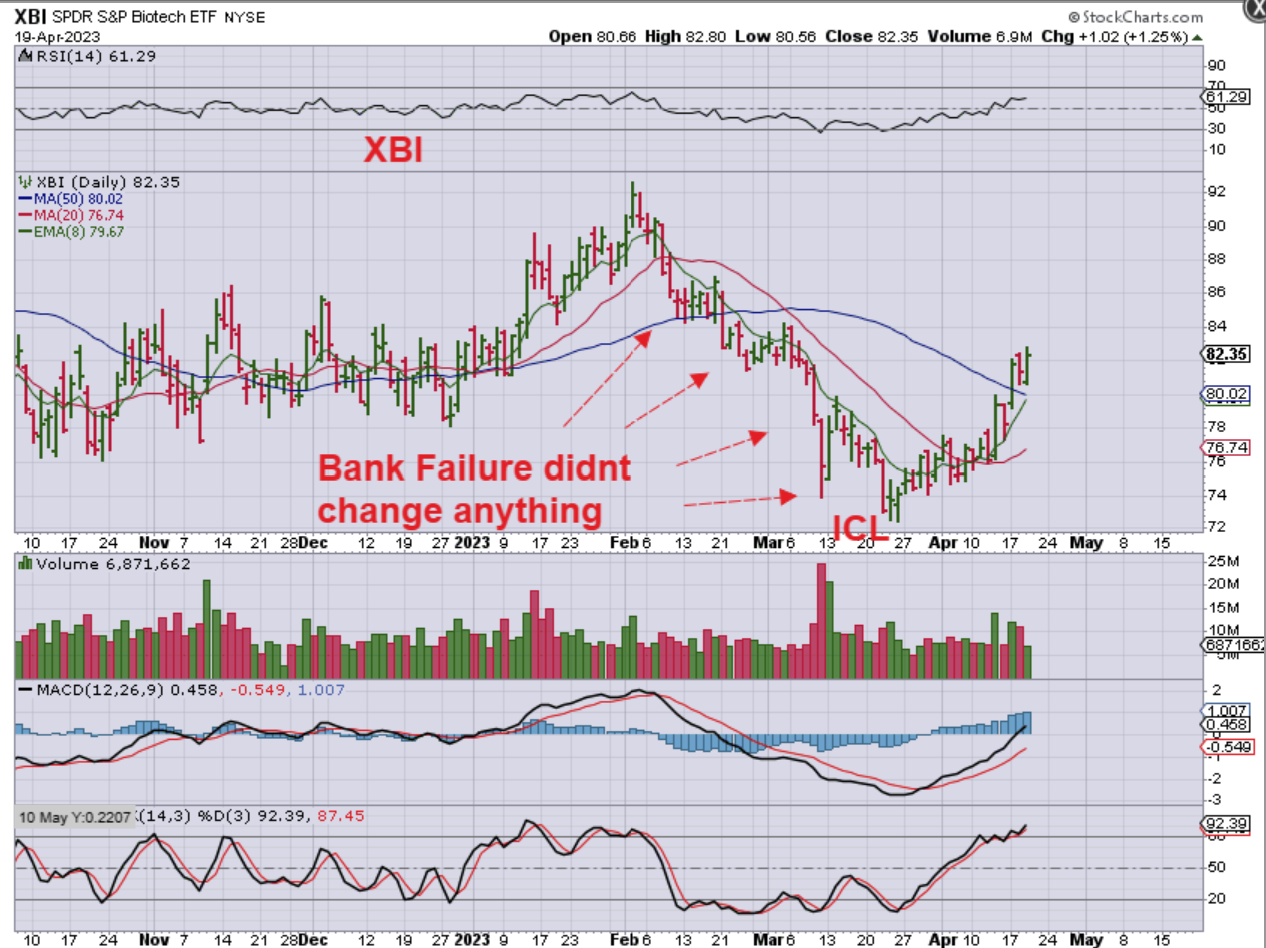
THE XBI had more of the ICL drop that I said I was looking for in the General Markets before the Banks failed and caused the drop to end. The XBI continued to drop and now it looks to have its ICL in place. So this sector is only on day 17.
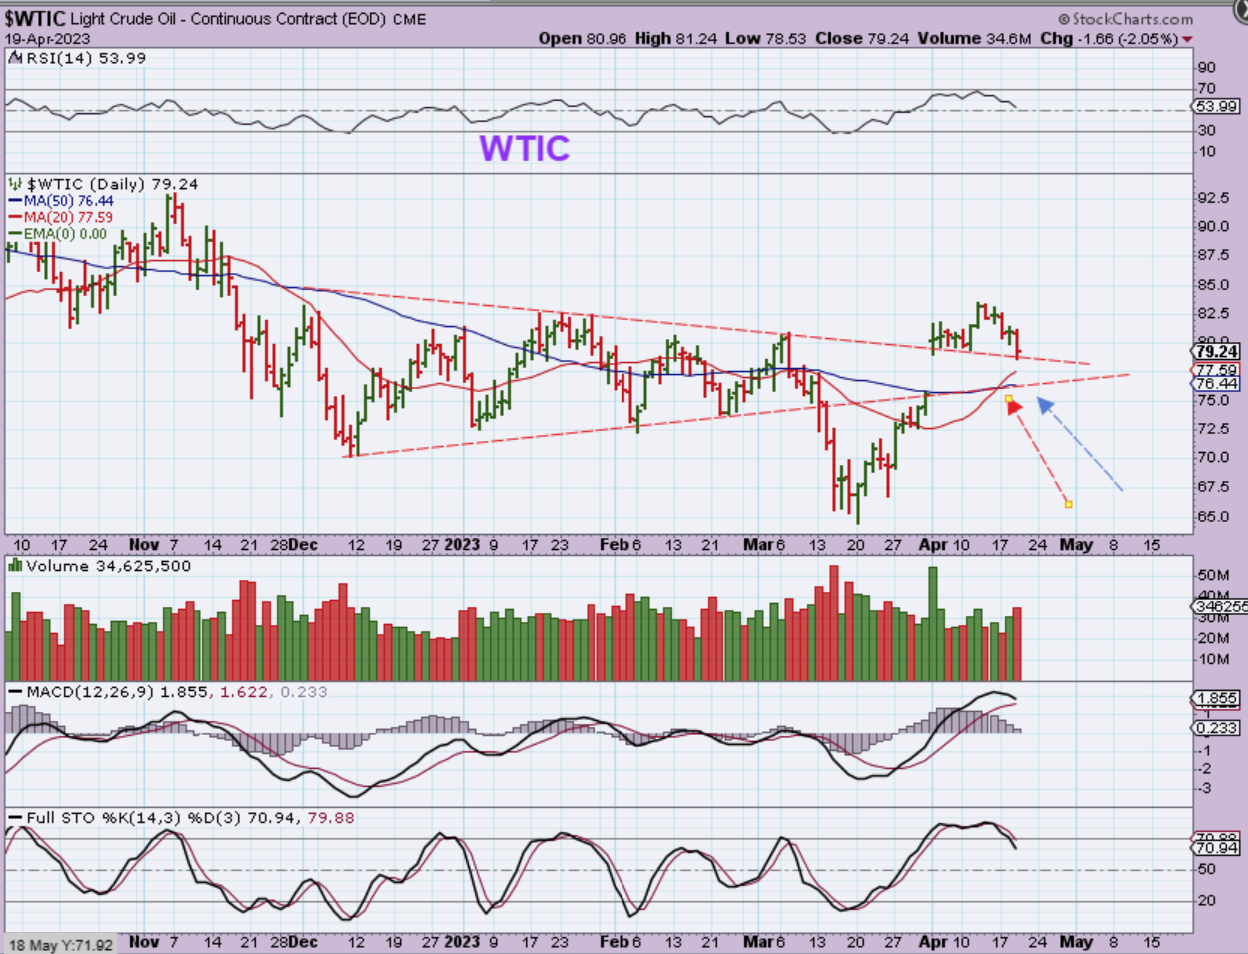
WTIC – Oil dropped after a strong Pop and sideways chop along the wedge that I had drawn. I thought that this would gap and go (higher)immediately, and I do still expect it to go higher, but we may see a gap fill here with a drop to the 20 or 50sma. That would be a buy at support if Oil reverses there. It is day 21 and Oil can have 40 day cycles, so this may just be a 1/2 cycle dip.
XOP – Oil stocks dropped and they did reverse after filling the gap. I menti0ned that Oil stocks were a buy at the higher low, so buying & holding has been working, and now this may be an area to add to positions. Let’s review an Oil stock again…
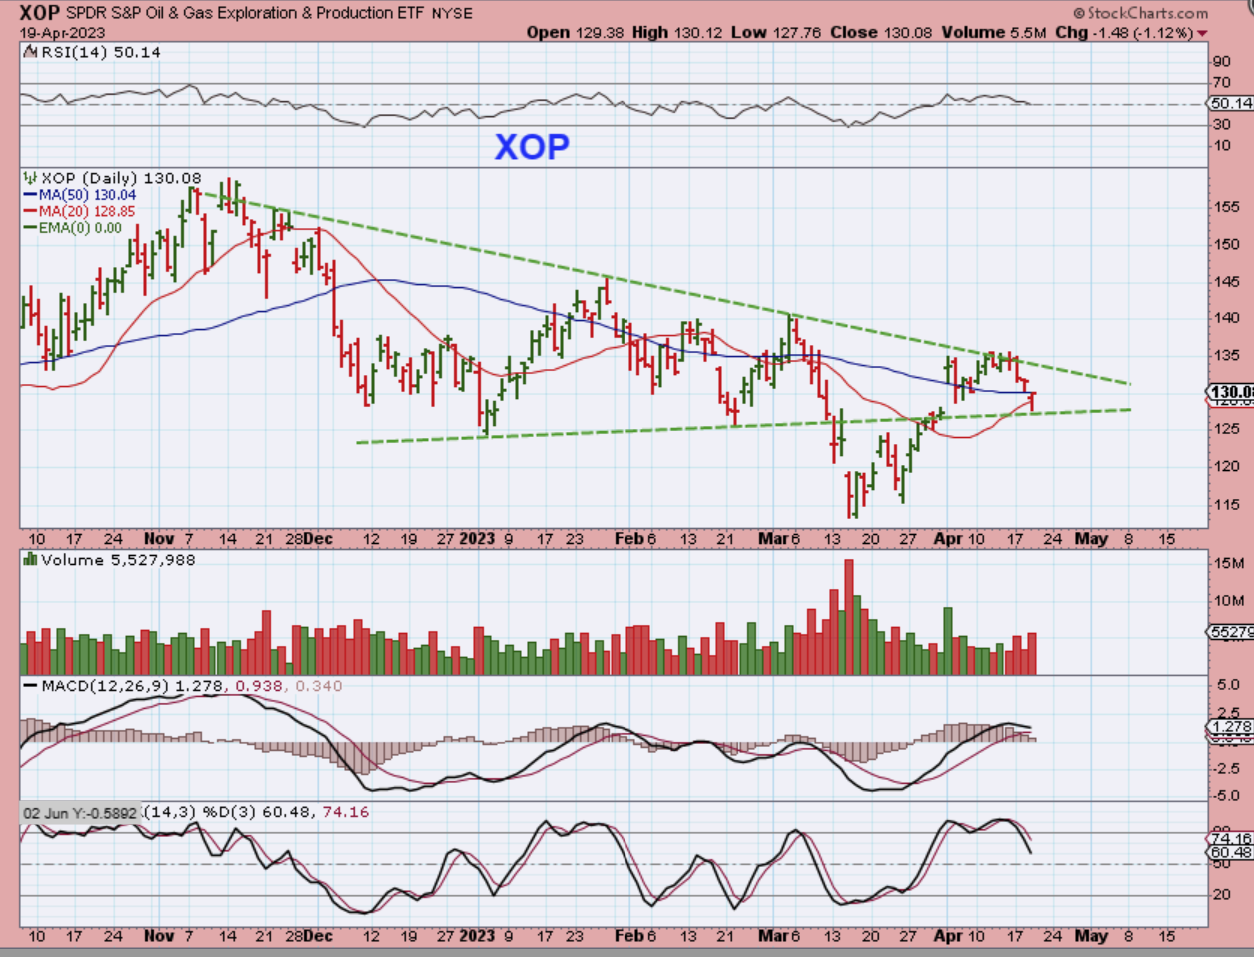
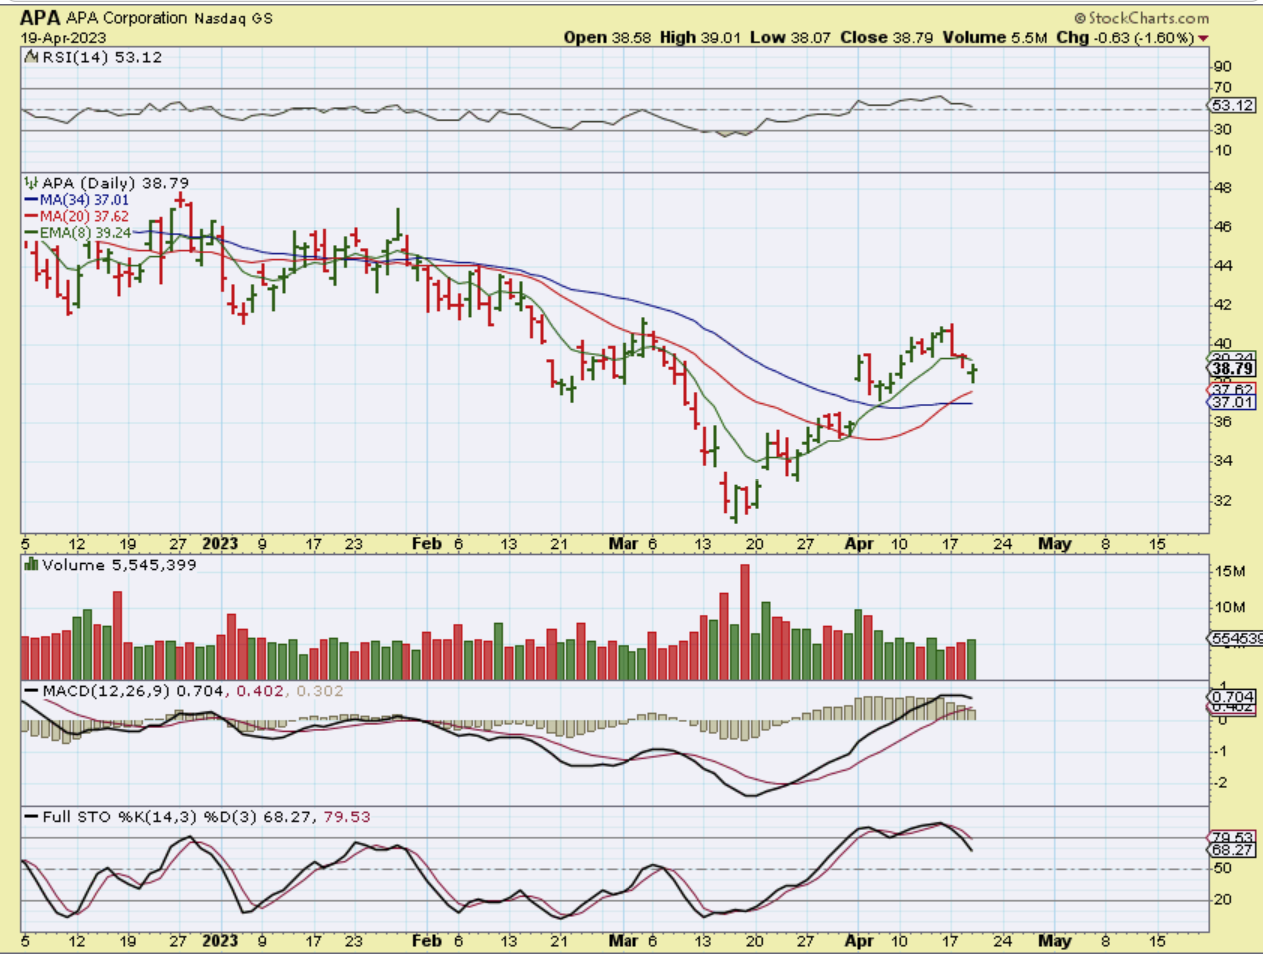
I have discussed APA, NOG, WTI, CPE, etc as Oil stocks that seemed to have bottomed. So now we see a drop to the 20, 34, & 50sma. That might be a nice place to add once you see a reversal. That would be near $37 or even in this area, because…
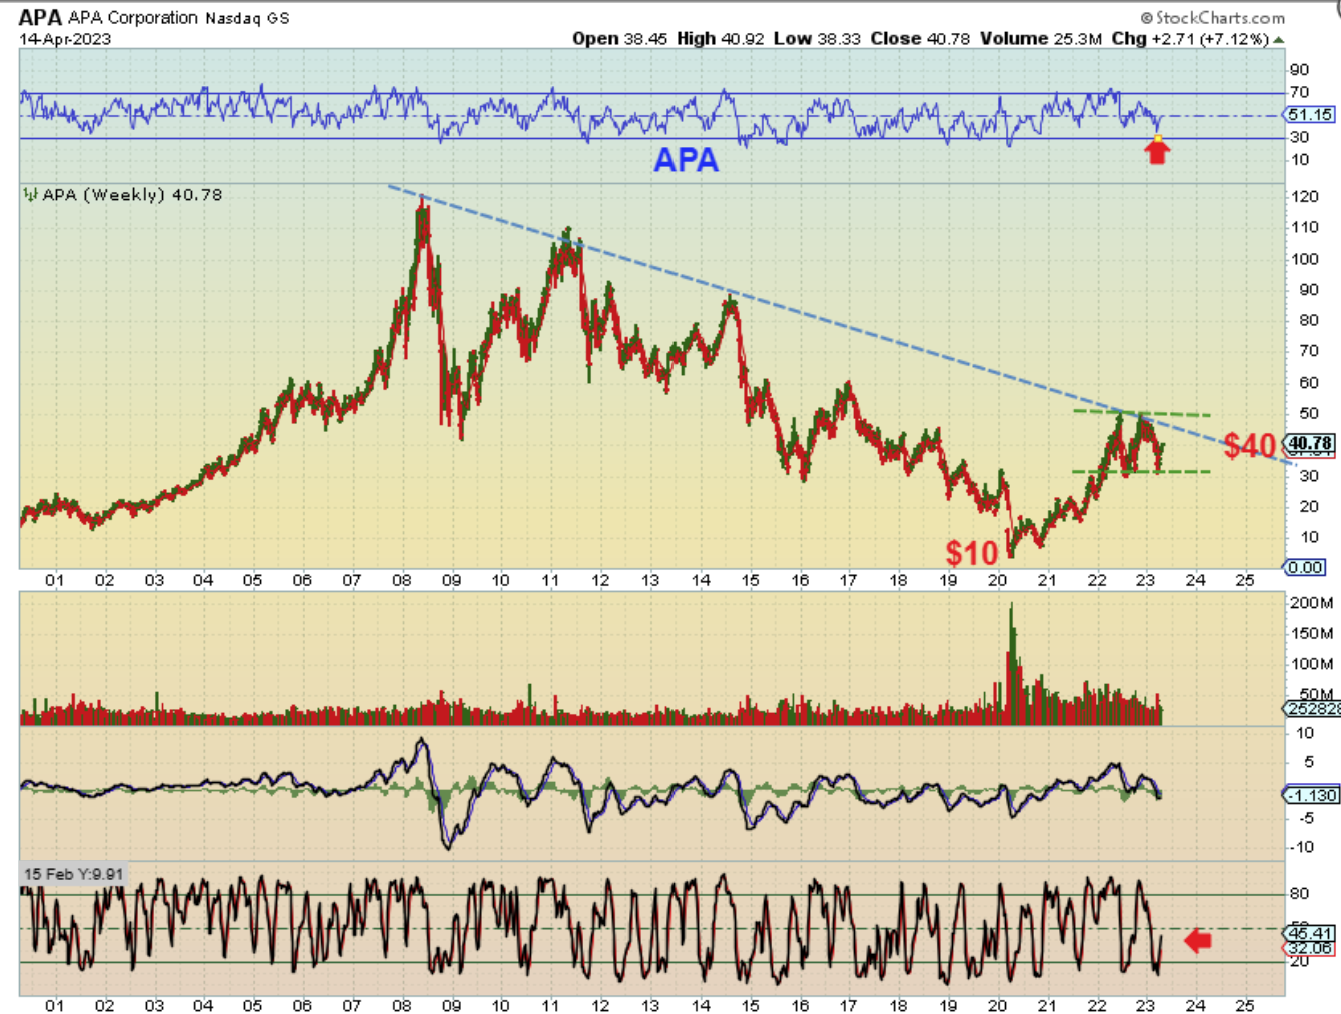
The other day I mentioned stepping back to see the Big Picture:
I pointed out the Bigger Picture for APA and mentioned that this area is a larger consolidation and it could be part of a future break out to higher price above the $50 down trend. This is good for the ‘Buy & Hold’ crew.
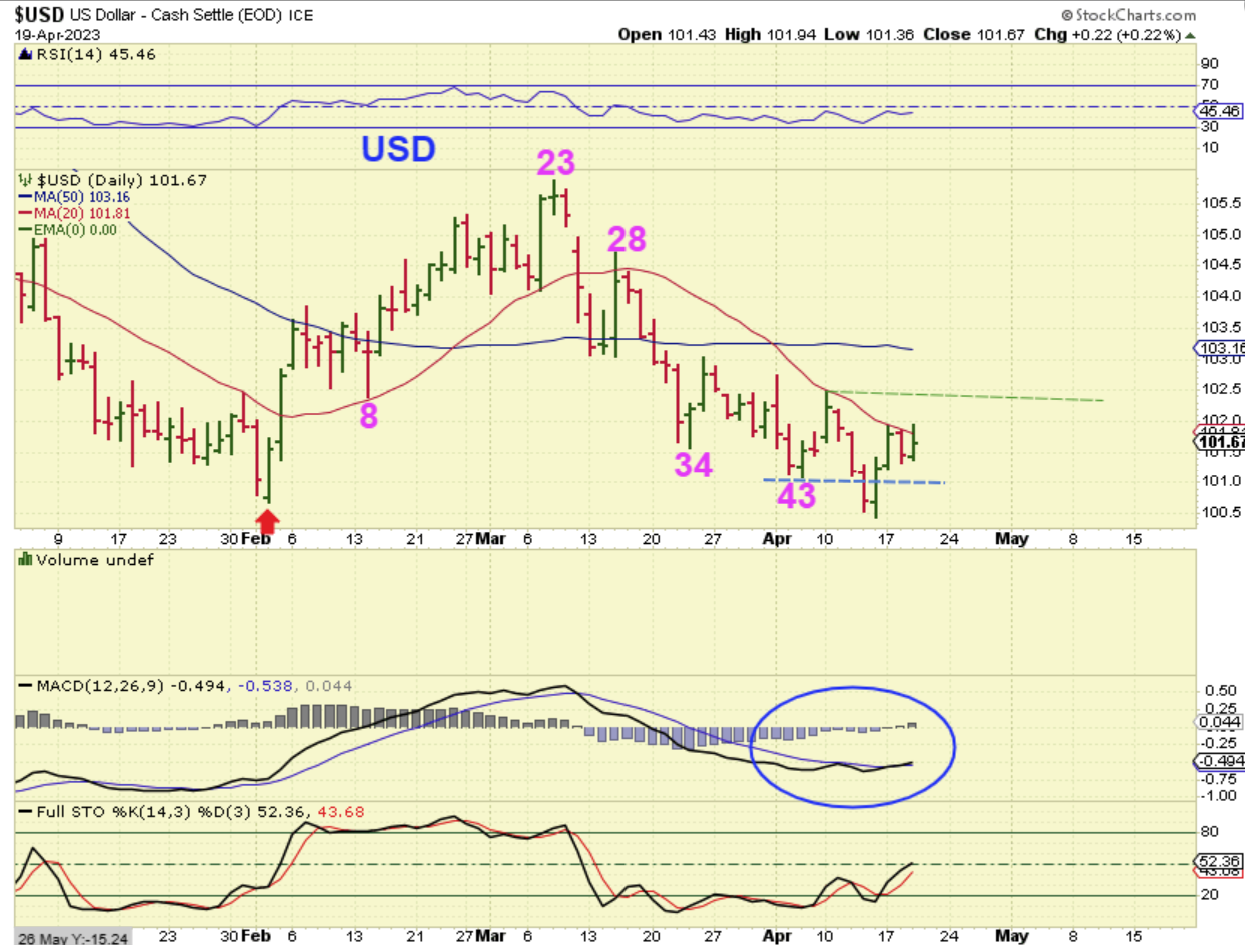
The USD must have a failed dcl , as pointed out in prior reports, especially since it broke below the ICL low. The Bank Failures may have caused a shake up, but this is just too long to be a single daily cycle.
.
I was asked if it is possible that the dcl just formed(?), but USD daily cycles are usually only roughly around 25 days long. This is getting really stretched, so I think that we had to have a dcl with a short bounce similar to the last drop. Was it day 34? was it day 43? It just has to be , in my opinion. Day 49 (the last low) is just too long for the USD and is almost what 2 daily cycles would have.
.
Same chart: So we have the USD pushing against that 20sma and trying to break higher, but…
.
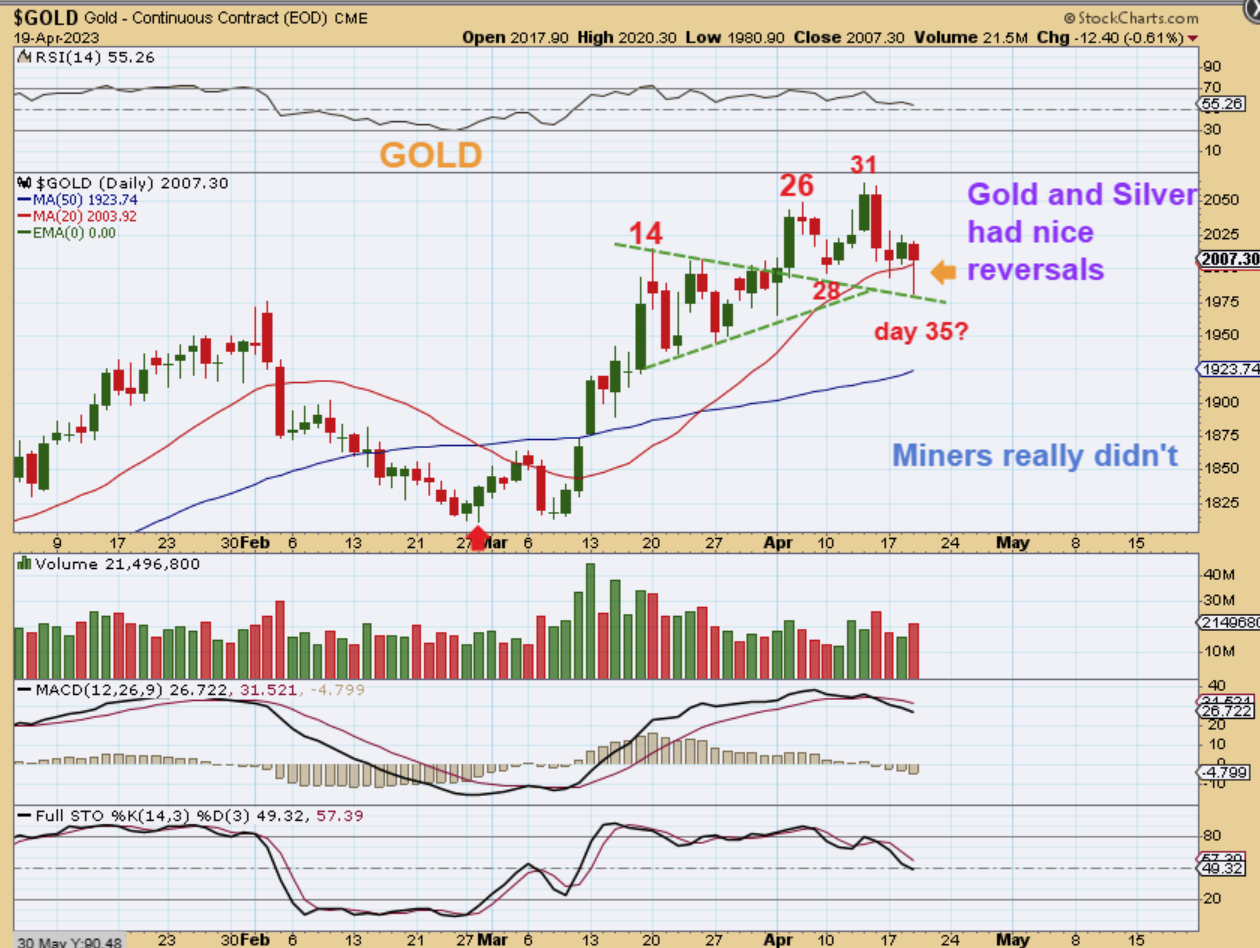
GOLD dropped and tried to recover. I thought that maybe we had an early day 28 dcl, with that triangle, but now being on day 35 would make a lot of sense too. If the USD drops this will bottom and run.
.
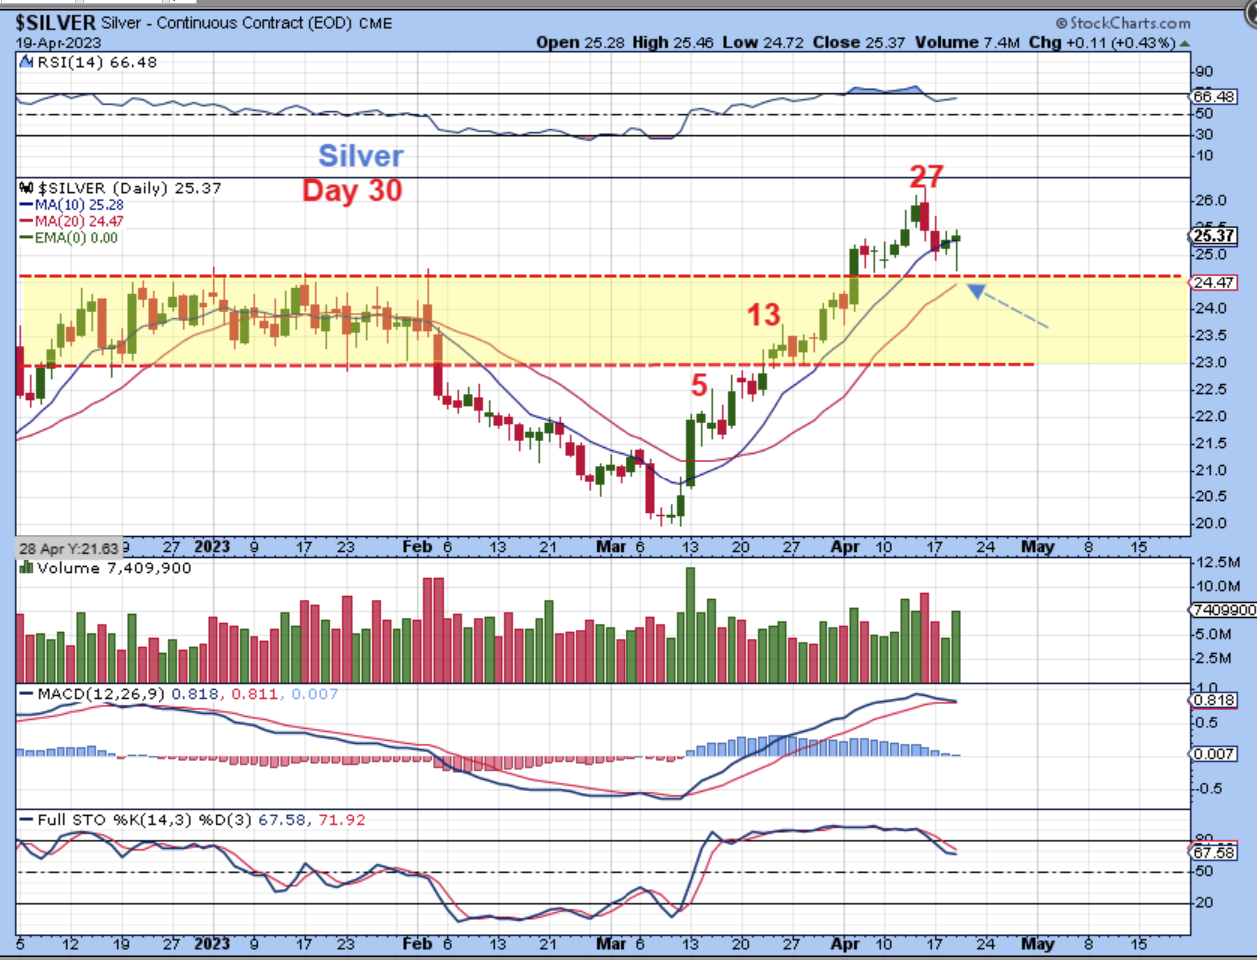
As that USD pushed higher and tried to break out above the 20sma, SILVER also dropped, but notice that it reversed to green and tried to get back above the 10sma. This is strong and was very encouraging, but it was strange that Silver Miners did not reverse and recover too. Let’s look at HL compared to Silver…
.
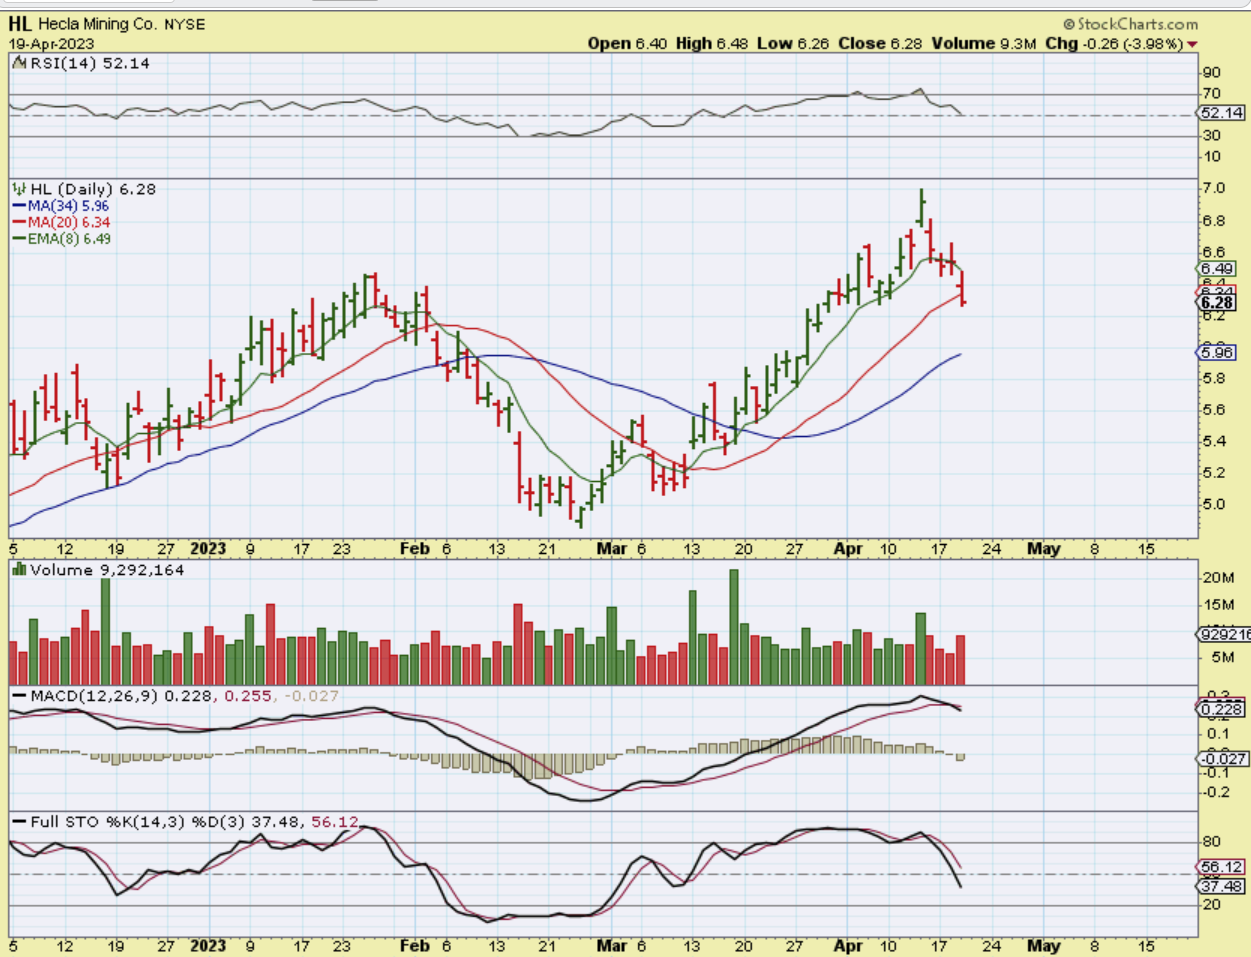
HL does not look anything like Silver, and neither does EXK, CDE, AG, etc. If I count days out of the lows, HL has been 37 days out of the lows, so maybe it is just doing its own dcl drop? Even the SPX and QQQ tried to recover to green, so I can’t really explain the weakness in Miners when SPX, QQQ, GOLD & SILVER all tried to go green. I was ready to buy Miners when Gold & Silver started to recover, but I didn’t see strength.
.
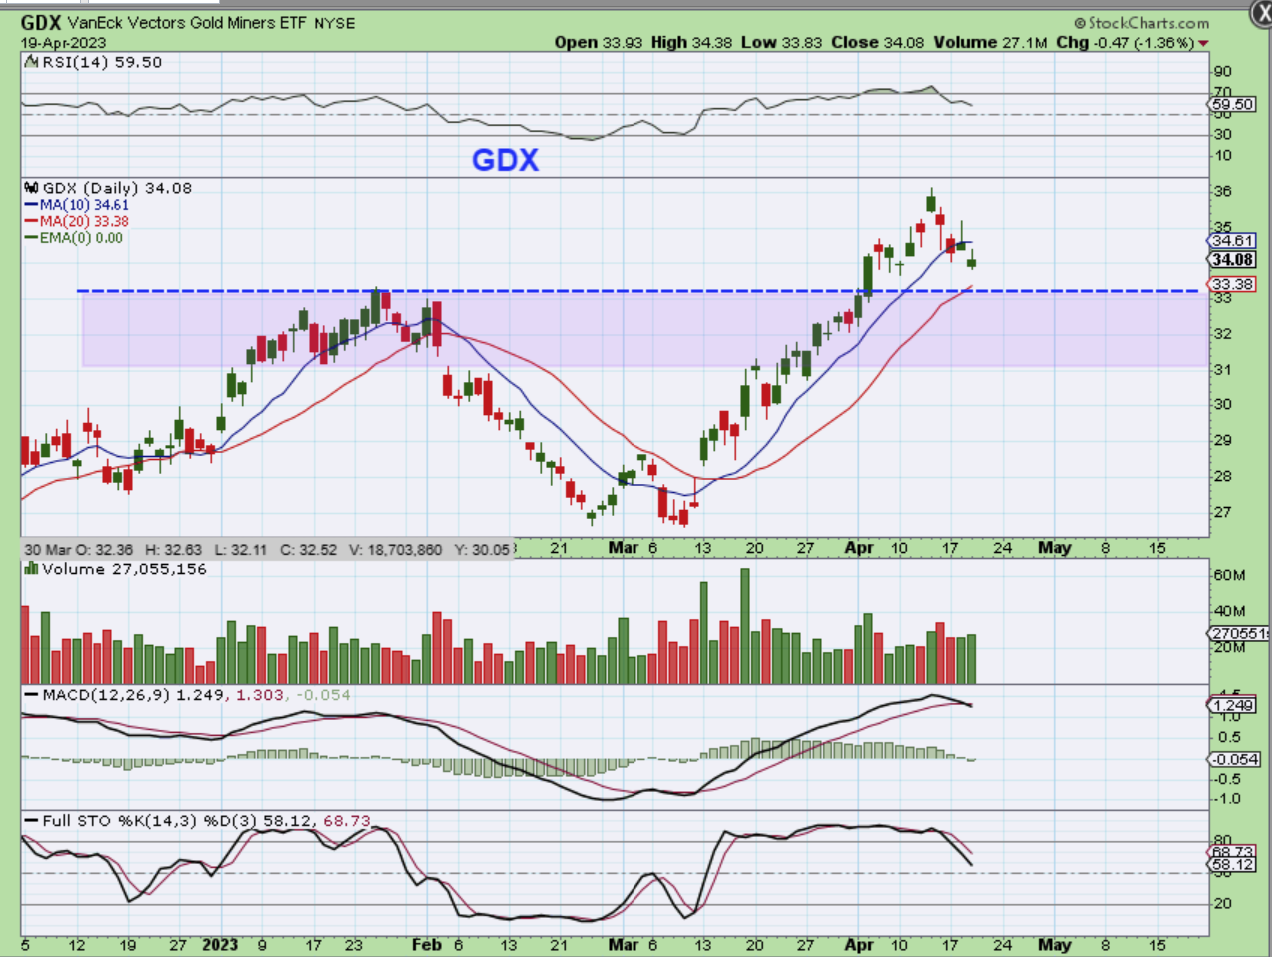
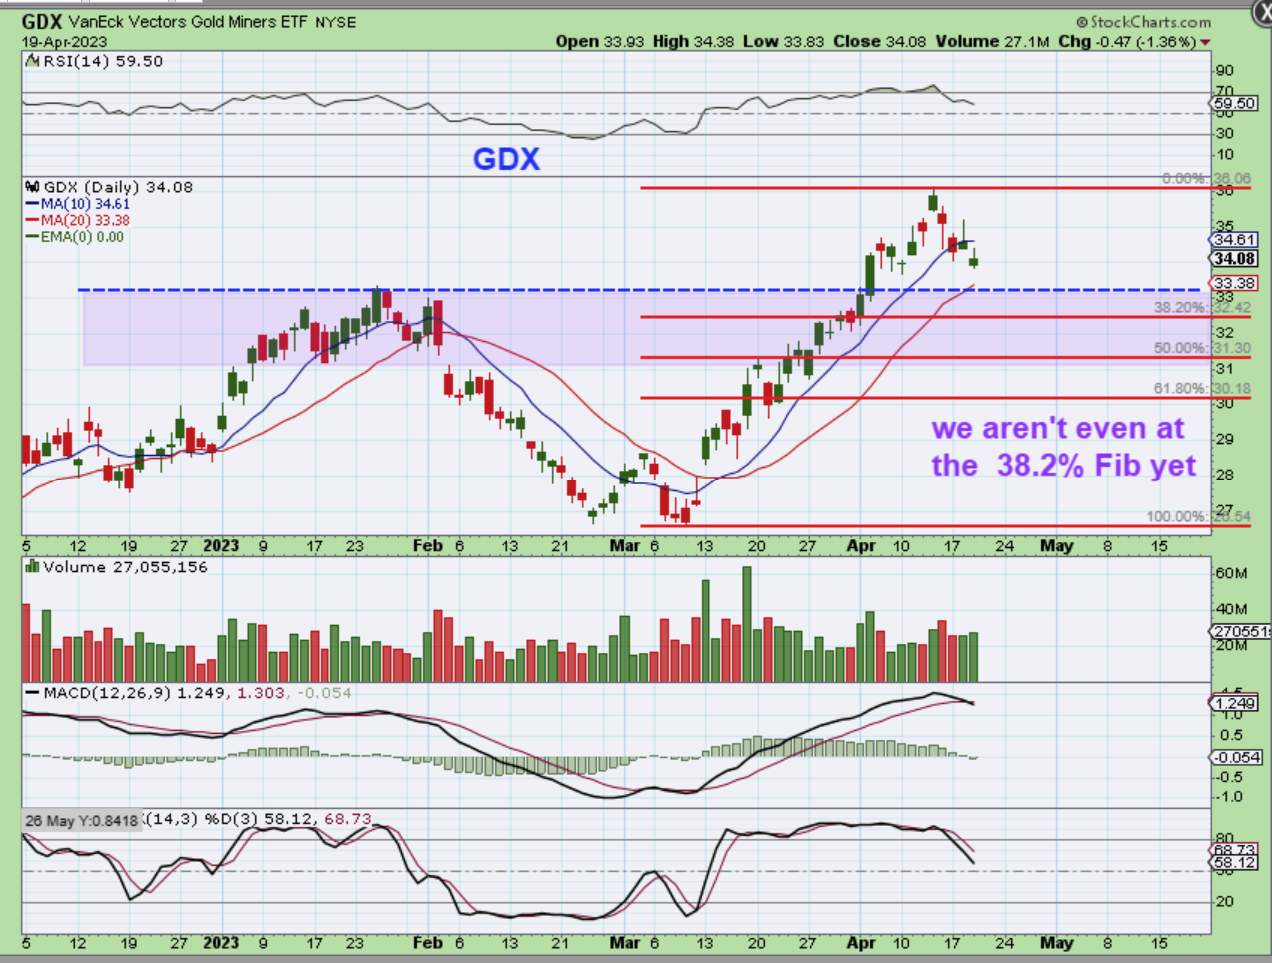
GDX did not recover either. Is it dropping to the 20 sma and that support level? I did notice that…
.
THE GDX hasn’t even dropped to a normal 38% Fib retrace, and that would be a drop to support and the 20sma, so my eyes are on that area for a possible reversal…
.
So like I said above, my eyes are on that GDX 20sma, support area, 38% Fib level for a possible reversal if the GDX sells down a bit more on Thursday. I should add that we MIGHT see a reversal above it if Gold & Silver take off, and that may be all that we get for a dip, but as I write on Wednesday evening, Gold and Silver are not doing very much. If the USD dips, these may just move higher, because Silver looked really good on Wednesday. Gold on day 35 should be a dcl too.
.
We’ll see what Thursday brings, but it seems that the USD is still affecting all sectors. It was good to see Gold and Silver reverse even though the USD looked stronger, and Silver even went green. Next we just need to start seeing some reversals or strength in Miners. Let’s see what Thursday brings our way!
..
~ALEX
.
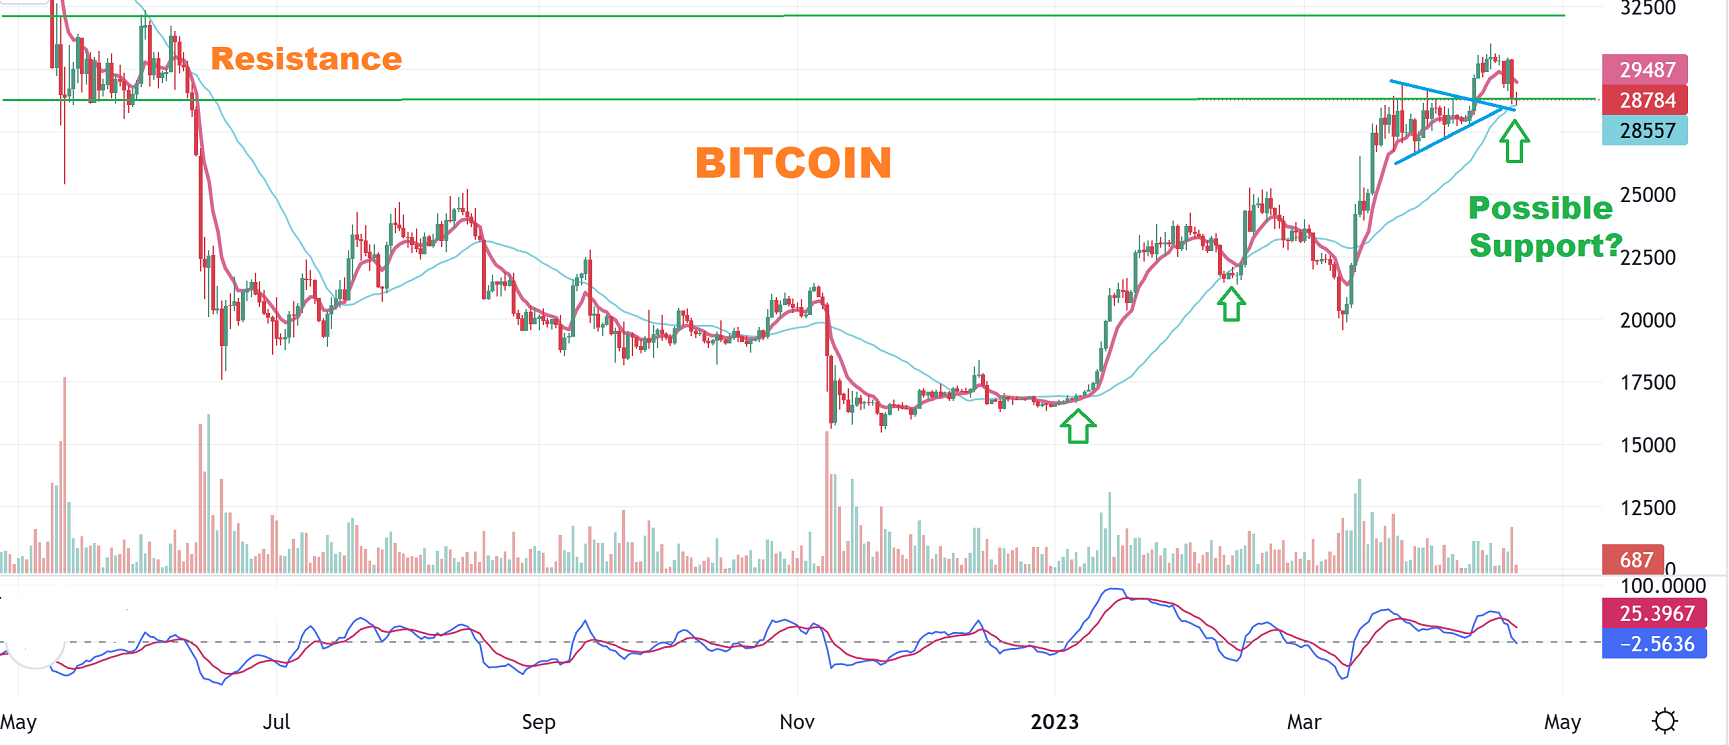
BITCOIN LIVE 7 a.m. : I also feel that BITCOIN has been performing as the opposite of the USD too. It dropped to possible support, so if the USD pulls back Bitcoin will likely move higher. As pointed out recently, Bitcoin is at a resistance area too.
BIOTECH:
.
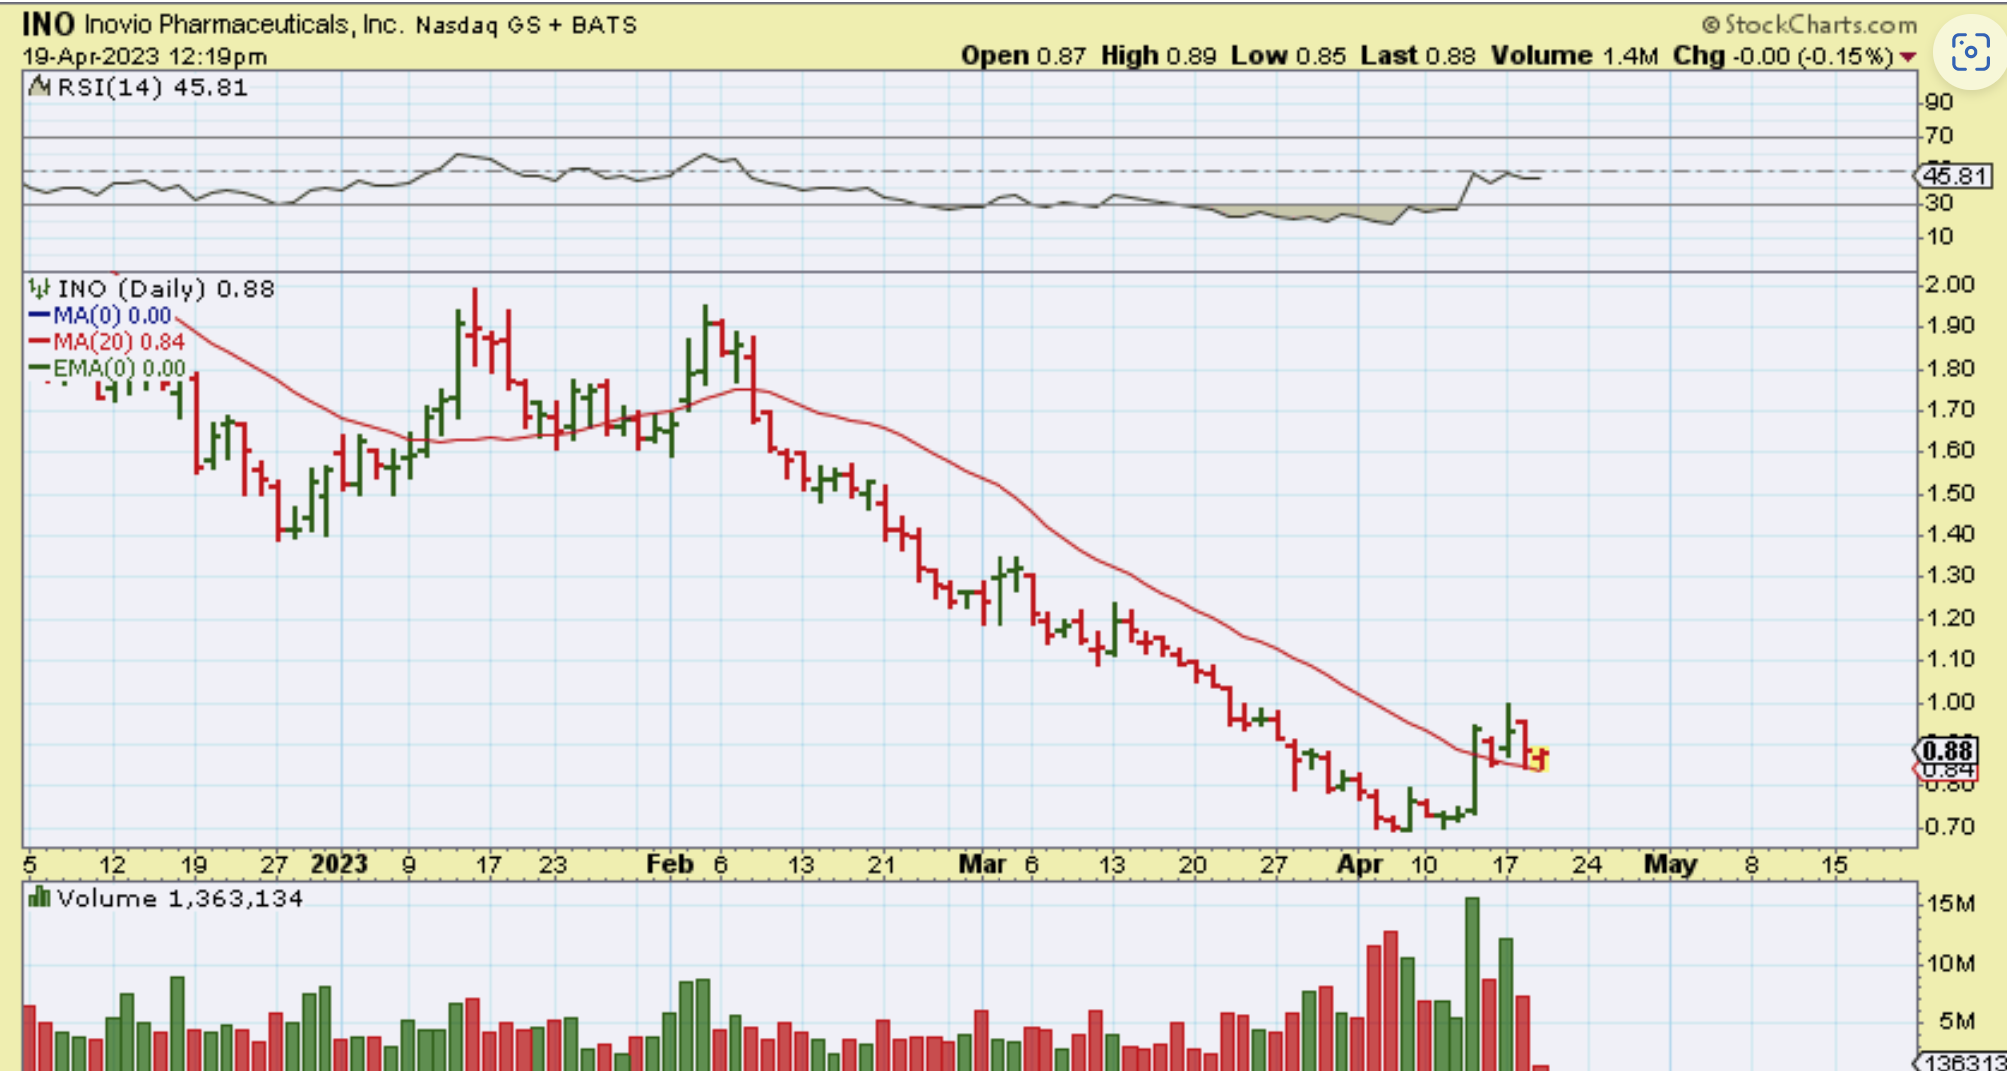
INO – I am still looking at Biotech stocks that I mentioned as possibly basing out. INO Popped nicely and now is consolidating, but I’m hoping that it pushes higher soon, rather than to make a long base.
.
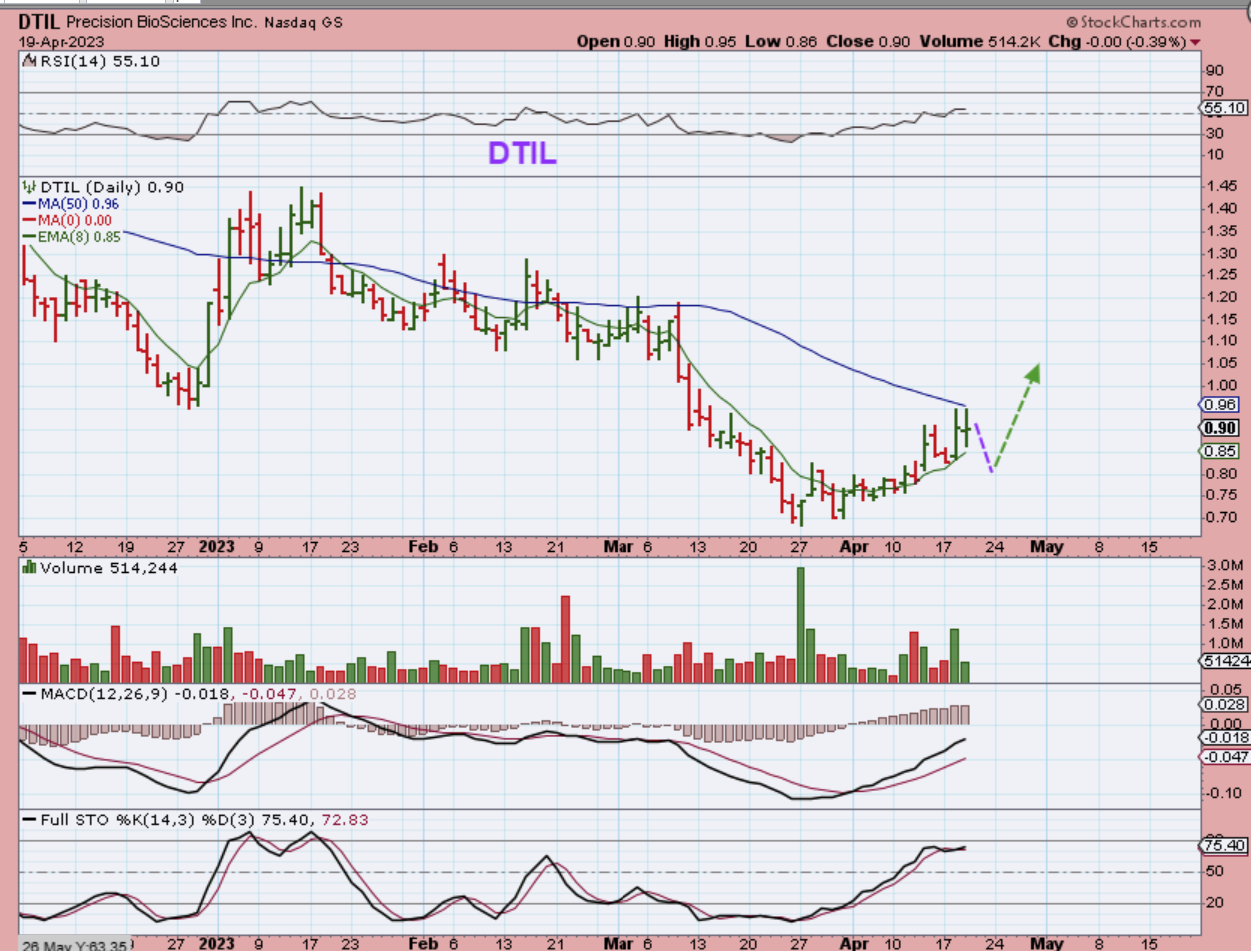
DTIL – When I looked over my watch list, it does seem like Biotech stocks have bottomed. Many, like DTIL for example, are not basing out, they are running higher out of the lows, so I am looking for laggers with increasing volume pops. I may add some to tomorrows report, but they are still choppy and buying the ‘Higher low’ may be easier.