WEEKEND REPORT: December 12th, 2020
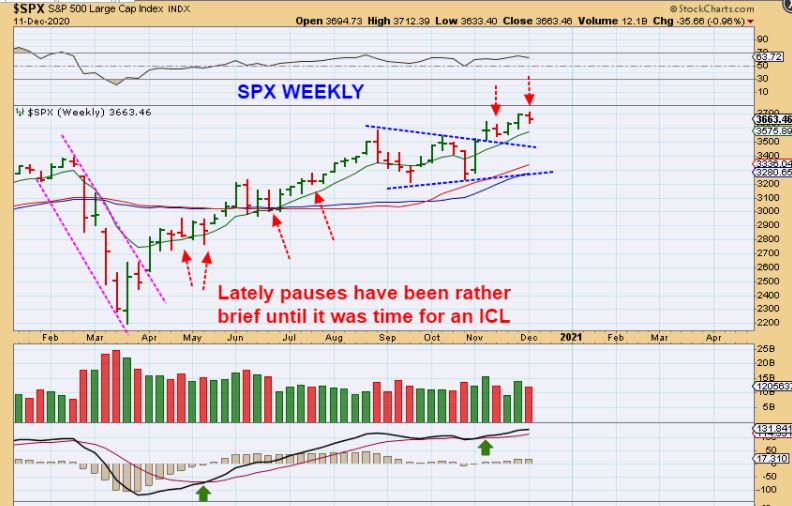
SPX WEEKLY – After the break out from the blue triangle, we had a pause this week. Here I am just pointing out that at times these dips can just be brief 1 week events, as seen in the past. If we were to drop into a dcl though, that dip could do a back test of that blue triangle. I have mentioned that the Greed / Fear index at 91 shows greed & the Put Call Ratio was at levels that became ‘the short term highs’ in the past.
.
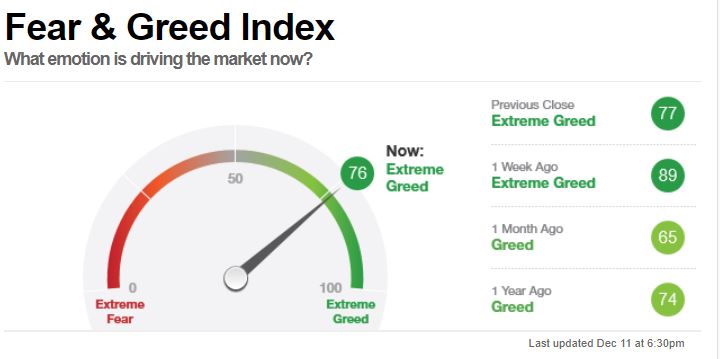
The recent choppiness & dip this week caused that Greed / Fear index to drop from 91 to 76, so this is saying that the uncertainty is having a positive reaction.
,
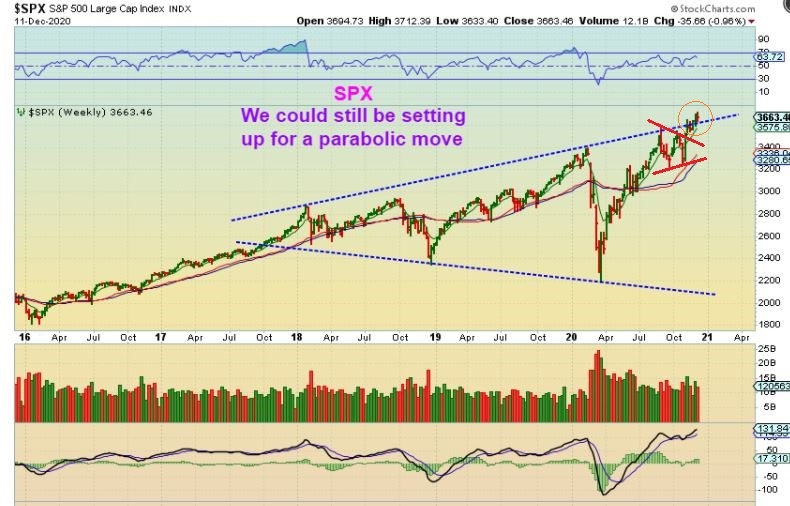
The Bigger Picture SPX Weekly – The smaller triangle break out leads us to a bigger megaphone break out too. This can lead to a parabolic run higher if its not a false break out. A parabolic run can have shallow dips and massive rallies.
,
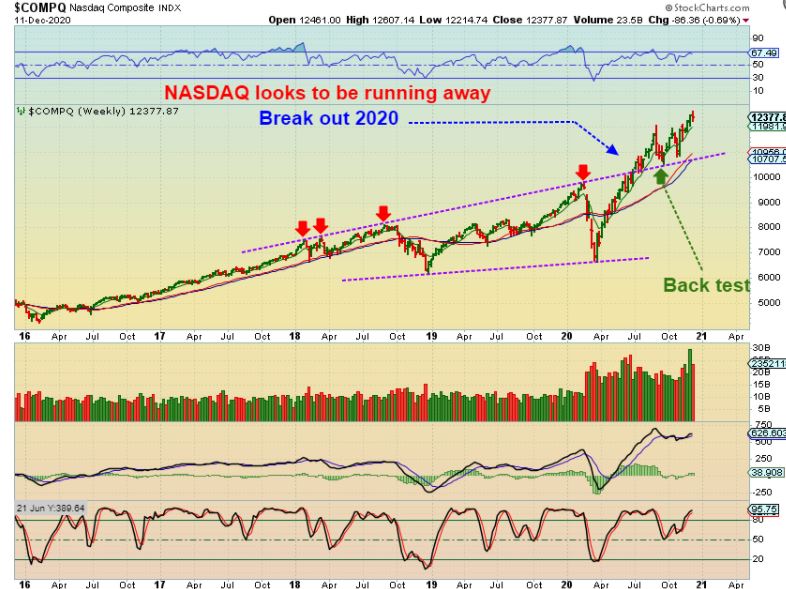
NASDAQ WEEKLY – The Nasdaq has already broken out & back tested that break. This too shows signs up entering a possible melt up phase- a very bullish bubble forming run.
,
SAME CHART but Take note of this on the chart: After the Market crash, The year 2020, as troubled as it has been, has had a big straight up move compared to all of the other years of gradually climbing higher. This is why I feel that we might have entered a straight up blow off top phase.
.
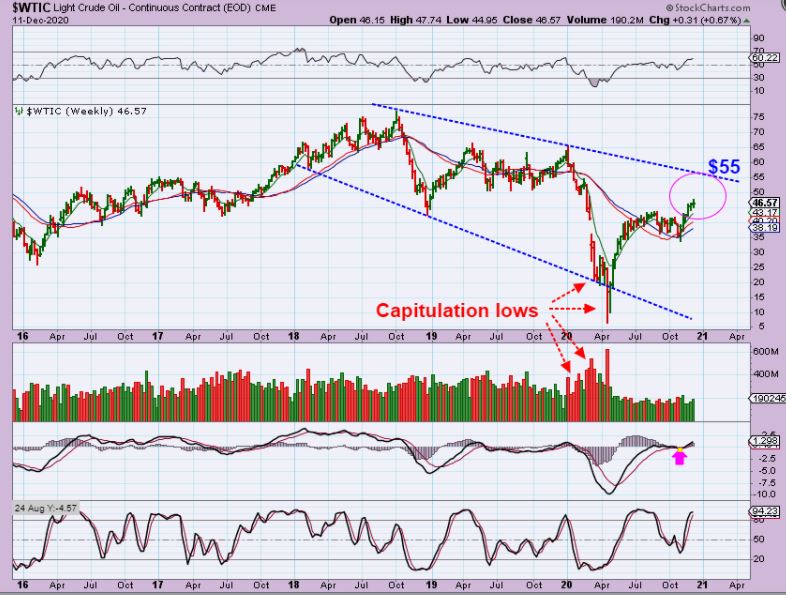
WTIC WEEKLY – Oil crashed in 2020 too, and then it ran straight up. After some sideways chop it has broken out from the choppiness. We should expect Oil to push higher to around $55 and then look at Oil when it gets there. Gains in the oil Stocks have been very rewarding for both scalpers and buy & Hold!
.
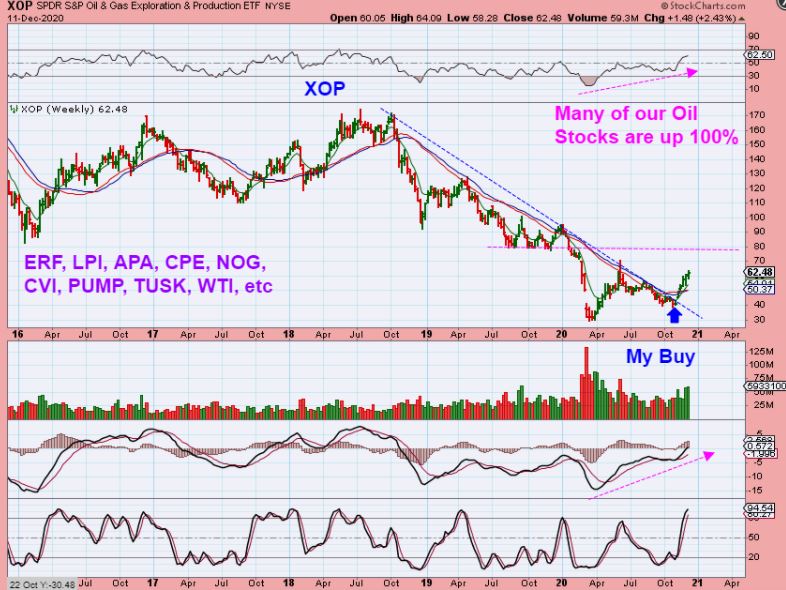
XOP WEEKLY – Gains in the oil Stocks have been very rewarding for both scalpers and buy & Hold! The XOP can run to $80 and I have been saying that the Oil Stocks are in ‘Buy the dip’ mode. They have been reversing at the 8ema / 10sma area regularly. Please read the chart and why not look up the stocks listed on 3 month charts. The next DCL will be a strong buy recommendation by me.
.
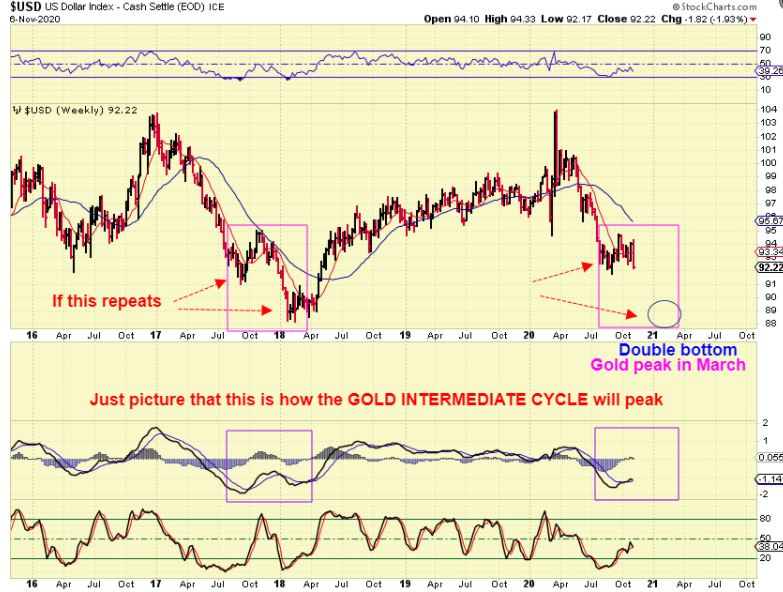
USD WEEKLY – With this Nov 6th chart I mentioned that the USD could be doing what it did in the 2017-2018 drop ( Magenta Box).
1. The USD would break the lows and fail
2. That drop could cause Gold to rally
.
Well so far The USD has broken down & it does seem to be similar, but Gold isn’t rallying strongly yet. See the chart. One thing that I do not like is…
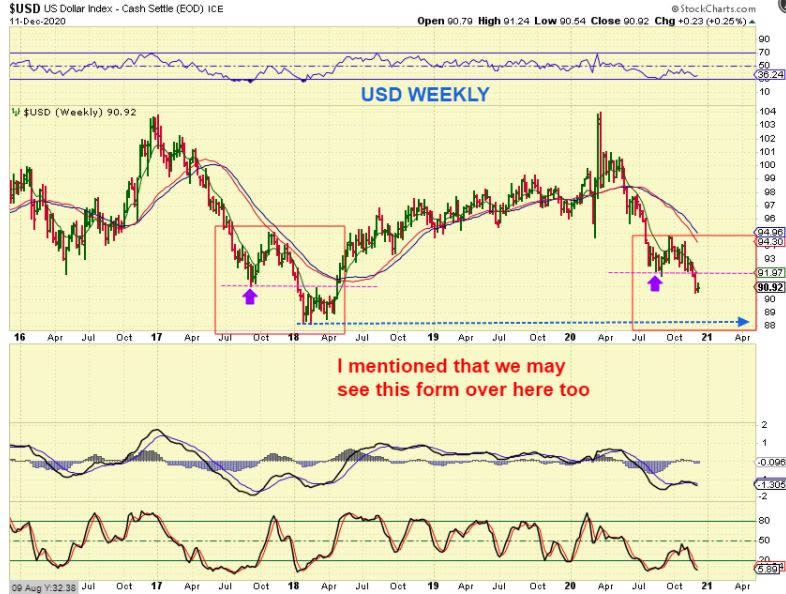
USD WEEKLY:
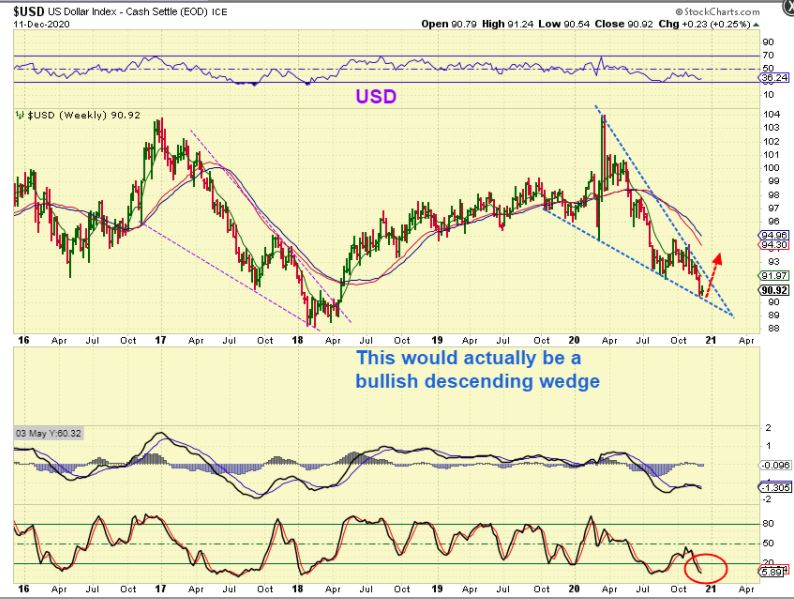
One thing that I do not like is that this now also looks like a bullish falling wedge at the lows. This would probably keep Gold choppy even if Gold has the lows in place. We’ll just have to see how things play out.
.
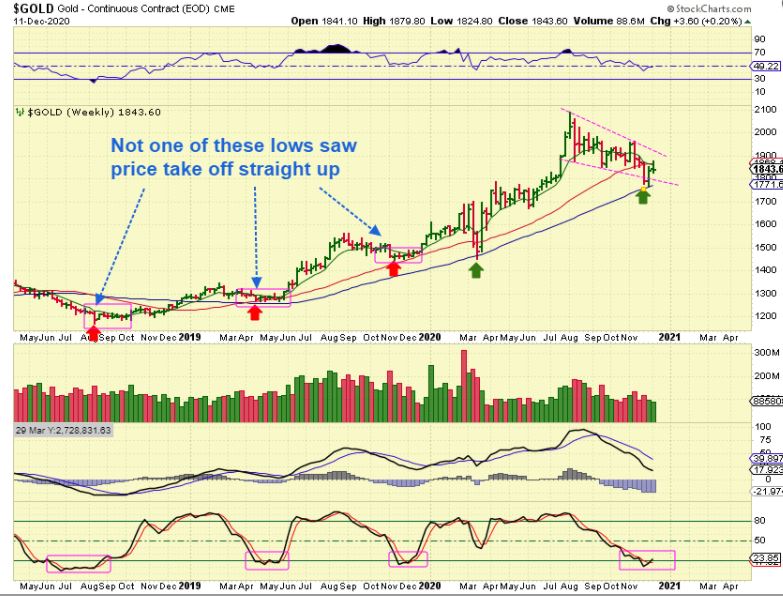
GOLD WEEKLY – Gold appears to have the ICL in place in November with a spike down and recovery. In 2019 the ICL formed in November too, but notice how it chopped sideways for weeks after that low formed. I’m hoping that we just ramp up out of here, but as discussed above, the USD may have something to say about that.
.
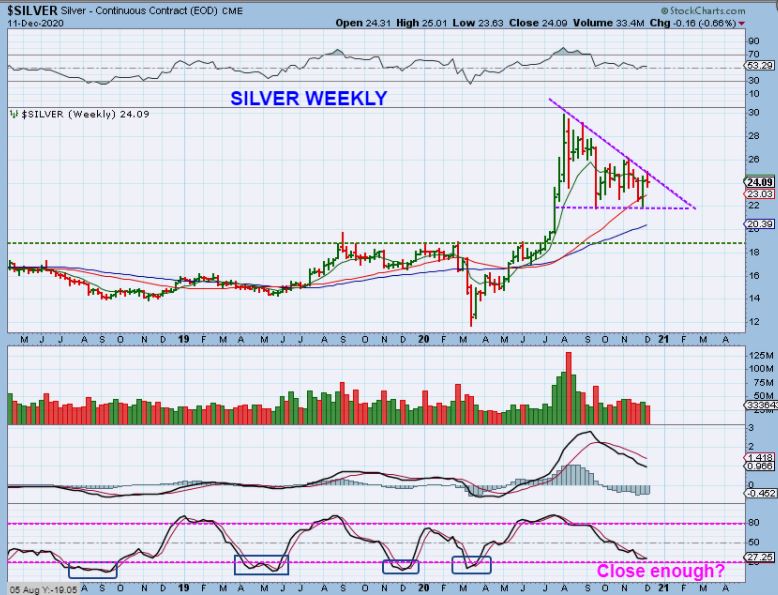
SILVER WEEKLY – Silver is running out of room here. It looks like it will either break out higher next week or drop from this upper trend line. Silver has been chopping widely. It is not as oversold as past ICL levels. Lets see what next week brings.
.
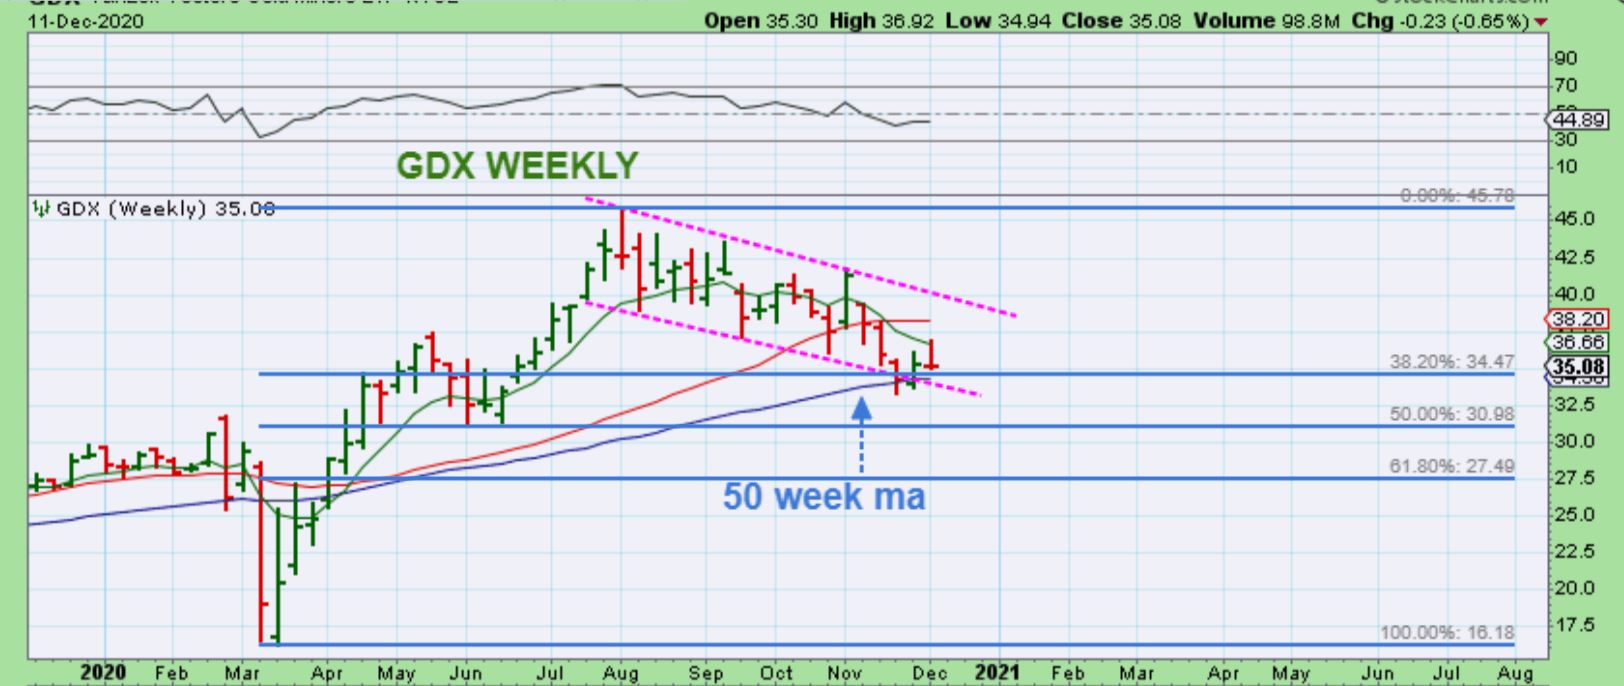
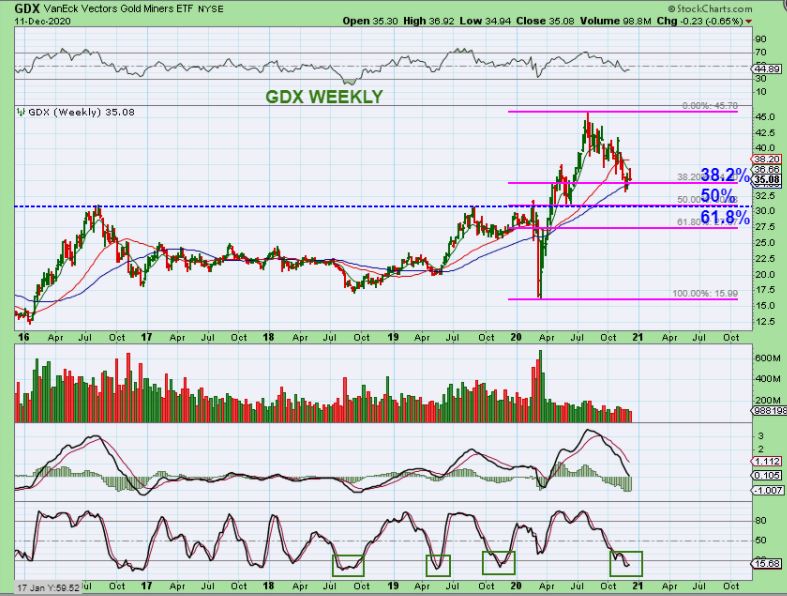
The GDX WEEKLY Chart shows that price broke & recovered that 50 week ma. It broke the lower channel line & recovered too, and this is also the 38% Fib area. This could be the lows in place since we are 8-9 months from the March ICL, but…
.
GDX WEEKLY – Price is at the 38% Fib area as mentioned, and that is a nice strong bullish pull back. When I looked at the chart, I can’t help but to see that the 50% fib drop would also be a back test of the break out and seems possible too. ONE GOOD THING is that the break out area (Blue Line) was actually already tested in April, so the feeling that we may need to back test the break out is less compelling. That break out was back tested once already in April and we are oversold and this is all we need for selling really.
.
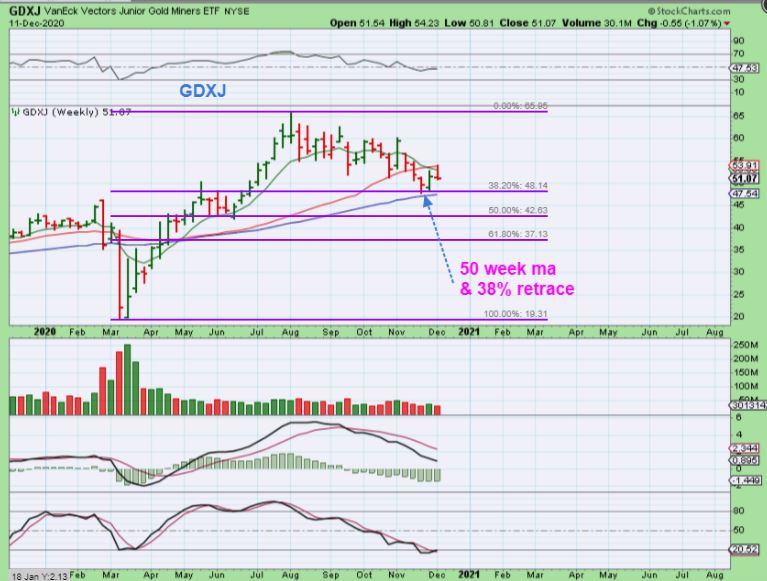
GDXJ WEEKLY also back tested the 38% Fib area and also tagged the 50 week ma. This is considered a strong bull run if the pull back only reaches 38%. The fact that this has taken 4 months is what makes it so difficult, but that is normal too.
.
The General Markets remain bullishly set up. We could be enjoying the strongest phase of a Bull Market, a parabolic type of a run up where it seems that almost ‘everything’ is running higher. These runs can last for months, but they do not last forever, so enjoy it while you can. We are coming due for a dcl, so a dip or pull back will usually offer a buying opportunity after we get a reversal and continuation higher (dcl).
.
– OIL remains Bullish as it runs out of its lows. Oil and the OIL Stocks are putting on a show of their own & should have more upside, so they became a ‘buy the dip’ area of trading / investing too. We are still in the first daily cycle, so if you haven’t participated, the next DCL will be a strong buy, and I will point it out when we are there.
.
– The USD is the tough one because it may affect Golds travels. The USD broke down as expected, which should be good for Gold. Even though I’ve been saying that it looks like we have an ICL in Gold, the drop in the USD has been met with a short rise from the precious metals and not a strong rally. Now the USD is within the timing to put it a dcl and bounce and I also see that bullish descending wedge. How does that affect Gold? Possible choppiness. We need to see how this plays out.
.
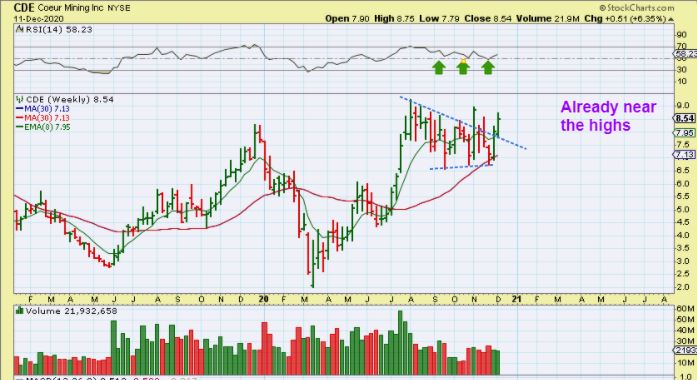
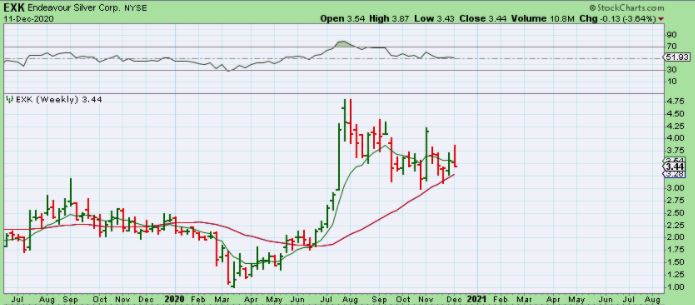
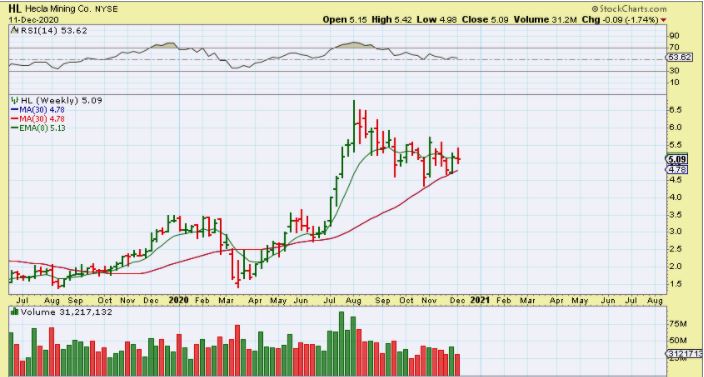
– Gold, Silver, and the Miners have at a minimum a dcl in place. It has been 8-9 months since the last ICL, so this dcl ought to be the ICL in November again. I pointed out that past ICLS chopped sideways for weeks at the lows, so that may happen as the USD bounces. Again, we’ll have to see how this plays out, but if the DCL breaks, it is a failure and proof that downside targets are going to be met ( 50% Fib, etc). Another reason why I think that the ICL is in place is that several Miners have already returned to their prior highs like CDE, AAGFF, MTA, and a few others.
.
NOTICE THAT THE SILVER MINERS LOOK STRONGER AND MORE ORDERLY IN THEIR RECENT SELL OFF. THESE ARE BULLISH SET UPS AND LOOK TO HAVE FOUND THEIR LOWS AT THE 30 WEEK MA IN OCT & NOV. THESE ARE SET UP BULLISHLY. Buy with a stop at the 30 week ma.
.
That is your Big Picture Report, I hope you enjoy your weekend!
.
~ALEX
.
I already discussed my thinking with BITCOIN, but I’ll review what I am seeing so far.
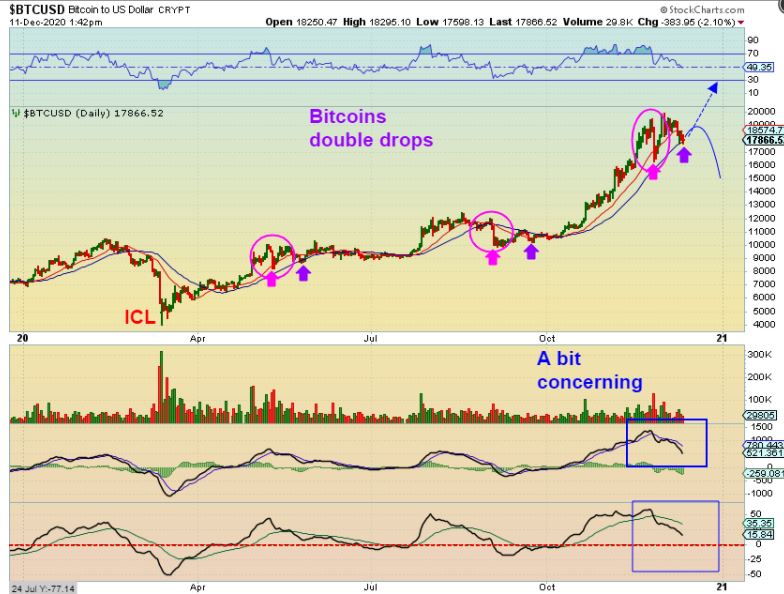
With BITCOIN DAILY I have noticed that you tend to get a crash down DCL. After that a small bounce and a higher low often forms, so I was looking for a higher low. Now we have one as of Saturdays trading (12-12-2020).
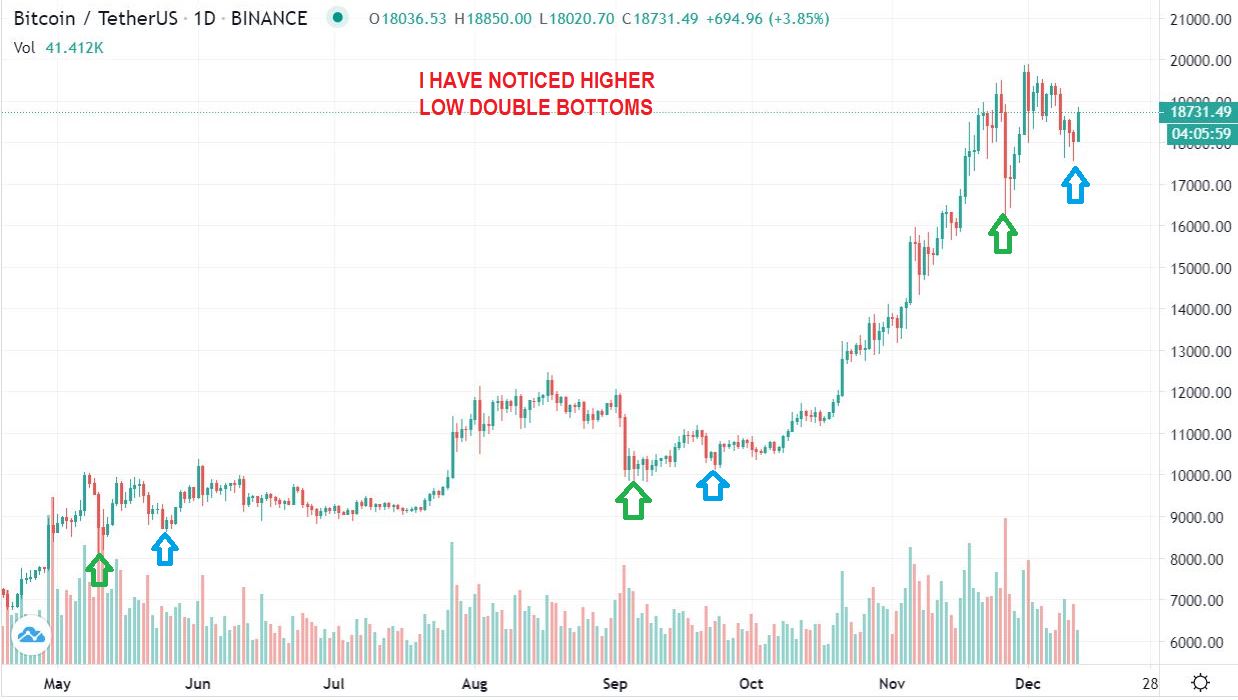
,
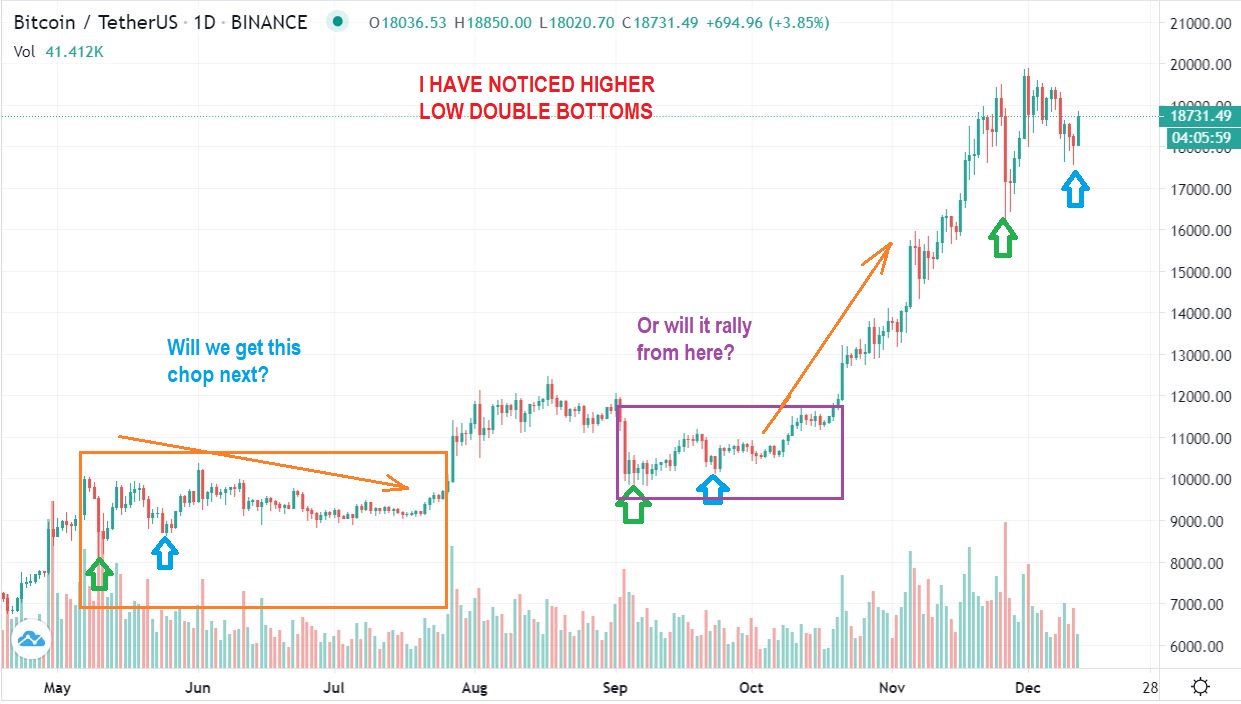
BITCOIN – So now the question is do we get a continuation rocket higher like the last dcl ( it is possible) or do we get a choppy sideways move as seen in the orange box ( I think that could be more likely). I will explain again why I think the sideways chop may be what follows…
.
I will explain again why I think the sideways chop may be what follows. Many times I have seen a sector reach prior highs and just when everyone thinks that price is going to be in a non-resistance zone & go straight to the moon…It pulls back for weeks and months.
,
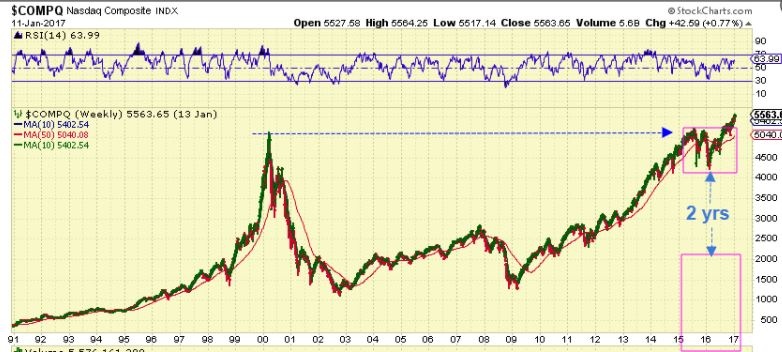
#1 : WHEN THE NASDAQ WAS HITTING NEW HIGHS, it suddenly dropped and chopped for years actually. It formed that long pan-like pattern and added a handle.
.
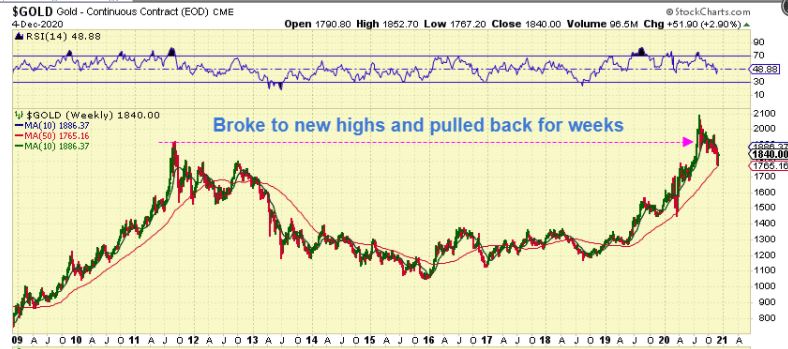
#2 RECENTLY WE JUST SAW GOLD AT NEW HIGHS and everywhere I looked on Twitter and other socail media, people were saying GOld will run straight to $2500 and then $3500. It was at that time that I sold my leverage and cut my miners and expected a dip to an ICL. THat is where we are now, not running to $3500, but pulling back to re-set for the next run. Next is Bitcoin…
.
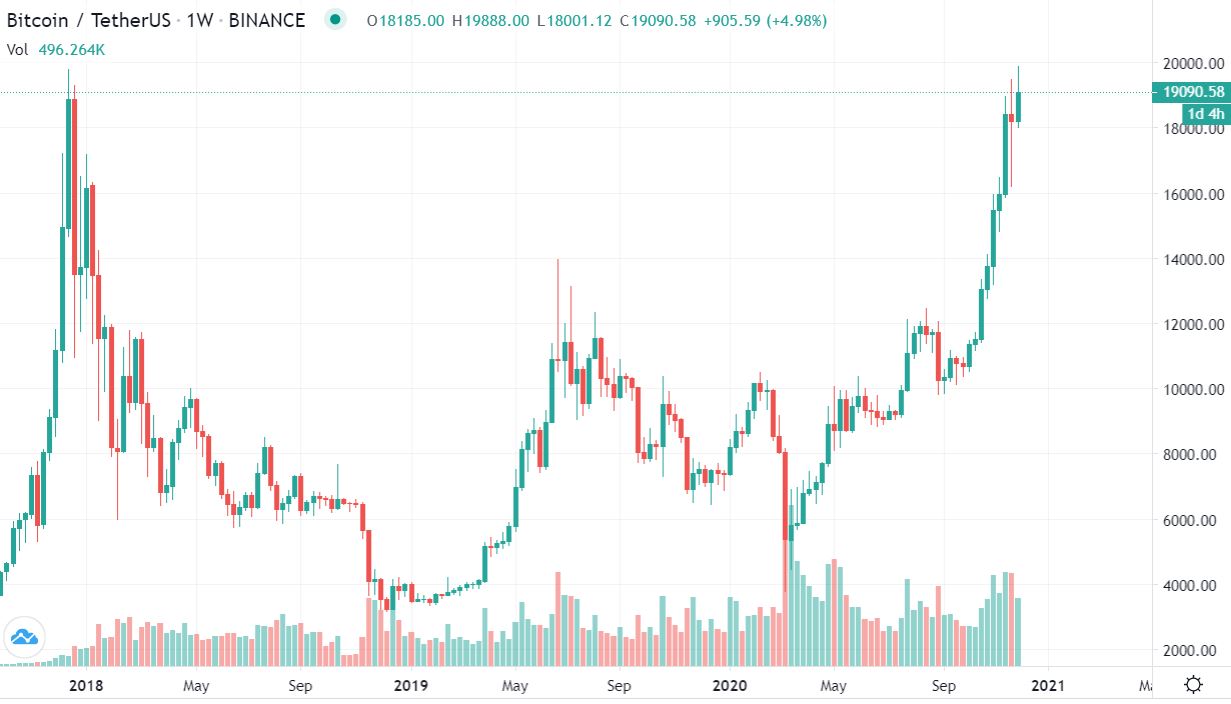
#3 BITCOIN – So here we are with Bitcoin at the prior highs.
1. Can it burst higher and keep running? Yes it can.
2. Can it pull back like GOLD, the NASDAQ, the SOX, and so many other sectors that reached prior highs? It has been running straight up, yes it can take a rest too, especially after such a strong run.
.
BITCOIN NOW – Honestly this can go either way and if I was trading it I would simply approach it this way:
1. I would have already bought the dcl with a stop and
2. I would have even been comfortable adding on the higher low.
3. It is the same with RIOT, MARA, HVBTF, FTFT, and other blockchain trades, I would have stops in place and honor the stop.
Now you just let it play out and show you what it wants to do.
.

