WEEKEND REVIEW
As the year comes to a close this week I have to say that as bad as 2020 has been, it has produced some very bullish trading. Over the past few months the gains have been adding up in sector after sector. This weekend report will be fairly straight forward and less detailed than usual, because at this point most sectors remain Bullish. Anything can happen and yes Markets can crash, but for now the set ups remain Bullish. Let’s go to the charts!
.
SPX WEEKLY– After a multiweek bullish triangle consolidation in which an ICL formed, we have a break out and price is bullishly riding the 8 week ema (Similar to 10 week sma). Notice that the Magenta Arrows point out that in prior bull runs price ran up the 8 ema too. Last week formed a reversal candle.
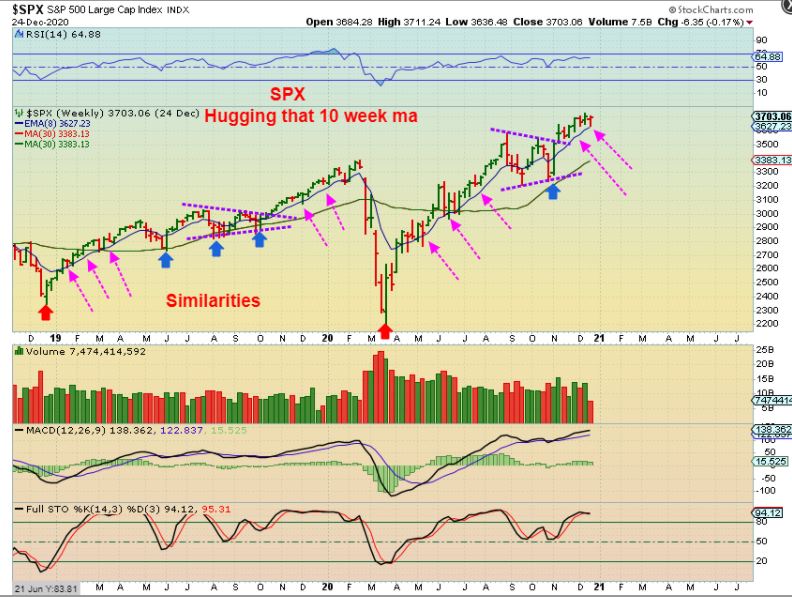
,
NASDAQ WEEKLY– The NASDAQ continued higher and this could be another midpoint consolidation, so I need to advise my readers not to short a bull market. If you went long at the ICL or higher low ( TQQQ for example) you are still in the trade long.
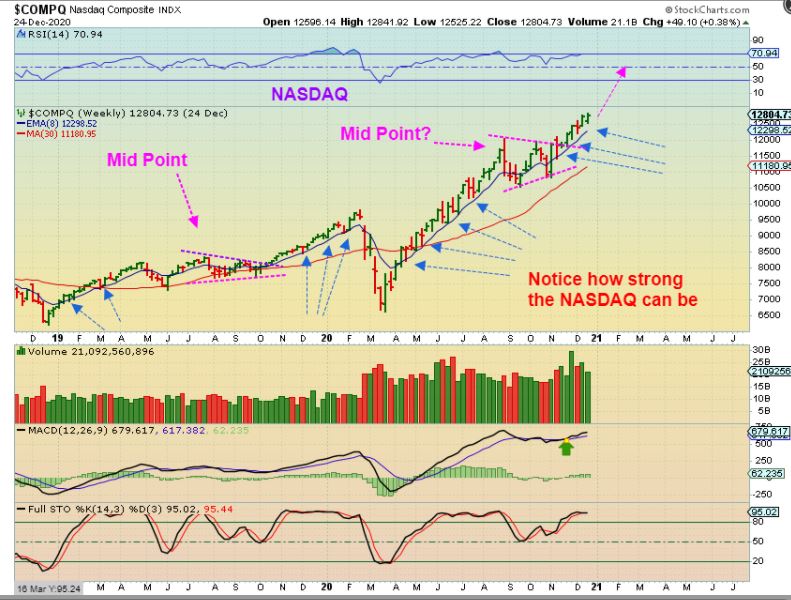
.
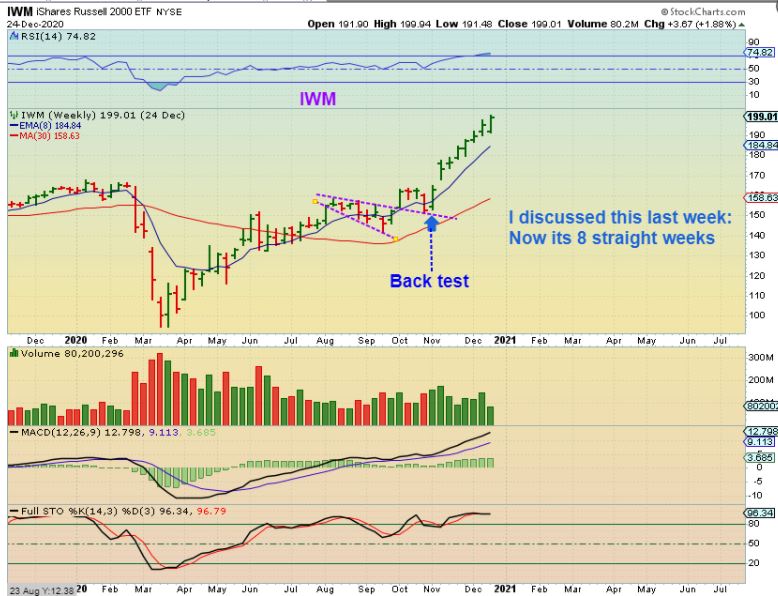
IWM WEEKLY– The Russell joined the bull run and as I pointed this out last week, this was a strong move that was 7 straight weeks higher. We are now at 8 straight weeks higher. Moves like this can just run away.
.
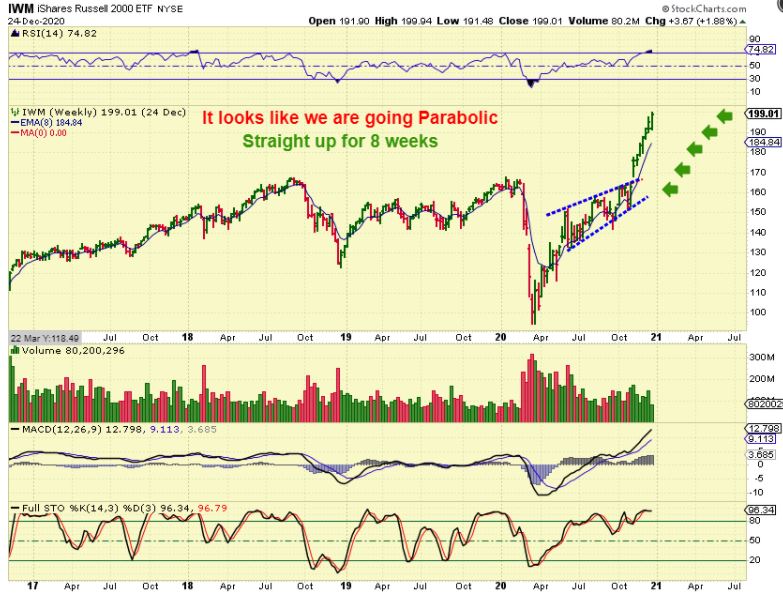
IWM WEEKLY– Stepping back and getting a bigger picture view, it has been a straight up run from that consolidation. It is very possible that the markets are running parabolic and this could end in a sharp pull back or crash sometime in 2021.
.
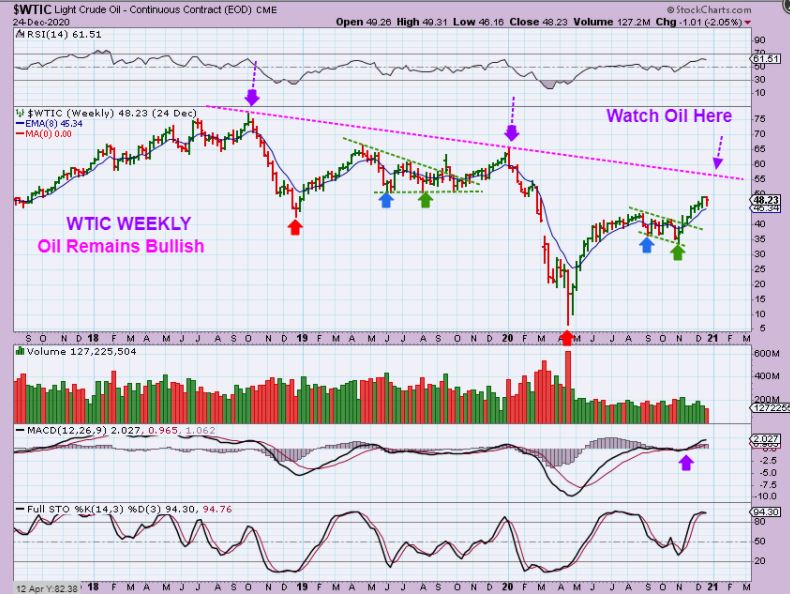
WTIC WEEKLY– Oil dropped last week and recovered by Thursday, so we have a reversal at the 8 ema. I have mentioned that I will be watching Oil a bit closer once it gets to the $54 – $55 area. I think that it can get there. And…
.
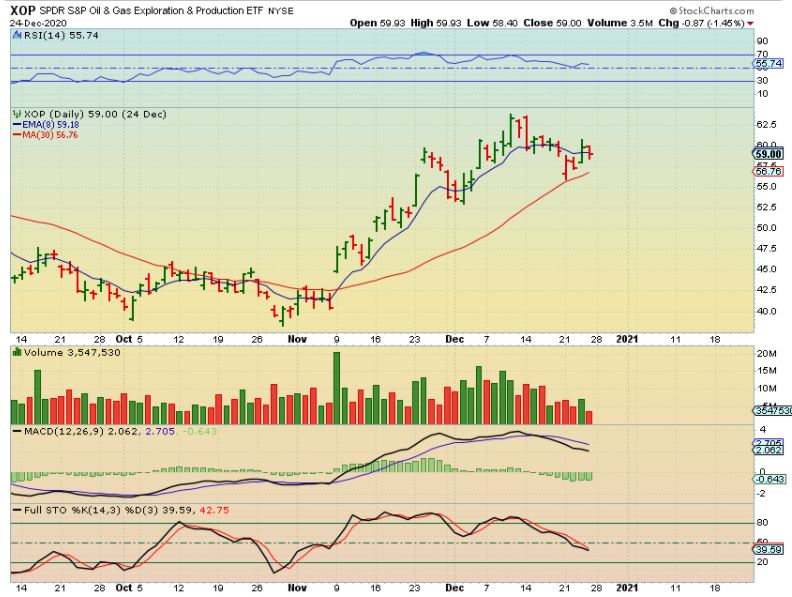
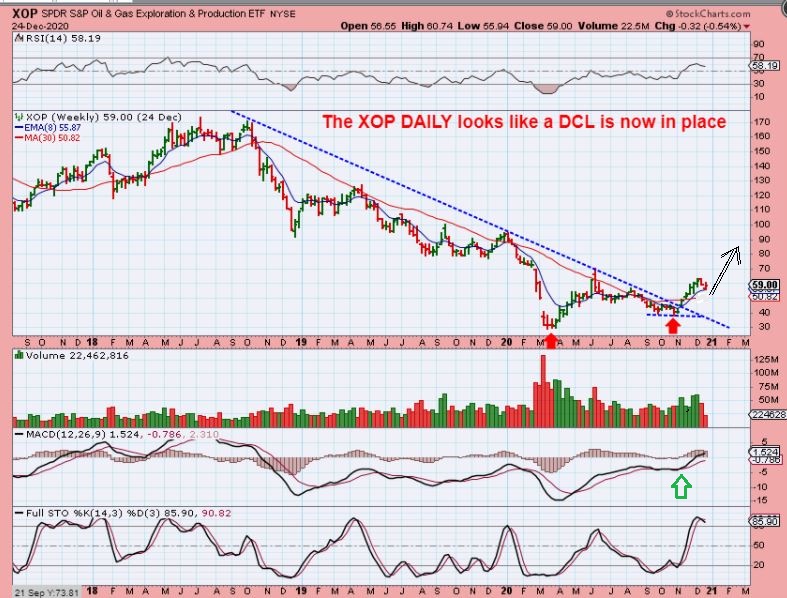
XOP WEEKLY– On a daily basis, it appears that the Oil stocks put in a dcl last week after their pull back. This is a buy for Oil stocks, and that goes for GUSH ( for the traders that take on a little more risk). Gush more than doubled out of our last lows and even doubled from the ‘Buy Signal’ as it broke from that down trend.
.
XOP WEEKLY-The weekly chart here for the XOP is a reversal off of the 30 week ma, a bullish sign in technical analysis. You can buy with a stop below support and again this include oil Stocks and Gush which doubled after this trendline break.
.
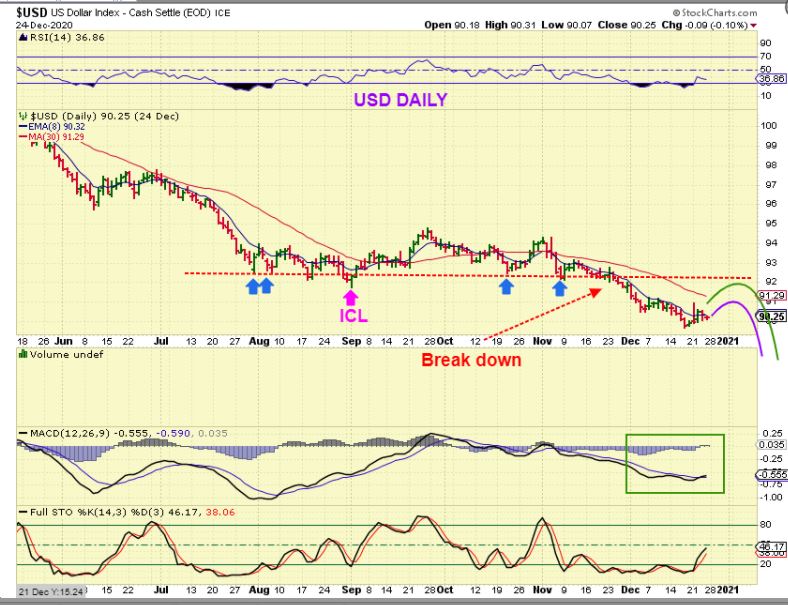
Out of all of the charts in the weekend report, The USD is the toughest. Why? It has a valid break down, but it also looks ready to bounce. At the same time, Gold, Silver, and The Miners look ready to continue higher too. Let’s take a look.
.
THE USD DAILY is oversold and has slight divergence in the RSI and the MACD is also crossing higher, so it looks ready to bounce. I have drawn in 2 fairly weak bounce ideas.
.
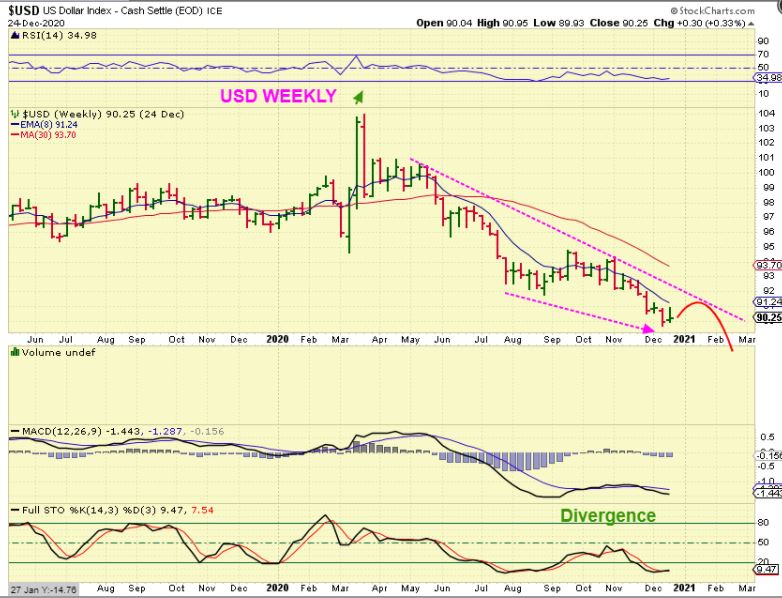
THE USD WEEKLY has a MACD divergence with a higher low as price broke down to a lower low. I have drawn in a trend line that price may run to.
.
I know we should expect that a bounce in the USD would hinder the Precious Metals, but I really liked the way some of the Miners charts closed on Thursday, so let me show you what I mean by that in the Precious Metals section of the report.
.
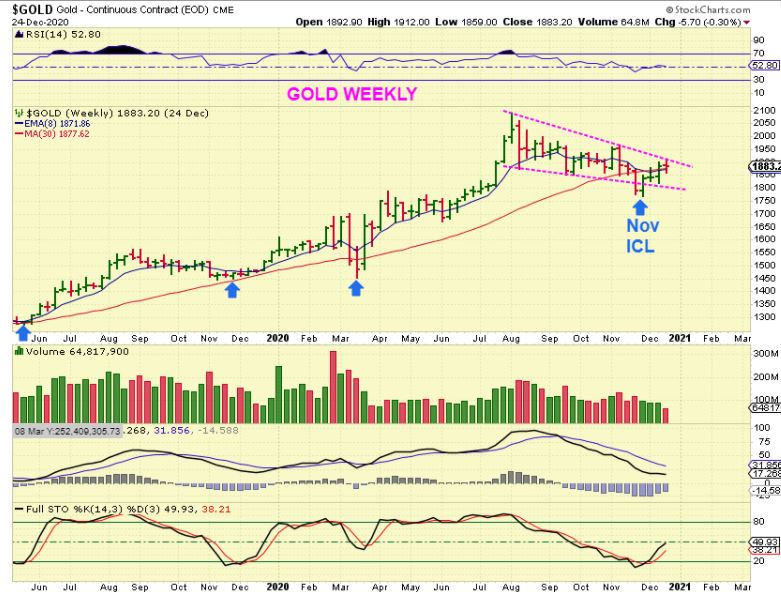
GOLD WEEKLY- Yes, we could ‘pause’ here at the upper trend line if the USD does bounce. We should have an ICL in place and Price regained the 30 week ma for the 2nd week in a row. With an ICL, we would expect a push higher, but it really doesn’t have to happen next week. If we do get a pop in the USD it may cause Gold to stall here, yet it will remain bullish.
.
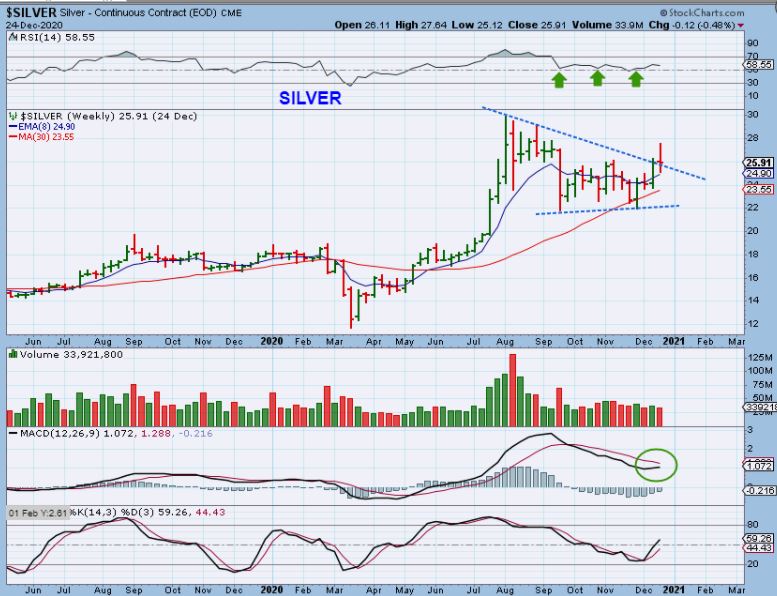
SILVER WEEKLY– Silver actually broke out last week and then fell back. This is a bullish set up and I would have to say that a doji like this could go either way, so a bounce in the USD may slow Silver down a bit too. If that is the case, why did I say that I liked the way some Miners closed last week? …
.
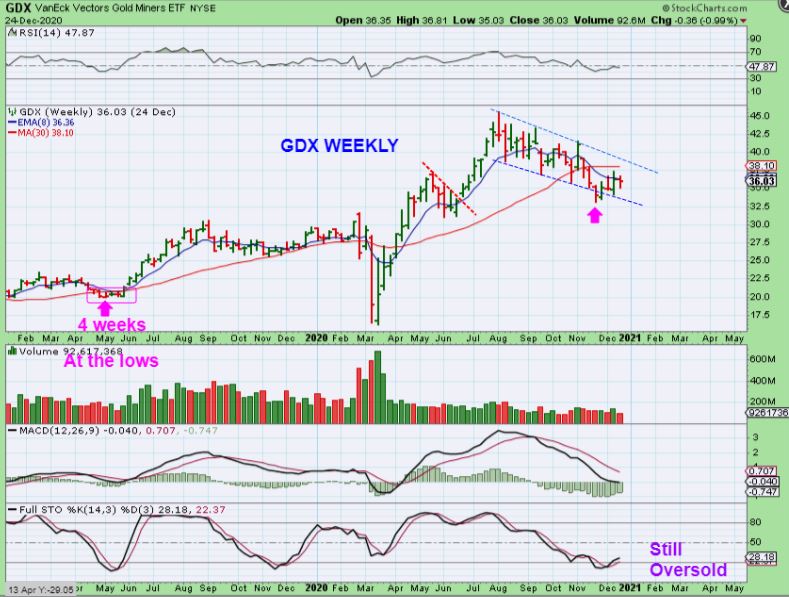
GDX WEEKLY – The Miners are different than the Metals. GDX is at the lower range of the consolidation and is under the 30 week ma, so it has some catching up to do. Miners usually lead the way, but in this case they may try to play catch up and continue higher next week even if Gold & Silver ‘pause’ due to the USD possibly bouncing. Now let me show you something else.
.
I said that I actually like the way many Miners closed on Thursday, especially the Silver Miners,. Let me show you what I liked and then we’ll just have to wait and see what next week brings in this sector.
.
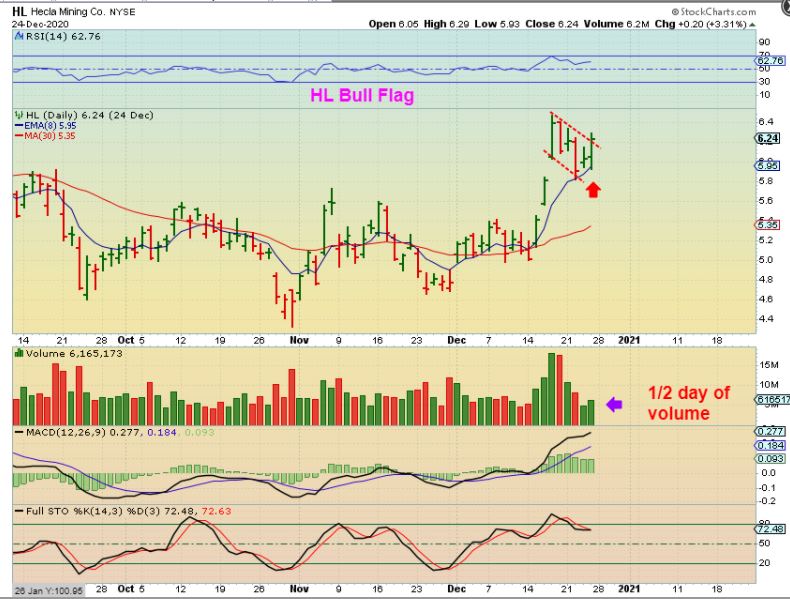
HL actually looked like a buy right here. After a drop to the 10sma, it strongly reversed and closed near the highs (remember that Gold & Silver dropped and put in Dojis & didn’t close at the highs). Since Thursday markets closed at 1 p.m., it is noteworthy that Thursdays 1/2 day volume was better than Wednesdays full day volume. Hecla may rise even if the Metals chop a bit more. This really looks like the place to a add to current positions.
.
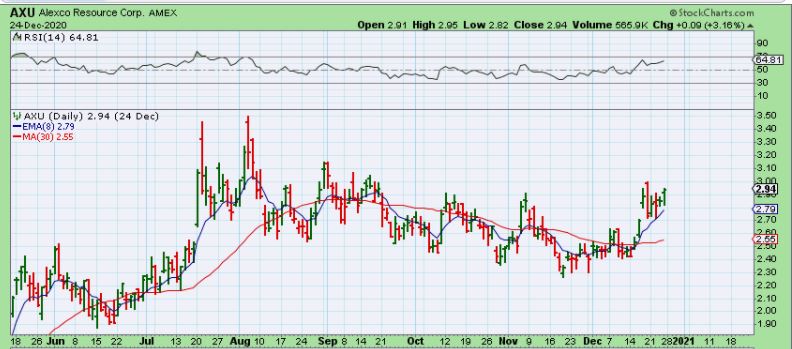
AXU also reversed and closed near the highs after a bounce off of the 8 ema. This seems like bullish price action to me, closing at the highs with Silver putting in a Doji.
.
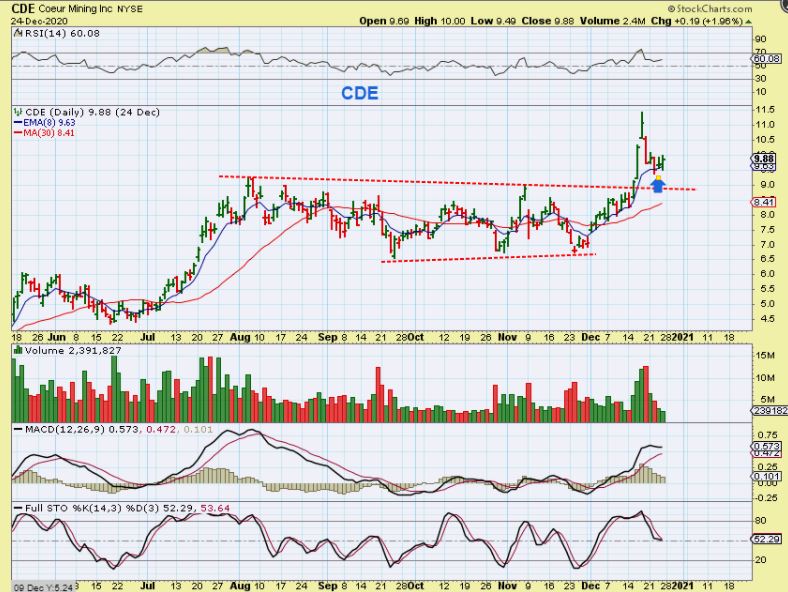
CDE -also reversed at the 8 ema and volume matched Wednesdays full day volume. The drop from the highs brought the stochastics to the 50 area, so it is no longer overbought. Could price drop to the upper red trendline? Yes, but so far I like the way many Silver Miners closed the day near the highs with the Metals stalling out.
.
– It has been a bullish time for the General Markets and it does look like it will continue on into next week. We seem to have a runaway move that doesn’t sell off below the 8 week ema.
.
– Oil and the Oil Stocks reversed at support too and the Oil Stocks seem to have a dcl in place. With that we should get more upside from that sector too.
.
– The USD may or may not bounce, but it does look set up to do so. If it does we’ll see how that affects the Precious Metals next week.
.
– We saw ‘Dojis’ or ‘indecision candles’ in Gold & Silver, but the Silver Miners closed near the highs with nice volume. Most reversed on the 10sma and had stronger volume on a 1/2 day of Thursday trading compared to the full day of trading on Wednesday. I look forward to seeing if the Miners can get any follow through with Thursdays close near the highs.
.
I will cover a couple more areas below, thanks for being a Chart freak with me and enjoy the rest of your weekend! 🙂
.
~ALEX
.
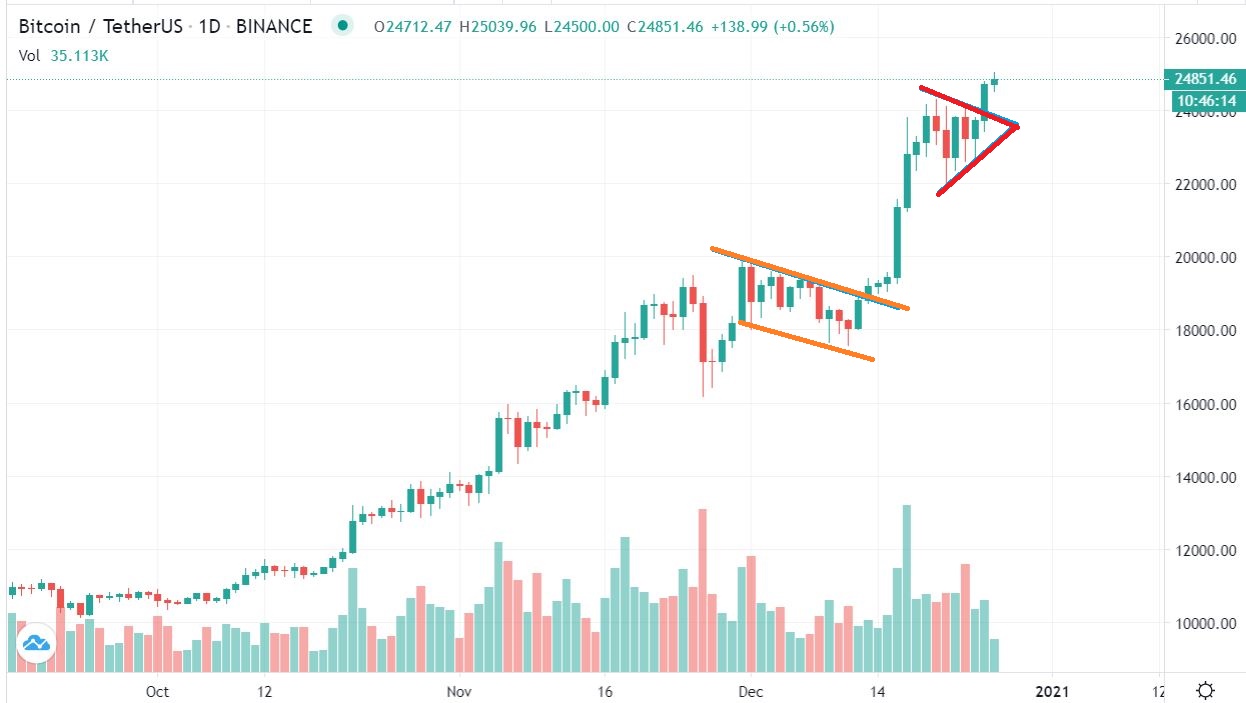
Bitcoin #1 – I had a short term target of $26,000. This flag or Triangle near $24,000 can extend the target to $27,000-$28,000, but I would not be surprised at all to see this just continue in parabolic fashion and get to nice round number of $30,000. Price Loves to run to round numbers. If it does, we’ll analyze it again and watch it from there.
.
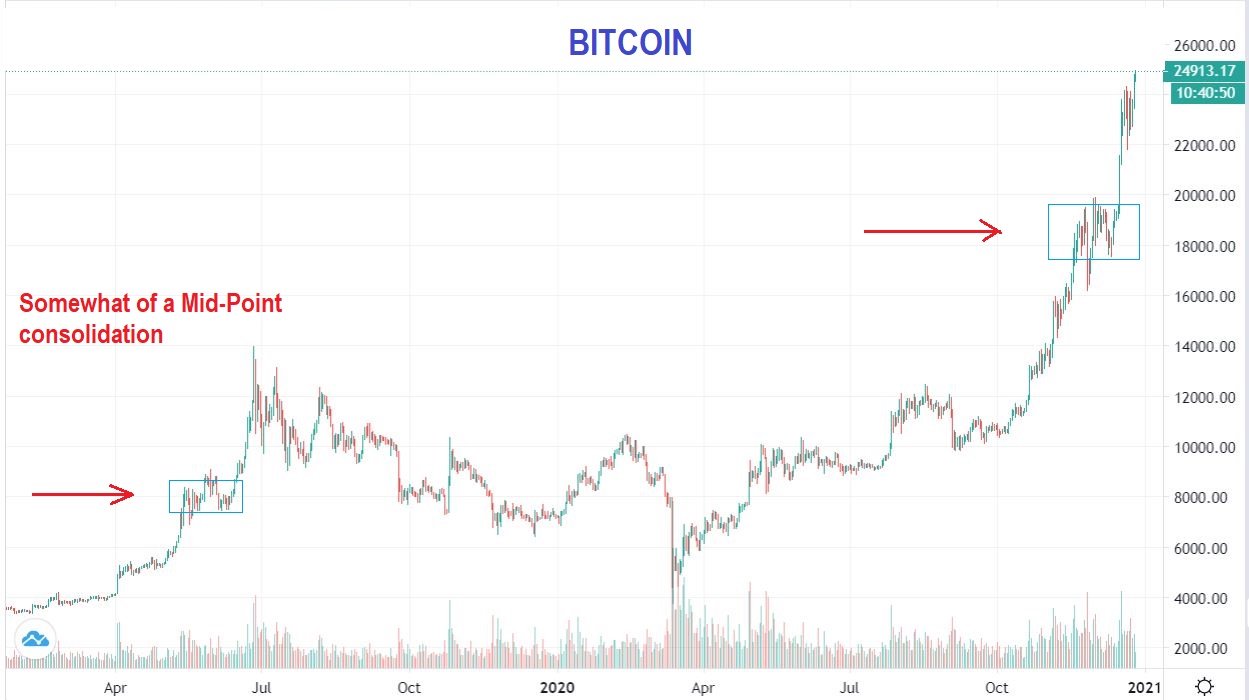
Bitcoin #2 – This midpoint gave me a $26,000-$27,000 target, but it can extend and seems like it will with that recent triangle consolidation.
.
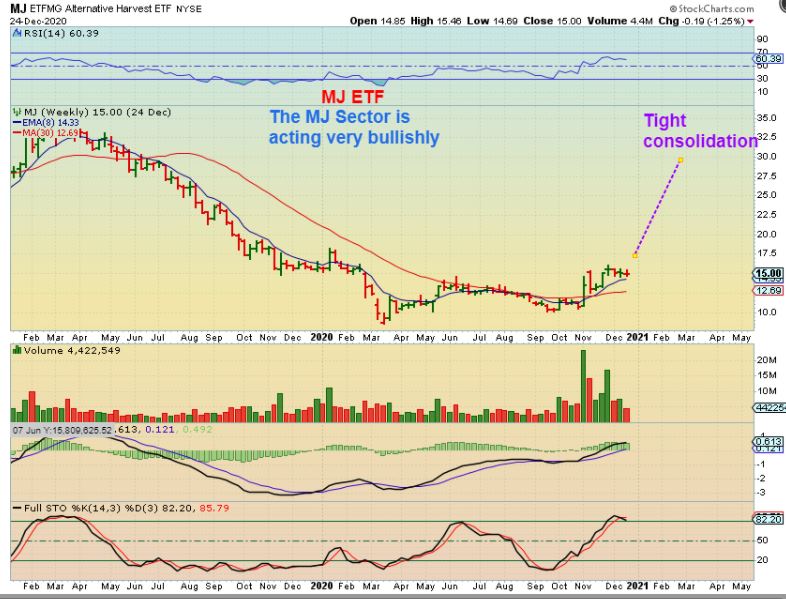
THE MJ ETF is actually forming a realty nice consolidation. When you see a tight pattern like this on a weekly chart heading to the 10 week ma ( or 8 week ema) it can be a sign of accumulation before the next run higher. So I am seeing the MJ Sector as a bullish weekly set up too.
.
IT CERTAINLY SEEMS AS THOUGH THE BULLS ARE RUNNING EVERYWHERE!
.