
WEEKEND REPORT – Are You Ready!
I want todays report to be Super clear, so I am going to make the charts specific and to the point. I don’t want to over talk it, I want the charts to do the talking, but I will say this: To Be Clear, I’ll start off up here by saying that this is the moment that we have been waiting for with the Miners! We got the Buy Signal. The lows should be in place as of last week, and that means weeks ahead of Upside and Gains. It took a lot of patience and choppy troublesome moves to get us here, so Lets Enjoy The Ride! 😉
.
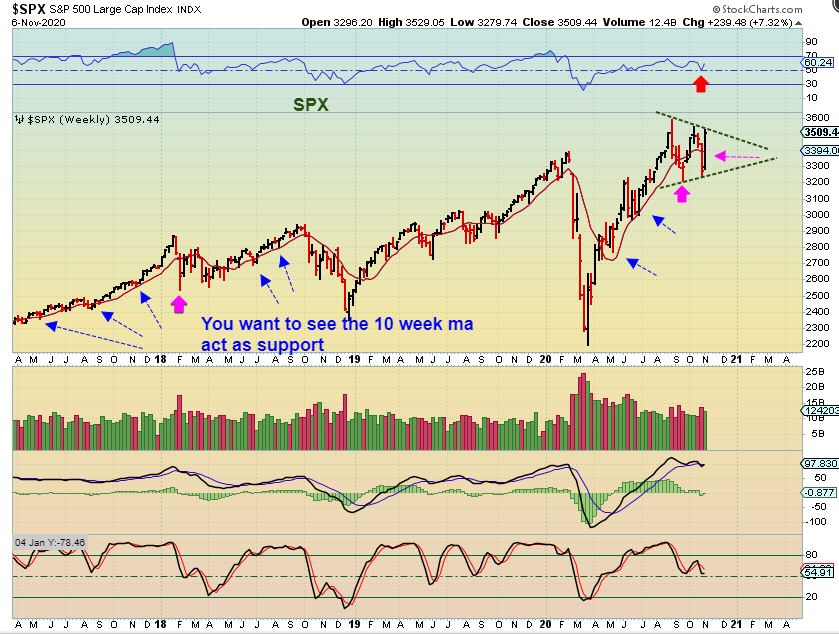
What a move by the SPX, it was up 7% for the week and most of that came Tuesday, Wednesday and Thursday. The set up remains very bullish, even if it pulls back next week. We have a possible bull triangle forming.
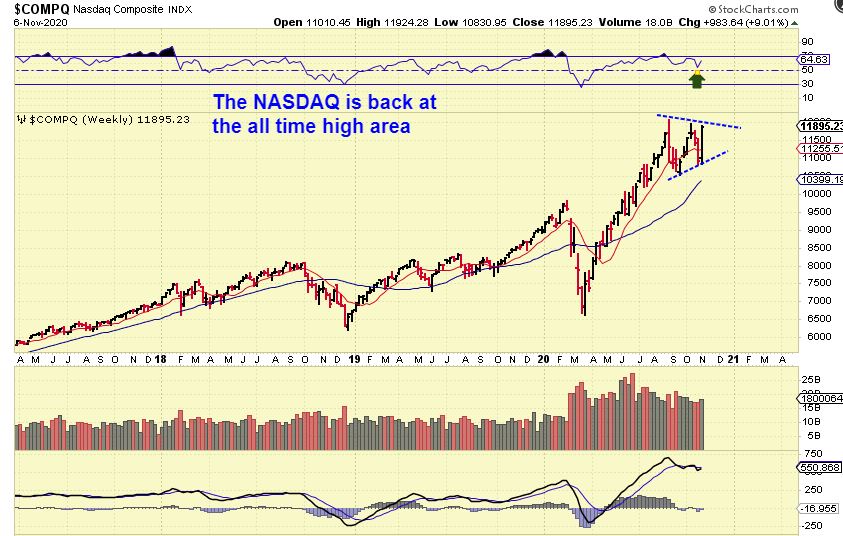
THE NASDAQ has returned to almost all time highs. Many have said that if Biden wins it would hurt the Markets, but he is ahead in the standings so far and we see a 9% gain for the Nasdaq. The big picture might explain why…
THE NASDAQ BIG PIC shows that this doesn’t resemble the ‘top’ of 2000 anymore (Yet). I was watching the 2000 ‘peak’ as
1. A top that was followed by a lower high, as seen here in 2000.
2. This current rise to new highs does not have that lower high. This run seems to indicate that this blow off top may not be done quite yet.
.
So backed by FED Policy a Biden Presidency may just prolong growth with ‘sector rotation’. Biden favors Health Care, Clean Energy, and rebuilding Infrastructures among other things. It is possible that this may continue higher with growth in those areas and continued help from the Fed.

That said, this General Market steepness DOES still look unsustainable eventually.
.
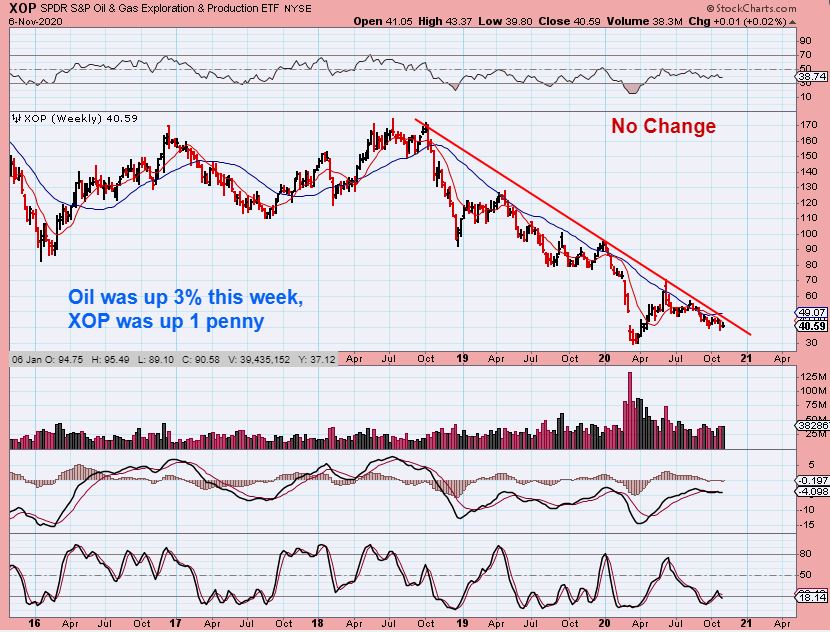
WTIC – We have no big change with the expectation of a choppy sideways move. Read the Note on the chart. Also as Oil moved up al most 4%…

The XOP was only up 1 penny for the week. A break out of this down trend line could get Bullish fast, but for now we are still not seeing buying follow through.
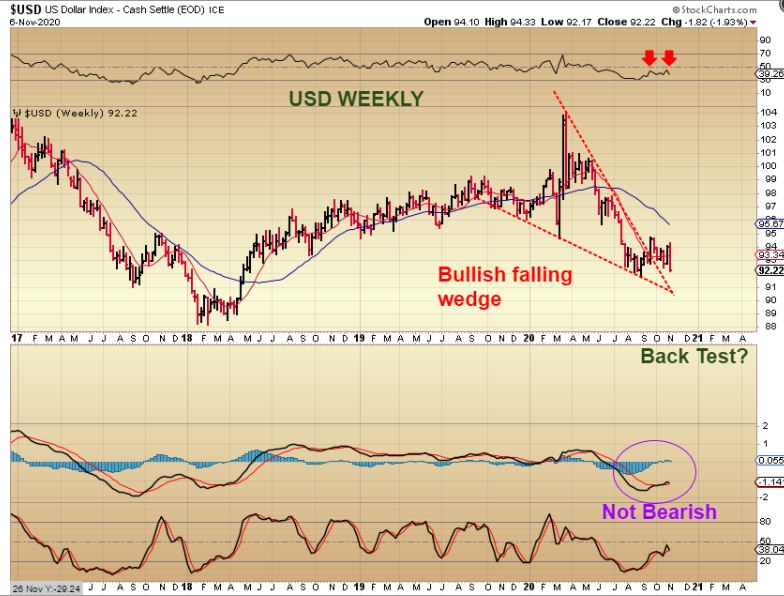
So this is a bit tough with THE USD looking bullish:
The USD dropped sharply, but it was a bullish descending wedge and it broke out. That weekly MACD is not bearish, so …
.
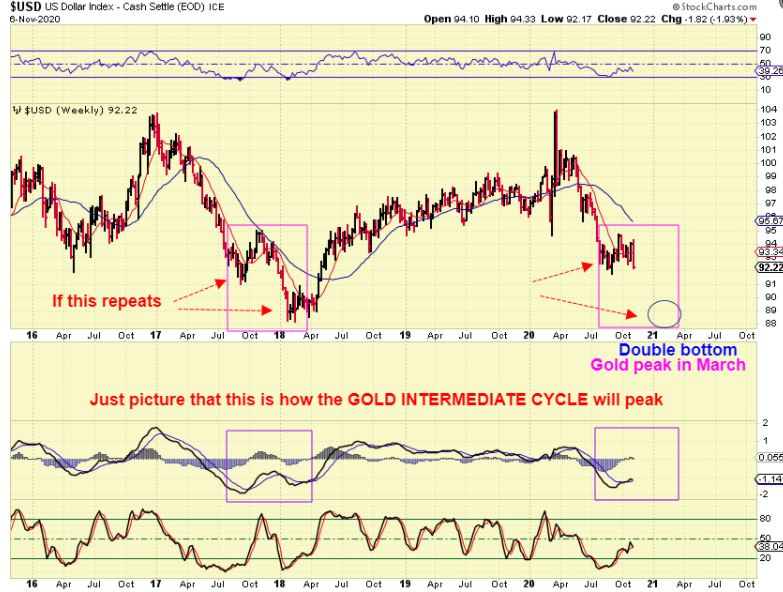
THE USD SAME CHART : “ALEX! If this is still looking Bullish, isn’t that bad for Gold? WHAT IF WE JUST DO A BACK TEST OF THAT BREAK OUT?” Well…
.
THE USD: If this repeats the Bullish MACD look back at the end of 2017/ 2018 – it will land at a low around March. Gold could peak around March and give us Huge gains from now to then 🙂 If the USD just breaks down & drops to a deeper 7 or 15 year cycle low, Gold will rally even longer.
.
Just to make this clear, we have a BUY SIGNAL
.
GOLD broke the downtrend and this is a buy. It looks early on the stochastics, but this is a buy and the lows should not be broken from here. The RSI acted Bullishly at the 50% Line.

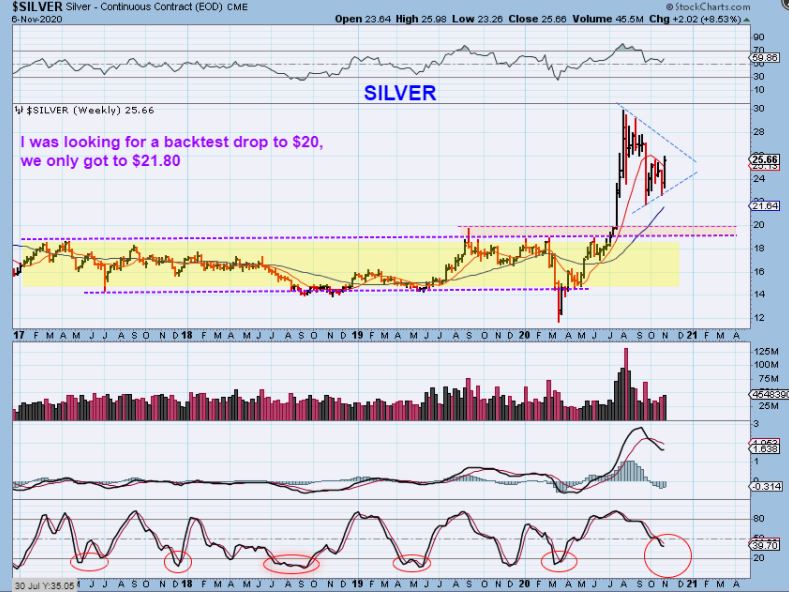
SILVER – I was calling for a $20 Silver low as a back test, but Silver reversed strongly too. We got to $21.80 and Silver synched up with Gold. It also looks early with that stochastics, but I will show you soon why SILVER looks to be making the real move here.
LAST WEEK MINERS LOOKED DIFFERENT THAN GOLD & SILVER- THEY LOOKED TO BE BOTTOMING: I did mention in last weeks report that GDX actually looks ready for a low, an ICL. This is what I wrote last week…
.
GDX actually looks like it has been leading the way lower. Gold & Silver just dropped a little and then bounced back , but as you can see, the Miners broke to new lows & broke the blue line and almost recovered Friday. Since Miners usually lead the way, this should be their drop into their ICL. Miners may not have much more downside when I look at this chart. The lower indicator shows that they could reach that ICL Oversold area next week (FOMC?). Some Miners may already be bottoming.

.
FOR GDXJ LAST WEEK I WROTE : GDXJ tagged the blue support line & Bounced. It has also not entered the oversold area in the lower box, but it is almost time to say that we are there. We could see a quick ‘reaction’ of some sort next week (FOMC) and the next reversal would likely be the ICL BUY.

.
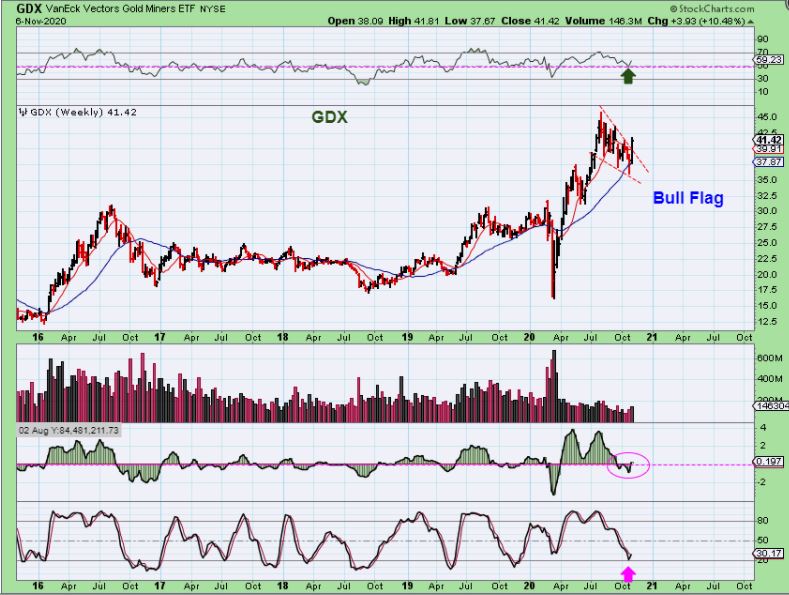
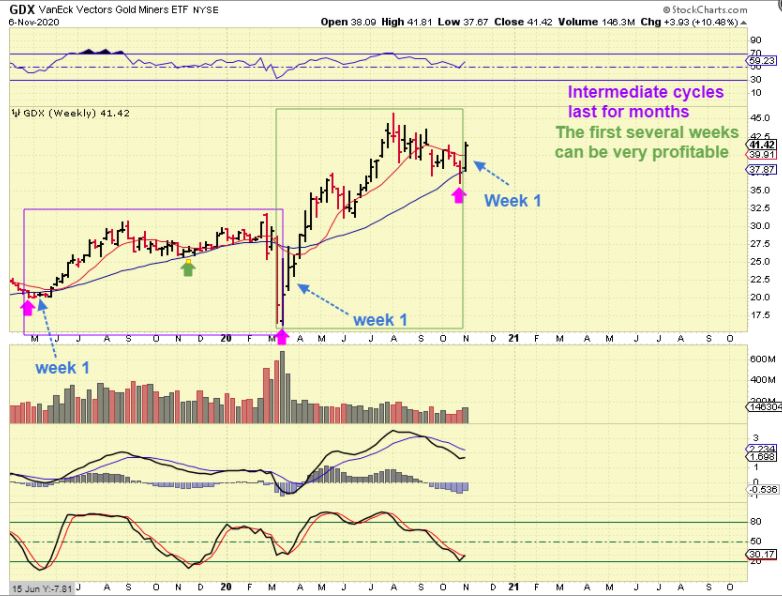
GDX WEEKLY – That next reversal is pretty clear here at that blue line, with GDX up 10.5% for the week. That is a beautiful bull Flag break out and both indicators are flipping higher.
.
GDX WEEKLY – Here is the weekly chart at the close on Nov 4th, the Wednesday before the FOMC MTG. Price tagged the red resistance line and sold off. The indicators remained low. Suddenly on Fed Thursday the reaction was explosive and we got the Buy Signal. Lets take a look again at what we have…

GDX –
GDX WEEKLY – Price surged higher, the indicators turned higher and we have a Bull Flag break out as a buy…
.
GDX WEEKLY – Read the chart.
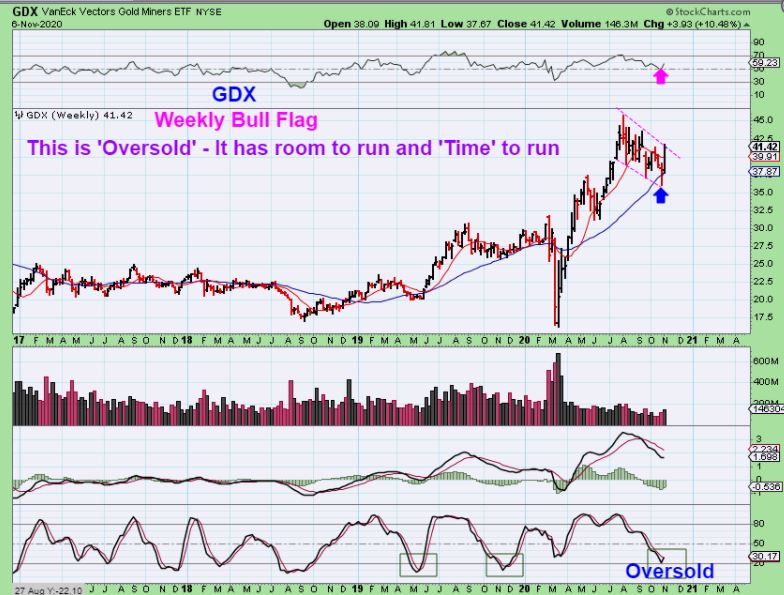
The Magenta arrows are past ICL (lows). I just wanted you to see how price acted after week 1. We see several weeks of upside ahead, so even if Miners do a ‘pause’ next week, it is still a buy. We should see weeks of upside over time.
.
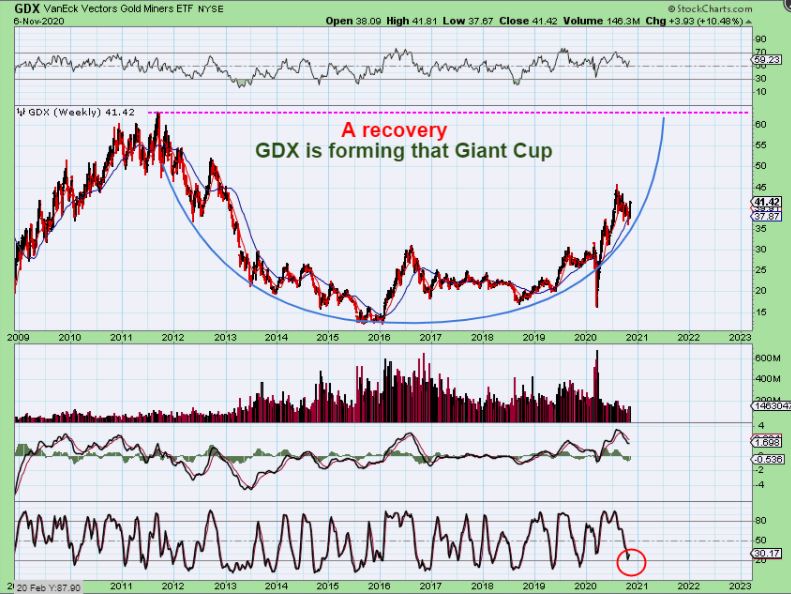
GDX WEEKLY BIG PCTURE: You all know how much I love large bases that start to return to former highs. They often form a cup as they run back to the highs out of that base, and that is what we are seeing with GDX. Is that surprising ??
.
Some here are new, but if you have been here with me at Chartfreak, we have expected this break from the base to return to former highs for a long time! Below are 2 charts from 2019 showing what I expected over time. It is playing out exactly as it should, simply verifying that we are in a predictable Bull Market.
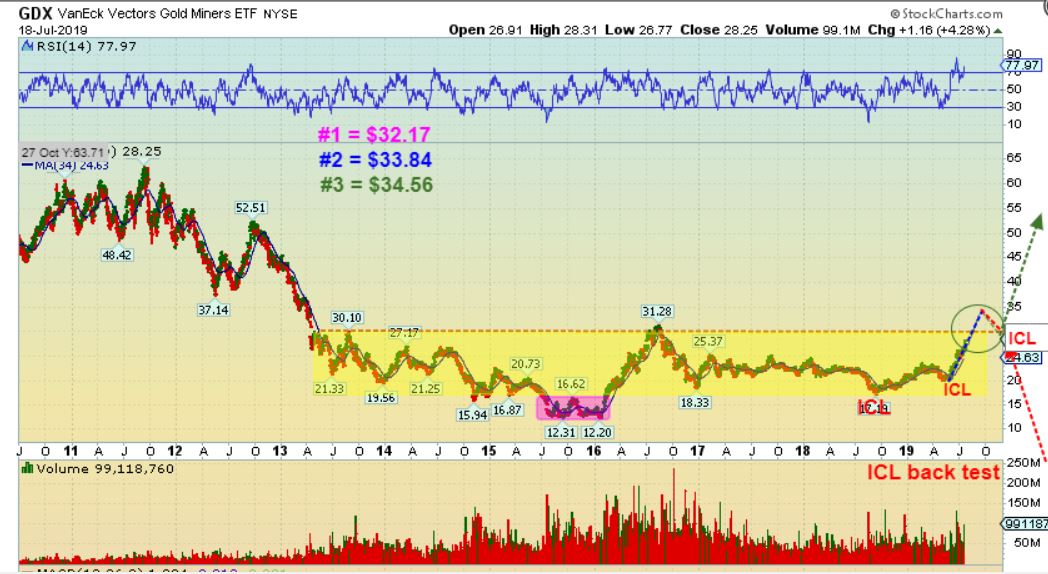
GDX $50 was shown on this chart from Aug 2019 and GDX was at $45 this past summer, but it is not stopping there! 🙂

.
The fuse has been lit and there are plenty of Buyers that still need to get in. This is one thing that will help to push the sector higher. Add to that the fact that ‘Shorts’ shorting at the 50sma may still need to cover as price rises, so that adds more fuel to the fire. This is why the next few weeks can be quite Bullish as a move out of the ICL takes hold. All bull runs have pull backs, so please expect that. While I do not expect a move straight up day after day after day, the run in 2016 did take place that way after the dip in January to those shake out lows, so it can happen and you had to be in it to win it. The shorts piled in on that drop & the short cover rally was explosive too. It’s best not to try to sell and trade around pull backs in the first daily cycles run. Riding a core and adding on dips works out very nicely for most investors.
.
The next several weeks should lead to some nice gains in our accounts. There will be leaders and laggers with the Miners, so I do plan on buying and holding a core as well as entering some ‘Ready To Go’ set ups along the way. We should have some very nice opportunities going forward in this sector as well as others, so enjoy your weekend and get ready to ride the Bull(s). 🙂
.
~ALEX
.
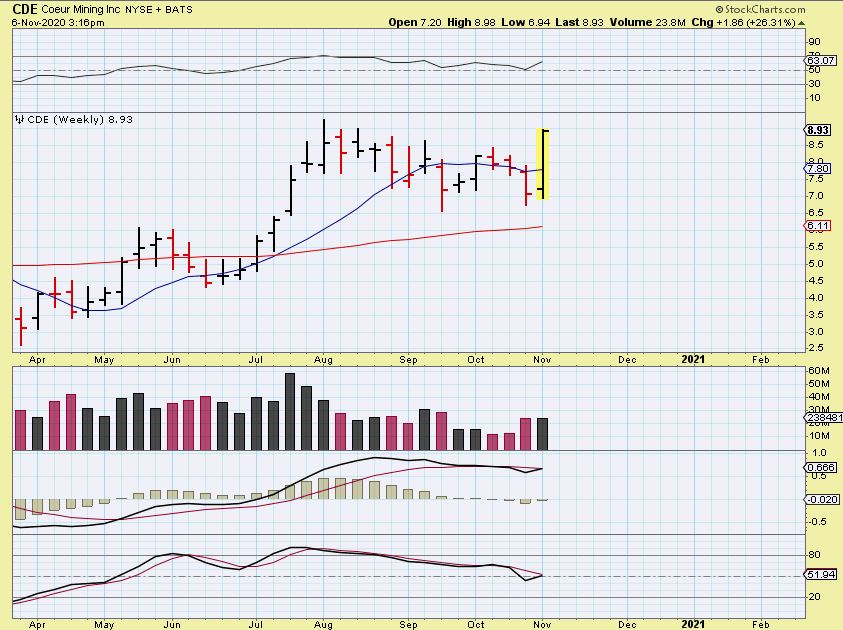
When I was covering Silver above, I said that I was going to show you why Silvers move looks to be the real thing ( No longer expecting a dip to $20). So below I just wanted you to take a look at the weekly charts of a couple of Silver Miners, and remember that much of this move just took place Thursday.
.
CDE popped 15% Thursday and ended the week up 26%. Last week CDE looked ready to drop lower with Silver and shots may have been adding to their shorts, but now? THAT is a very strong reversal chart.
EXK was up 22% Thursday alone, and ended the week up 31%. This helps us to have confidence that Silvers reversal was the real thing too.

HL was up 22% for the week too. A perfect reversal at support actually.

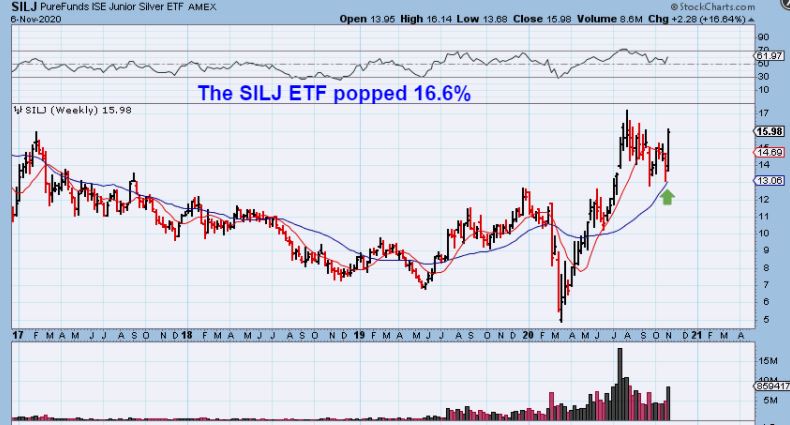
Even SILJ the ETF was up almost 17%, reversing off of the support too. This sector really caught on fire this week.
,
I mentioned that there would be laggers to enter and catch a good move. Let me show you quickly something can change with these Miners.
.
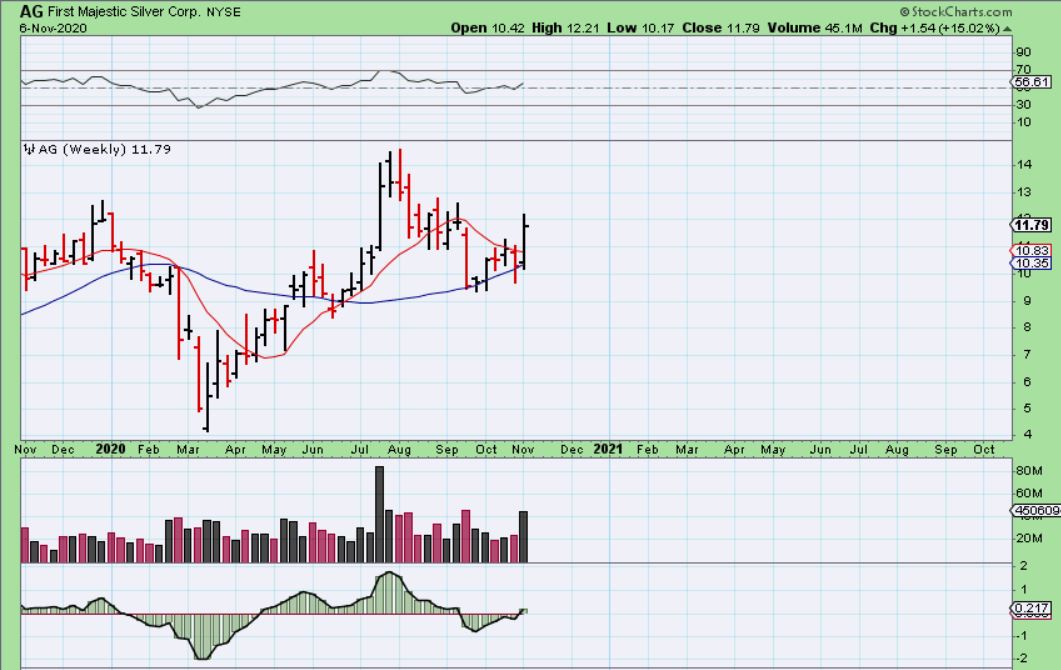
AG as of Wednesday was only up 2% for the week…
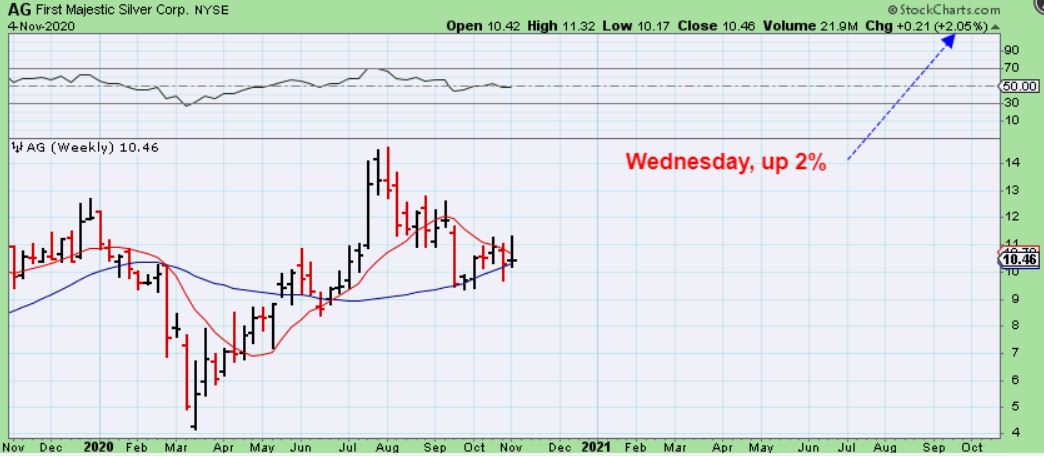
AG : 2 days later AG was up 15%, so this is how quickly these Miners can move. Laggers will do the same. The FOMC MTG had these running all that day, but future bullish earnings releases could have the same affect now that this sector has caught fire. Buyers will be looking to get in.
.
THE MJ SECTOR : I have discussed over the past couple of weeks that this sector seems to be basing out/ bottoming. This week some of these have also rocketed out of the lows. Is that a ‘Biden’ move, since his team wants to legalize Medical and recreational marihuana nationwide? Maybe, but whether it is or not, this sector blasted out of the lows too, so I wanted to point out one more thing.
.
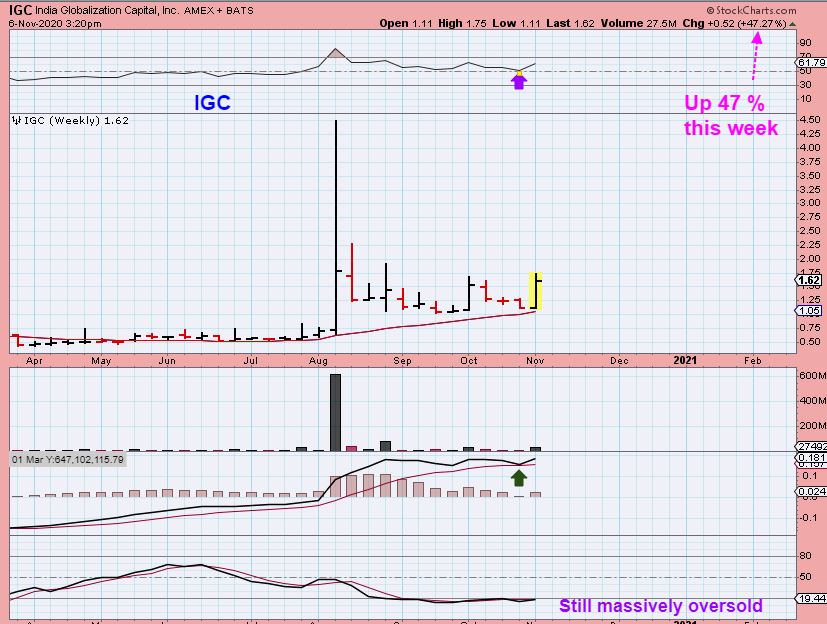
IGC WEEKLY – Many of these companies took off out of bases too. This is IGC up 47% this week. These can continue higher too, so I wanted to show you another interesting trade possibility.
.
These can continue higher too, so I wanted to show you another interesting trade possibility. IT IS RISKY, this is NOT a ‘get rich quick’ trade, but I have seen it work out very well in past bull recoveries. It even worked after the Bear market beat down Miners. I’m taking about buying into bases that have potential. Let me explain, and I will discuss this in future reports too-this is just to acquaint you with it.
.
THE STORY: Many smaller MJ Companies used to trade much higher as Bull Market rallies before the sector went cold. Some were doing very well, but got caught up in a bear market liquidation phase. If this sector is entering a bull Market phase, these can start to recover too. Well, many Miners that were down at 10 & 20 cents forming bases have moved to $1 or $2 in the recent Bull run too. Some of these MJ Companies could do that also, if we are starting another Bull run now. Time will tell, but let me show you some bases now.
.
TRTC popped in May, dropped and based out and popped this week for an 85% gain. I wouldn’t buy this at this point, but as a leader I would watch it, because the others that I show you might do as this does. It will give us clues if the move is real. The bigger ones ( CGC, OGI, HEXO, TLRY, VFF, CRON, etc) may also give us clues as to whether these will have follow through.

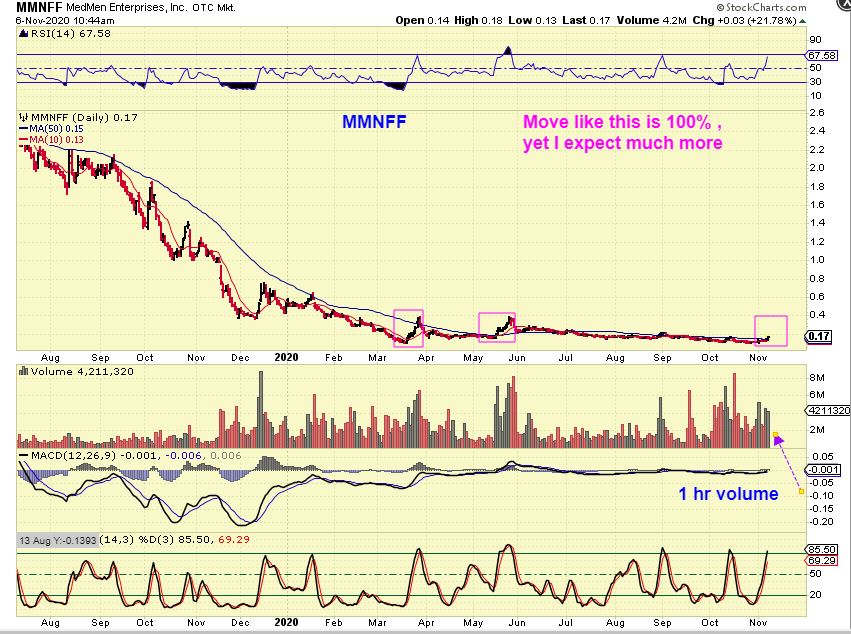
MMNFF DAILY popped 21% Friday, but this looks like it may just be starting. I remember MMNFF trading nicely from $2 to $7 in 2018 and then around $2-$3 for 6 months in 2019, then the bear market took over. Can it recover? I cannot say, but it popped and has a solid base and even if it made it to $1 over the next year as buy and hold, that is 500% from here.
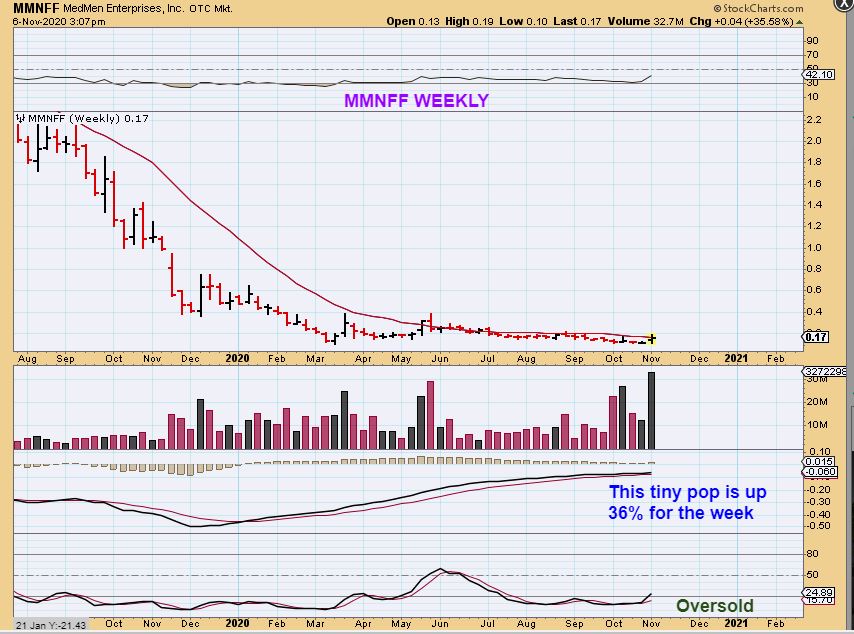
MMNFF WEEKLY – This was up 36% for the week. Here you can see the base better with a surge of volume pushing it above the 10 week ma. It remains very oversold on a weekly.
MRMD was ‘only’ up 20% last week, but volume surged and it is also trying to get above the 10week ma. The potential on this is huge. If the sector is changing back to a bull, these can make a nice recovery run. It was trading above $4, it is based out 17 cents?

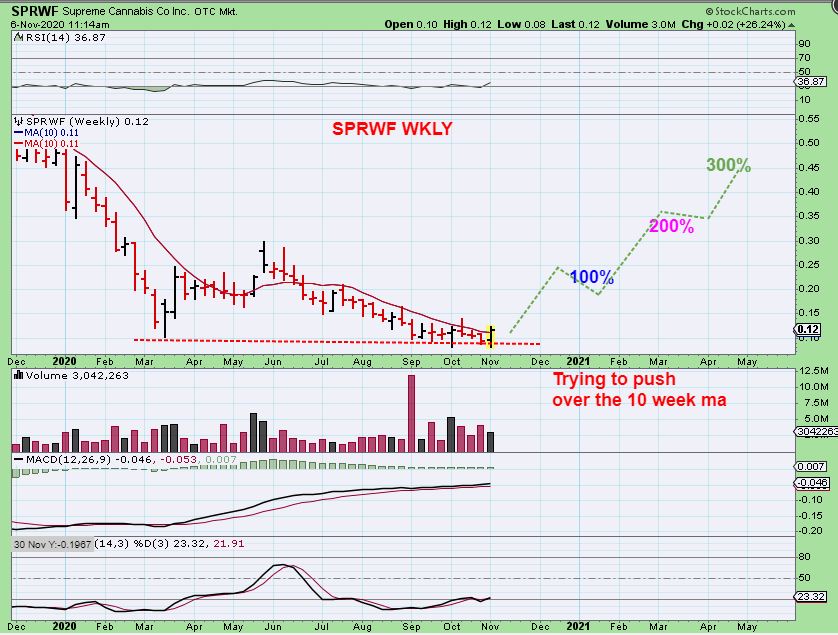
SPRWF – This was one that traded very nicely back in 2017-2018. It ran from 75 cents to $2.75 and chopped around, until the bear took over. It is now 12 cents! It is up 26% because it ran from 8 cents to 12 cents, but this could run to (fill in the blank) over time. Let me zoom in…

SPRWF WEEKLY -If the bull returns and this makes a recovery, this is showing the % gains over time.
A WARNING ABOUT THESE MJ BASES: If the bull returns here, some of these will make 500-1000% gains, others will go bankrupt! IT IS TOO EARLY TO KNOW if a full fledged bull Run is up and coming, but it does seem possible under current conditions. This is NOT being recommended to entice any readers to get reckless, but a heads up that this sector may be heating up. Maybe a small position now could grow nicely ( I have done this with Miners and other stocks). Some of you may recall that here at Chartfreak we rode NAK from 45 cents to $3 out of a proper base that I spotted forming. And we bought the base of ENPH and made great gains too! Take a look at this…
.
Do you remember when we bought this base? We bought this base under $1, it was a proper base, and…
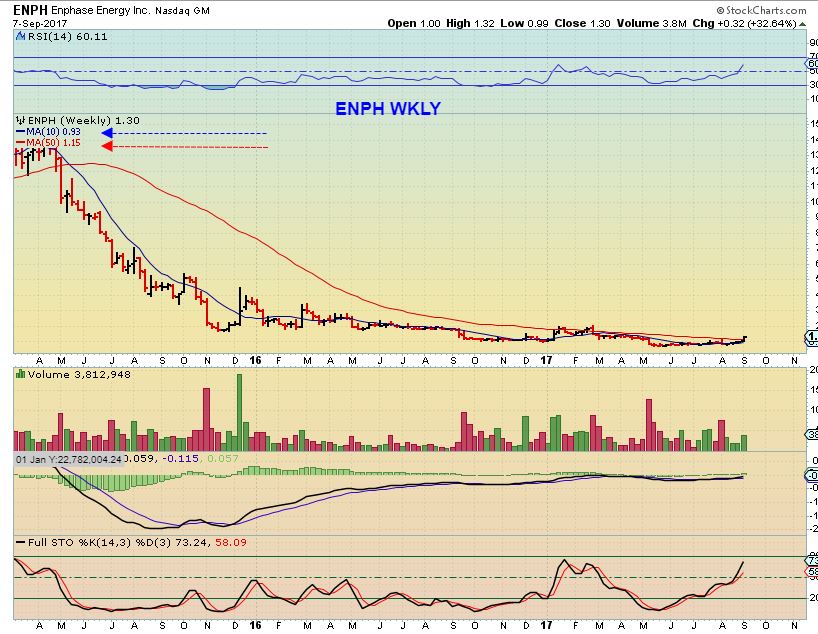
After covering that trade with many charts, it later was covered here at $3+ and continuing to break out. I sold it later and traded it along the way, but I shouldn’t have! Why? TODAY THIS $1 Stock IS ..
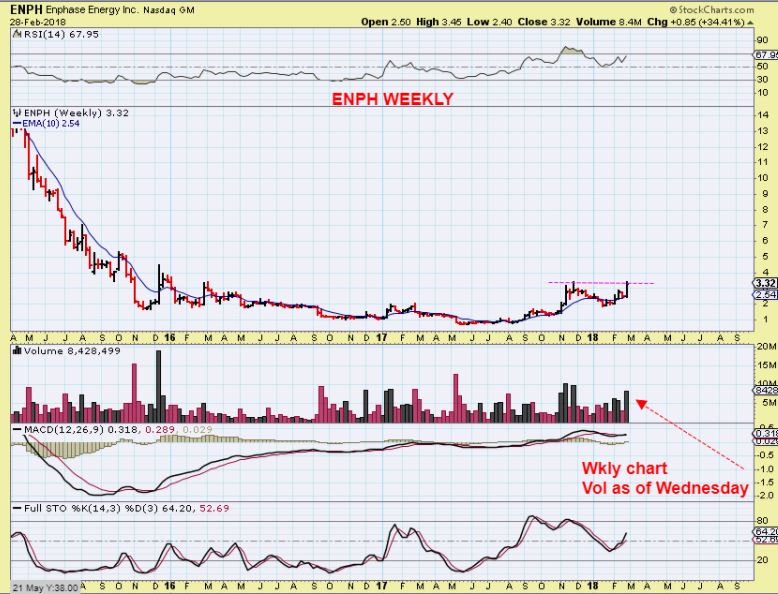
.
TODAY IT IS $122!! Can you imagine just buying 1000 shares under $1 in 2017 and never selling it? Today that $1000 purchase would be worth $122,000+. That said, now look at this chart. ENPH was a rough and VERY CHOPPY ride at times along the way, but buying low allows you to just let it ride through even choppy times, never facing losses on the dips.

,
AGAIN, These are not easy money, these are not Lottery tickets with a guarantee, they can be risky. I will cover them along the way if they play out bullishly though, because opportunity may be there as they leave their bases.
.
DGLY was one of our BUYS at the 200sma and they make body cams for the police and other security equipment . With possible unrest in the US at election time, it is still a by & hold & Fridays reversal on the 10sma was another ‘buy‘ the dip or ‘add on the dip‘ opportunity.

.
BY REQUEST: BIG PICTURE OF KGC –
.
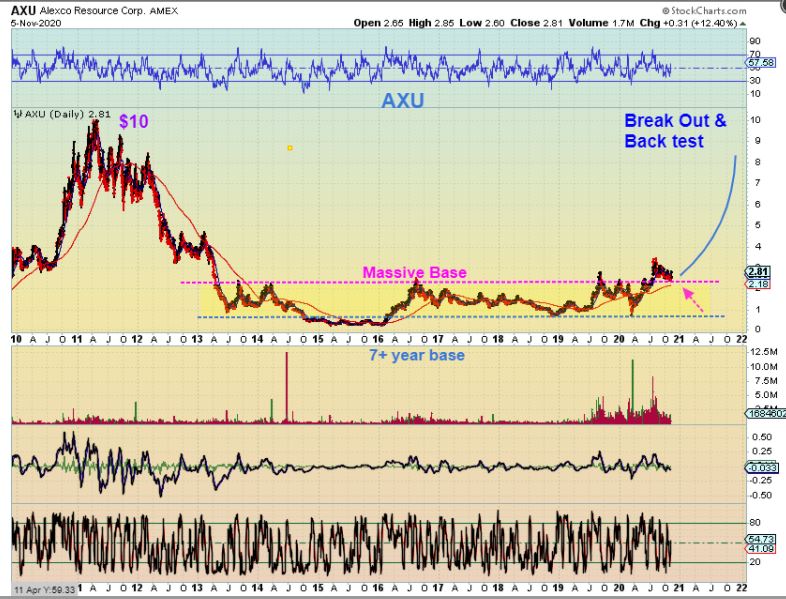
I posted longer term charts of the potential of CDE & AXU, as seem below. I was asked to show one of KGC.
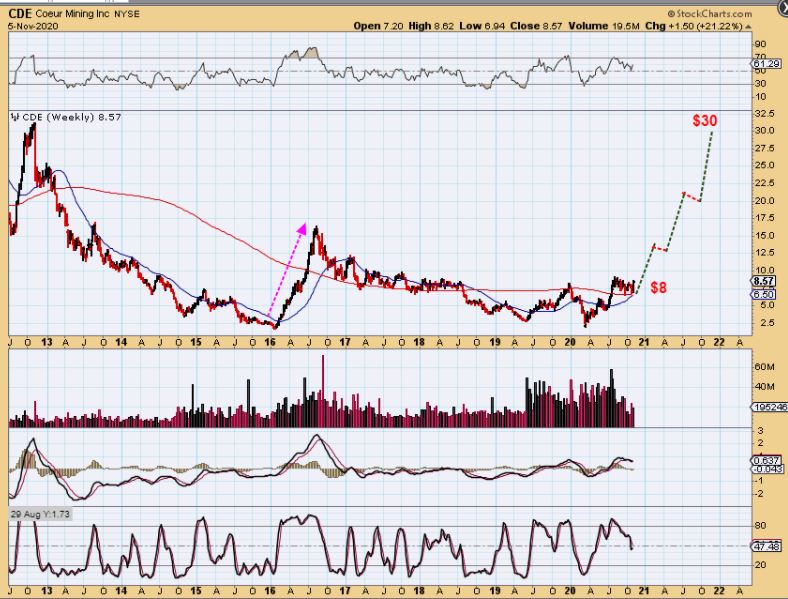
KGC was trading at $8 this week and reaches prior highs near $22. There is a lot of resistance on the way above $14, but a bull will run right through it.


