
Weekend Report November 28th – Rest Up!
Most of the markets have been very bullish with the exception of the Precious Metals. For that reason the market review will be quick in most areas and the focus will be on Gold, Silver, and the Miners.
.
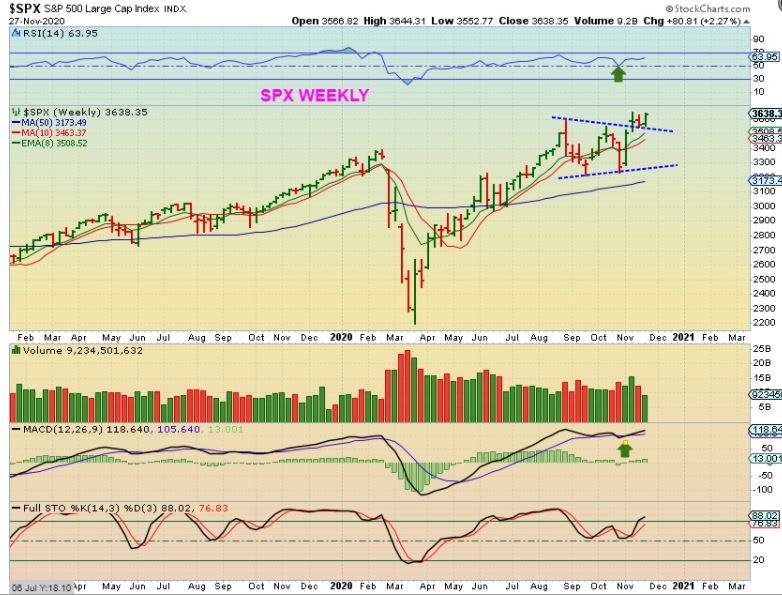
SPX – I discussed a bullish ‘W-Pattern’ or Triangle and we broke out. The markets closed at the highs after a small back test so I would expect this to continue acting bullishly in the Big Picture. That said, I do see some ‘cautionary notes‘ like the Put/Call ratio and human sentiment being too Bullish, but it doesn’t change the overall set up. We always trade expecting that a pull back can happen at anytime and we could get a dip into a dcl soon, so I’d use stops under the 13 sma daily or 10 week ma.
.
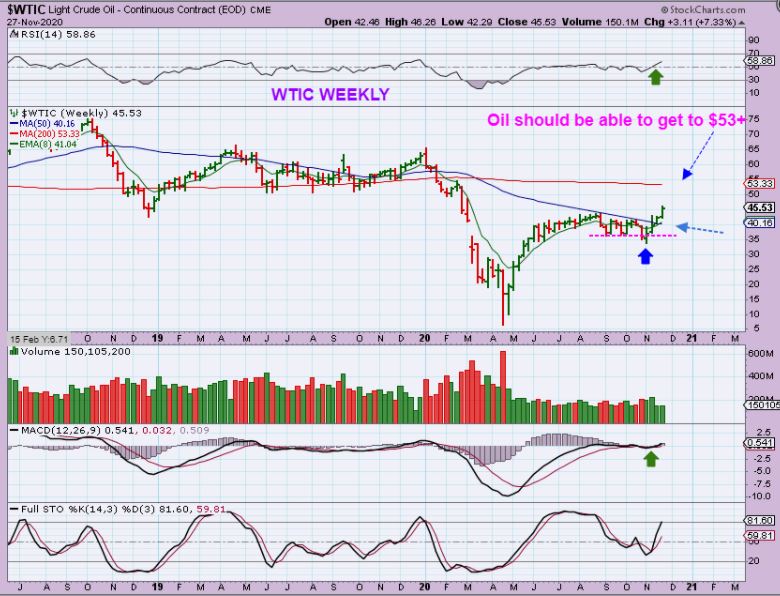
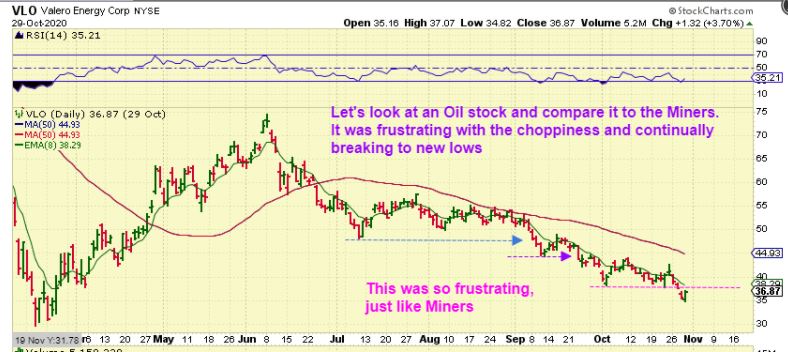
WTIC WEEKLY – As you know, that Oil sideways choppiness has finally turned Bullish too, and Oil stocks have been gaining for weeks. I think Oil has more upside, see the chart.
.
Same chart: I want you to remember how frustrating Oil & Oil stocks were as they chopped sideways for months. Do you remember me trying to buy Oil stocks at the lows and they just stayed choppy? That is what Gold & The Miners are doing now. Let this chart offer you hope that when we say an ICL is due, this is what happens when the selling ends. Golds choppy drop will end too, and we will get an upside run in Miners out of an ICL.
.
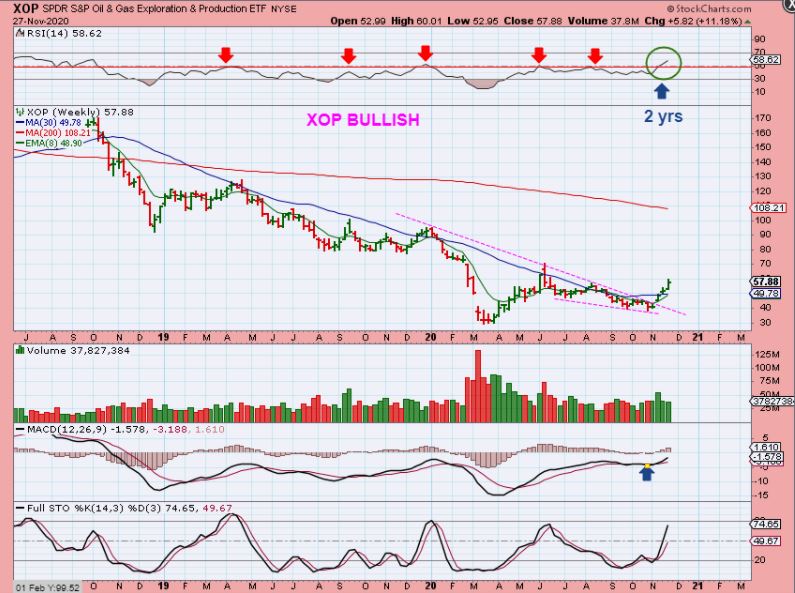
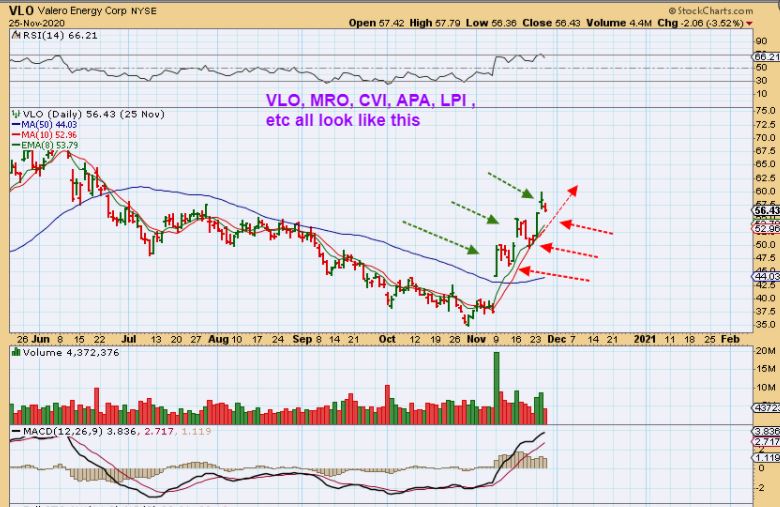
So the XOP (Oil & Gas stocks) broke out and has been running higher for weeks now, out of a higher low. I have pointed out APA, MRO, VLO, VET, ERF, CPE, CVI, LPI, etc. etc. etc. and most are up 70-100%. Look at the weekly RSI. This is the first time in 2 years that is has broken strongly above that 50% line. We might want to anticipate inflation in the energy sectors.
.
Again I want to remind you that this traded very choppily and struggled to get going, but now they are flying. Let this help you to see what we should expect once the selling with the Miners ends and the buyers and short cover begins.
.
.
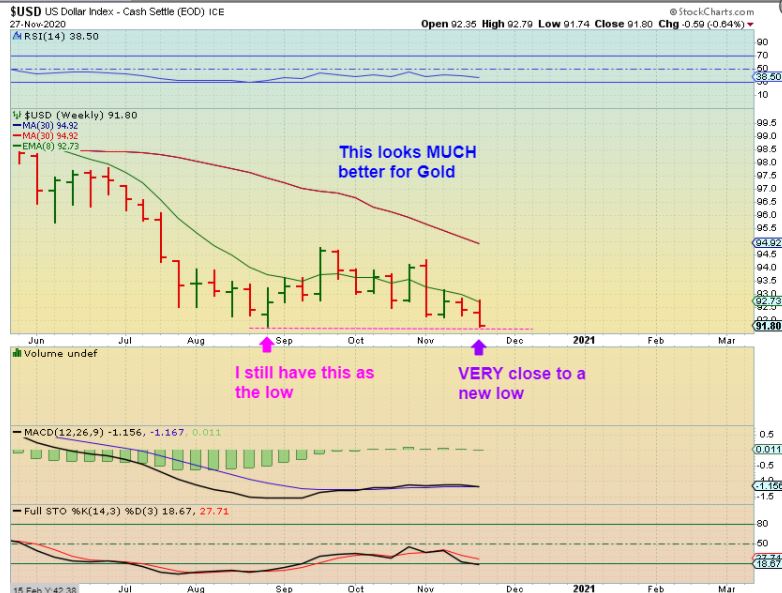
AN EMAIL FROM A FRIEND WE’LL CALL Mr. Eric Alerted me to the fact that I grabbed the wrong chart. THIS IS The Current USD WEEKLY CHART – This chart looks MUCH better for a push higher in Gold soon, since the USD Popped and dropped over the past few weeks.
.
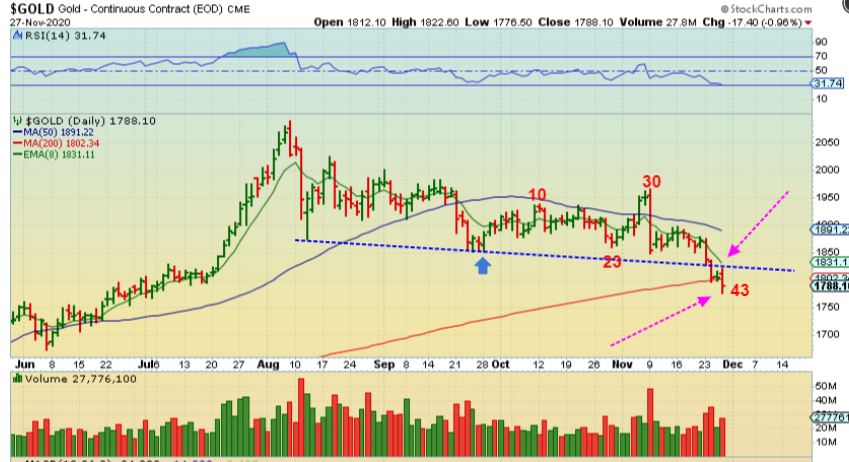
GOLD DAILY – Gold broke down below the blue lower trend line and also the 200sma, so this would run stops on the Bulls and cause selling, but this is also how shake outs work too.
.
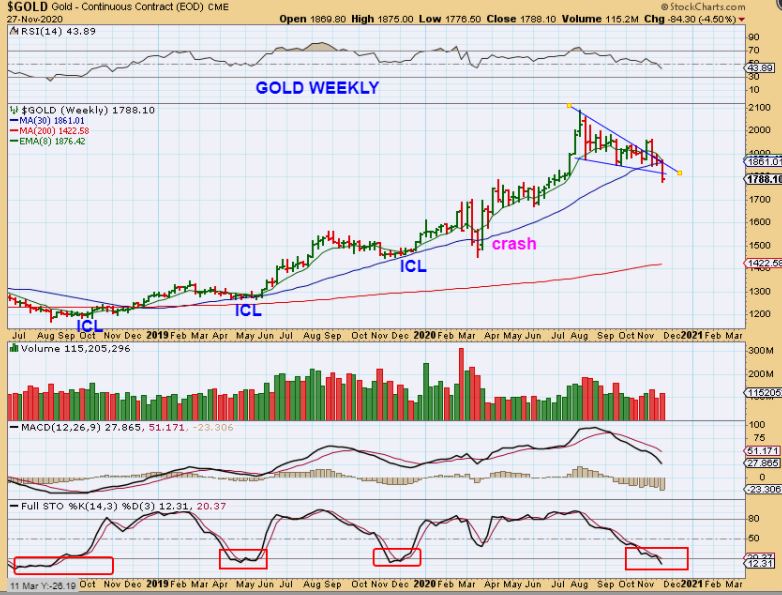
Take a look at GOLD, that Looks rather ugly, but this is what an ICL drop can do. It can make a chart look like a bearish breakdown and cause even the staunch bulls to sell or be stopped out. Also notice that Gold has FINALLY reached oversold in the lower box (Stochastics). Timewise we are overdue for an ICL and a reversal from here really should be our ICL. This almost resembles the March crash when it cut the 30 week ma.
.
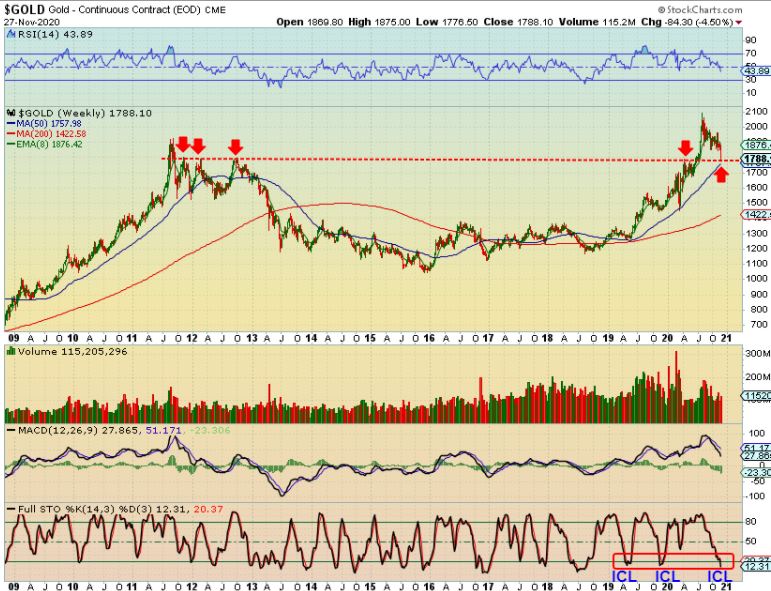
GOLD has basically done a perfect back test of the prior series of highs in 2011-2012. That is rather beautiful. I can picture an ICL and a rally out of the back test as being very profitable. Please also look at the stochastics on this chart too. An ICL is due.
.
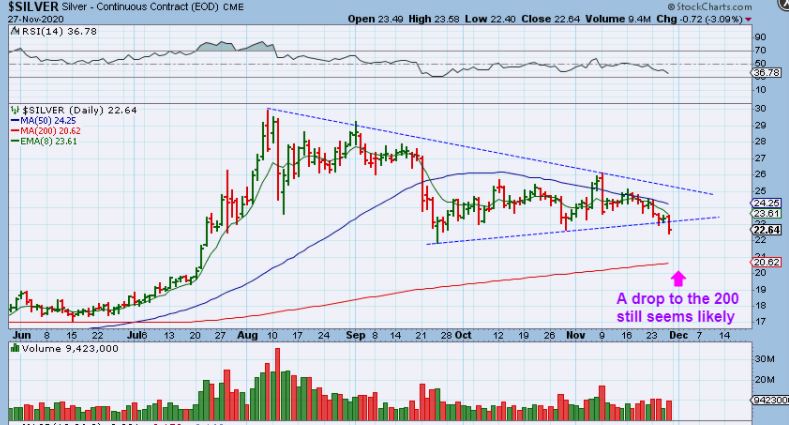
SILVER DAILY: This still looks like it should drop down lower really. The 200sma is now around $20 and I have been saying that I thought $20 was a target that Silver should reach. I do think that Silver needs to drop there next week, but at the same time the Miners may be near or at their lows.
.
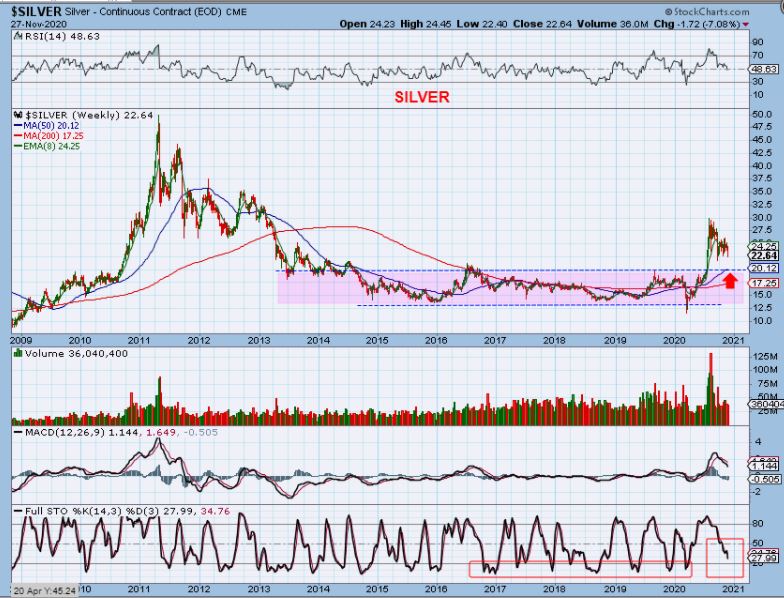
SILVER WEEKLY BIG PICTURE – I don’t think I’m ever really going to be satisfied with this Silver pullback 🙂 I have expected a tag of the $20 area really ever since Silver broke out. I expected the Stochastics to get oversold. That’s OK though. If it doesn’t go there next week, it’s probably off of the table, because deep down I am feeling like the ‘lows are in’ or ‘very close’ for the Miners. Look at this big picture chart and then let’s zoom in on Silver.
.
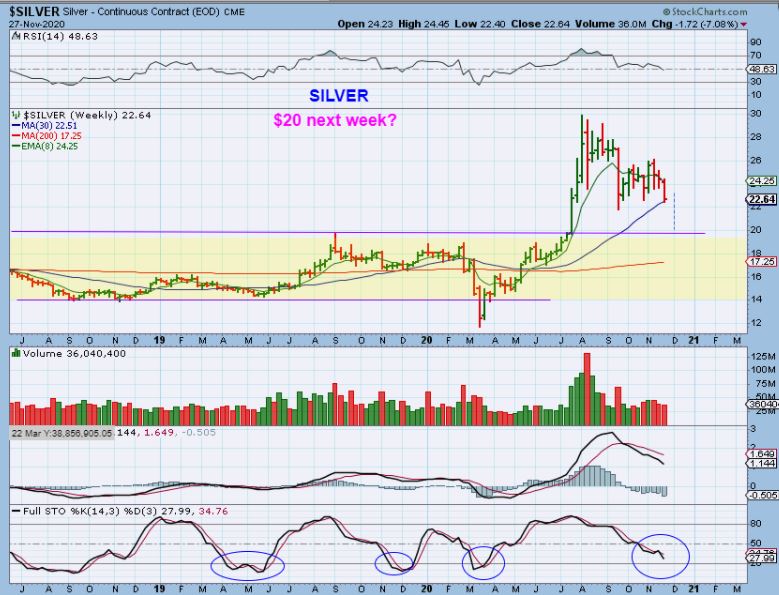
SILVER WEEKLY– Silver dropped and stopped on support. One small crash next week would honestly be perfect! Silver is at $22.64 and a drop to $20 is still possible, it is only around $2 lower, but it needs to happen quickly in my opinion. I am starting to feel that the Miners are bottoming. I drew in the drop on this chart, it is not out of the question yet.
.
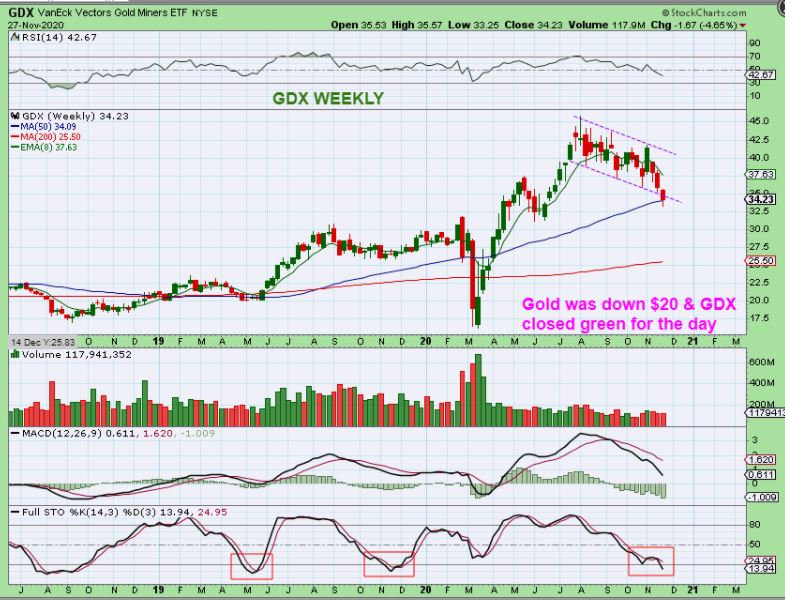
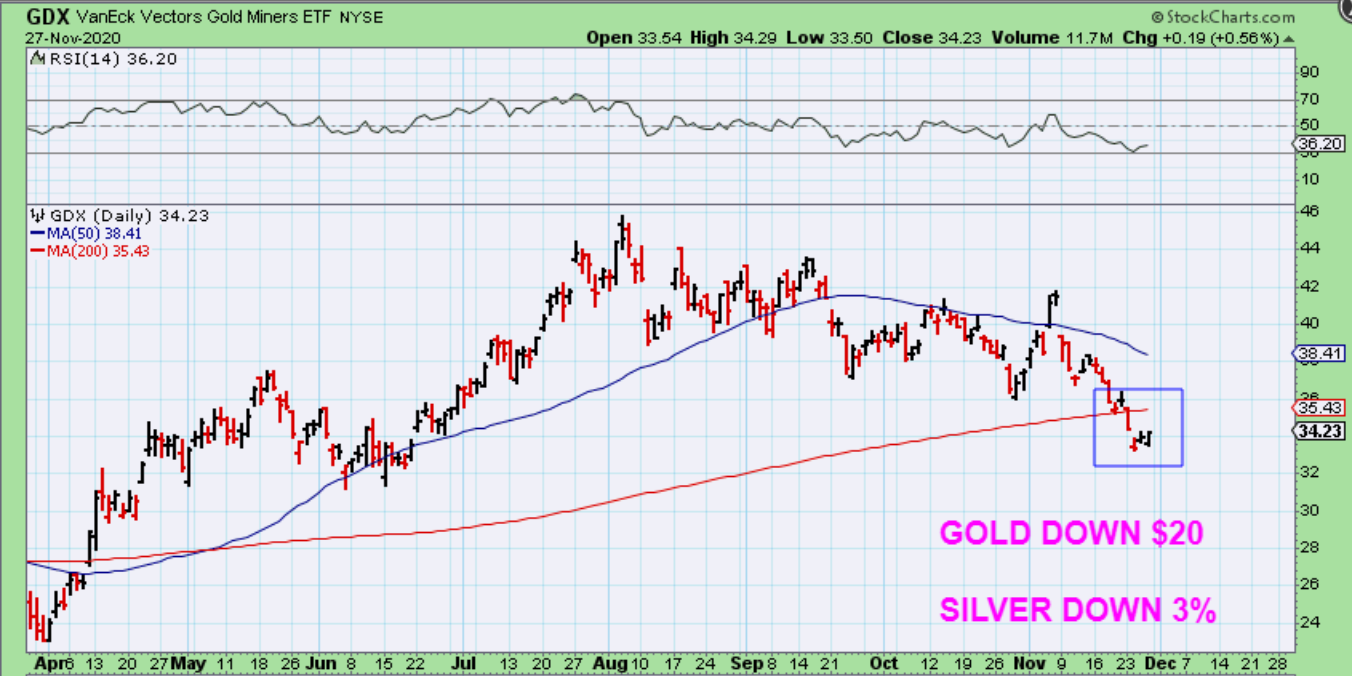
GDX also dropped to the 50 week ma and then reversed and regained it. On Friday GOLD was down over $20 and Silver was down over 3%, but the Miners ( GDX & GDXJ DAILY) Closed GREEN. THAT is noteworthy.
.
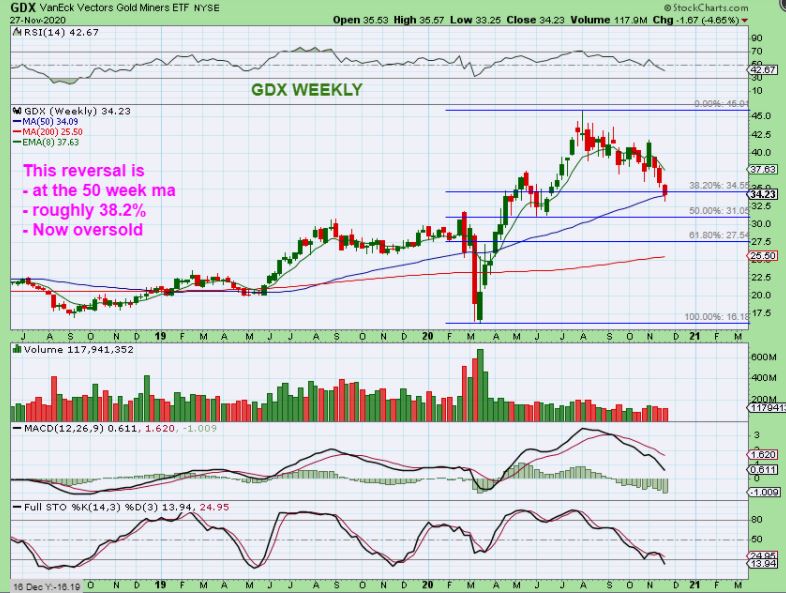
If the GDX holds here, it has done a bit more than a 38.2% drop and that is acceptable in a bull market. Please read the chart.
.
.
FOR THOSE THAT LOVE BUYING OR TRADING THE MINERS, (Or should I say used to?) 😉
.
So let’s take a look at VLO during that Oil sell off & compare it to Golds sell off. I bought one of these lows and it eventually rolled over and this kind of selling is frustrating. It can eventually weaken the resolve to want to buy these ever again. In fact at this point on the chart you’ll often hear, “There is something definitely wrong here. I give up! 5 months of straight selling? There is no way these will ever rally. I’m done!” And then…
.
VLO and the other Oil Stocks suddenly take off out of that final low and we can get a V-Bottom rally. VLO ran from $35 to $60 already. We can get this same type of action with our Miners. It doesn’t always rally out of the lows straight up, but this is what could happen and you want to be ready to at least buy a confirmed ICL as it breaks the 10sma. This huge gap open would obviously be hard to buy, but each dip to the 8 ema or 10sma was a low risk entry.
.
GDX – In conclusion
– The USD dipped down to the Aug lows last week.
– It is also possible for Silver to slam down next week , but it is not necessary. Miners are now resisting the selling,
– It is noteworthy that Friday saw Gold down $20 and Silver down another 3%, yet Miners turned Green, as seen on this chart.
.
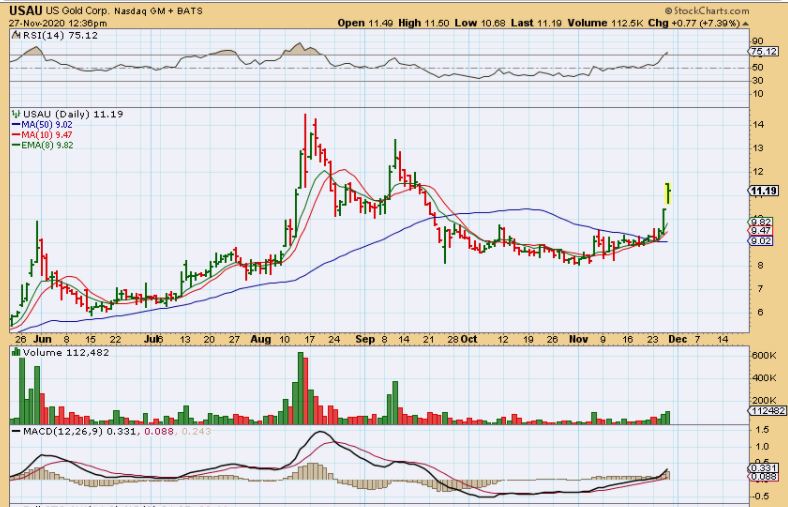
USAU – And we do still have a few miners bucking the sell off. =)
.
.
The General Markets have obviously been Bullish. I am taking note of the Put / Call Ratio and other factors that indicate that a dip could happen at any time, but for now the upside has been the way to go.
.
The USD actually dropped down to the Aug lows, but did not break them yet. Next week really could be important for the USD & Precious Metals.
.
Oil and Oil stocks are V-Bottoming out of the lows and are in a bullish uptrend.
.
Gold and Silver have been selling off and are overdue for an ICL. It is noteworthy that Friday saw Gold down $20 and Silver down another 3%, yet Miners turned Green. I do think that the next swing low that breaks above the 10sma will be the Final low that we are waiting for. This is one of the longest Intermediate Cycles since the last one bottomed in March, so we could get a false drop but that is not necessary.
.
Rest Up and Enjoy your Weekend!
.
~ALEX
.
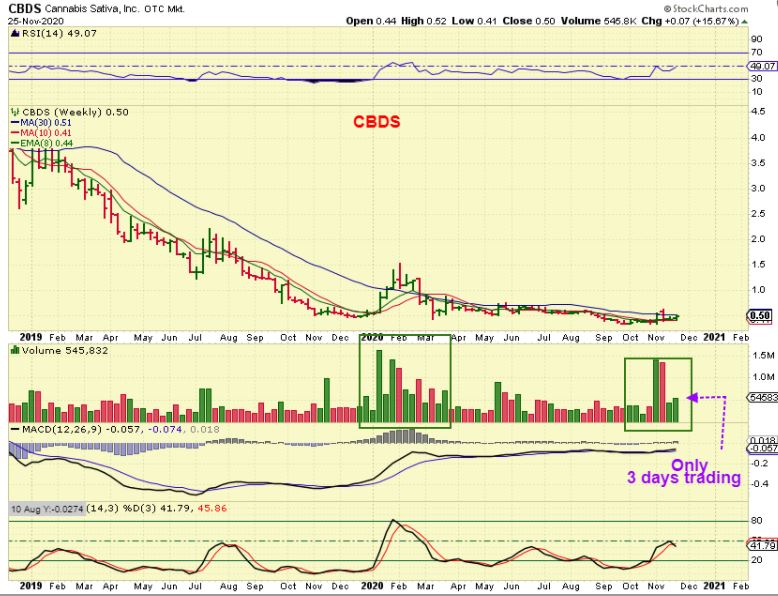
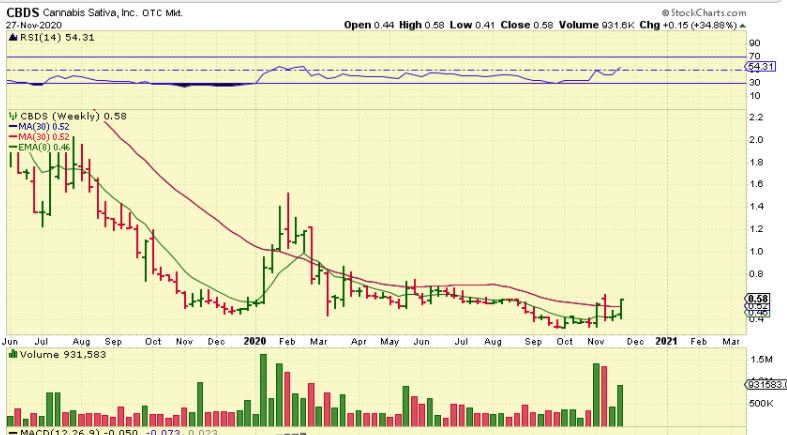
In Fridays report I posted A Daily and a Weekly chart of CBDS -This was a candidate to pop with this bullish set up. I mentioned that it was similar to MRMD, which popped over 100%.
.
CBDS popped Friday and is now up 35% for the week, but this still has a lot further to go. The upside potential for these ‘over time’ is exceptional if this sector remains bullish. Do not be concerned about slightly lighter volume, last week was missing 1 & 1/2 days!
.
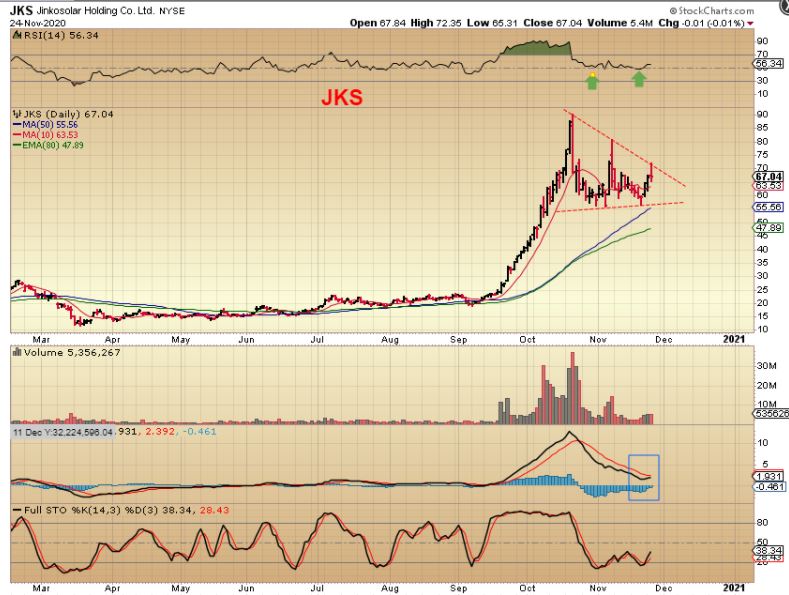
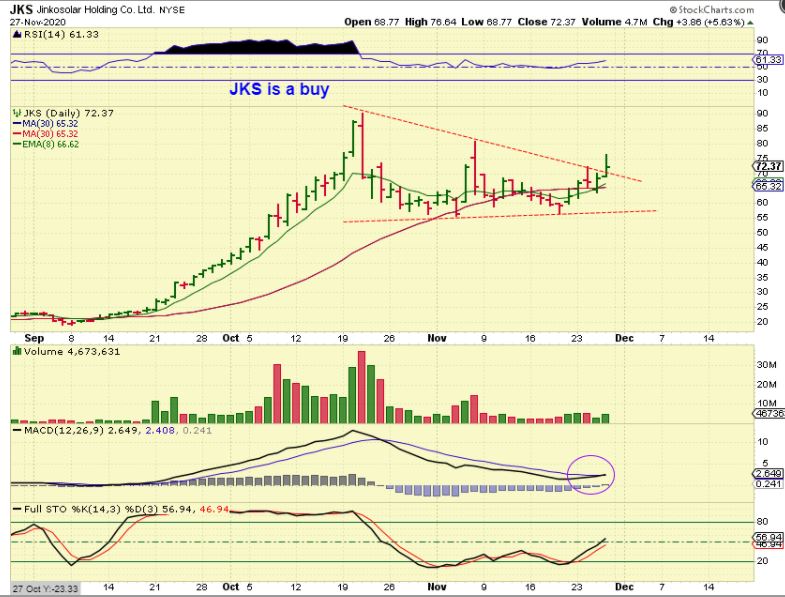
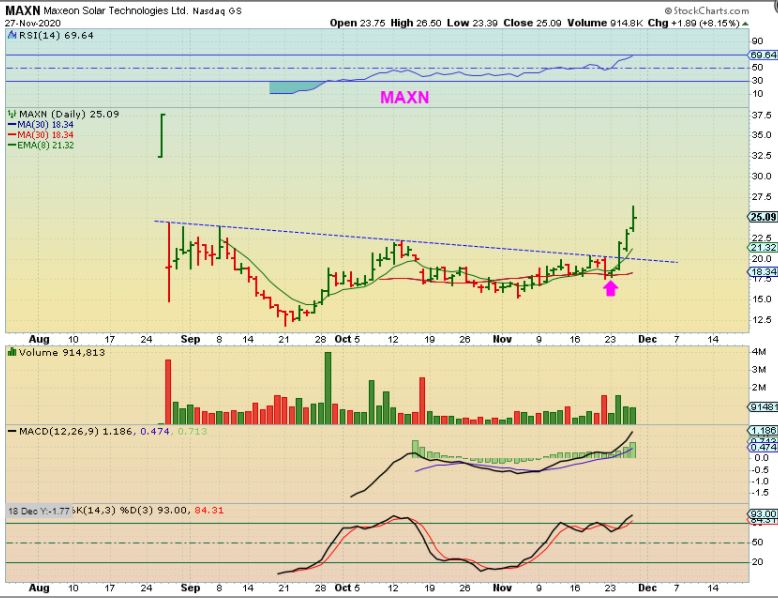
JKS was in a recent report as a buy if it breaks from here, because the Solar sector is hot.
.
JKS started breaking out Friday and pulled back. It may still be a buy.
.
And MAXN continues to run higher too. It was up 13% at one point Friday, but closed up 8%.
.
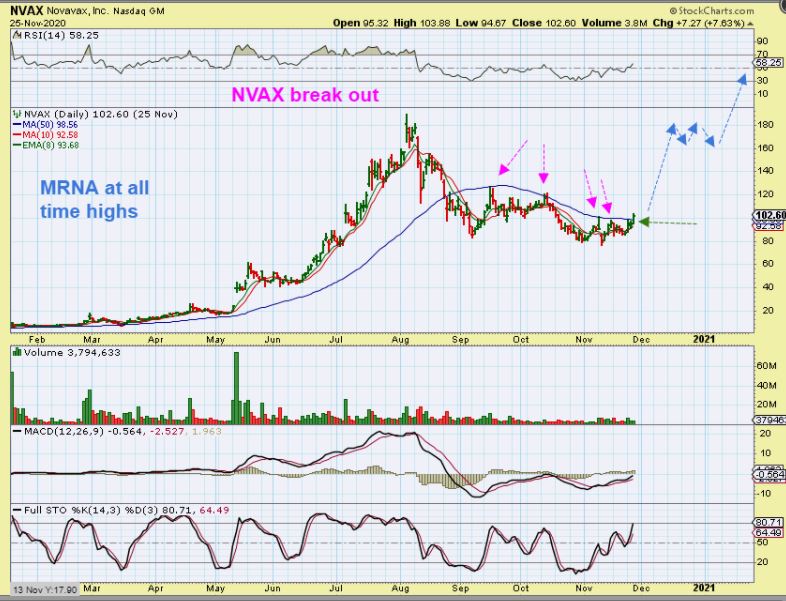
I called out NVAX in the live area as a break out Friday with this chart. It can run up and form a giant cup and that would be great gains again…
.
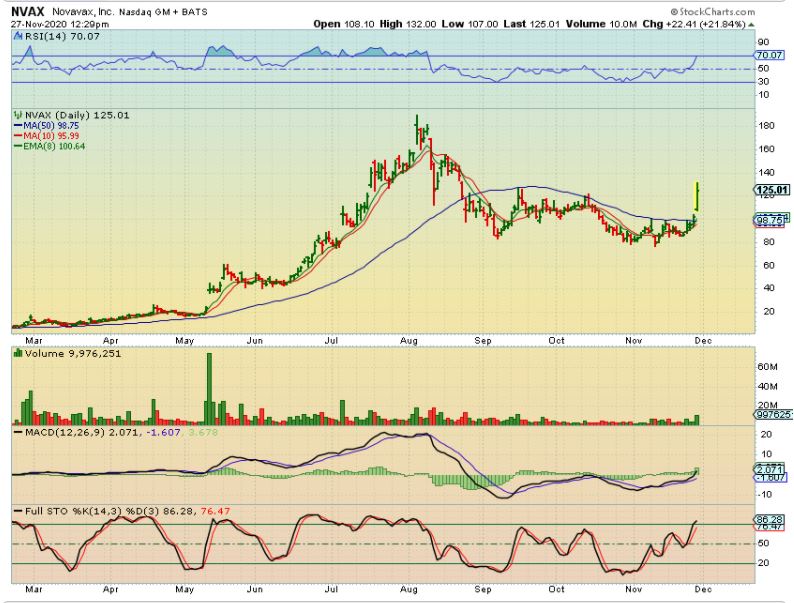
Congratulations if you bought that break out in NVAX, it closed up 22%. If it bull flags or forms a pennant you can add or others can start a position. This is Bullish, up 22% Friday.
.
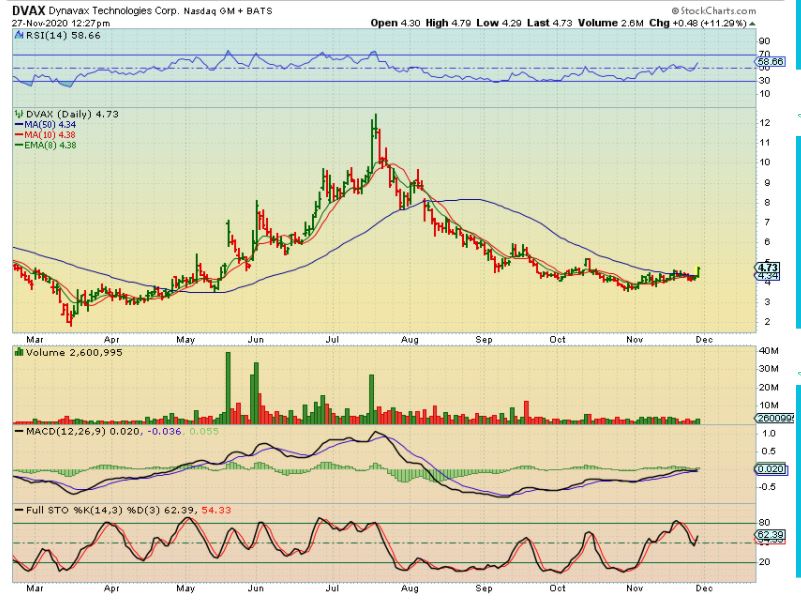
DVAX looks JUST LIKE NVAX did as it broke out too (midday Friday), so I grabbed this chart too. It closed pennies higher so DVAX can still be bought. All of a sudden the Covid Stocks are breaking out again as the spread is increasing.
.
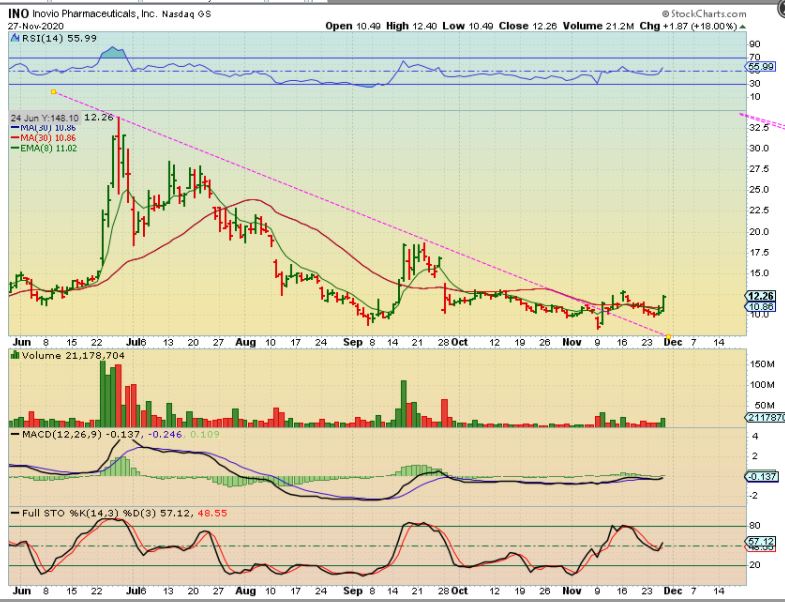
INO This is also a Covid company and it is a Buy too. This can double or triple if it runs like it did the first time and Covids second surge seems to be on the run.
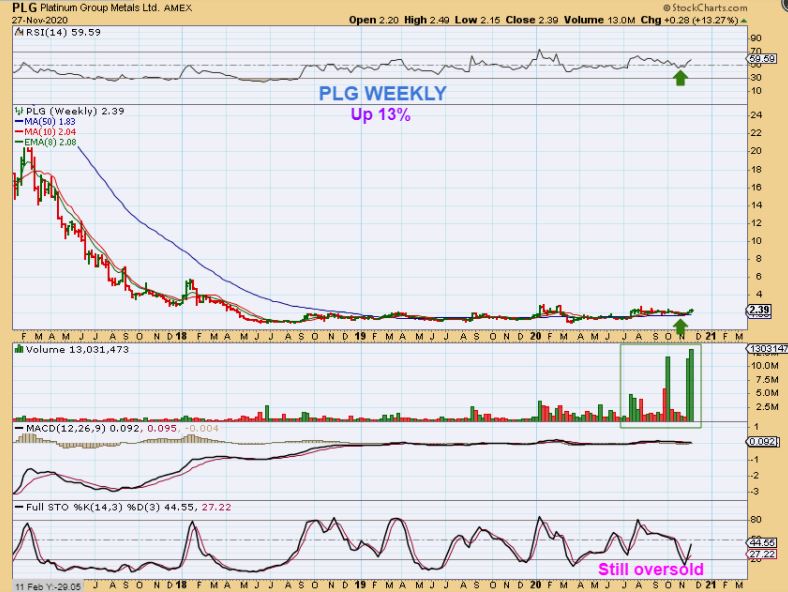
I own PLG, I put it in the reports last week and then I saw this weekly chart. It is up 13%, but I CANNOT express enough how Bullish this is in the long run! Look at that volume. If this pulls back next week, ADD or START A POSITION.
.
.

