Tuesday Nov 10th – Hey! How’s The Water?
We have all seen it: An opening Dip in a Bull Markets price or a nice Gap open higher in the General Markets, but let’s just say that Monday was a bit extreme! I dare venture to say that it was not what ANYONE was expecting. It is during volatile times like this when the markets get a little unpredictable short term and ‘stops’ will need to be honored until things settle down. I personally hate hard stops vs mental stops, because I feel that hard stops are visible and they get hunted down, but for now they need to be in place if you aren’t in front of the screens just in case positions were to go deep south. Let’s take a look at the charts.
.
At 7 am eastern, Futures were looking like this:
Dow futures up 1,450
SPX futures up 130 and
NASDAQ Futures 135
,
THE SPX gapped open in a big way on day 32 and eventually started to close that gap. Some say it was the result of the Elections being verified over the weekend , others attributed it to the PFIZER announcement that their Covid vaccine is 90% affective. I have been saying that ‘The Markets hate uncertainty’ and that helps to quiet some of that uncertainty down.
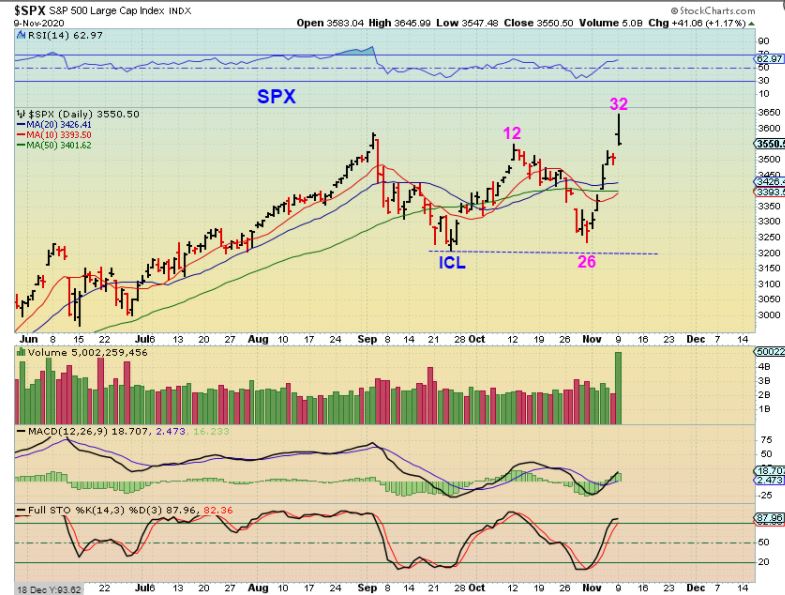
SPX – I pointed out the Bullish triangle in the weekend report and now we have a break out. Were people shorting it there? Next we’ll see if it holds as support.

.
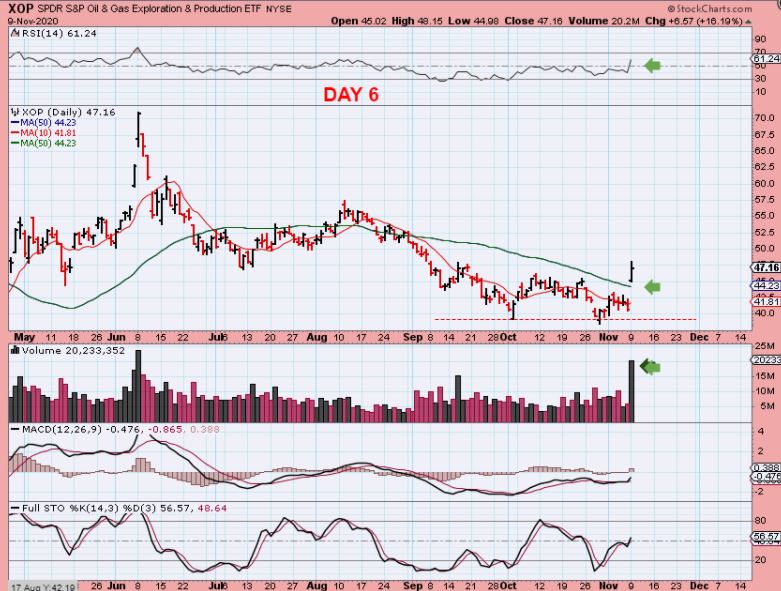
WTIC broke out and was up over 10% at one point. You may recall that last week when Oil put in a low, the XOP did not follow and therefore it did not look like a ‘real’ move. Monday was different.

THE XOP did Pop Monday on day6. MANY Oil stocks were up 20-30%. See MRO, VLO, APA, AROC, ERF, WTI, etc etc .
MRO closed up 23% and above $5, but with an open gap, it is risky to buy. Maybe with a dip it becomes a ‘Buy the gap fill’ opportunity.

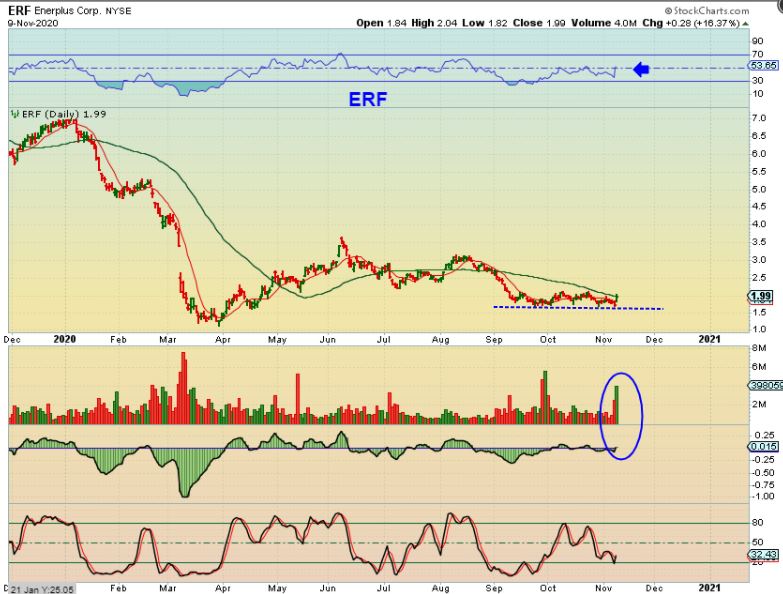
ERF– Did not sell off lately and also did not gap open Monday, so it is easier to buy without worrying about a future gap fill. ERF pushed up against the 50sma as volume swelled & looks ready to break out. Even though it is up 15%, it looks like it has a lot higher to run if it breaks out.
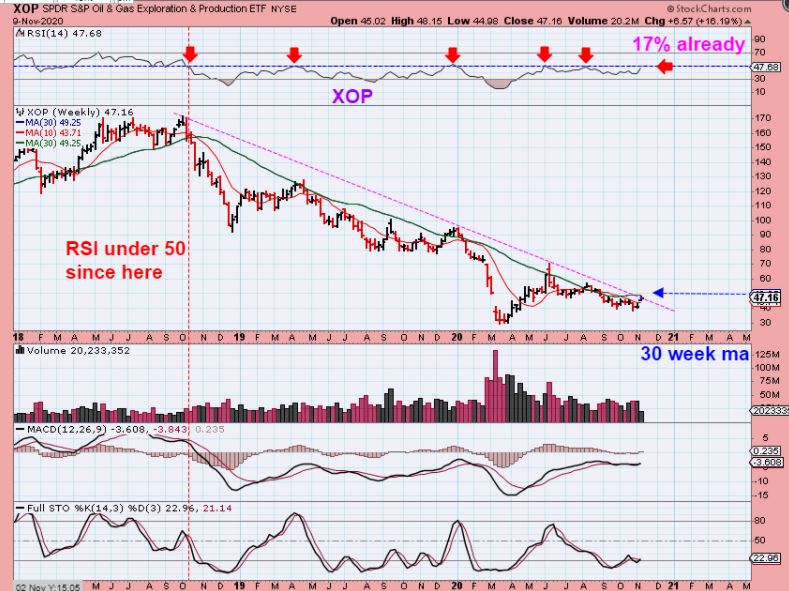
THE XOP WEEKLY UP 17% – I pointed out this downtrend and it did not break yet, but now it looks ready to do so. Also look at the RSI. It has not been above the 50% line for 2 years, and it also looks like it may break out. I’ll be keeping an eye on this again.
PRECIOUS METALS: THERE ARE A FEW POSSIBILITIES HERE, SO BEFORE WE SEE WHAT HAPPENED TO GOLD, SILVER, and THE MINERS MONDAY, LETS TAKE A LOOK AT THE WEEKEND CHART AGAIN:
.
The USD was breaking down, and suddenly it found a reversal. This has simply been choppy and has made Gold choppy too.
If The USD bounces around here at the lows, GOLD could also bounce around at it’s lows.

.
THIS WAS IN THE WKEND REPORT: GOLD broke the downtrend and this is a buy. Notice that I said : It looks early on the stochastics, but this is a buy and the lows should not be broken from here. The RSI acted Bullishly at the 50% Line.

.
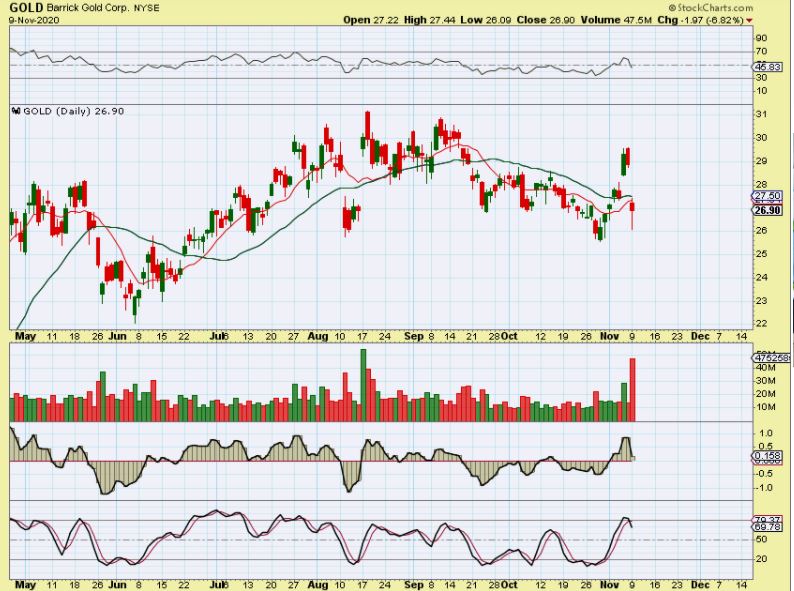
What can I say? GOLD swallowed up the last 7 trading days on Monday and almost took out the September lows. We could easily be seeing one final shake out here, so I will also show you why I think that the Miners may resist a deeper sell off. Now lets discuss this Gold chart a bit more…

Now lets discuss this chart a bit more.
.
GOLD finally regained the 50sma and was forming right translated as of Friday and then swallowed 7 day of trading?
A drop like this after regaining the 50sma is not really normal or predictable. Gold is actually also overbought & lost the RSI 50. All of that seems to show that we may linger at these lows for a few more days.
1. Will we simply get a 2 day drop & reversal like that First Blue Arrow and form as a later ICL here?
2. Or will this possibly become a choppy multiday drop like the 2nd blue arrow drop forming that ICL?
3. Is the ICL ahead or still in place and this is a higher low dcl forming? We need more time, but it is possible that Gold will put in an ICL this week if the lows are broken ( and the Miners may not break their lows). I’ll discuss that later.
GOLD A.M. – I grabbed this chart in the morning to point out that Sept has an ICL with a trend line break & back test at this point. If those lows break? IF THEY BREAK, the ICL drop is likely to be this drop ( but again, it may last a day or 2 more). Notice the circled MACD. That is Bullish.
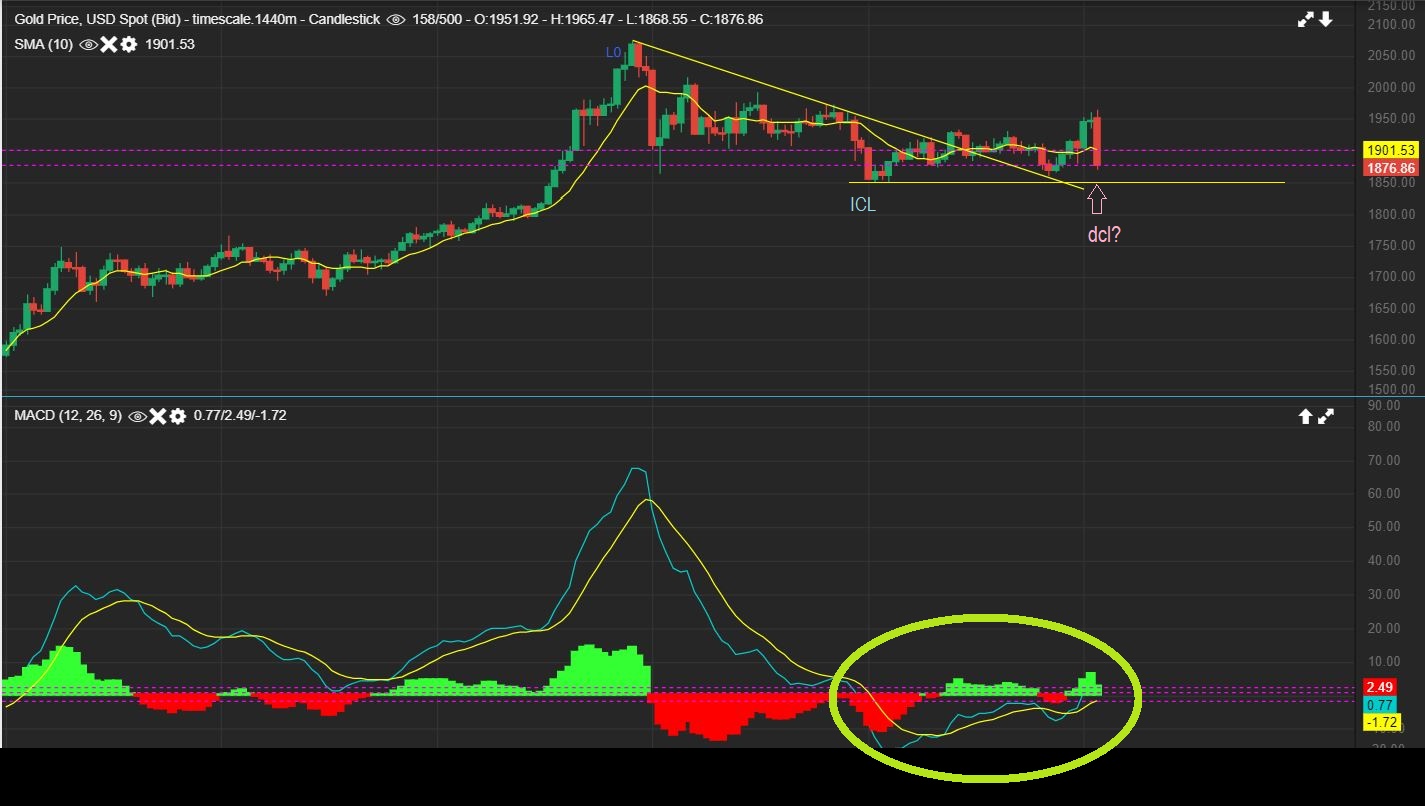
GOLD – Lets say that Gold drops for 2 days similar to that first Big Drop. It could back test the trend line again and we find ourselves on day 33. THAT is exactly where I had originally been saying that I would look for an ICL to come in. This is what I was originally thinking we’d see, but that break out higher last week with a high on day 32 is not normal at all.

I captured this chart of Spot Gold midday. The lows did not break on this chart. We had $1848 in September and $1850 Monday by the close. IF THESE LOWS are not broken, we would then get a day 33 dcl for Golds 1st daily cycle with the ICL in September, and Miners with a later ICL. We need this to play out to know for sure.

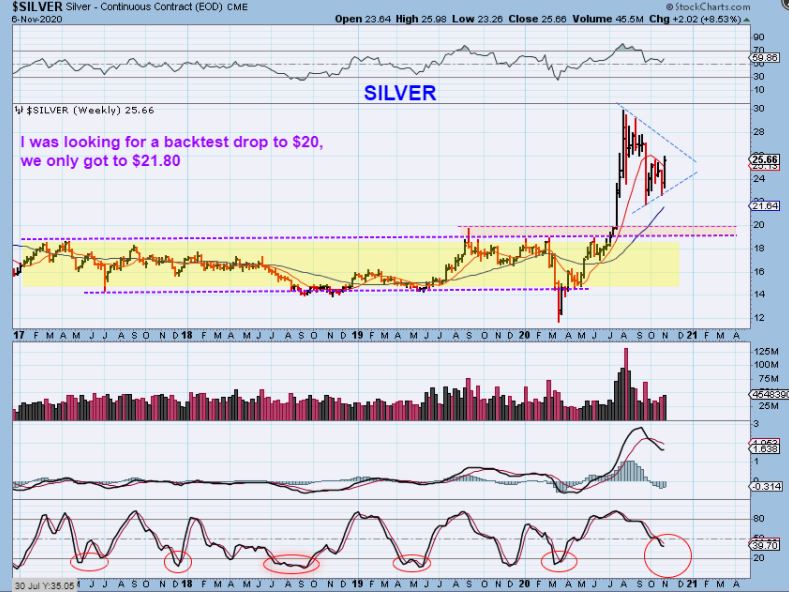
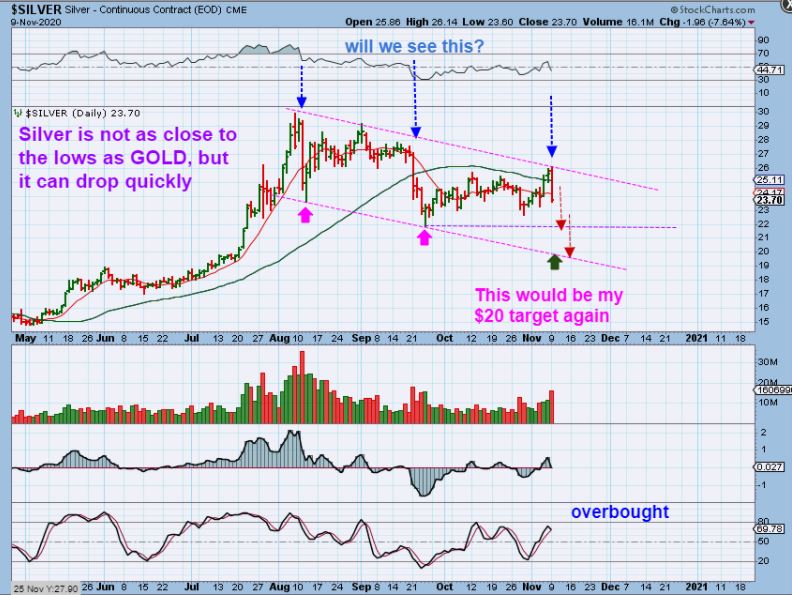
SILVER FROM THE WEEKEND REPORT, I WROTE: I was calling for a $20 Silver low as a back test, but Silver reversed strongly too. We got to $21.80 and Silver synched up with Gold. The low also looks early with that stochastics and blue moving average…
.
In the weekend report I showed these charts as a good reason to believe that the lows are in. We saw Miners with very Bullish 1 week gains.
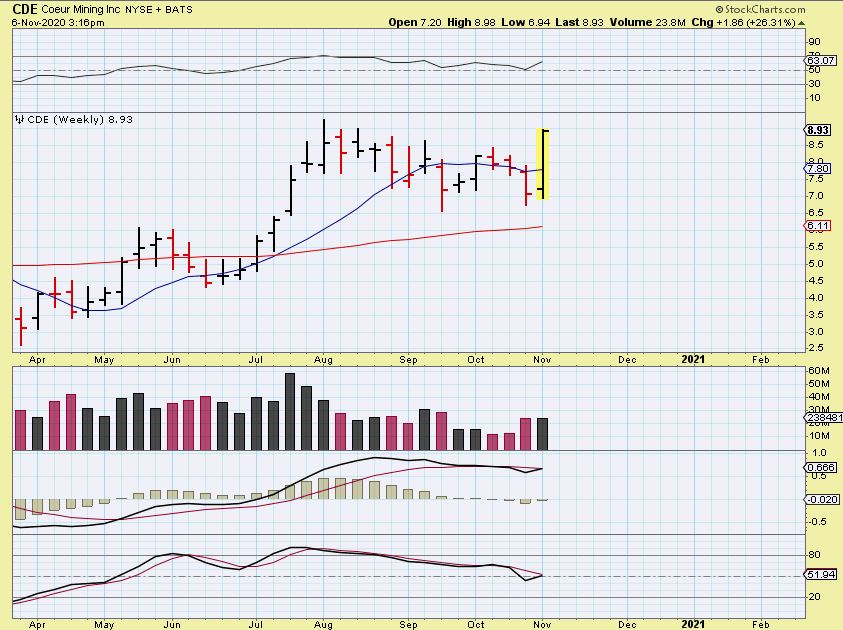
CDE ended the week up 26%.
EXK ended the week up 31%. This helps us to have confidence that Silvers reversal was the real thing too.

HL was up 22% for the week too. A perfect reversal at support actually.

So the BIG drop in Miners was an unpleasant & unexpected Monday surprise, but it could not have been predicted after seeing certain Silver Stocks up 30% for the week. It is one of those anomalies and is not really easily explained. We just have to monitor things along the way, look for clues and signs of Bullishness, and honor stops if things do not act correctly. The set up was Very Bullish just this weekend, and now one day later Sharks appeared in the waters we are swimming in.
Silver fell 7%, but caused less damage than Gold. Is it possible that Silver has an ICL ahead at my original $20 target? It is possible. Now think of this: Silver was also right translated and broke above the 50sma so this also should not break the lows, but if it does, it does. The question is, will Miners hold up if Silver drops? You will see why I think so soon.
.
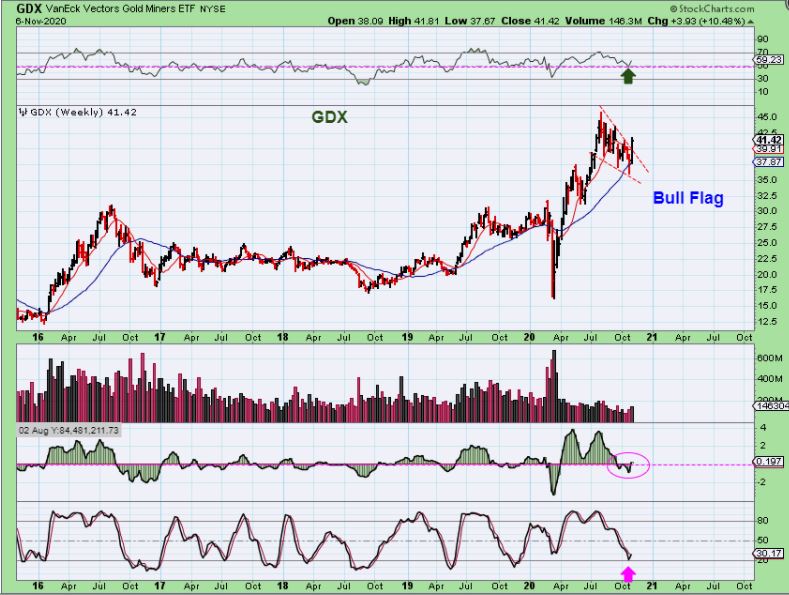
WEEKEND REPORT: GDX WEEKLY – This reversal was pretty clear here at that blue line, with GDX up 10.5% for the week. That is a beautiful bull Flag break out and both indicators are flipping higher.
GDX WY N
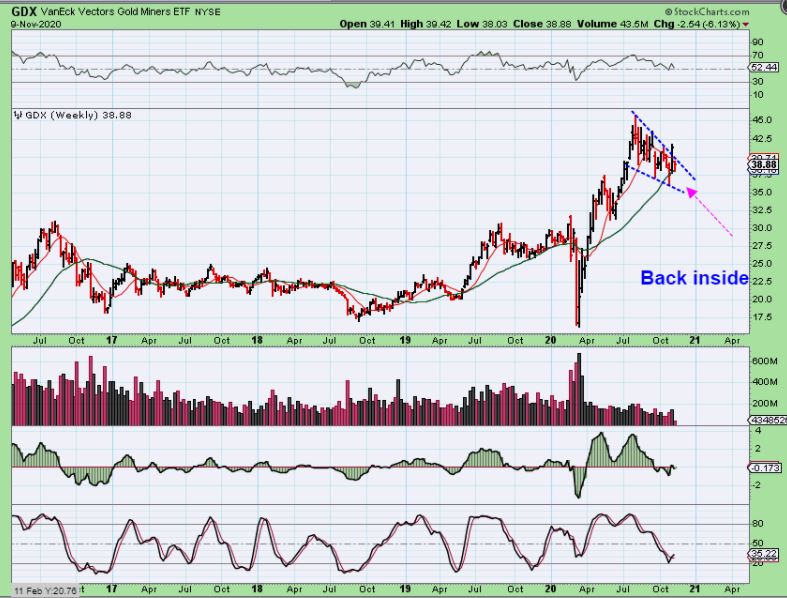
GDX WEEKLY NOW- Price dropped down 6% and is back inside of the bull flag. Dissapointing, but again this is already weekly oversold and may still have the lows in place.
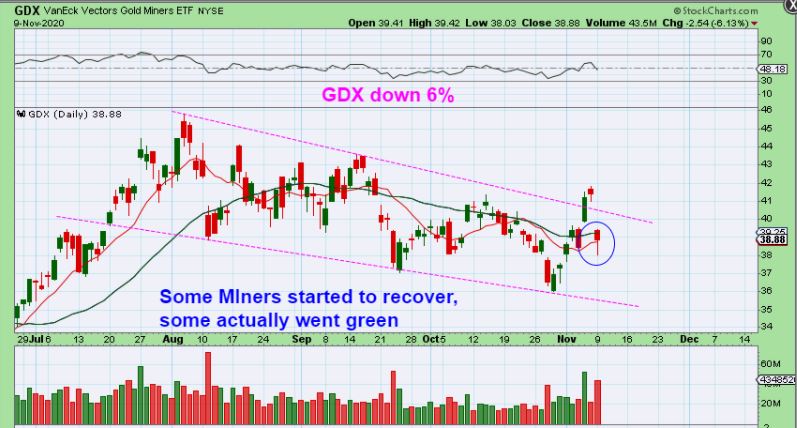
GDX DAILY – So this was Mondays Gap down . It dropped below the 10sma and tried to recover with this reversal candle. From here I just want to show you why the Miners may resist a sell off to new lows with Gold & Silver. Read the chart.
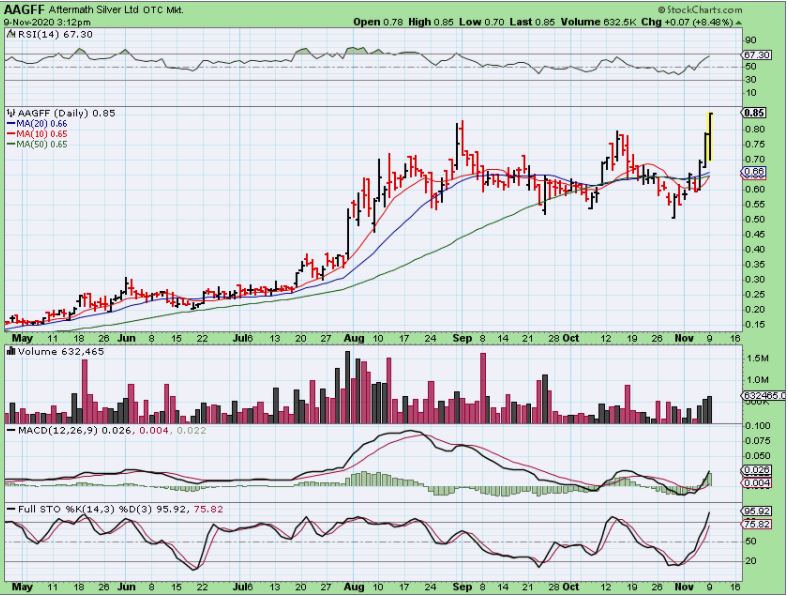
AAGFF is a Silver company that dropped and recovered. It was actually up 20% at one point, but closed back down near break even.
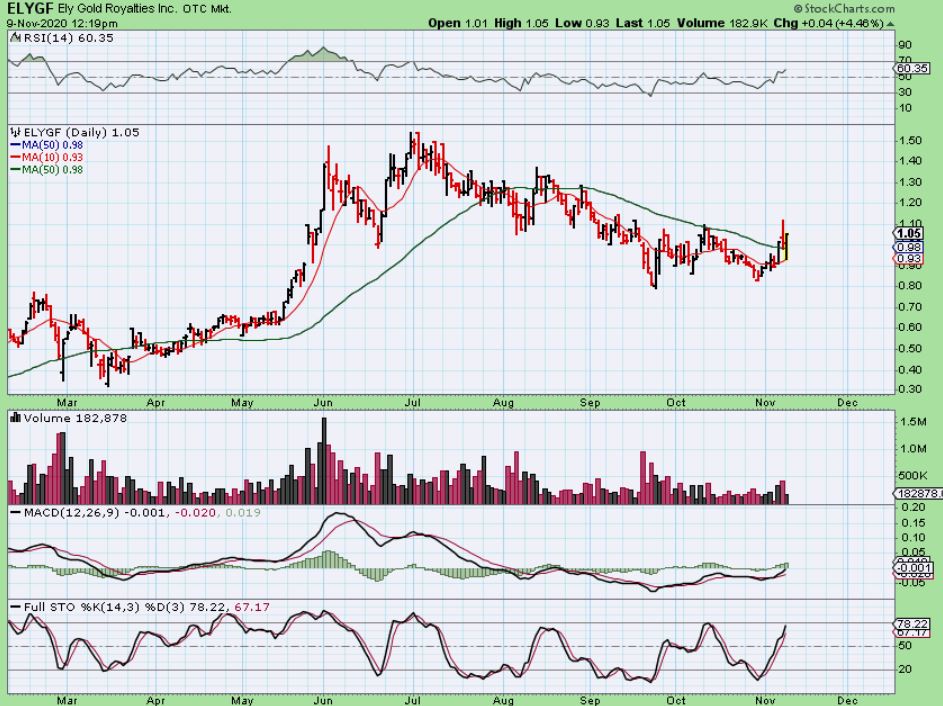
ELYGF also dropped to the 10sma and bounced back to green and recovered the 50sma.
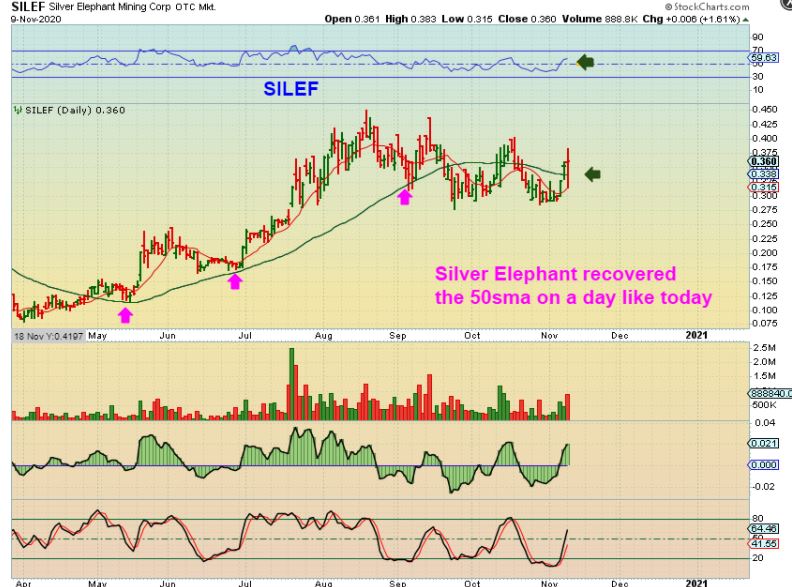
SILEF – This is one that I have owned for a while in a separate account. It dropped all the way down to the 10sma and then recovered too.
.
BARRICK CRASHED and headed toward the lows by 11 am, I grabbed this chart…
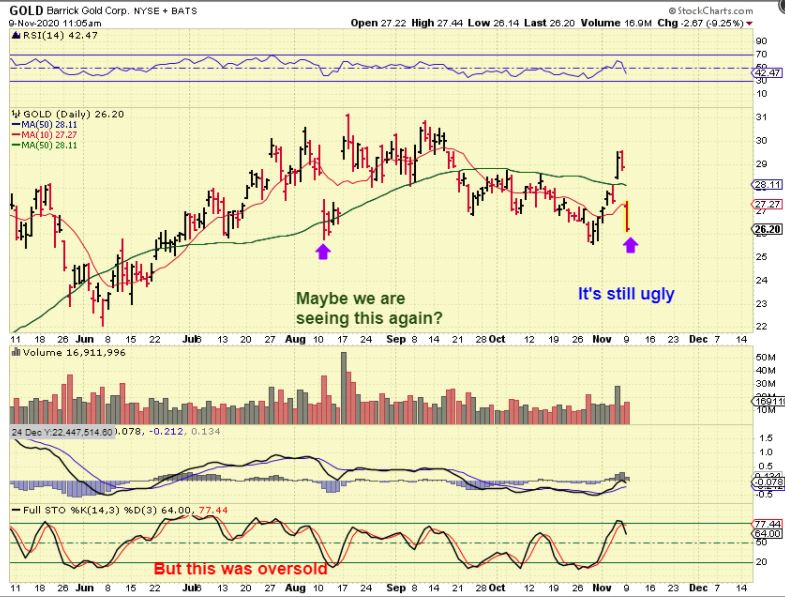
BARRICK STARTED TO RECOVER TOO. I don’t like that it remains under the 10sma and in an overbought condition, but at least some of these miner dropped and bounced into the end of the day.
NEM also dropped sharply and lost the 50sma, but it was being bought back up into the end of the day, with Gold still down near the lows.

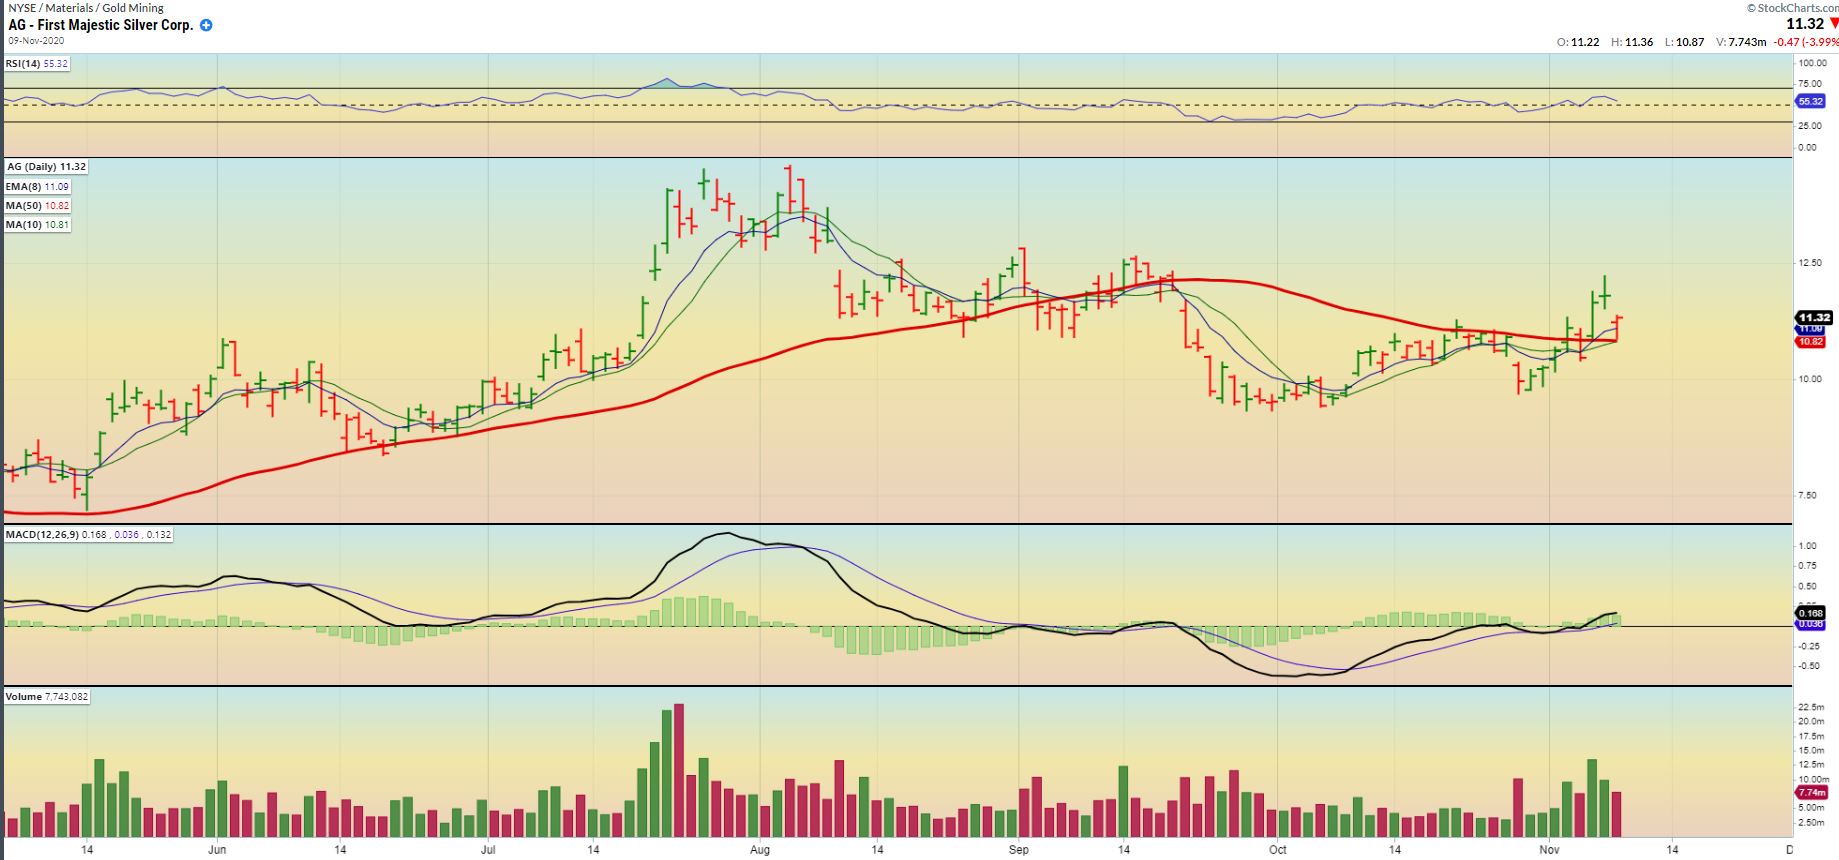
AG also dropped down to the 50sma, but then bounced off of it. So what might this mean?…
The above Miner reactions yesterday to Gold being down $100 does offer some clues that Miners may resist selling off to new lows, even if Gold & Sliver drop further and break the lows as a final shake out. I am not making excuses here, but this was definitely an unpredictable reaction based on what we saw at the end of last week. A strong Fed Day rally had many Miners up 20-30% for the week. Now we have to see which direction is the real direction.
.
I was asked: “Where is the line in the sand where our analysis changes?” It already did, right? Gold & Silver both broke out above their 50sma, and that can be a buy. They lost that big time. The GDX Bull Flag was a break out buy, if dropped back inside. Where YOU draw YOUR line in the sand on your trade is depending on your trading style. We are overdue for an ICL, so we keep watching for signals and clues that one is in place. We saw ‘hallmarks’ of that with Gold in September. A trendline was broken, back tested, and the 50sma was regained. Then it crashed. Now we have to see if the ICL is in place (Sept lows) or do we form one right here ( a shake out under Sept lows). How deep would that be? How many days could that take? These are unknowns, so we have to manage our positions to our liking as we await the proof that an ICL is in.
I will conclude with this thought: We saw our early 2020 ICL in March, so we were due for one in 6 or so months (September onward). September did see GOLD break a downtrend line and that often indicates that an ICL is in place, so I mentioned that back then. We then got a back test and a bounce above the 50sma last week and Miners were soaring, so all looked very Bullish even after the Fed Mtg. The weekend showed very Bullish chart of Miners up 30% for the week. Then Suddenly we have a big crash day on day 33 Monday? As unexpected as that is, it doesn’t change the idea that an ICL is due and should be followed by a rally, but this certainly prolonged the agony of identifying that ICL. So…
.
1. A September ICL could still be in place if Gold holds up above the lows.
2. What if Gold starts breaking those September lows as a shake out? That just prolongs the process.
3. I saw buying Monday in some Miners with Gold down $100. Some regained their 50sma with Gold down, others even went green, so that is encouraging. It is not clear whether the Miners have their ICL in place and resist the selling or not, but they may.
4. The weekend report charts look as though GDX & GDXJ did have the lows in place
5. It is not normal market action at this point, so we need to use stops to be safe, and we’ll see what clues Tuesday brings our way.
.
Sidenote: Oil stocks are starting to shape up and it may be worth looking for a lagger or 2 to buy. Something like ERF, which is still under the 50sma and didn’t gap open. Enjoy your Tuesday trading!.
~ALEX
.
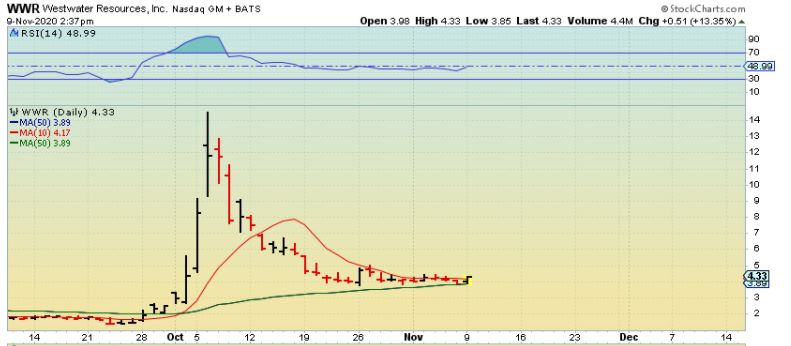
We were discussing WWR last Friday in the live area as it had been drifting back toward the 50sma and I decided to buy a reversal at the 50sma Friday. I posted this in the afternoon, it looked squeezed between the 10 & 50 and looked ready to go…
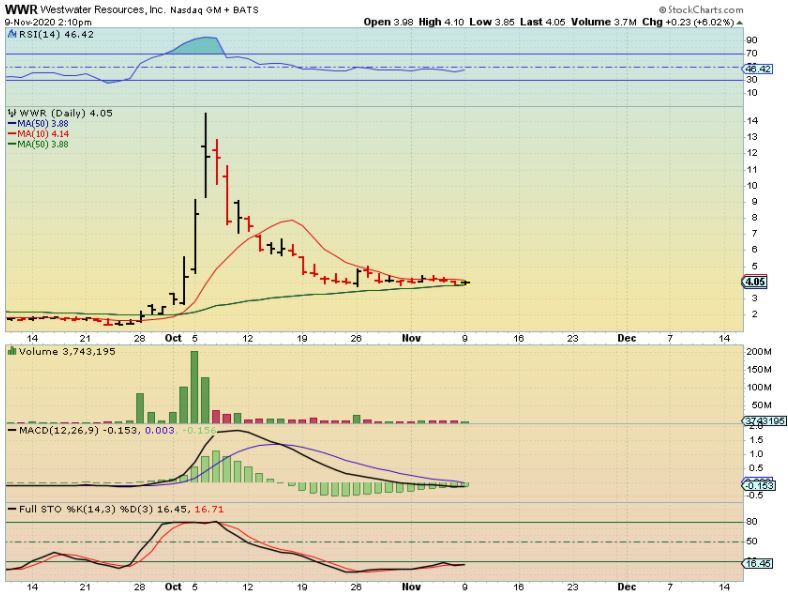
WRR suddenly broke higher above that 10sma and eventually Closed up 20%, above $4.50. WWR may be ready for another move higher. If it starts forming a cup here, it will become a ‘buy the dips’ candidate.