11-19-2020 : Behind The Beauty Cracks Appear
The General Markets were actually looking good all day and then we saw a sudden sharp sell off into the final hour.
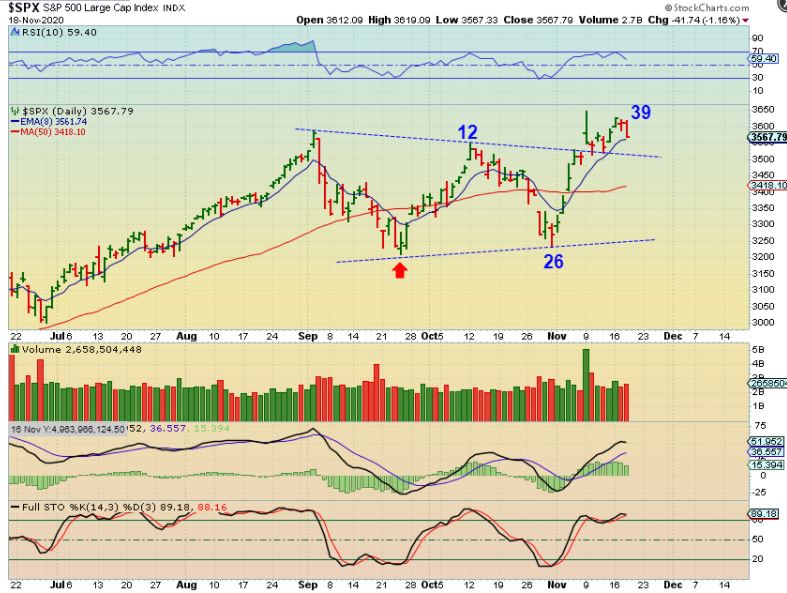
THE SPX landed on the 8 ema again, and normally that might be all we see in our climb higher, but we are also getting late in this daily cycle if this count is correct. That could lead to a deeper sell off, so watch the 10sma. We might actually back test the triangle. A back test of the 50sma is not out of the question either (People are very bullish right now and a pull back always comes along around now and dampens the party. The markets dropped QUICKLY in the last hour yesterday…
.
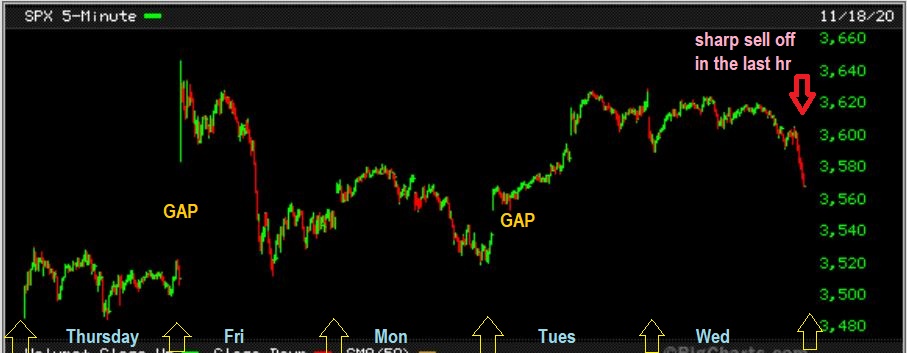
SPX 5 day 5 minute chart– This highlights that final hour sell down. I also see a gap further down, so we could see additional selling and it may be time for a dip into a dcl. The bad part is that many things sold off in that final hour along with the markets and they may all continue lower if the selling continues too.
,
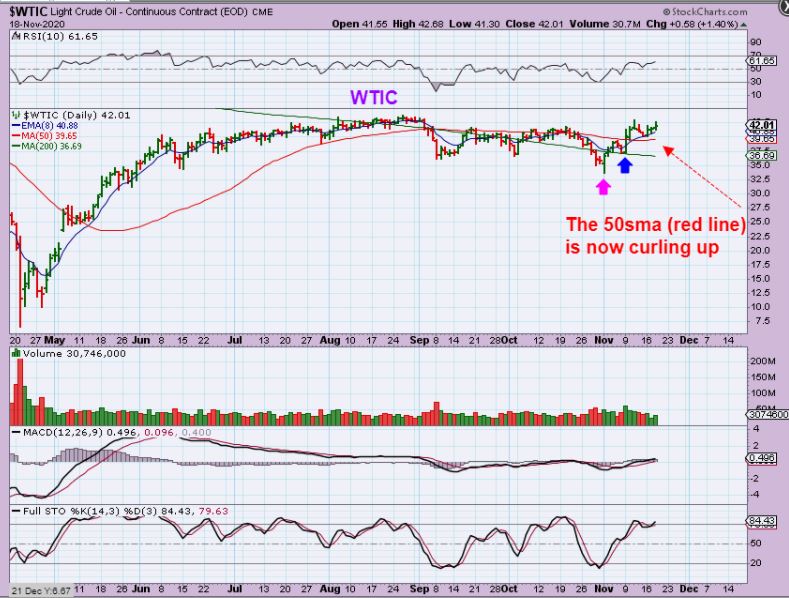
WTIC did not sell down and the 50sma is curling upward. I have mentioned the bullishness of this sector over the past 2 weeks, so we will briefly discuss that again from here…
,
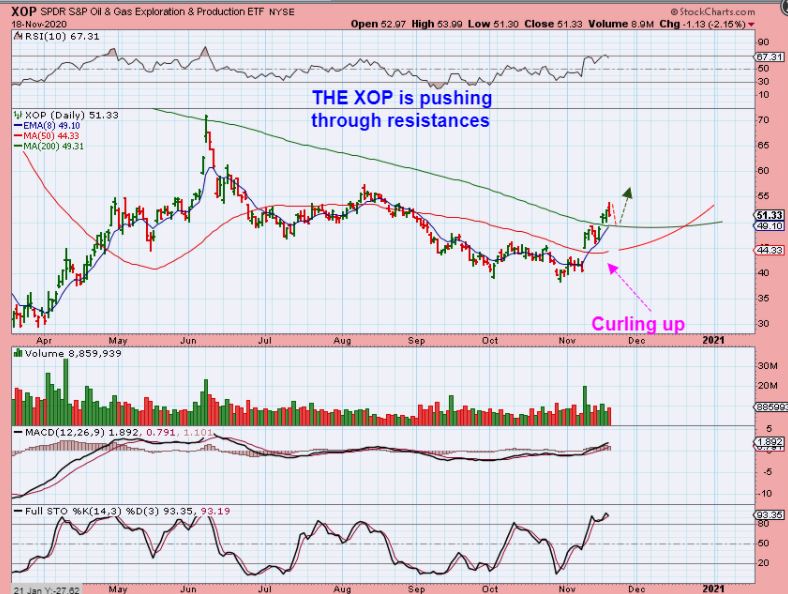
THE XOP has been breaking through overhead resistance and the Oil & Energy Stocks have been pointed out as doing very well.
,
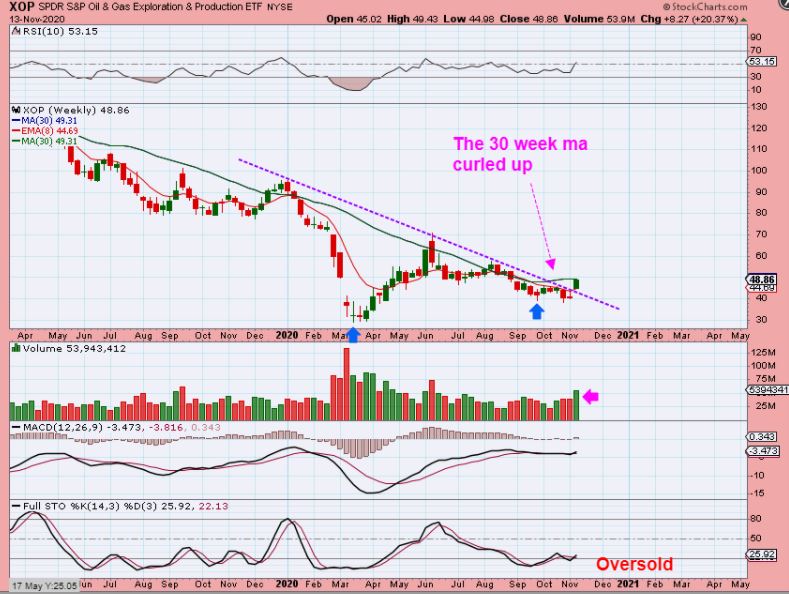
FROM THE WEEKEND REPORT: THE XOP gapped over that down trend line that I have been drawing, and it still remains quite oversold on a weekly basis. The 30 week MA is curling up. As noted, Oil stocks are setting up at the lows and I have mentioned examples like MRO, AROC, VLO, ERF, APA, LPI, CPE, , etc.
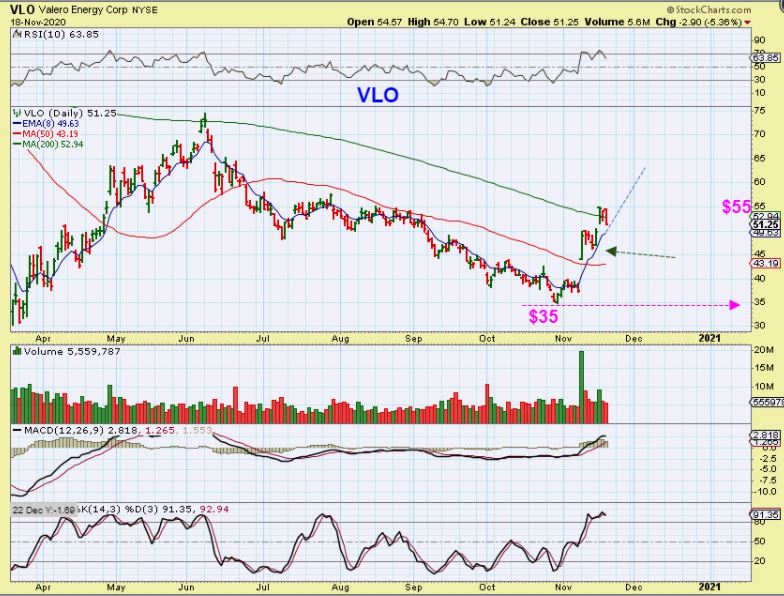
VLO has now moved from $35 to $55 in less than 3 weeks. It has been POP and chop on the way higher but it is getting the job done.
,
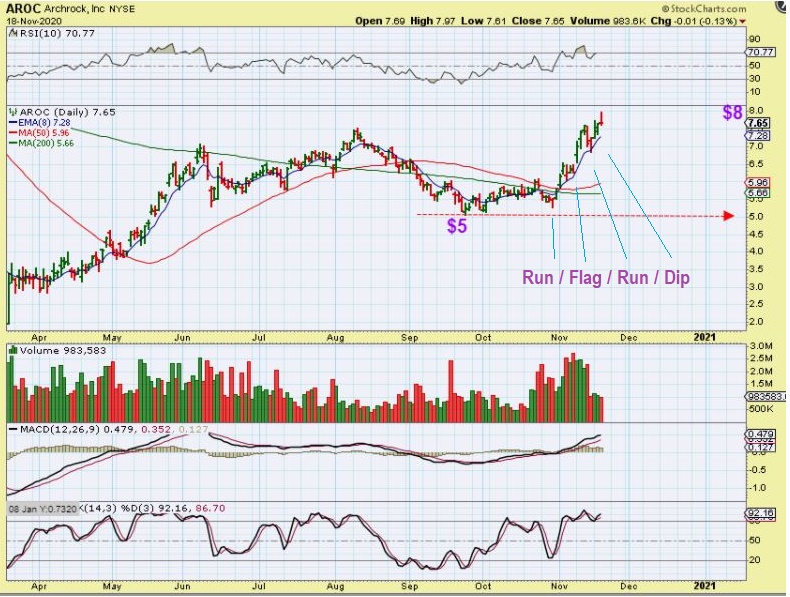
Take a look at AROC : This ran, flagged , Ran again, etc. The 8 ema has held price along the way. Many stocks did this kind of a run up the 8 ema or 10sma.
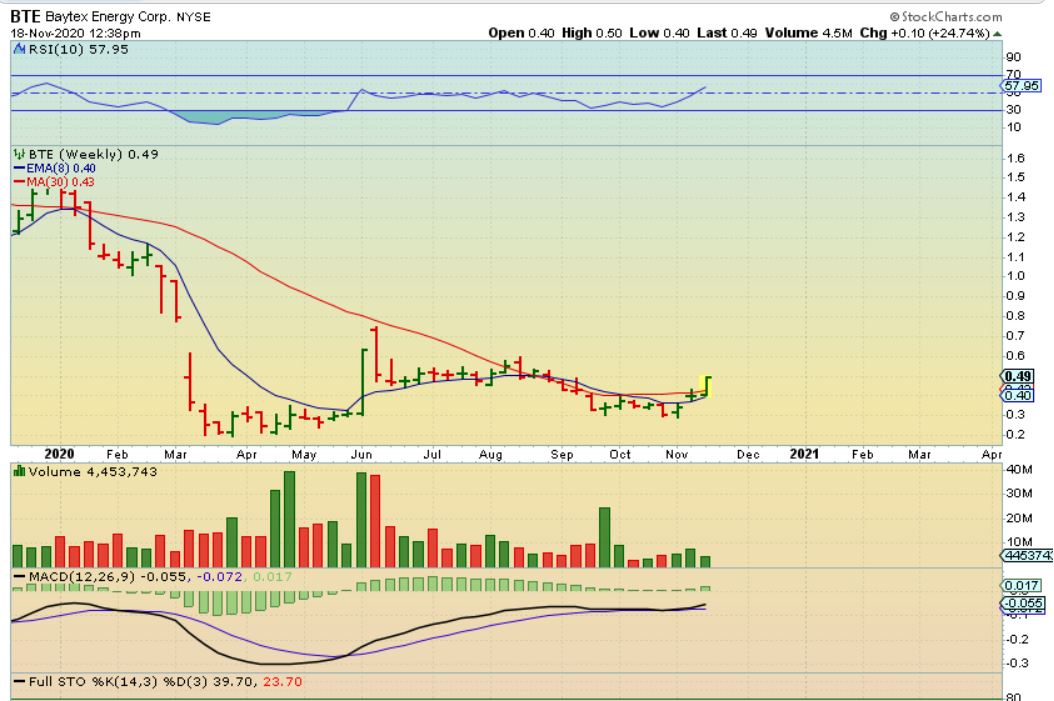
BTE WEEKLY – Then when I look at the weekly charts I can see that many of these have formed a higher low base and are breaking higher.
.
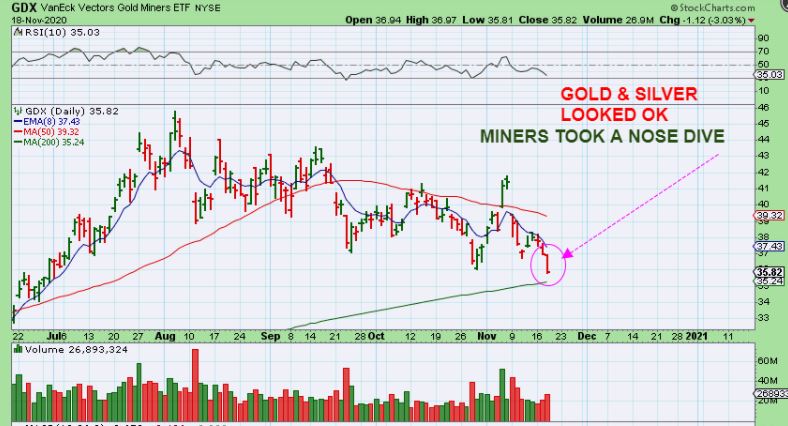
Precious Metals: I always start with Gold & Silver, but today we’ll start with Miners: This didn’t look healthy.
.
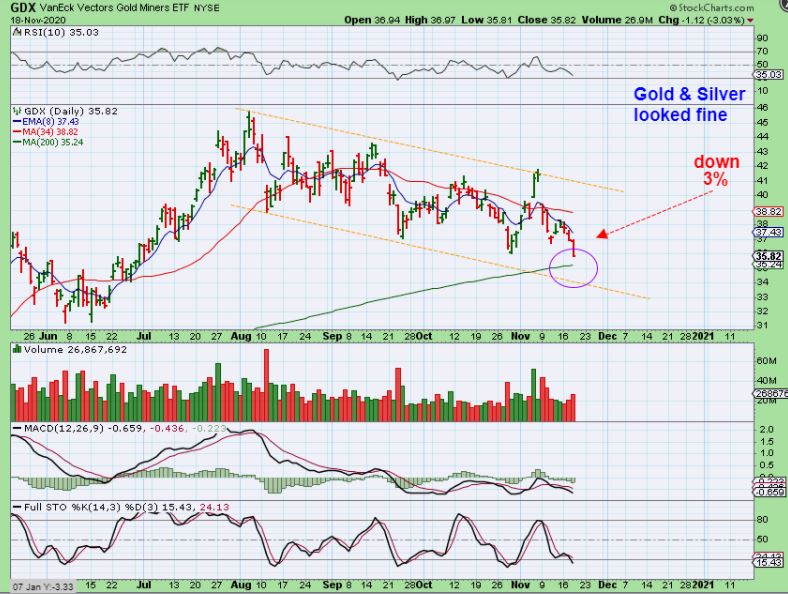
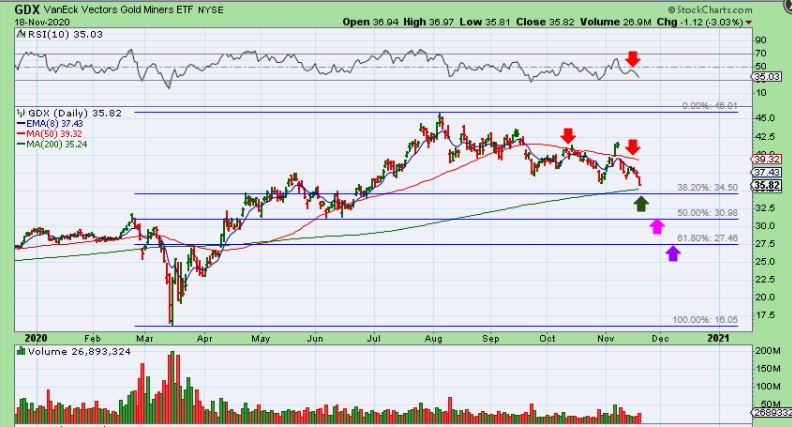
GDX – I wanted to start with GDX because it took a small 3% dive here and broke to new lows. Now when we look at Gold & Silver you’ll see that they didn’t really sell off, & Cause this drop so Miners MIGHT be leading the way- predicting a sell off in Gold & Silver.
.
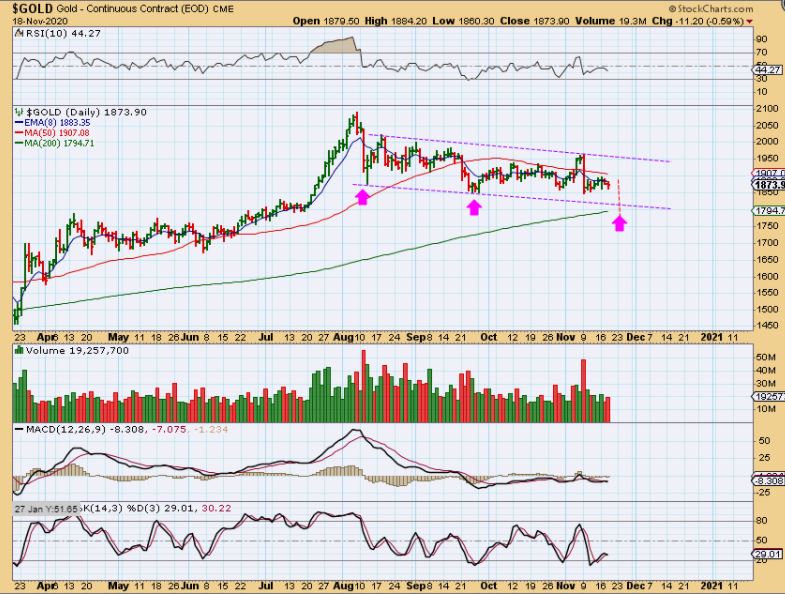
GOLD was down a little ( .60%), but THIS small dip didn’t cause that sell off in Miners. It leads me to believe that Gold is about to follow, so I drew this line to the 200sma as a possibility. I have mentioned that this 3rd drop here wouldn’t surprise me.
.
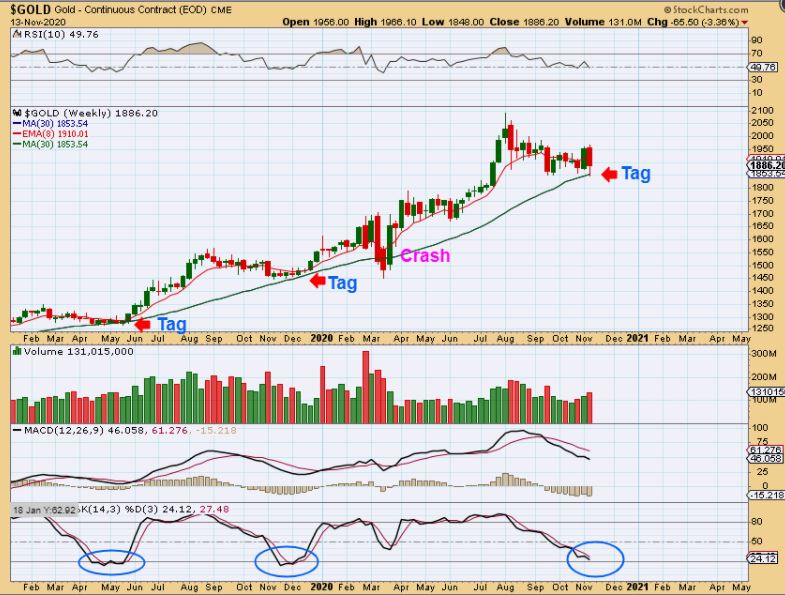
FROM THE WEEKEND REPORT : GOLD – We finally tagged the 30 week ma this week! That is good news. This is actually something that I have been pointing out as a plausible target for months, so even with the frustrating choppy sideways move, we are now seeing expectations play out bullishly. We MUST be close to the real break out. We also reached oversold, another thing that I have pointed out over time. (EDIT: It looks like we may tag it again or slightly break below it if Gold sells off).
.
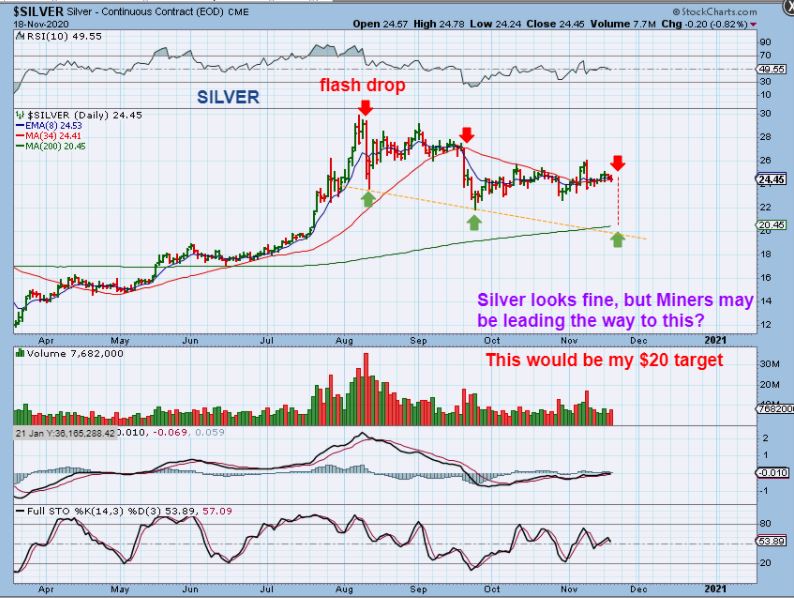
SILVER – Remember that call for Silver $20 back in the summer? At one point I thought that Silver might avoid going there, but with the Miners dropping it is looking more and more like $20 Silver can happen. Notice that Silver often has quick Flash Crashes, as seen by the Red Arrows here. Is this surprising?
.
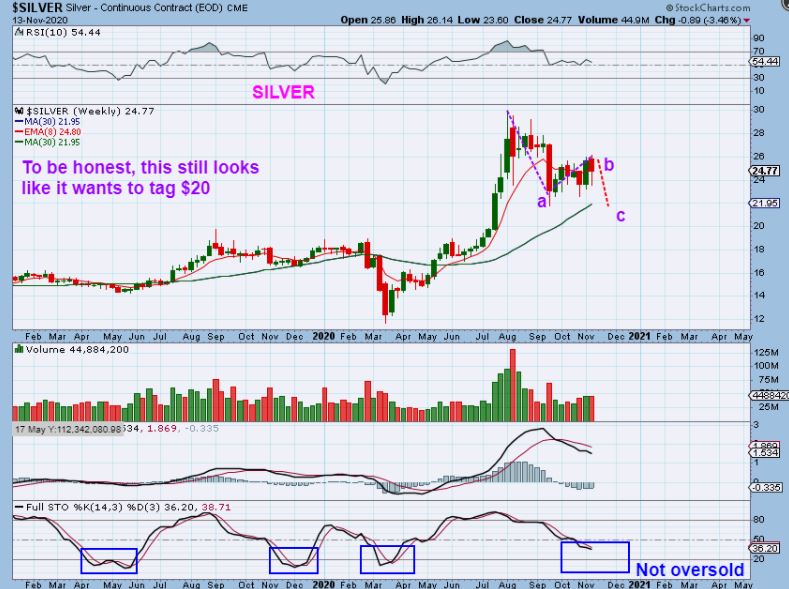
NO, THIS WEEKEND I MENTIONED THIS: SILVER dropping down would still form a normal a-b-c drop and it would tag the 30 week ma too. Silver also never got oversold. Basically Silver & Silver stocks have been looking stronger and I own a few Silver stocks, but this chart is not oversold.
.
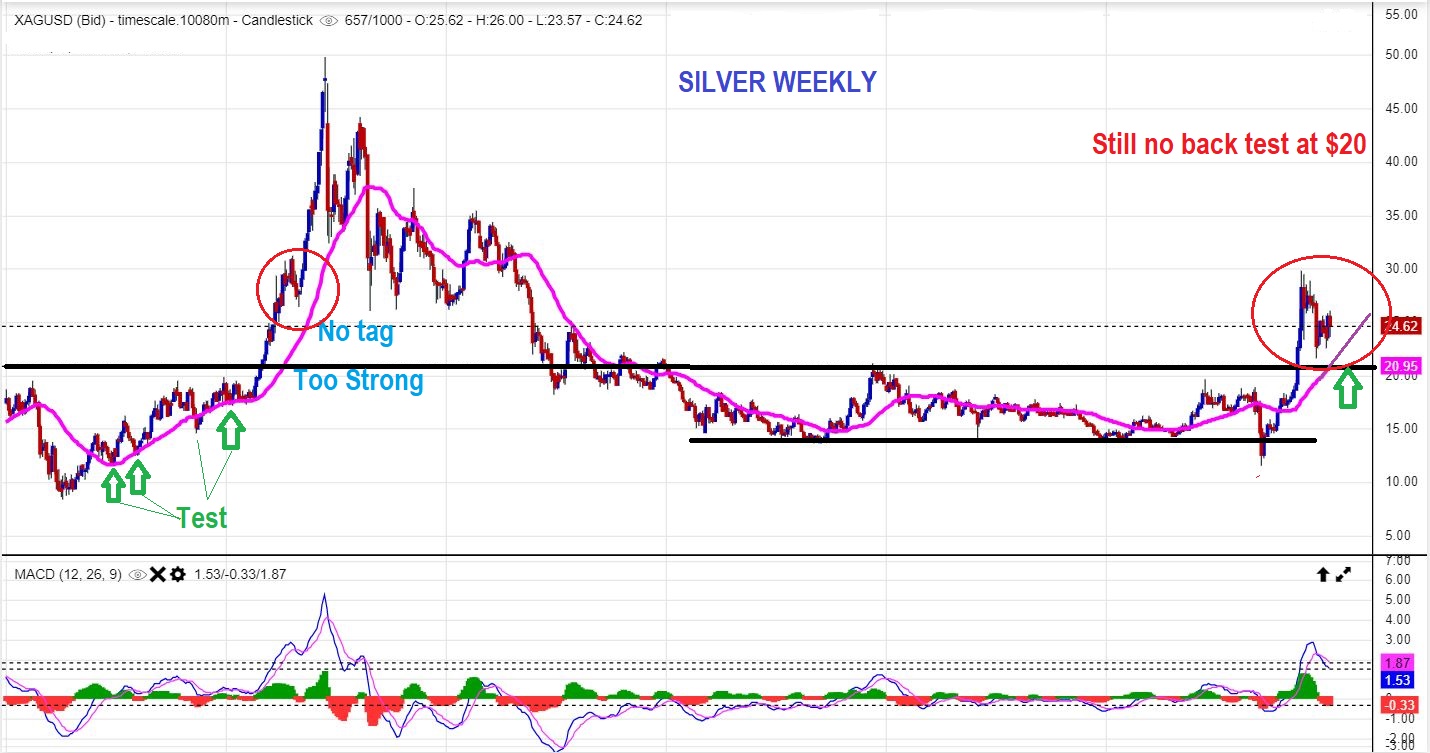
ALSO FROM THE WEEKEND REPORT I WROTE: SILVER WEEKLY – … Can I be honest? Doesn’t this Still looks like it could drop to $20? Gold looks fine, but to my eyes this looks like it could drop. Look at the Magenta line on the left side of the chart. Price dropped there often and now? I’m not going to tell the markets what to do, but…
.
Back to the GDX Chart: Do GDX dropped and I have been drawing this channel from time to time. It leads below the 200sma, so we may see a shake out here if this drop continues.
.
GDX has the 200sma as the 38.2%, but there are lower ones that are valid too. The 50% is roughly $31 for example.
.
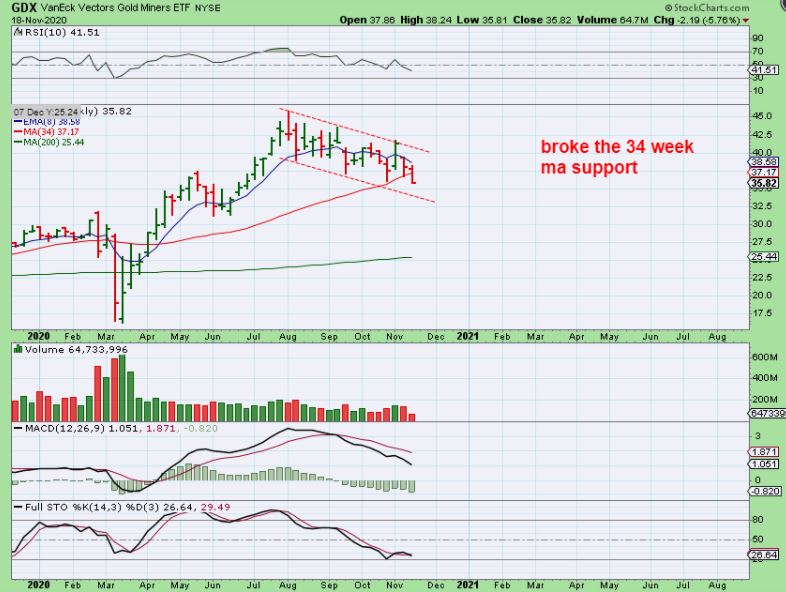
GDX WEEKLY – If the channel from prior dcls holds, the dip will be over soon.
.
.
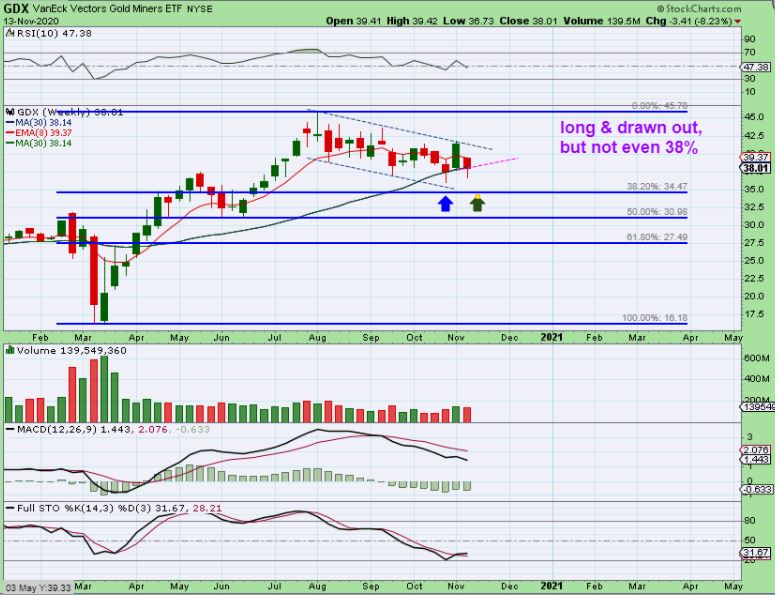
THIS WAS ALSO IN THE WEEKEND REPORT, I WROTE: Even though we have been in a long drawn out consolidation, GDX still has not even dipped down to a normal 38.2% fib level. That drop would be normal. So if Gold & Silver do drop, there is a chance that GDX will slightly cut to new lows 1 more time…
.
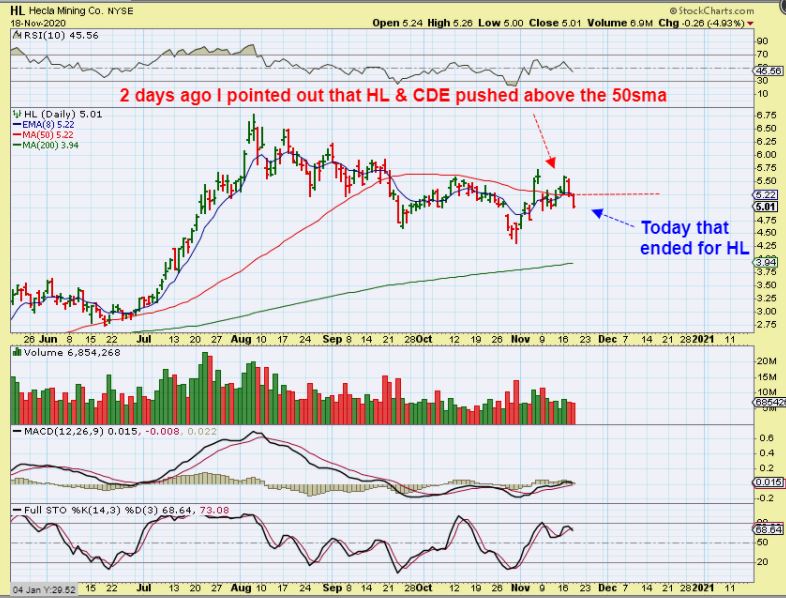
HL – On Monday I pointed out that CDE & HL were moving off of the 50sma and that was encouraging, though other Silver stocks remained below theirs. Now HL lost the 50sma and that might have stopped some out. I could see how this could drop to the 200sma IF Silver drops to $20. That is a big drop.
.
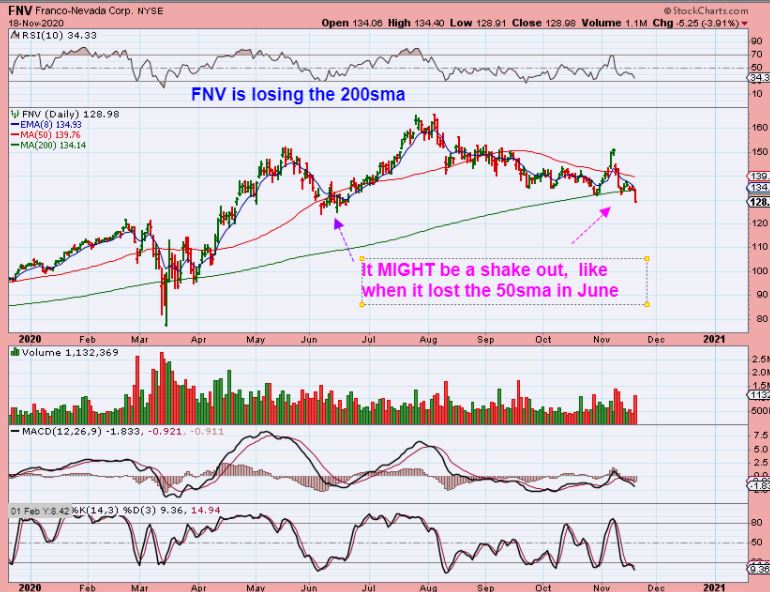
FNV lost the 200sma and that is concerning, but it also could be a shake out. Only time will tell, and to be safe I would be stopped out if I owned FNV, but you can look at June 2020 to see what a shake out might look like.
.
FNV SAME CHART: What I don’t like is that FNV did the fake break out on light volume and the sell offs since then have been on heavier volume. People have been bailing out after the Bull Trap. Hopefully this break down is a false break down / Bear trap.
.
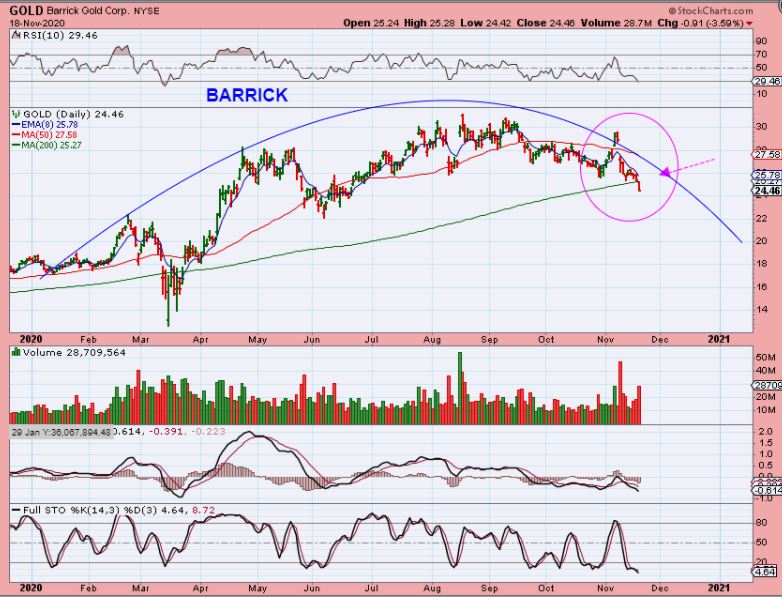
BARRICK GOLD did a Bull Trap false break higher over the 50sma and then lost it immediately too. Now it has also lost the 200sma and selling was heavy here too.
.
The General Markets started to sell off at the end of the day Wednesday and many green stocks were also dragged down into the red. I’ll be watching the 8 ema on the SPX to see if this is a normal dip or maybe we are possibly due for a deeper dcl.
.
Oil continued higher along with Oil stocks.
.
IMPORTANT: The Miners were actually down most of the day while GOLD and SILVER held up relatively well. To me, that is raising a red flag that a sell down may be approaching in the Metals too. I warned in a separate report 1 week ago (See last Wednesday) that…
1. The POP on Fed Thursday was a false break out / Bull trap that then crashed down Monday.
2. Now the sector had gone from ‘a bullish breakout’ to ‘a false breakout’.
3. I said that This price action now put the sector back to “Sloppy Choppy Sideways ” action and I said that this landed us right back to where we were before that false break out (when we were waiting for either that ICL or a The Real Break Out).
4. I mentioned that I cut my positions down and that cutting positions and eliminating leverage was a way to control risk or prevent losses. Choppy trading waiting for an ICL is risky and frustrating.
The analysis in that Wednesday report was apparently the right call. I cut my leverage and even some Miners and started trading EV / Energy, Oil stocks and other more bullishly established areas. Now we still have to endure ‘Time’ and see how this is going to play out exactly, but at this point it looks like the Miners are possibly leading the way lower. As seen in charts above, some even broke through their 200sma already. Will the sell off be sharp & quick? Deep or Mild? We’ll have to see how this plays out in the next few days.
.
Let’s see what Thursday brings our way, Happy Trading and Stay Frosty!
.
~ALEX
.
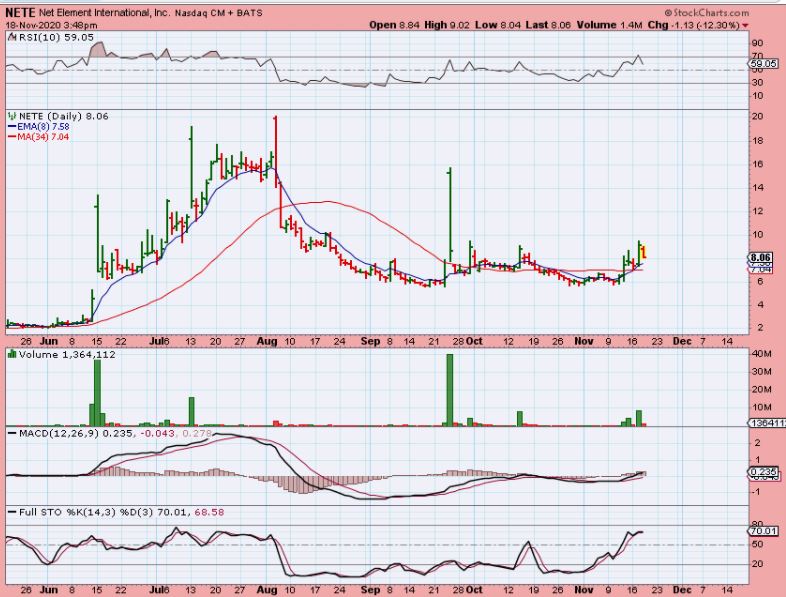
I just wanted to mention that some stocks like NETE ( EV) were down quite a bit, but because they have also run up quite a bit, the drop is not damaging the chart. Anyone can sell whenever the selling gets uncomfortable, but is this broken? As you can see from this chart, we were simply dropping back to possible back test support. This may reverse off of the 50sma, so it is not broken. I may even add if I see a reversal at support.
,
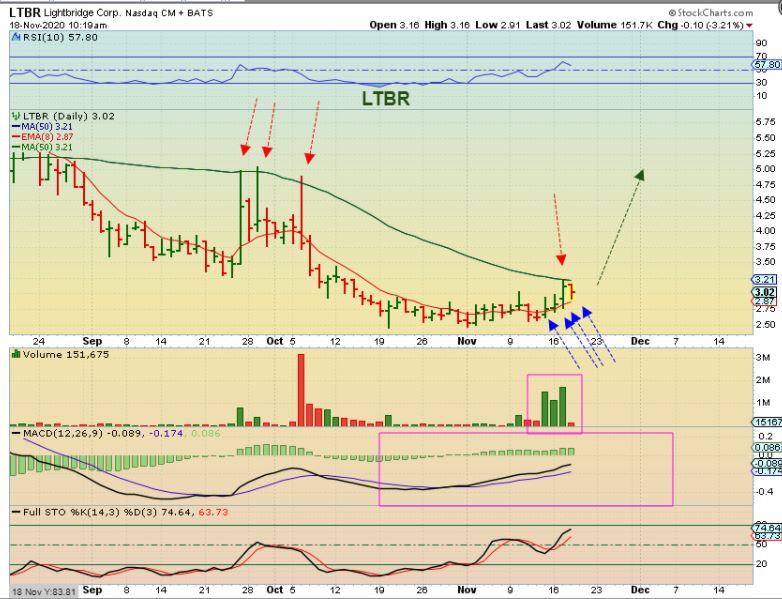
LTBR – I bought LTBR under the 50sma hoping for a break out in this hot sector. It was rejected and also dropped lower on Wednesday. Is it broken? Not yet. This is a round base and chops around the 8 ema or 10 sma. This pinch can still break out, but that is where this trade stands. It is a SQUEEZE PLAY. Pinched between the lows and the 50sma, we’ll see where this goes from here.