Wednesday October 7th – Falling Rocks
When I was climbing a mountain trail one time, there was a sign posted to warn hikers: “Beware Of Falling Rocks!“. Well yesterday we realized that even when the stock market is enjoying a nice midday hike, the release of a Negative Presidential Tweet can offer the same random danger as a large falling rock does. President Trump tweeted that negotiations for Covid relief are on hold until after the elections and the markets did NOT like that. At that time, I stated in the live area that ‘This might just be a knee jerk reaction’. is it? I think so , but we’ll just have to wait and see over time. For this report, Let me show you what happened…
.
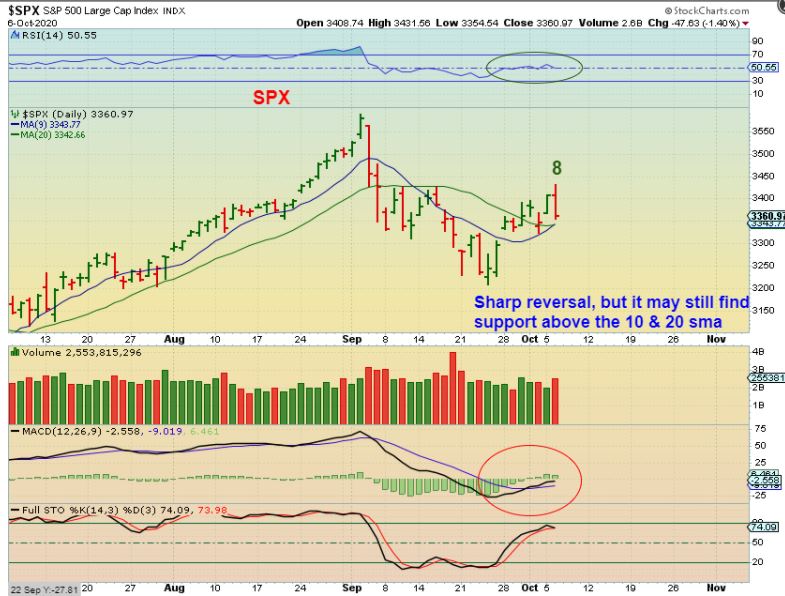
SPX -If you were to just look at this chart, you’d see that we dropped sharply on day 8, so was that the start of a sell off? Well, actually the markets were doing very well all day and they were at the highs of the day when suddenly that ‘Tweet’ was posted. Lets get a closer look at what followed…
,
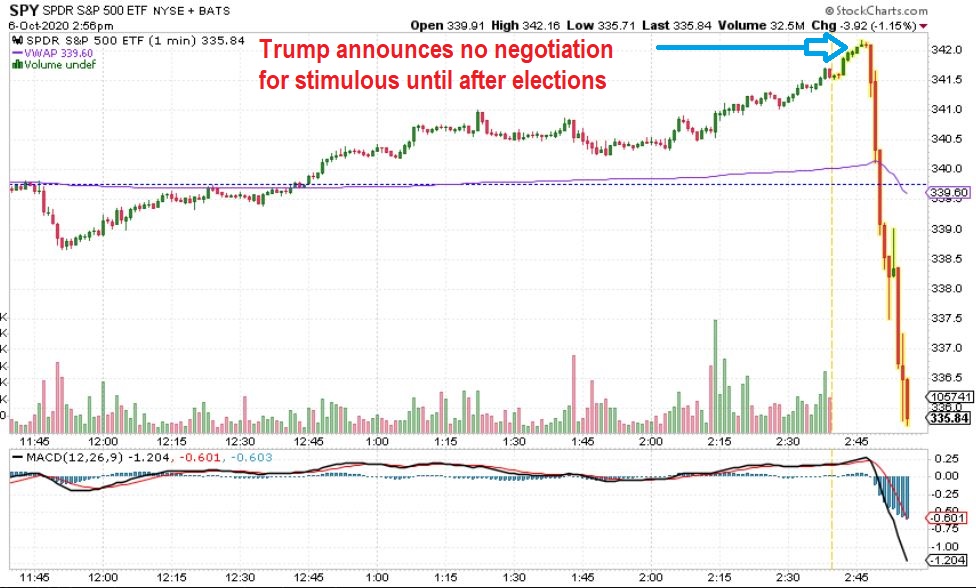
SPY – You can see that as the markets climbed all day long, Green Volume started to come in strong as price pushed even higher. That was followed by a crash…
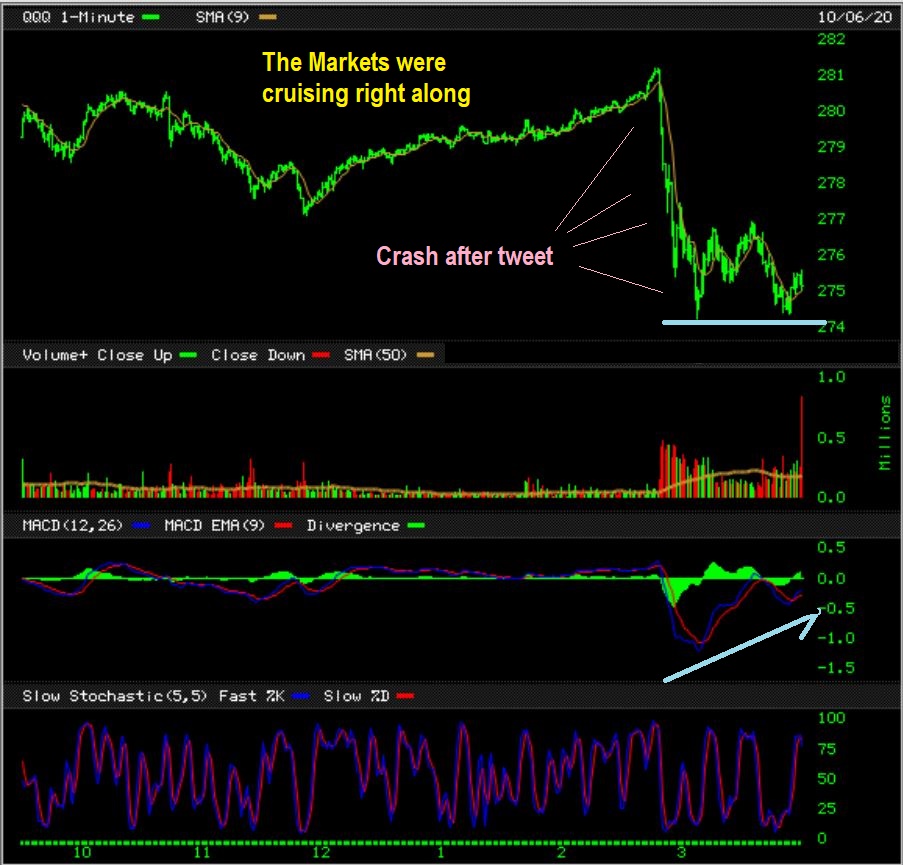
QQQ – As you can see here on the Q’s, Before the close the markets bounced and then sold off to the lows again. Since the 10 & 20 sma are still below price on the DAILY chart, this double bottom with divergence may hold and the markets can then shrug that tweet off. We’ll need to see what Wednesday brings.
,
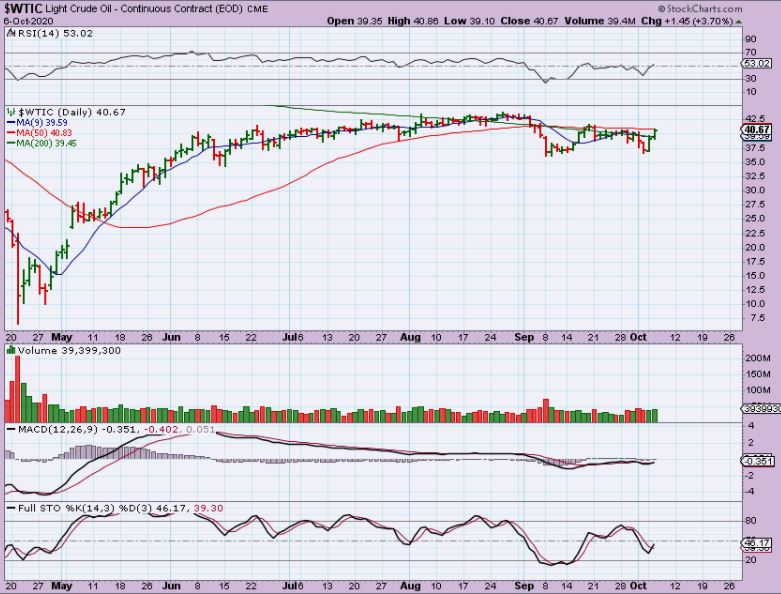
WTIC – Oil pushed higher again and is pushing on that 50sma. Wednesday is Oil inventory release. Will this bullishly be pushed above the 50sma? Well, when I see this, I always look at the oil stocks too and…
.
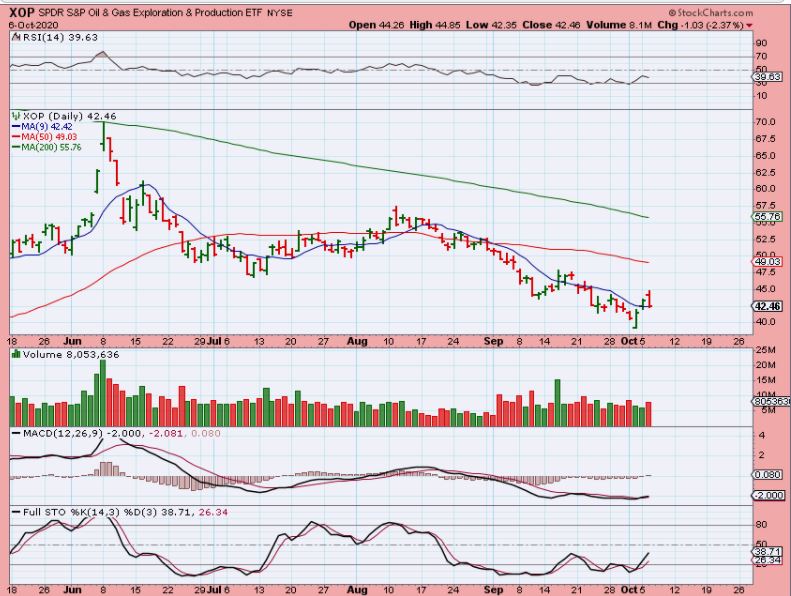
The XOP rolled over to the 10sma. The XOP actually started to sell off earlier in the trading day and then just crashed with the rest of the markets, so it showed weakness after a small gap open.
.
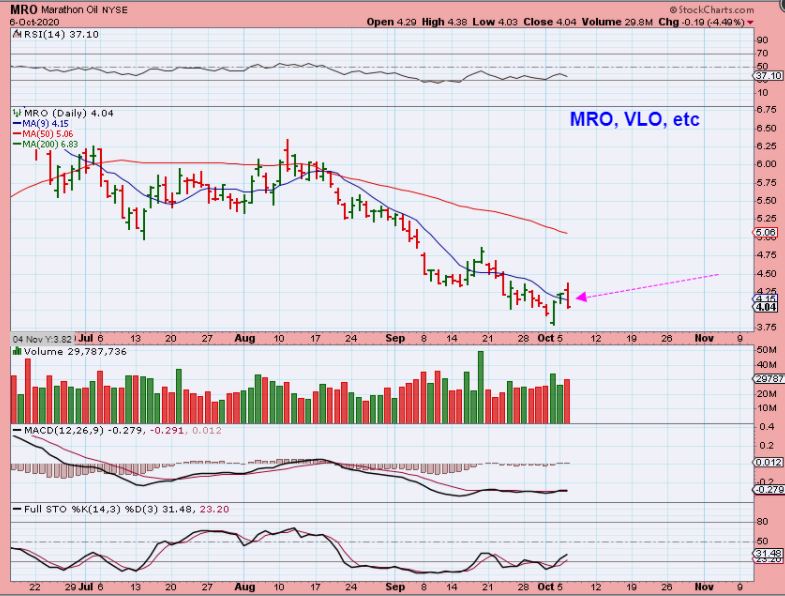
MRO and other individual stocks closed near the lows, so we’ll see what Wednesday AND THE OIL INVENTORY BRING TO THIS SECTOR.
.
USD SEPT 25th – Do you remember me saying that the USD should drop & Gold could Pop? A dcl could form near the major moving averages and then it should reverse & bounce.
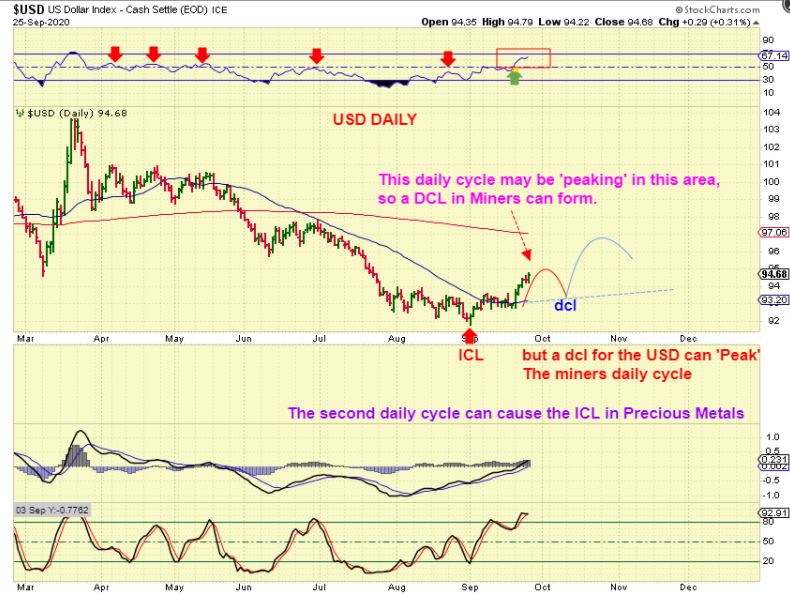
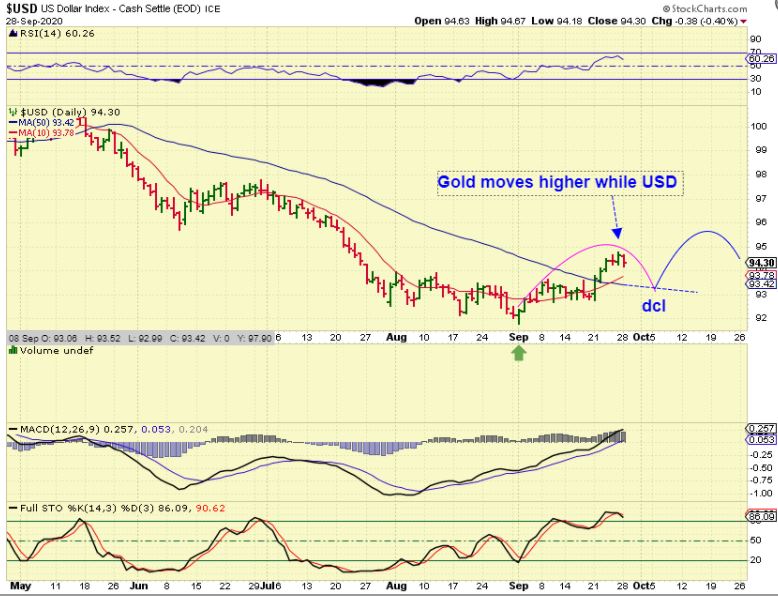
USD SEPT 28th – So again the USD can drop, and Gold can Pop. When the USD puts in a dcl and moves higher, we may see Gold drop.
.
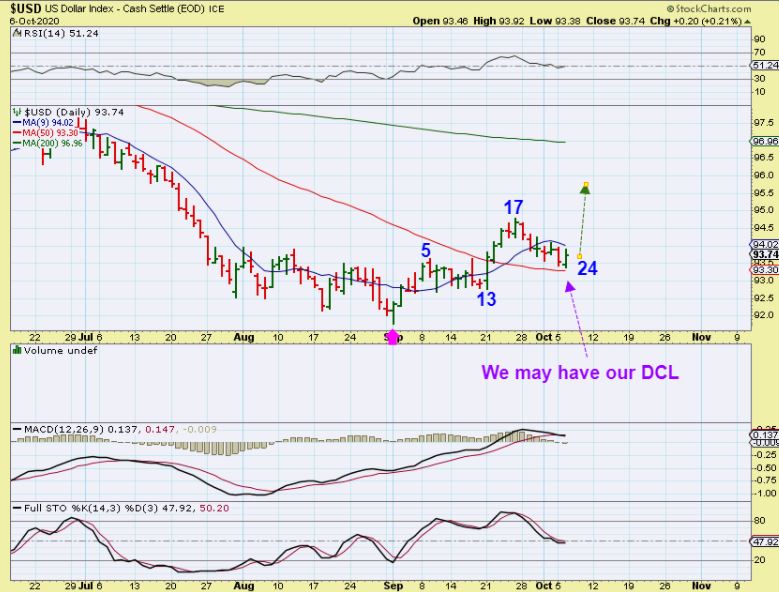
USD – Day 24th and we are there. We now see that the USD has played out as expected, but if the USD reverses higher – will Gold drop lower? Lets take a look at gold, because I expect the USD to push higher.
.
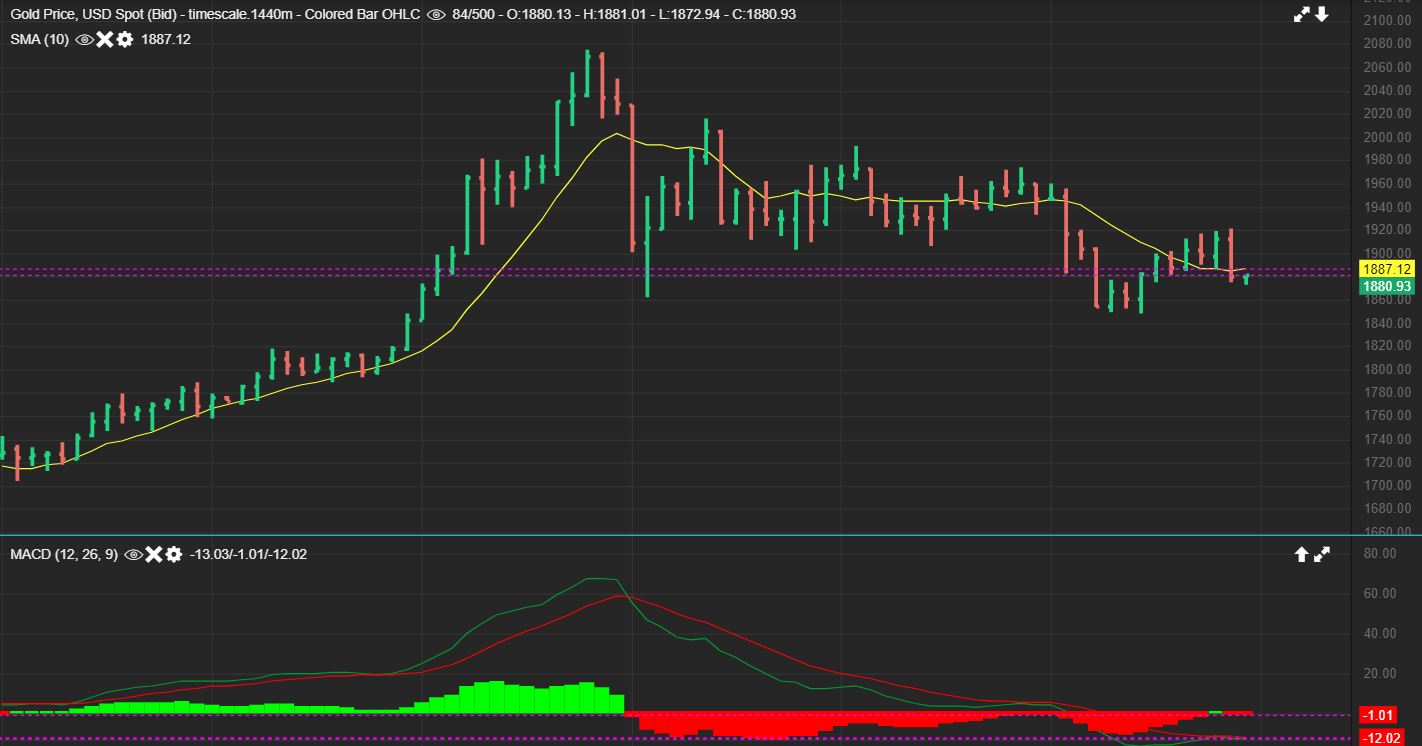
GOLD dropped and closed under the 10 sma, so Wednesday we can watch the USD & GOLD for more clues, but so far it does seem that the ICL for Precious Metals still lies ahead. Let’s see if GOLD & SILVER can recover the 10sma.
.
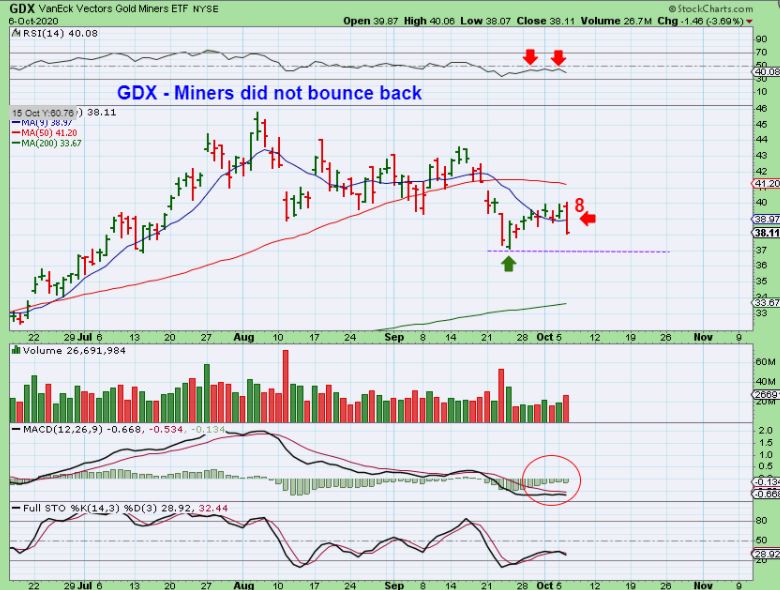
GDX & GDXJ both sold off rather sharply below the 10sma. The RSI is still under the 50% line and the MACD never crossed on this bounce. Is this going to be a day 8 peak, L.T. Daily? It is very possible, lets see if it breaks the recent lows or recovers the 10sma (purple line)..
.
After that random tweet caused a landslide, there is a lot to keep an eye on today.
– Will the General Markets continue to sell off or will they just shake it off and realize that he didn’t say “No Stimulus”, he said it is postponed ( and he also changes his mind a lot, so why panic).
– It is the Oil inventory report and we have a lot to watch there.
– The USD looks like it may be ready to put in a dcl and…
– Gold & Silver did drop, but the Miners really sold off. Watch the 10 sma,
.
Despite the market selling down, many of the trades that we have on are not damaged at all and some even continued to burst higher in after hrs, so we’ll just have to wait and see what Wednesday brings. It may just be a buy the dip opportunity early in the General Markets daily cycle. Either way, we’ll have Stops in place ( mental or physical stops) and see how this plays out in sector after sector. Enjoy your Wednesday trading and Stay Frosty my friends!
.
~ALEX
.
BYND BY REQUEST (Again) – “Where do I sell?” If you are in ANY of our set ups that formed a cup? I have already mentioned that I just ride them with a trailing stop. See BYND, SQ, BNTX, BBY, SAIL, BBBY, etc – They are all playing out the same way. Your choices are 1. Just let it run, 2. Sell some & let some ride 3. Cash it in when you’re happy. 4. Trail a stop.
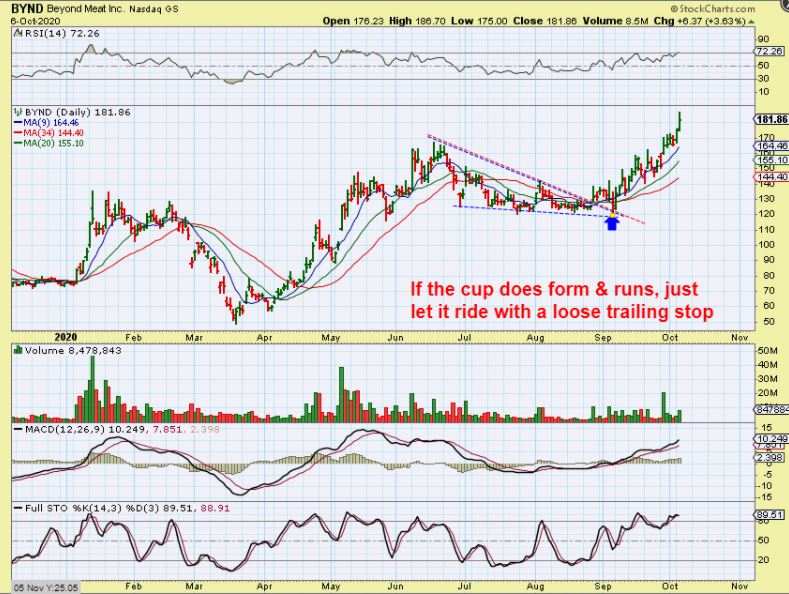
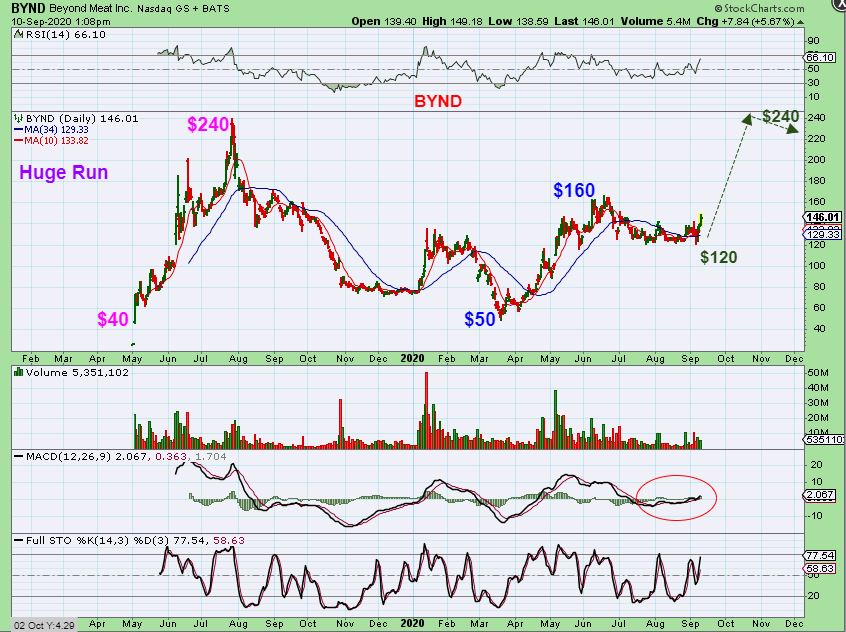
BYND – It still hasn’t reached my target.
.
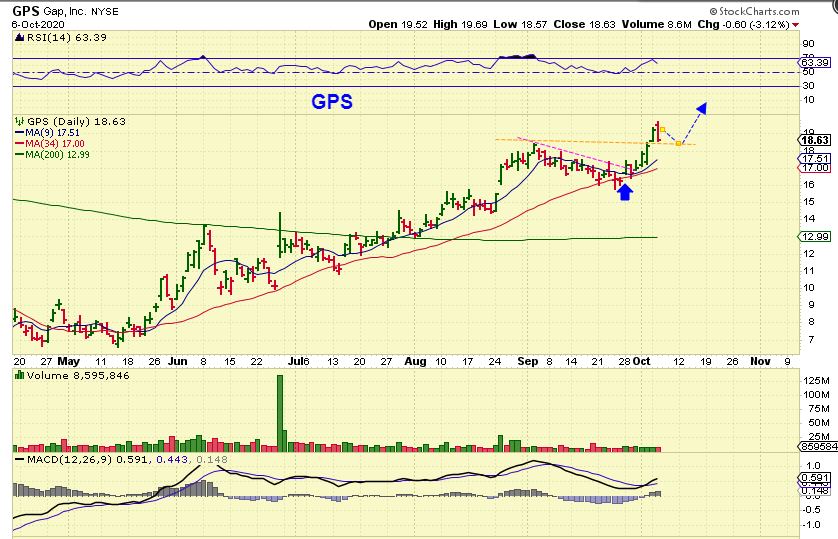
“Do I sell the GPS reversal?” – If you bought at the blue arrow area, this does not have to be sold if you are a longer term by & hold ( Unless the markets crash). GPS climbed from $7 to $17, but it wasn’t a smooth ride, it can be choppy. This is still fine, but if you are nervous, take you profits and move on.
Clean forms of energy (Wind, Water, even Generators) have been doing very well lately. We discussed OPTT, BWEN, BLDP, Solar stocks SPWR, CSIQ, JKS, RUN, ENPH, etc, etc.
.
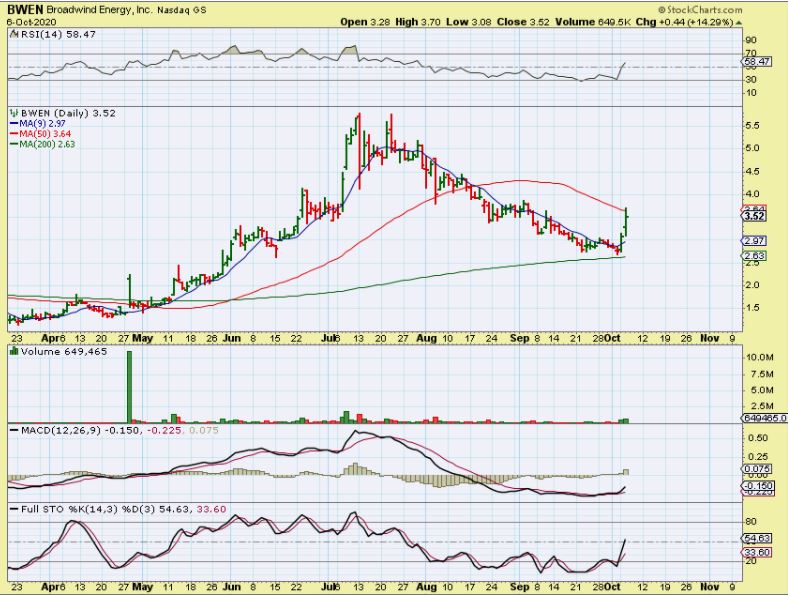
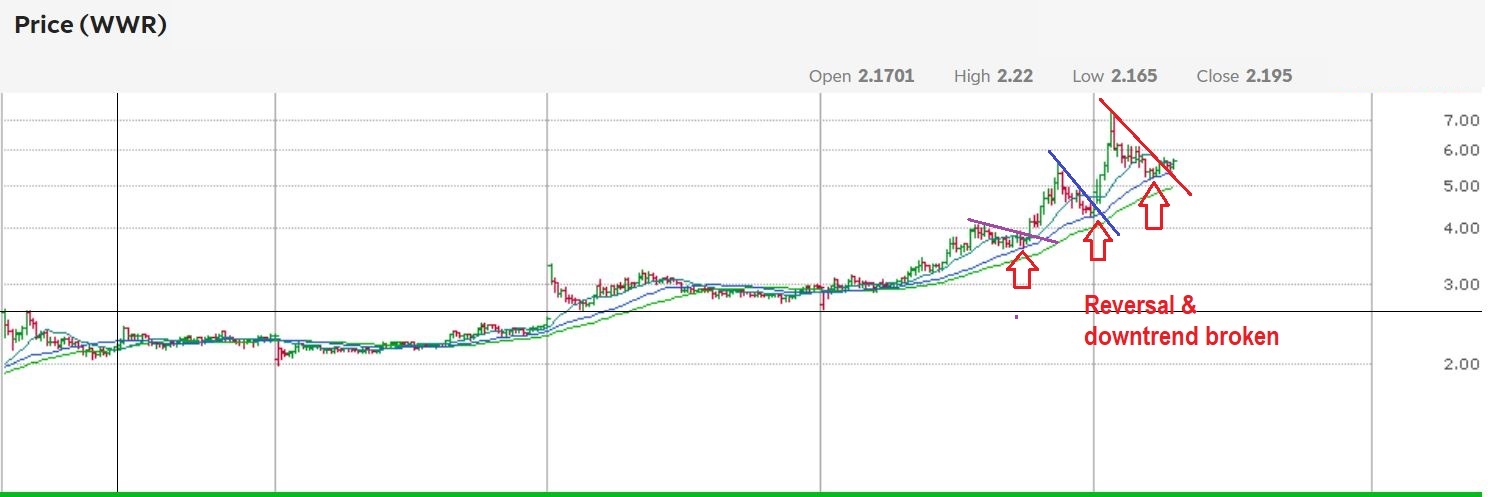
BWEN– is a clean energy stock that was recommended as it reversed & broke a down trend line.
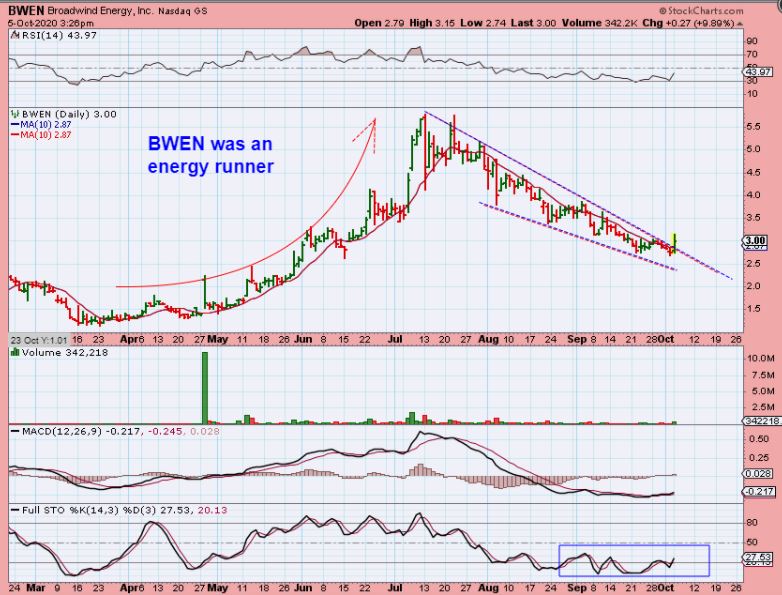
BWEN was up 17% yesterday at one point but hit the 50 sma and pulled back to up 14%. You can add on any dips, but I would keep this as a buy & hold swing trade for a while. BWEN can and probably will run back to recent highs and that will be a 100% gain from the reversal at the 200sma.
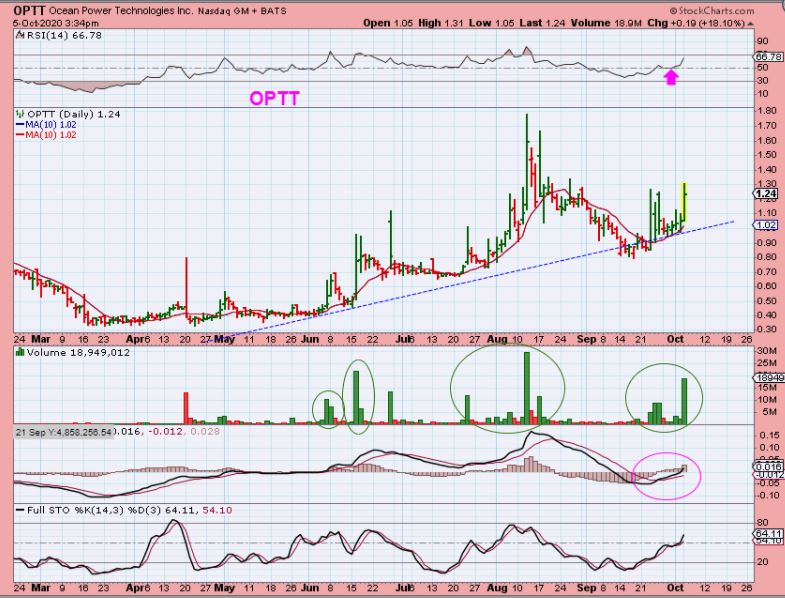
OPTT (Clean Energy) – I mentioned that I REALLY liked the weekly chart of OPTT, so I Bought it Monday and mentioned it in the live area . I do know that a few followed me then. Maybe more bought it yesterday too, because I also had the daily chart in the report.
OPTT DAILY – So it was bought between $1.10 -$1.20 as it reversed at a trend line. This chart was in yesterdays report.
.
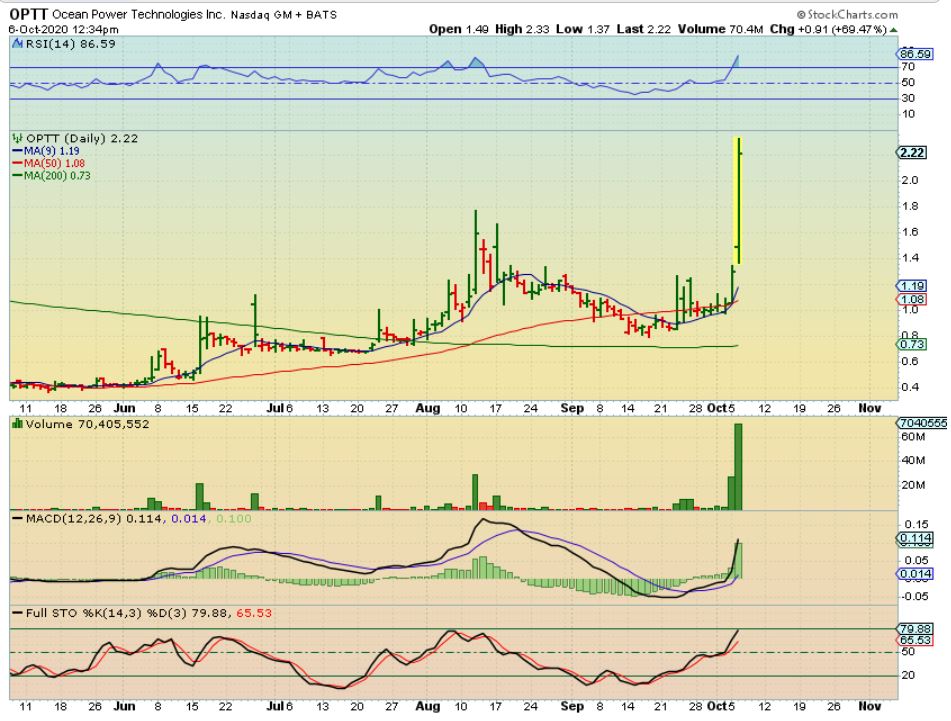
OPTT gapped open, dropped to fill the gap (so I added) and then it took off up 70%. EDIT: This was up over $4.00 in pre-market hours, but is now dropping – so it is acting very similar to what we saw with WWR. IF YOU BOUGHT IT, I would just hold on. If you are very heavily positioned, you can always sell some on the way higher.
.
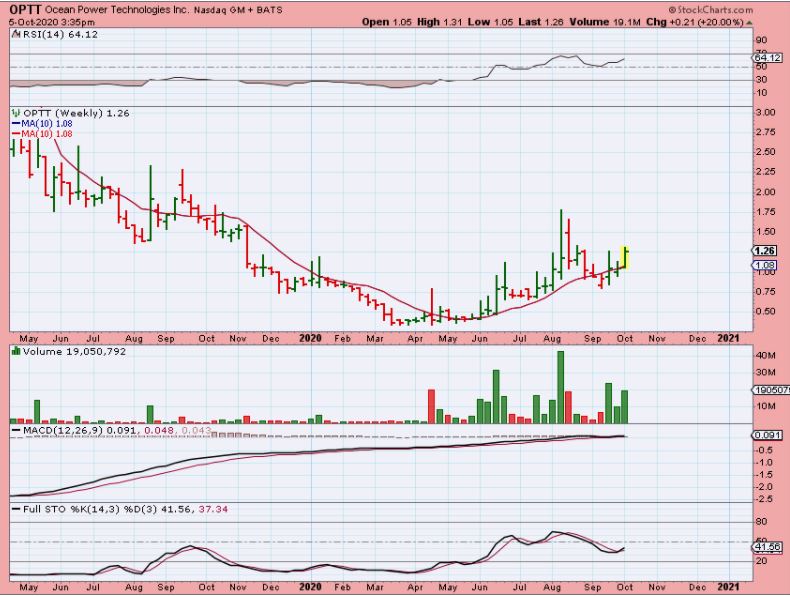
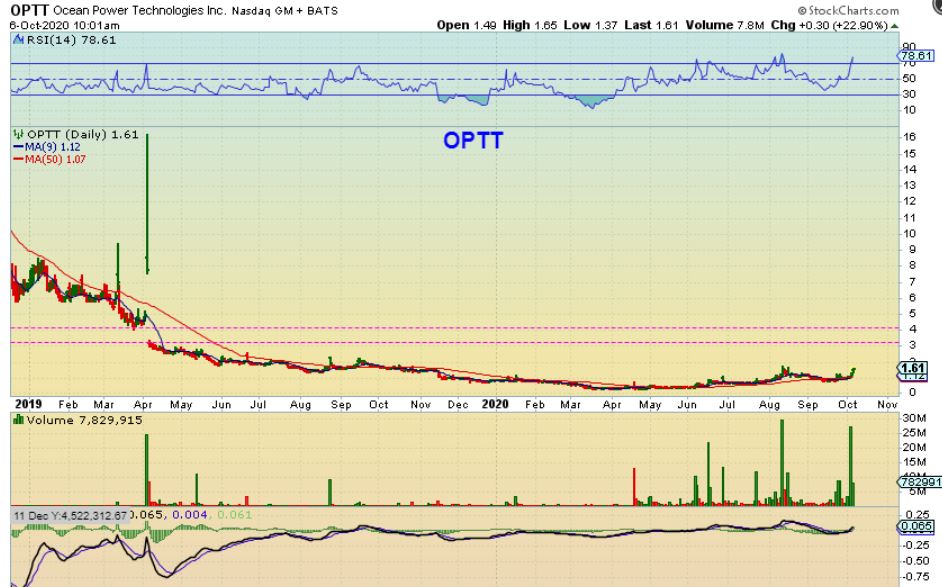
OPTT WEEKLY LONG TERM looks very much like WWR, and that one took off in a big way over the past few days.
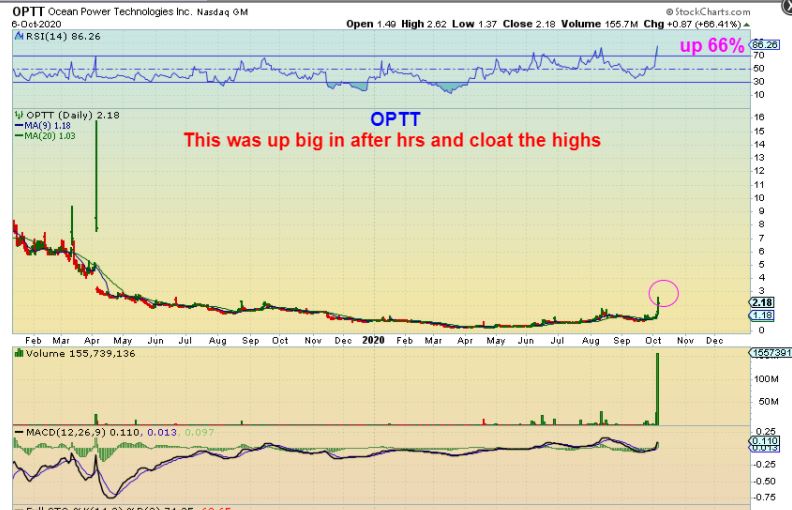
OPTT Long term, I pointed out a gap that could fill for starters, and that would be up by $3-$4.
.
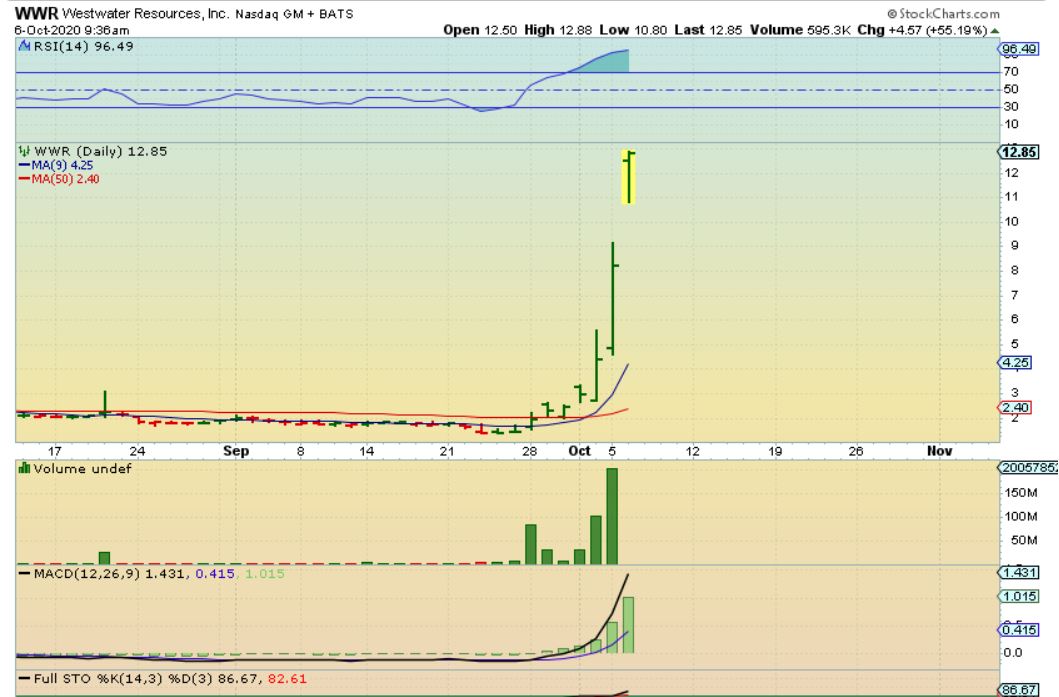
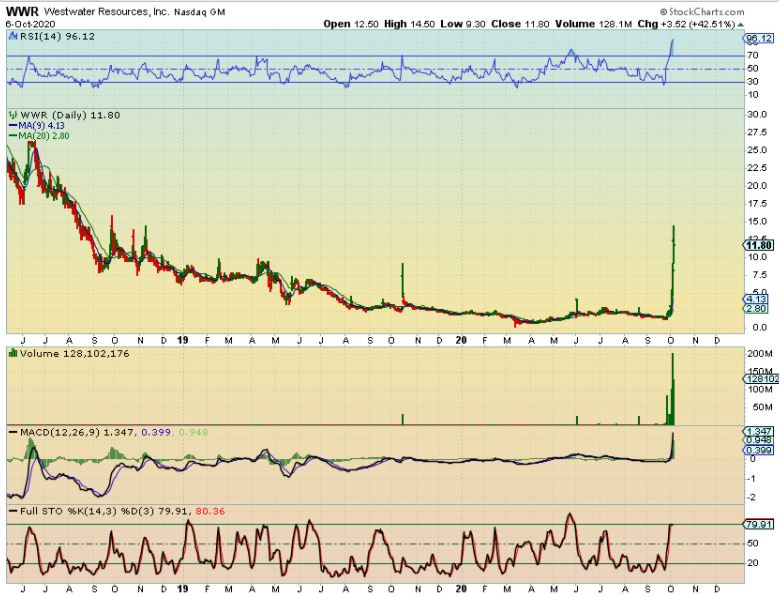
HELP FOR RIDING STOCKS THAT WE HAVE CAUGHT THAT MADE INCREDIBLE %-GAIN RUNS, LIKE HTBX, VISL, NAKD, ETC IN THE SPRING , AND LAST WEEK TO THIS WEEK WWR…
As you can see on the WWR Daily Chart, this is a parabolic & often unsustainable move that we bought near $1.35, so when do you sell? It can get VERY hard to ride, and very choppy. Well, it is good to lock in some gains on the way higher, because you never know what day will end the run, and it could end in a gap down one day that takes back a lot of your gains, but if you sell too early you’ll miss out on a 100%, 300%, 600%, even a 1000% Move! SO…
LET ME SHOW YOU WHAT I WAS POSTING IN THE LIVE TRADING AREA, TO HELP OTHERS TO SEE WHAT I DO TO ‘STAY IN THE TRADE” LAST NIGHT I SAW OPTT UP QUITE A BIT AFTER HRS, SO WE MAY HAVE ANOTHER RUNNER.
.
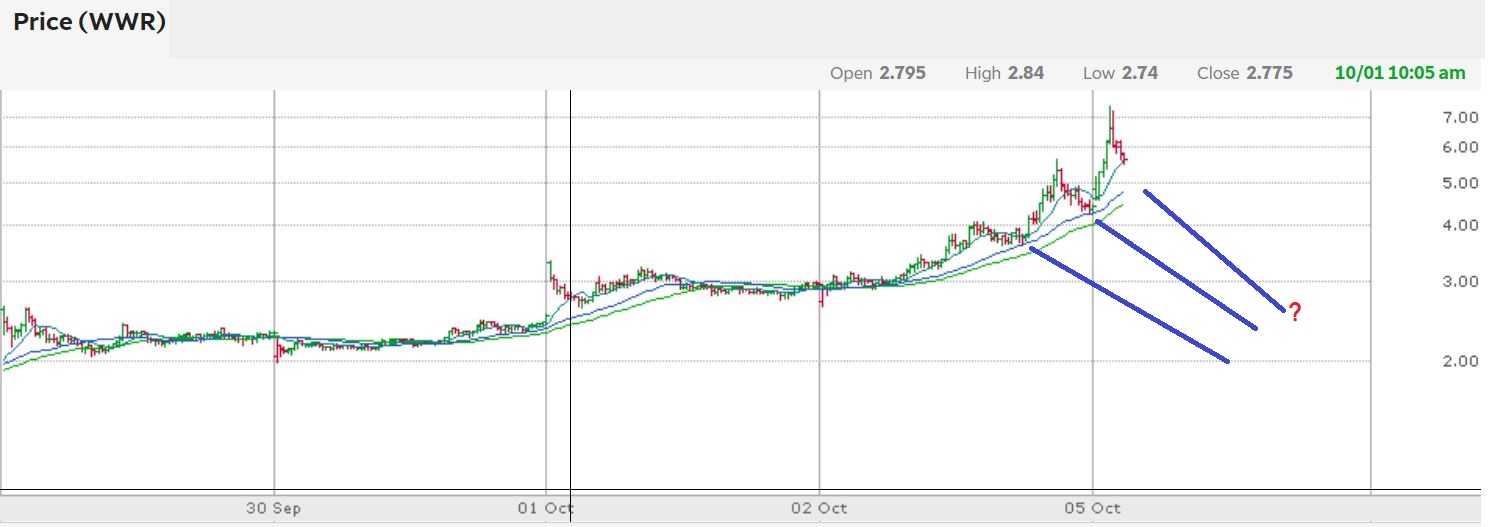
AS I TRADE A BIG RUNNER, I LOOK AT INTRADAY CHART, SO I WAS POINTING OUT TO THE READERS IN OUR LIVE TRADING AREA SEVERAL CHARTS LIKE THE ONE BELOW. IT HELPS ME TO SEE IF THIS IS AN ORDERLY MOVE OR IF IT BREAKS AN UPTREND USING THE 10, 20, 50 SMA ON DIFFERENT TIME FRAMES.
,
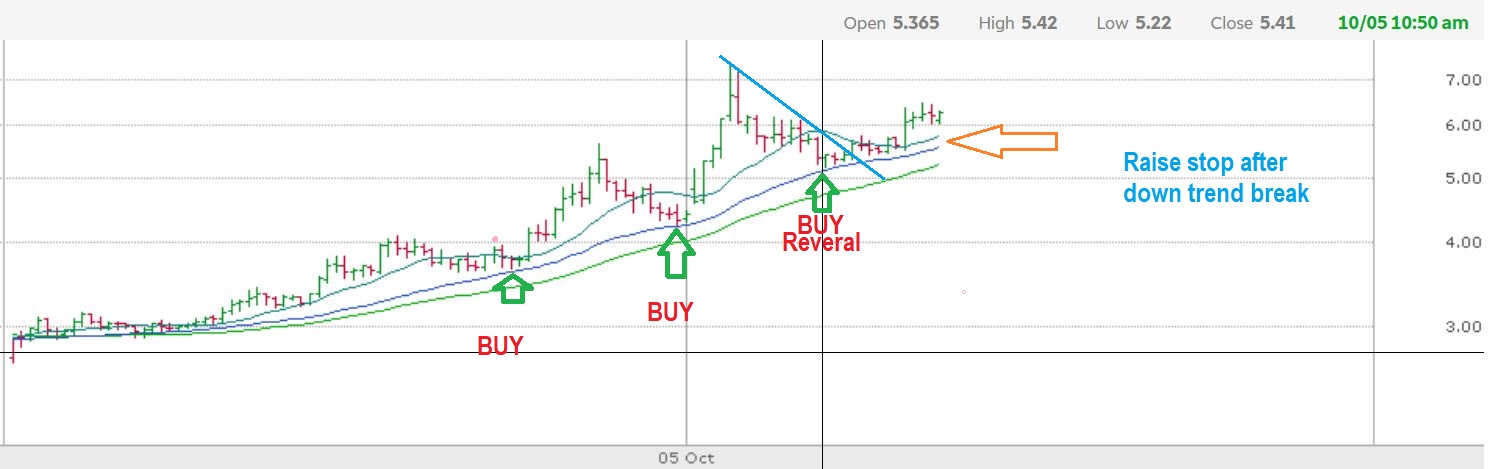
THIS IS SHOWING YOU 5 DAYS USING A 5 MINUTE CHART. PRICE RIDES SUPPORT so I was predicting a drop to the last blue line where I’d look for a reversal and maybe even add.
.
Later that morning I again posted that 5 MINUTE CHART as price reversed there. I had sold some WWR on the pop, and added it back here. Then…
.
Then we had WWR at $6 and it took off higher to $8…
.
THIS WAS WWR as it ran from $2 to $8 over the past few days, and you can still see that area that I was watching for it to find support. It went on to $14 intraday yesterday, but it never broke this wave of support.
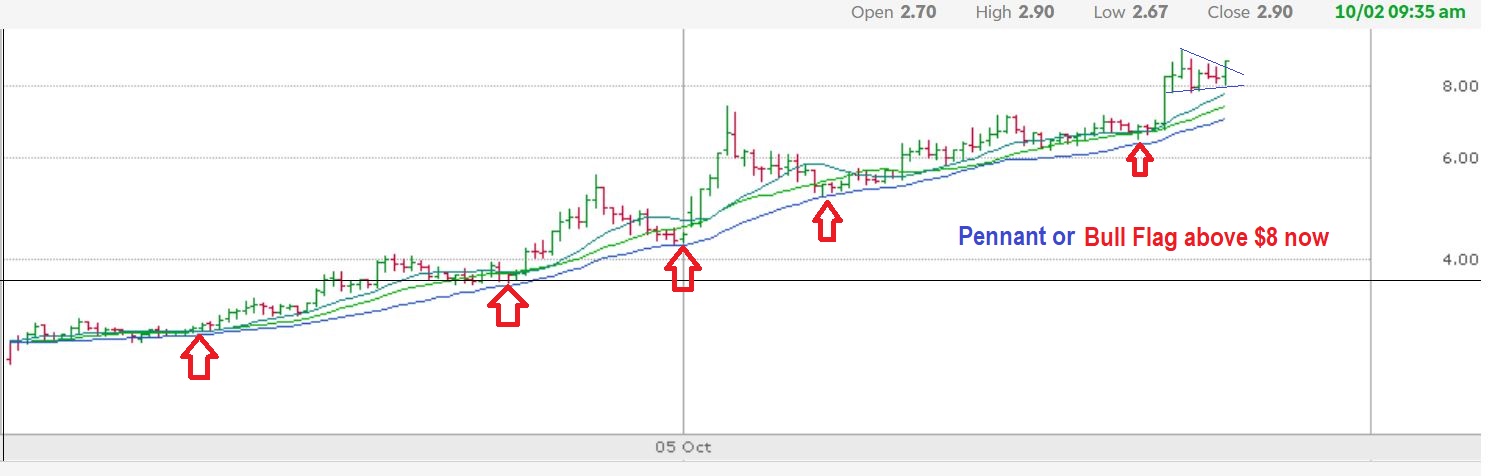
WWR LONG TERM CHART- This is amazing and often unsustainable, so I still lock in gains on the run higher, and may buy the intraday dips until the technical analyses indicates that buyers didn’t step in. When sellers start profit taking? This can drop all the way back to $2— TRUST ME.
TRUST ME. We rode HTBX in JULY, and some didnt want to sell. I was trading it on the way up…
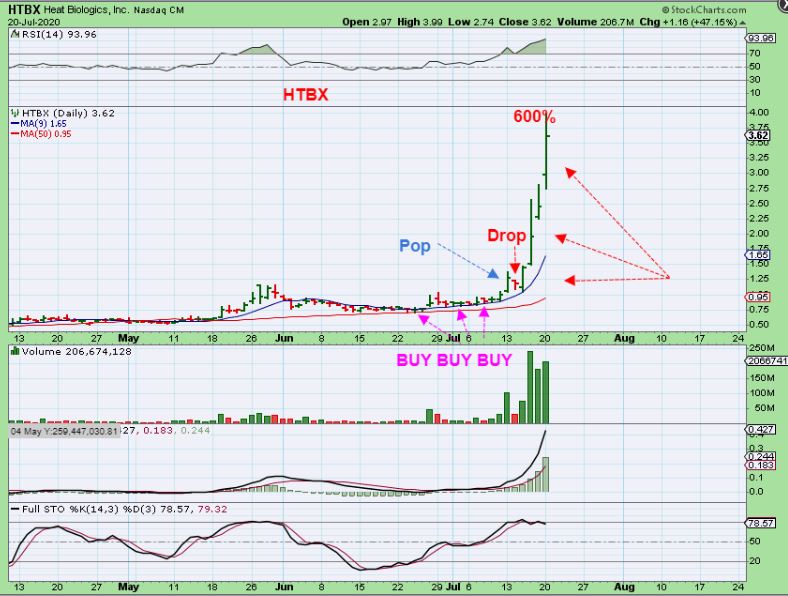
We had been accumulating it in the 70 cent base area, and …
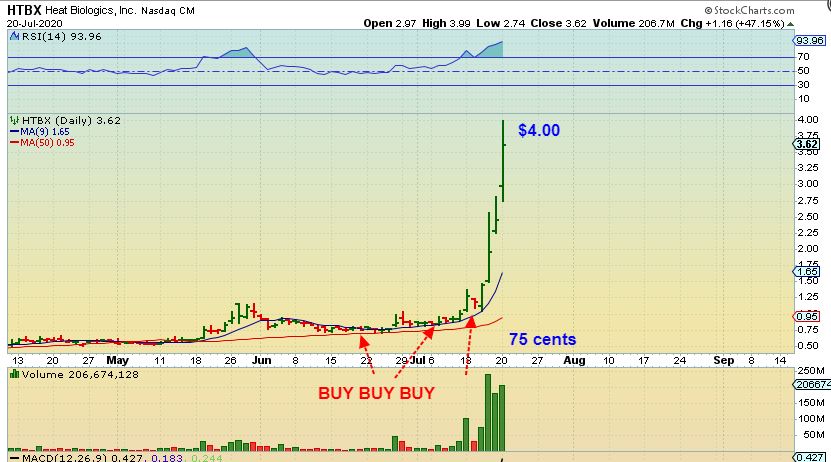
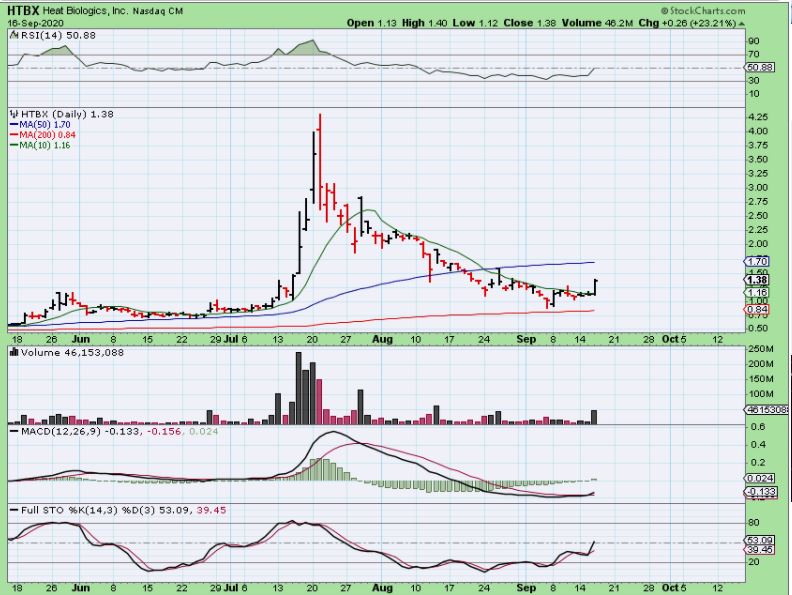
IF YOU DIDNT TAKE PROFITS, YOU GAVE IT ALL BACK BY SEPTEMBER. We traded MANY of these, and I am seeing these set ups form again, so we may have more trades like this in the future. THIS IS A GOOD LESSON IN CASE YOU FIND YOURSELF IN A PARABOLIC MULTIDAY RUN. And…
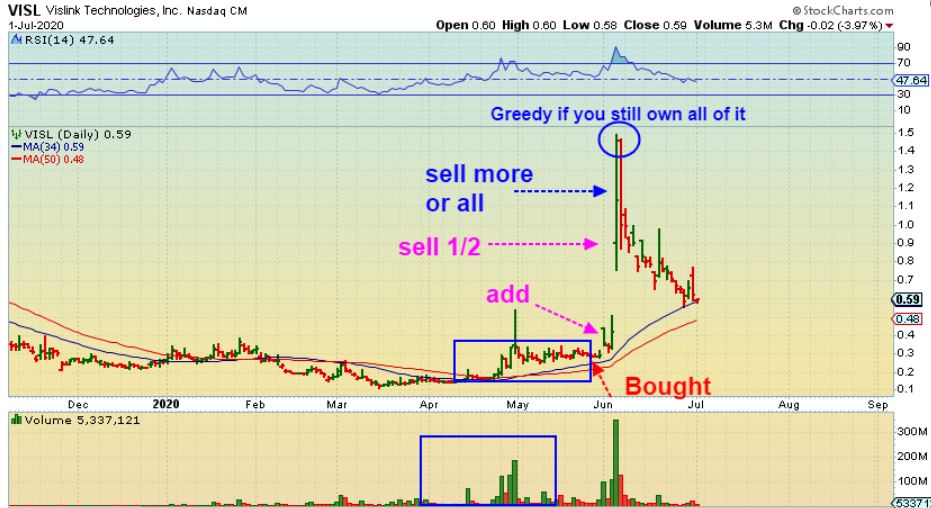
And some set ups that I Bought, like VISL at 40 cents in July in a tight base…
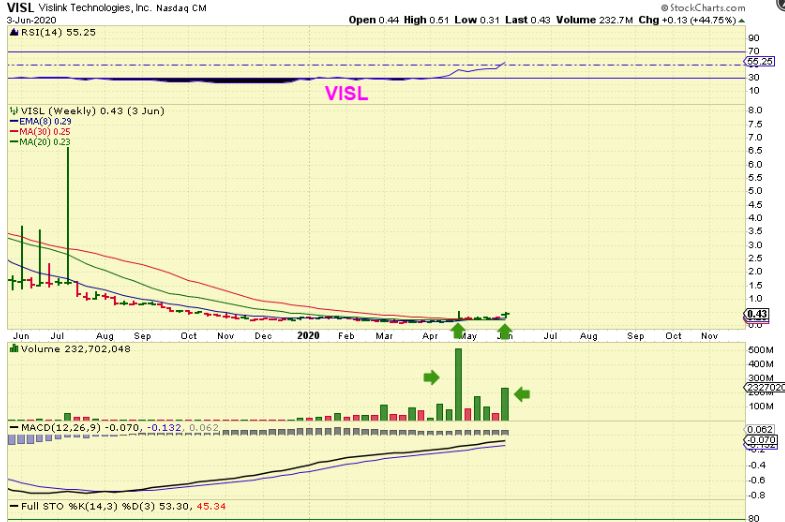
POPPED 300% 1 day…
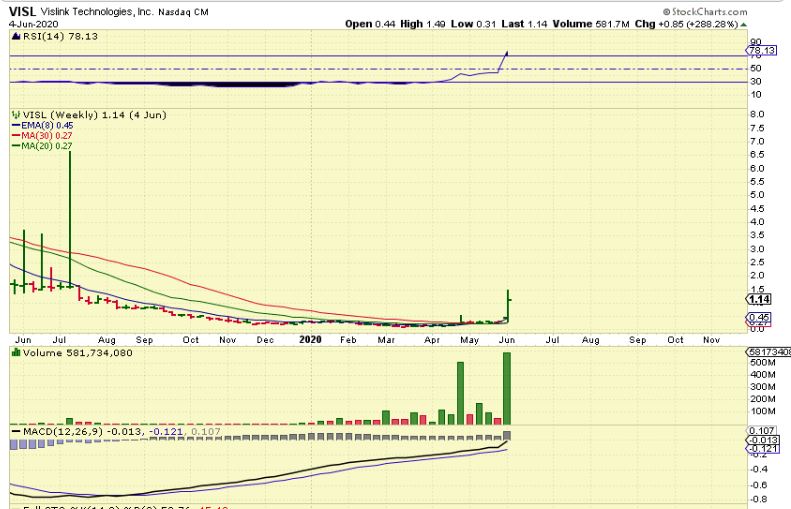
GAPPED WAY HIGHER THE NEXT TO $1.50 (Similar to WWR), but this one also did not hold those gains forever. TODAY VISL is building another $1 base, but it had done a reverse split, so it is really basing out exactly where it was when we bought it and it popped. ALL THE GAINS ARE GONE. This is just a lesson for those holding WWR and thinking that they’ll hold it for a month or 2 and see where it is then. USE STOPS – HAVE A PLAN. 🙂
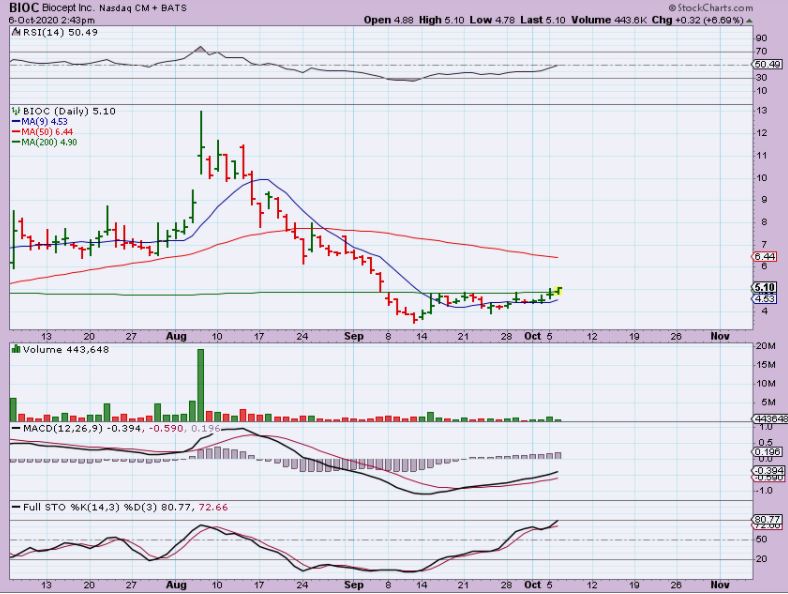
I AM SEEING BULLISH LOOKING BASES FORM IN COVID TREATMENT / VACCINE COMPANIES: My thinking is that if we are seeing a second wave in the spread of Covid (Paris is shutting things down, NYC is tightening restrictions, other areas are also reporting new spikes in cases, and so on) Then we may see a second wave in these companies. I will keep an eye on them and have already mentioned a few like BNGO, BIOC, RGLS, etc,
.
BIOC is one of the COVID TREATMENT companies that I did well on too ( see names like NOVN, RGLS, CHFS, BNGO, IBIO, NVAX, CODX, COCP, JAGX, etc etc). They have dropped back to their bases, but some look constructive. I bought BIOC yesterday as it crossed above the 200sma. I MAY BE EARLY, but it is a small starter position and I will add if it progresses.
.
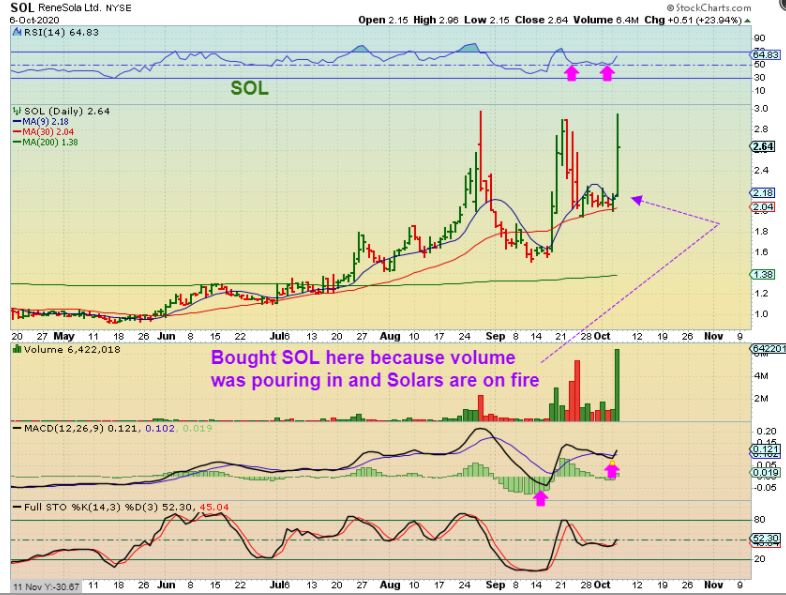
SOLAR STOCKS HAVE BEEN ON FIRE, RIGHT? SPWR, CSIQ, JKS, ENPH, RUN, VSLR and more are very very strong. SO I was looking at a lagger that keeps popping & mentioned in the live area that I bought SOL early in the day. It has strong volume flooding in…
.
SOL DAILY – Well SOL slowly kept climbing all day and was up 30% after I mentioned it. I didn’t sell because…
.
SOL WEEKLY – I didn’t sell because this sector has been on fire and also the weekly chart has been Popping with volume & still has upside potential. You could possibly buy here, but it is a bit hard to do risk/ reward wise, so IF YOU MISSED THIS…
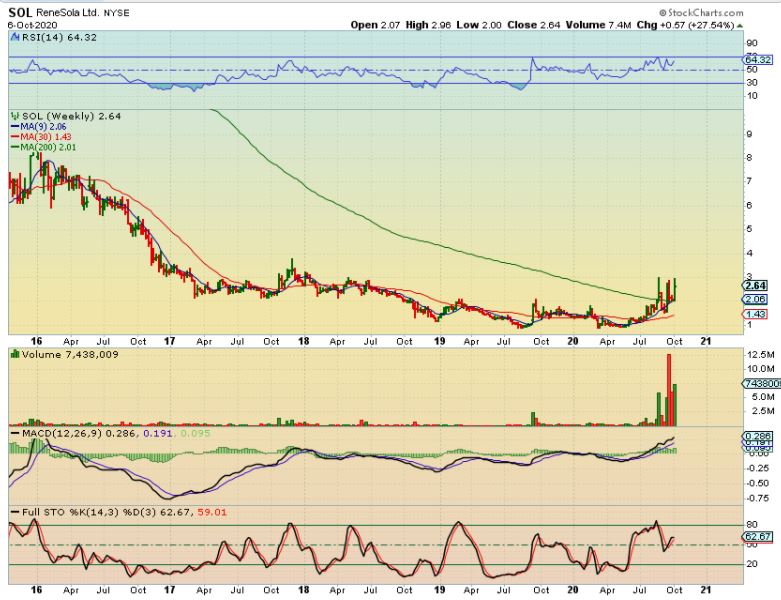
IF YOU MISSED THIS I WILL POINT OUT ANOTHER ONE.
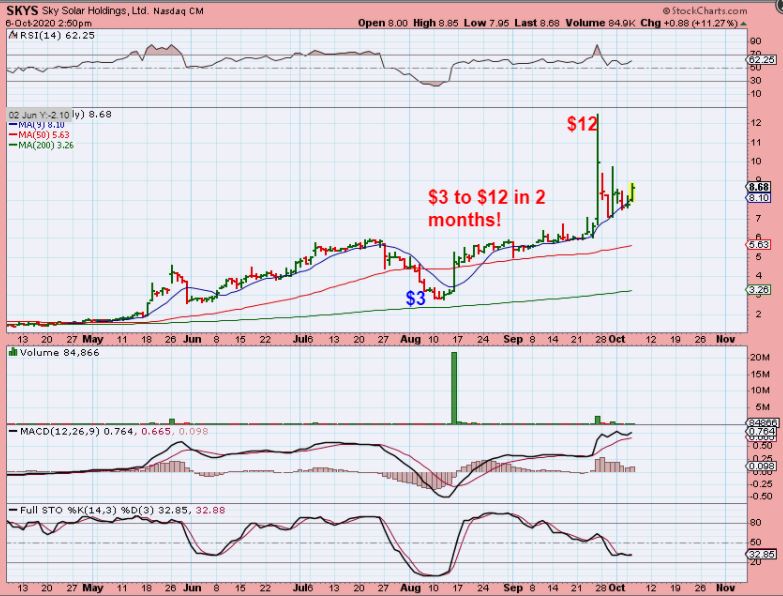
SKYS – I was going to buy this, but I didn’t like the volume. This chart is as of 2.50 p.m. Eastern Time. It finally almost had 100,000 volume, but when I looked in the morning it had 20,000 shares, midday 50,000 shares. I DO think that this can go from $8 yesterday to at least $12 and that is a good trade by itself, so it still may be well worth the trade. It would be a buy here.
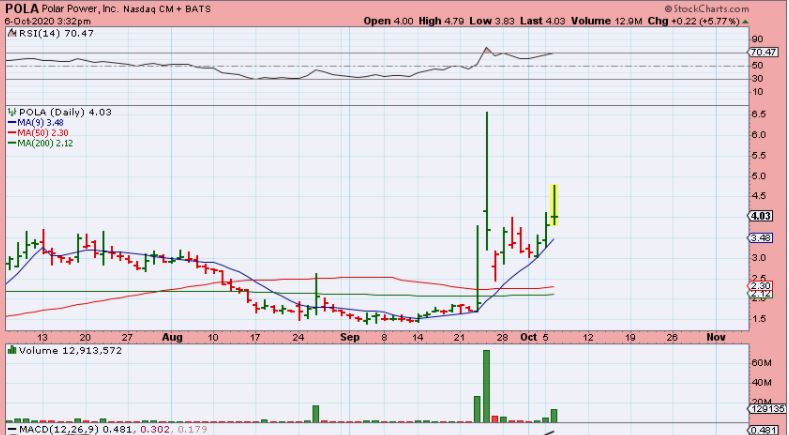
POLA- I did by POLA POWER and my stop is at the 9 or 10 sma.