Tuesday October 20th- We Need More Time
We did see a sell down in the Markets on Monday, but does a 1 day drop really change the bigger picture? Not often, so while many are ready to call a top in the markets, I have said all along that we may really just see a lot of Chop heading into the US Elections. Chop frustrates Bull and bears alike, but to me Monday was just 1 day of trading and I really feel that we need more time to see what is taking place. Use reasonable stops as always and we’ll discuss what changes Monday brought to the table…
.
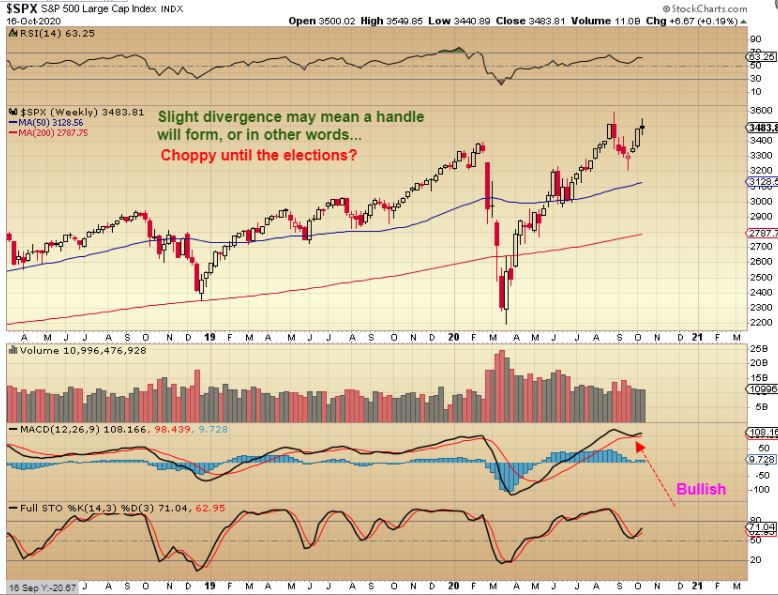
FROM THE WEEKEND REPORT I WROTE: SPX WEEKLY – I discussed last week that I felt we have an ICL in place and would run back up to the highs, maybe new highs. I see very slight divergence at the highs, so that means that we may stall and put on a handle to this cup. For the General markets that would mean that we should expect possibly choppier trading heading into the US Elections.
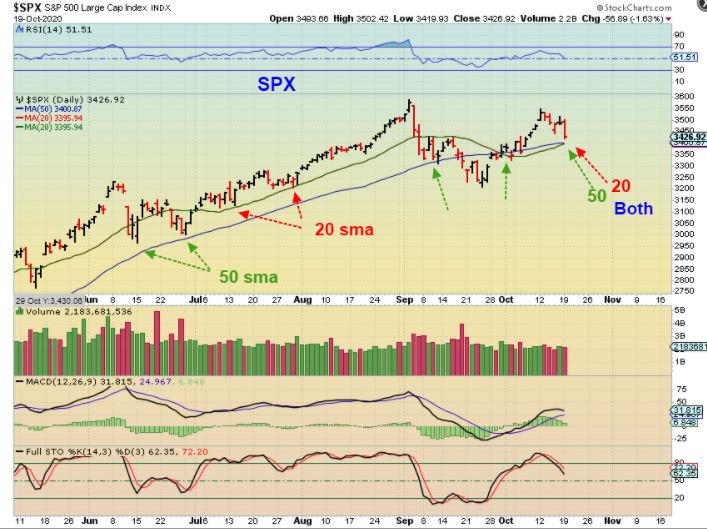
SPX – If that was an ICL in September, we don’t usually see Markets completely roll over in the first daily cycle. That indicates that the sell off that we got on Monday may not be long term damaging, so we need more time. Right now I would watch the 20 & 50 sma, and they are currently pinched together as possible support. This chart shows you why they are important, so please read the chart.
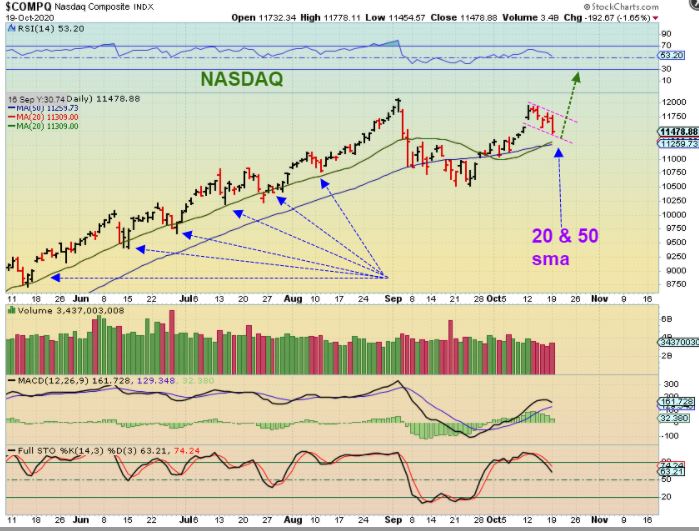
NASDAQ – So this MIGHT be a bull flag or a 1/2 cycle low, it even resembles a cup on a handle to me. If it is, we would still have price continue higher after a quick shaking off of some Bulls here. Again, we need more time.
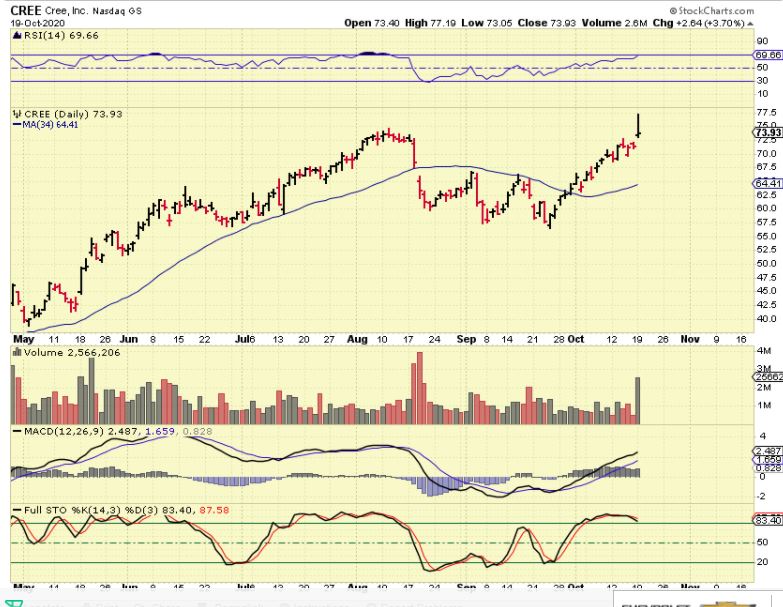
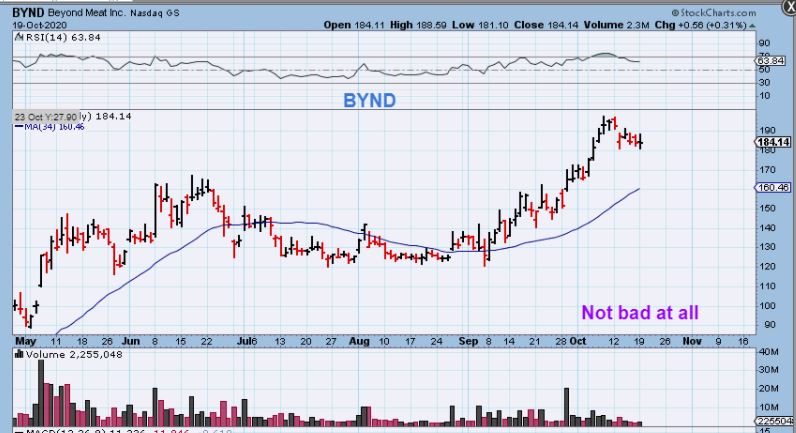
I took a look at charts like CREE, TSEM, BYND, COUP, WORK, MU, JD, AMD and a few others that we have been discussing, and they do not look bearish now with yesterdays selling. This also may indicate that the sell off in the General Market ETFS may not be as bad as many think.
BYND – You can look up the charts that I mentioned above and see that they aren’t dropping as quickly or sharply as the SPY & QQQ, so we’ll see what happens going forward. We need more time for more clues: Just use reasonable stops and Stay Frosty.
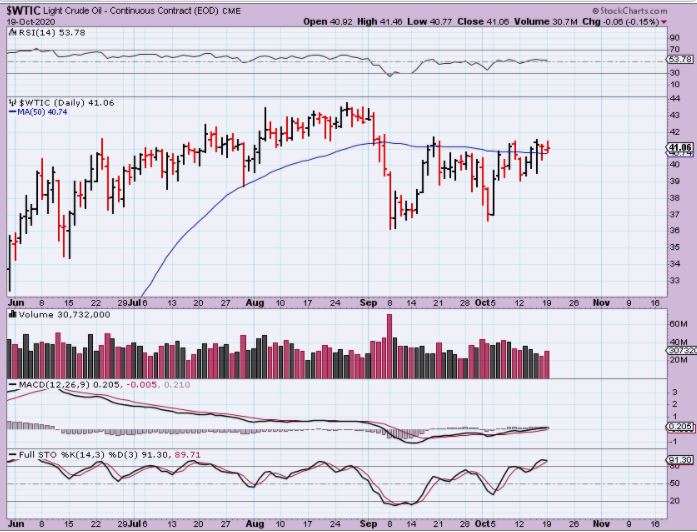
WTIC – Oil remains choppy and sideways, and this has pretty much been expected.
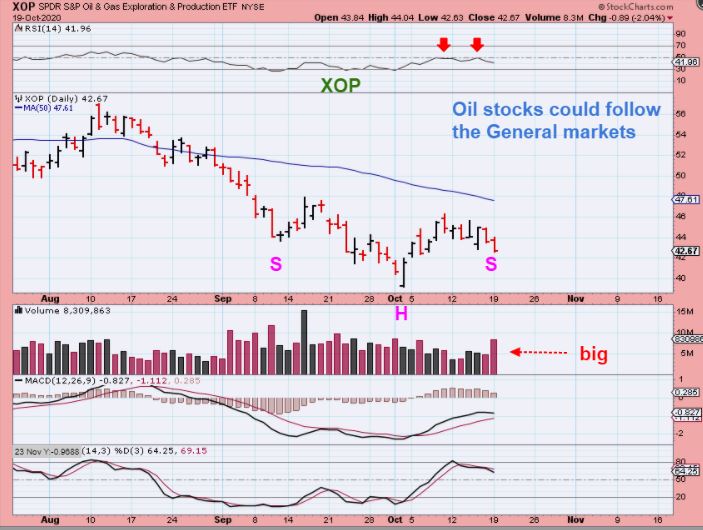
XOP – Oil stocks did follow the markets lower and volume increased, so this is an area that would need to be watched. Again we need more time. As mentioned in past reports, I am not really comfortable trading this choppy sector yet, but it may be shaping up with a low in place.
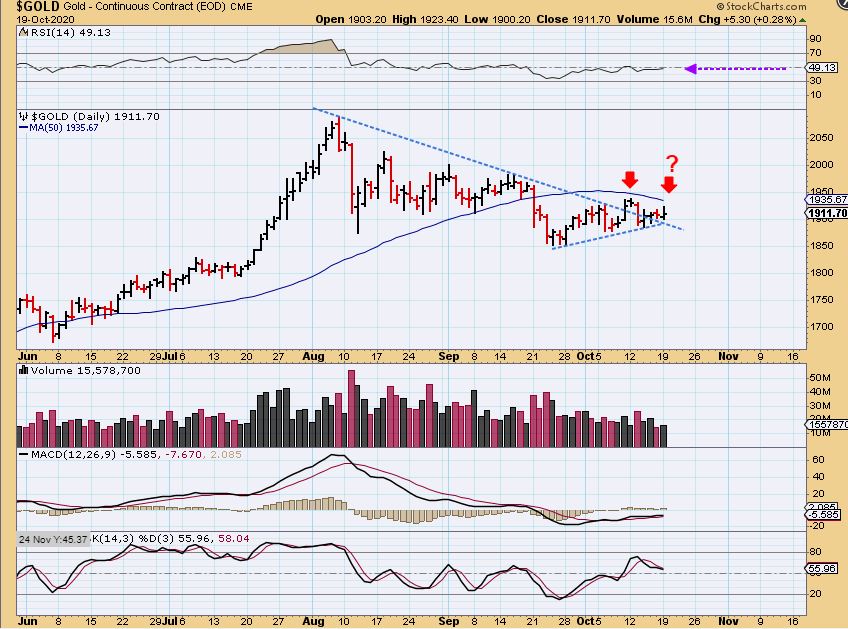
GOLD – I think that it needs to be noted that GOLD was Green but it is still unable to get above the 50sma.
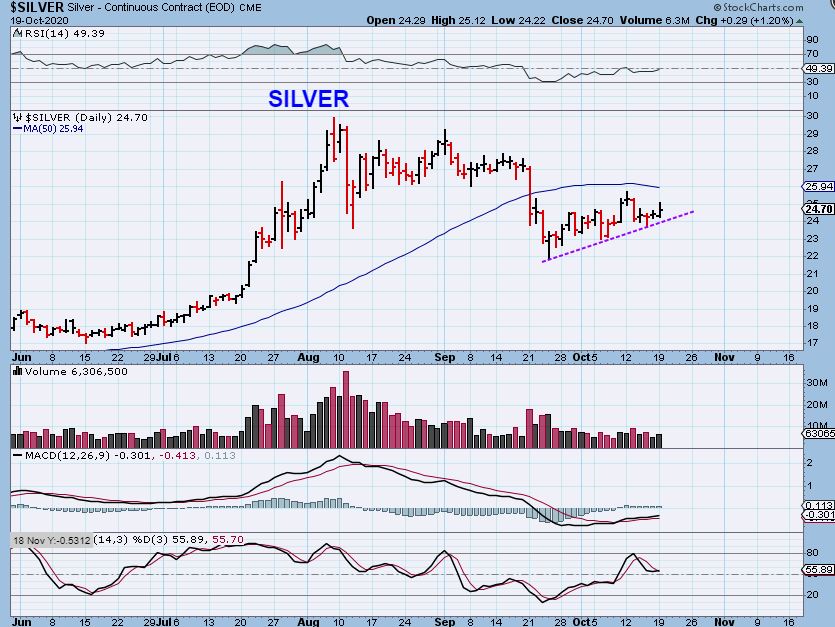
SILVER was also GREEN and the chart seems to be slowly progressing. So MINERS Must have been green too, right?
.
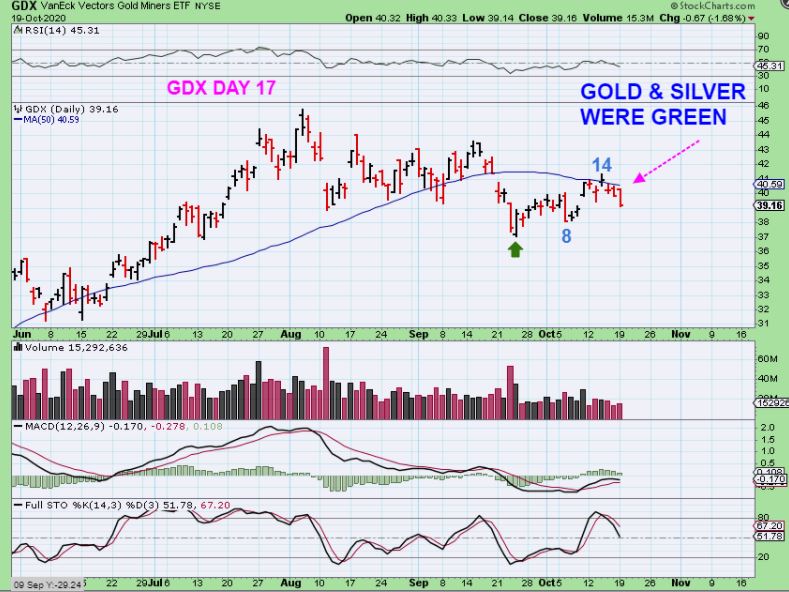
So MINERS Must have been green too, right? Wrong, they sold off with the Markets.
.
GDX was rejected at the 50 sma and GDXJ actually lost the 50sma. This was while GOLD & SILVER were both green, so we have a mixed picture and a few ideas come to mind. Miners may be following the general markets & if the general markets recover as a 1/2 cycle low? Miners may hold up too. Basically We need more time.
BARRICK – Some Miners like Barrick, Newmont, and so on are still trapped under the 50sma and near recent lows. They are threatening to break down in a sell off, while…
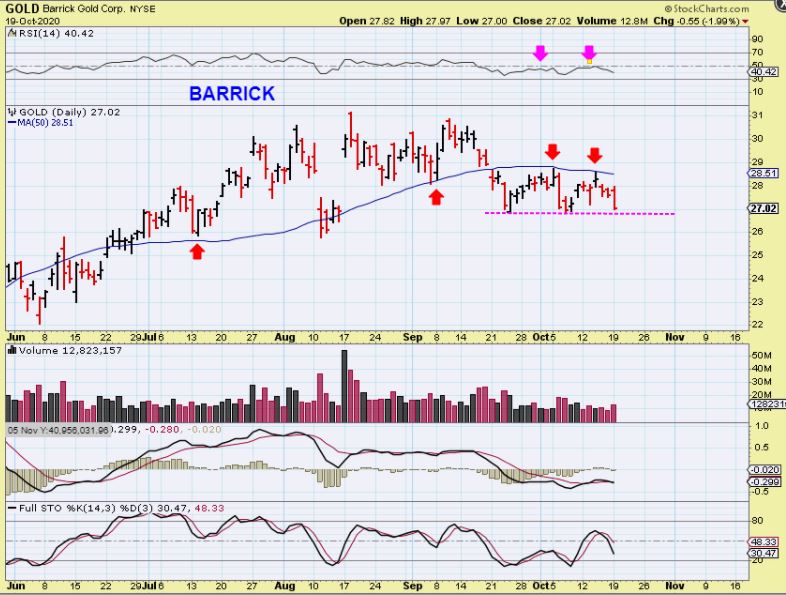
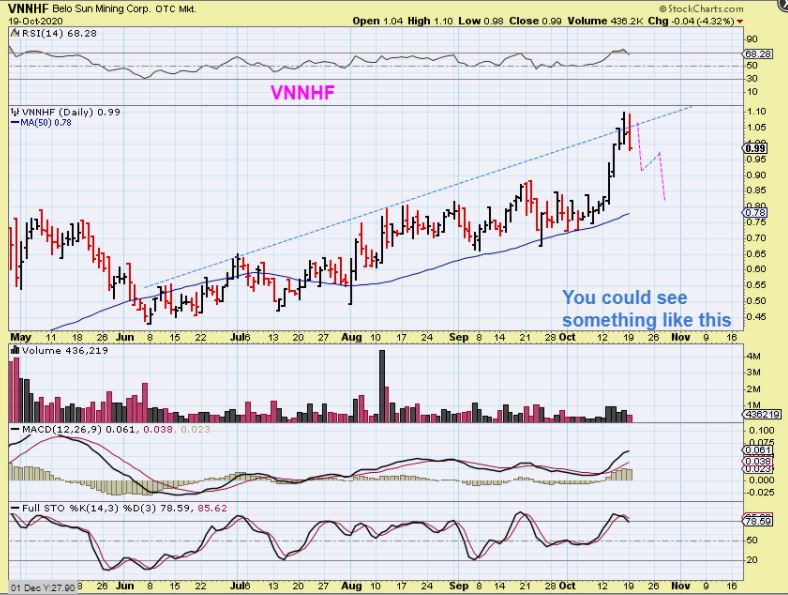
Other Miners like EGO, VNHHF, and a few others are up near high, though they did reverse yesterday too. What do we make of this? Miners may act individually during the mid point of the daily cycleand then when the daily cycles sells down into a dcl?…
.
I could see where these leading Miners may only drop & perform a back test of recent break outs if the selling were to persist, while the others sell down to their 200sma or another reasonable area ( moving average, fib levels, etc) . Both of these situations would offer a nice buying opportunity with our Miners. The theme for this report has simply been that…We are going to need more time to know for sure if this is weakness or choppiness in many sectors. Volatility and choppy trading is always a bit tricky and frustrating to trade, but I did see some areas still holding up.
.
Some areas are holding up & did resist the selling Monday, so I will discuss a couple of those areas below. Enjoy your Tuesday trading.
.
~ALEX
.
POSSIBLE SWING TRADES: BUY & HOLD WITH A STOP:
.
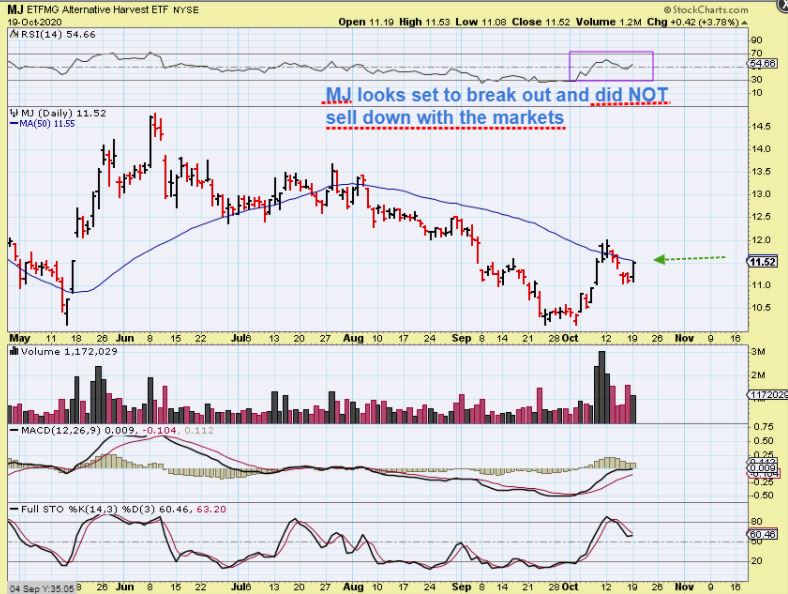
I want to discuss 2 sectors that I mentioned here a couple of weeks ago as possible buy & hold or swing trades. These 2 sectors ignored yesterdays General Market sell off. I mentioned the MJ Sector as setting up bullishly lately. Medical Marijuana has become widely accepted and recreational sales have been gaining popularity with recent new laws in place to legalize it, so this sector can benefit. Well, this sector completely ignored the general Market sell off yesterday, so let me show you that with the charts.
.
THE MJ ETF closed at the highs and the RSI reversed at 50%. This is a Bullish Set up and looks ready to break out & run. MJ the etf is a buy here as a higher low or when it breaks out above the 50sma. The next few charts will give further confidence to this trade. NOTE: With an ETF, you do not have to worry about individual risk like a bad earnings report.
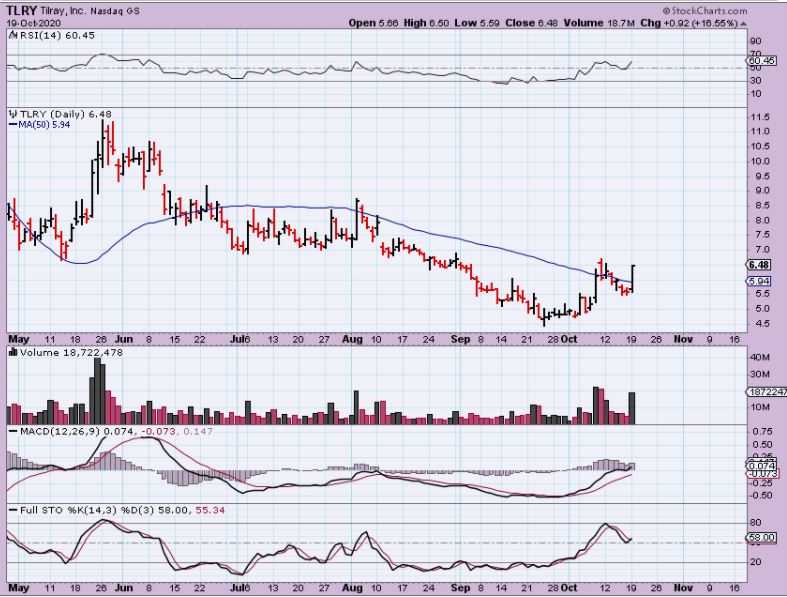
TLRY was up 5% pushing on that 50sma when I mentioned it in the live trading area under yesterdays report. It then closed up over 16%. Notice that it also closed at the highs after breaking right through the 50sma and TLRY did NOT sell off with the general markets and Volume surged too.
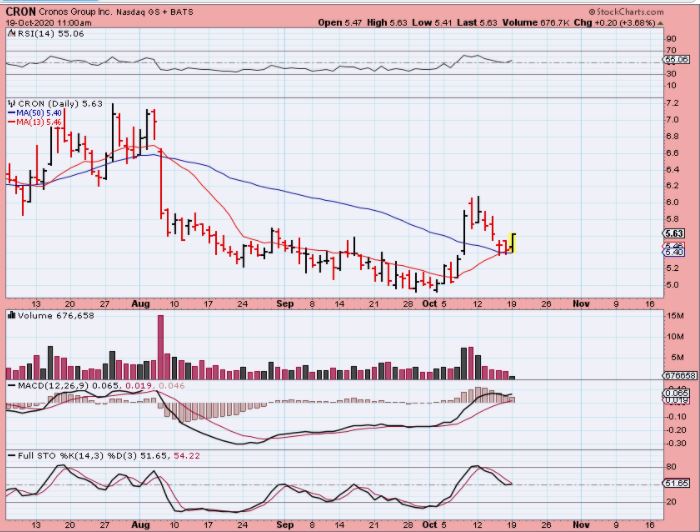
I pointed out CRON as it also reversed at the 10 & 50 sma support yesterday. By 11 a.m. it was up 4.5% and it went on to close at the highs with almost 4 million in volume too, so the whole sector looks to be coming to life. Let’s continue & look at a couple more…
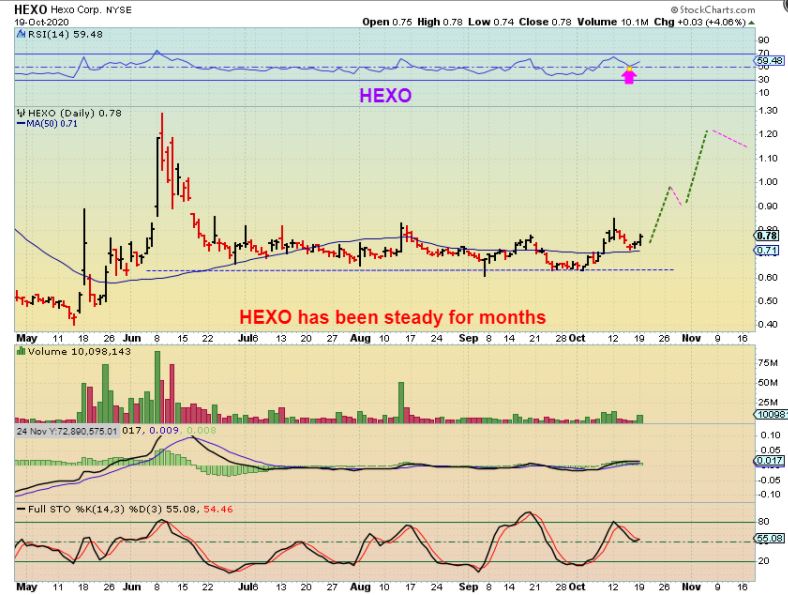
HEXO is looking like a good buy candidate to me because it has not been weak over the entire past 3 months. The last earnings report was a surprise upside, the next report is due next week OCT 26.
1. This is a long steady consolidation that looks ready to break out higher
2, Volume popped and price popped up 5% reversing on the 50sma
3. It was already mentioned as a Buy 2 weeks ago, so this would be a good place to add to that position or just start a new position too.
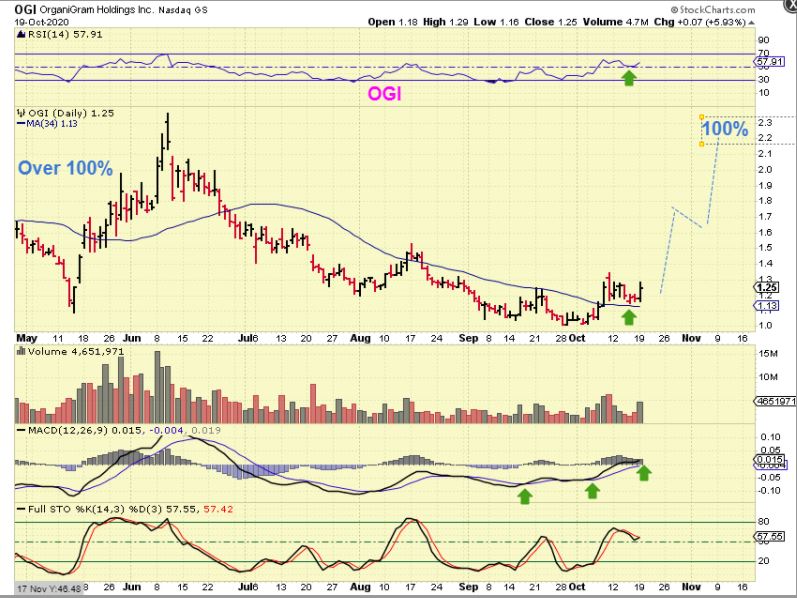
OGI also Bull Flagged along the 34 sma & popped with volume. This small pop is a 6% gain, and this could gain a lot more over time. I think that OGI is a low risk / high reward entry here near the lows. Again, these did NOT sell off with the general Markets. Earnings due Nov 24th(?).
.
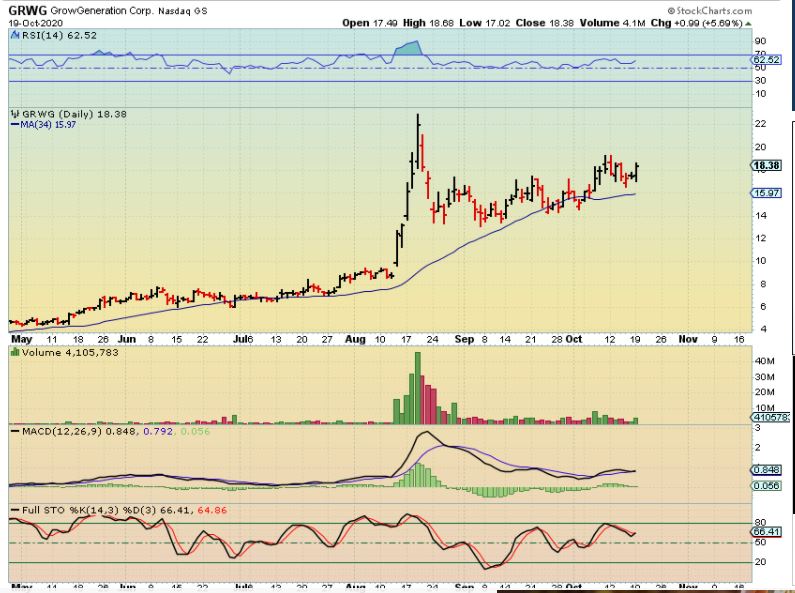
GRWG is a solid company and it has already proven itself with that August run. It tripled in July-August alone. This is a bullish drop & consolidation to the 34 sma and is now ready to run higher and continue to form this cup.
,
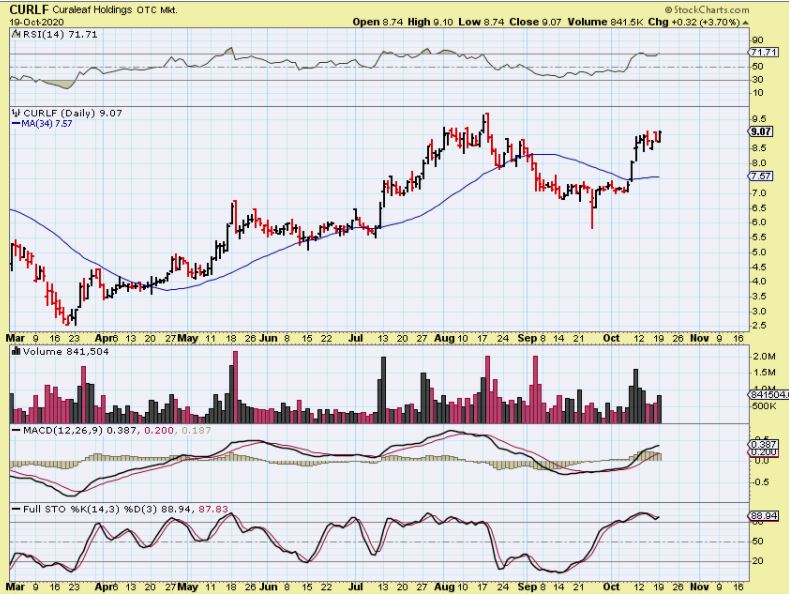
I will continue to cover this sector, and if you want to view a few more charts you can look up CGC, VFF, APHA, etc. YOU SHOULD SEE CHARTS OF PLNHF, CURLF, TCNNF, GTBIF, and some of the other OTC companies. You may be surprised like I was, because some of these actually have been choppy but also running higher all along. Here is CURLF for example and TCNNF & GTBIF look even better.
.
ANOTHER SECTOR THAT MAY IGNORE THE SELLING IN THE GENERAL MARKETS IS THE BLOCKCHAIN/BITCOIN ( Or other Crypto coins) SECTOR:
.
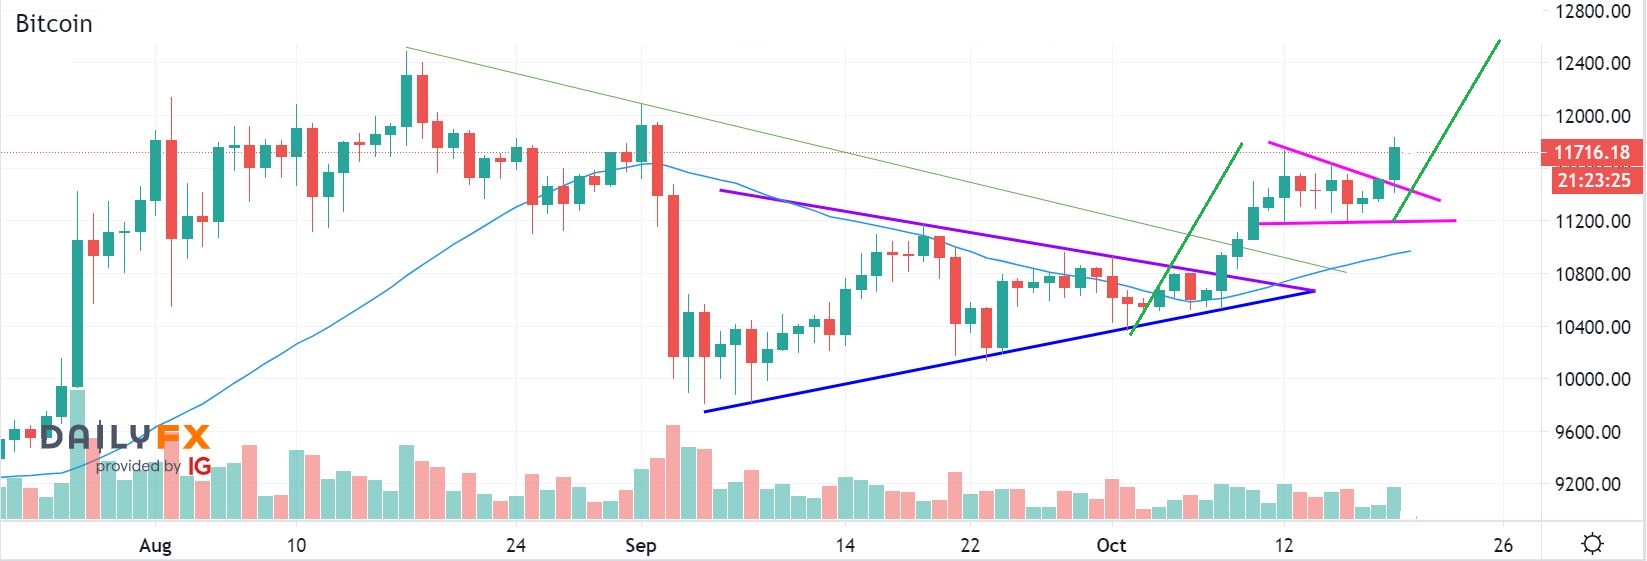
BITCOIN – During pre-market trading yesterday, I pointed out that BITCOIN was trying to break higher, and this could help out RIOT & MARA trades.
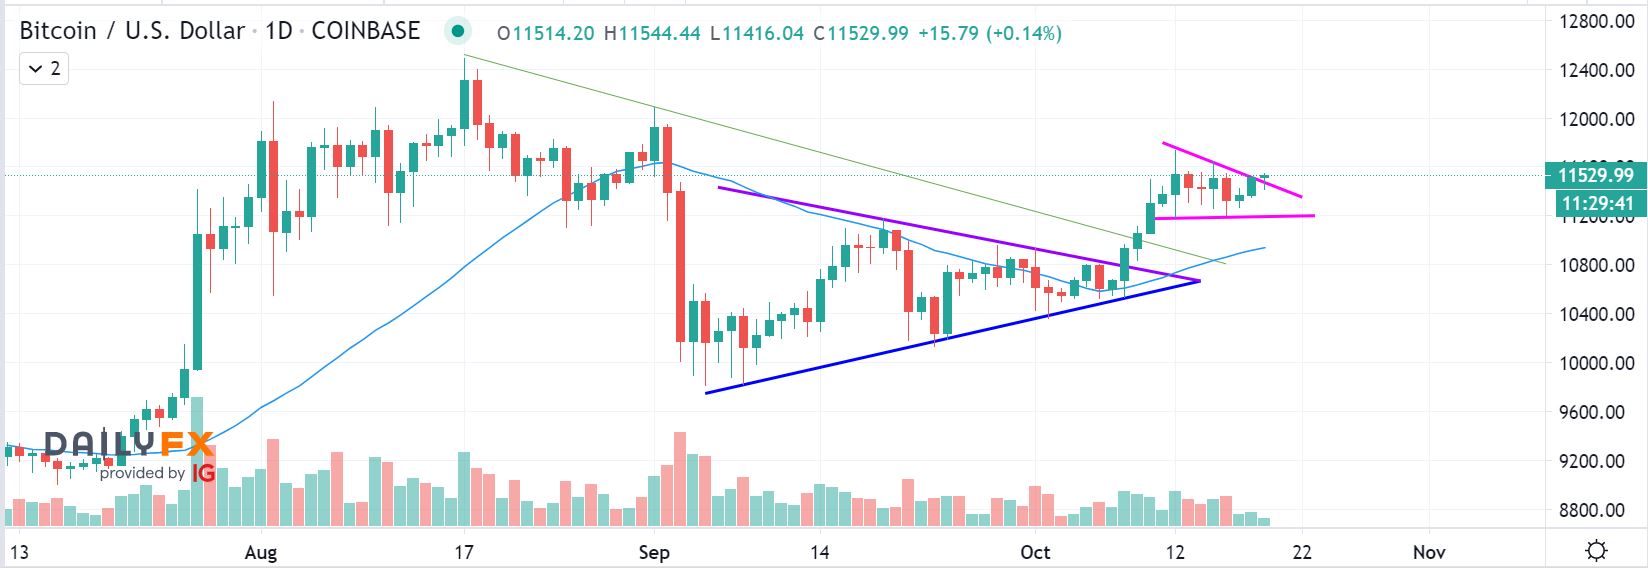
BITCOIN – As the day went on, you can see that Bitcoin did break higher, and RIOT & MARA both did well, even though they didn’t close at the highs. The Good News was that they DIDNT sell off to Red with the General Markets selling off .
.
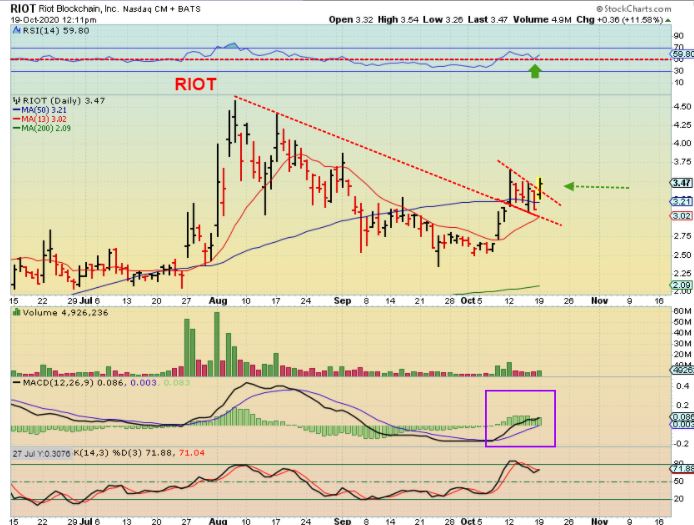
RIOT started to break a short term downtrend ( Bull Flag) so I posted this in the live area when RIOT was up 11%. It only closed up 7% but it does still look good. It sold off a bit at the end of the day, but was still up over 6%.
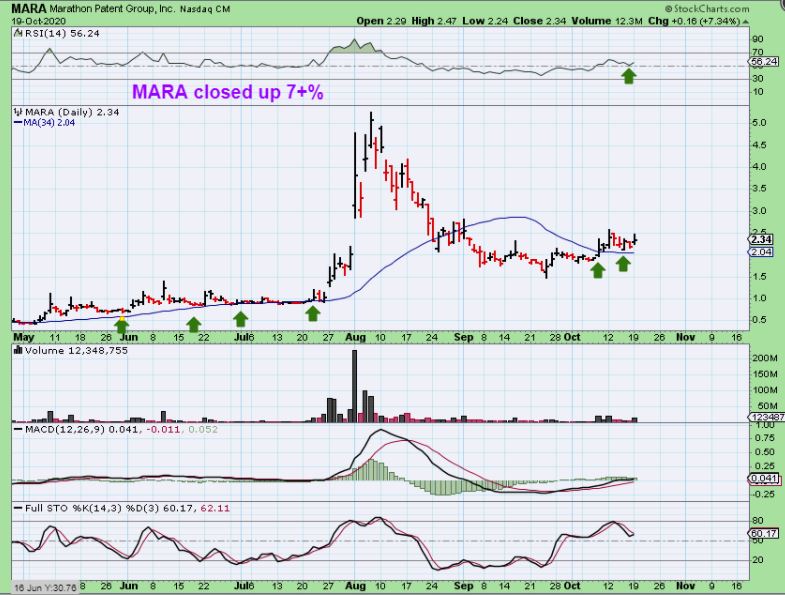
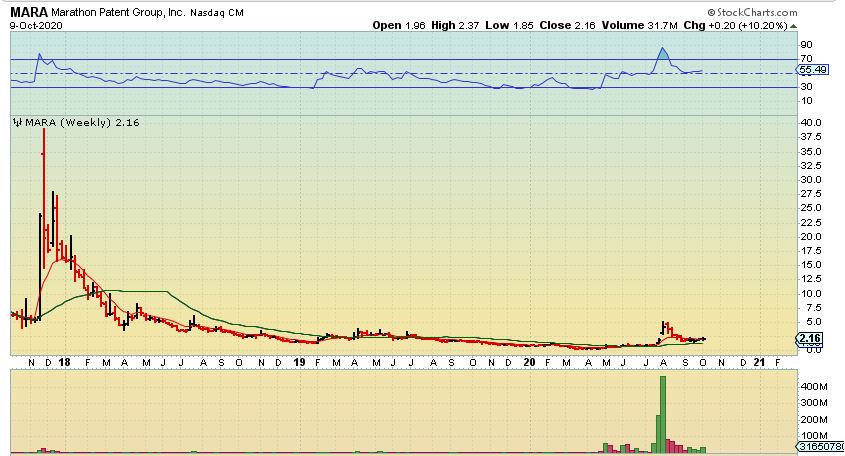
MARA – Today I noticed that MARA actually rode the 34 sma very well in early 2020. You can see here that after it broke above it 2 weeks ago, it has been bull flagging along that 34 sma for days. With that, you could probably even use that it as a tight stop on any new additions to your position if you wanted. MARA was up 12% yesterday, and dipped into the close to close up over 7%. That is a bull flag and the dip at the end of the day allowed another low priced buy.
LONGER TERM THE POTENTIAL ON THESE COULD BE VERY GOOD.
.
On October 9th I used long term weekly charts of MARA and RIOT to show the upside potential over time when they both reversed off of the supportive weekly moving averages.
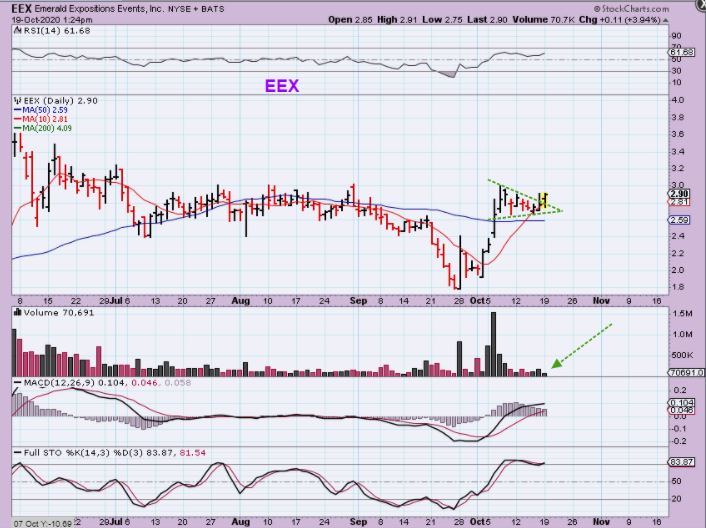
BY REQUEST: Yes I do till own EEX, it has not given me a reason to sell. I still own SINO, BLNK, and GEVO at this point. EEX appears to be making a bull flag. The only thing that I don’t Love about this stock is the volume. Midday yesterday it had less than 100,000, but it closed with 170,000. I’m still hoping for a break out and this one also didn’t sell off to red with the general markets.
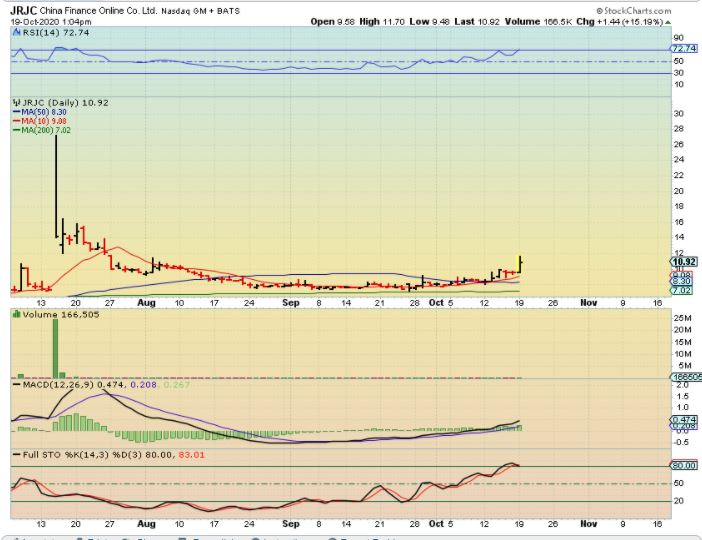
Several of the Chinese companies that I have mentioned are doing pretty good, but these have been very choppy and thus difficult for some to buy & hold. I have owned KNDI, CHNR, JD, and a few others like PHUN and BZUN in the recent past. Lets just take a look at JRJC.
.
JRJC has a nice long base and it popped yesterday up 20%, so I grabbed this chart. This one DID sell off with the general Markets, but if the markets recover, this may too…
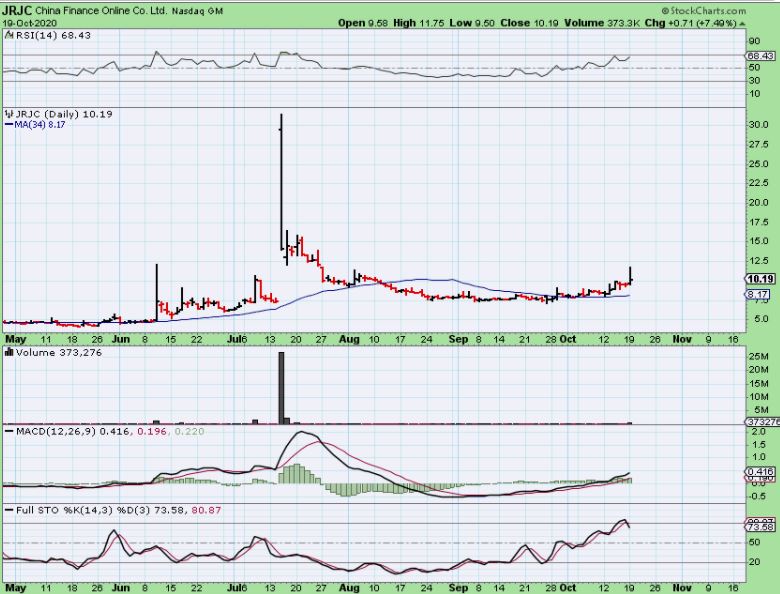
JRJC at the close – This is the 5 month chart showing the sell off by the end of the day. If you look closely at JRJC on a 2 month chart, you will see that it has really moved from $7 to $12 over the past month. It is simply very choppy and hard for most to buy & hold, but I’m posting this for traders.
I sold my KNDI with pretty good gains, it ran from $6 to $9 & Pulled back. It still looks good, but it is also hard to buy & hold due to choppiness.
.
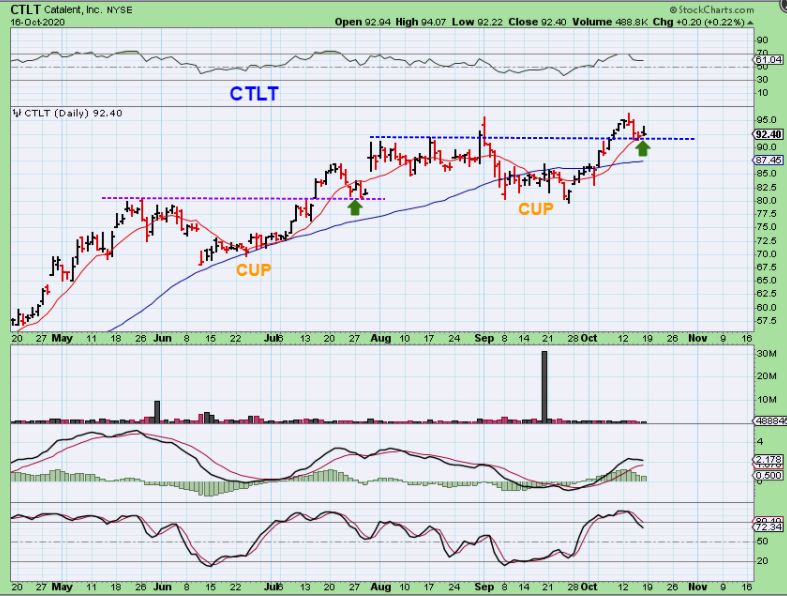
CTLT – I saw this chart on the weekend and I actually like this set up longer term if the General Markets do recover or stabilize. It may be ready to continue higher from this break out & back test. Yesterday it Closed down $1 at $91.26, which is not bad for a $90 stock.