Thursday October 22 – A Bit Choppy At Times
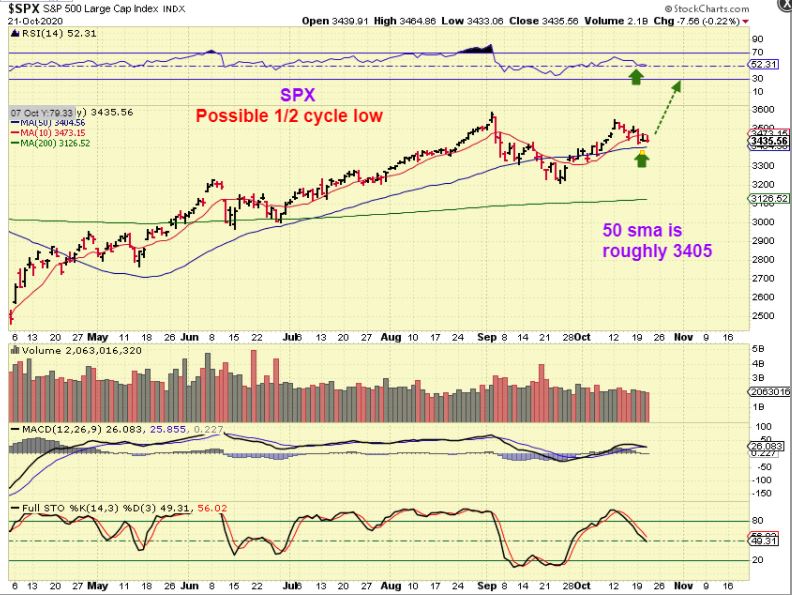
SPX – Honestly there was no real change with the General Markets. So far there is no damage, but progress has certainly been stifled. I’m watching the 50sma, that is where my stop would have been. I mentioned a week ago that we may see a bit more of the choppiness as we head toward the US Elections.
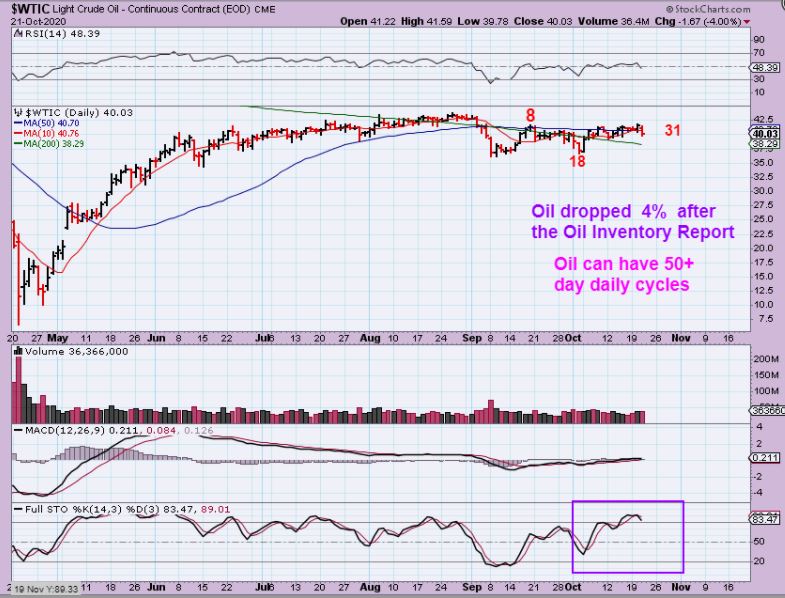
WTIC Day 31 – Oil dropped 4% after the Oil Inventory release, so basically I would say that this tells me that the chop continues now with more of a downside bias the older this daily cycle gets. please read the chart.
The USD dropped below what I had labelled as the daily cycle low at day 27. I would have expected Gold to pop more so this makes me wonder:
1. Are we seeing a failed 2nd daily cycle already that peaked on day 4 (Very bullish for Gold)?
Or
2. Is this a very long first daily cycle on day 35?
3. It looks much more like a failed 2nd daily cycle.
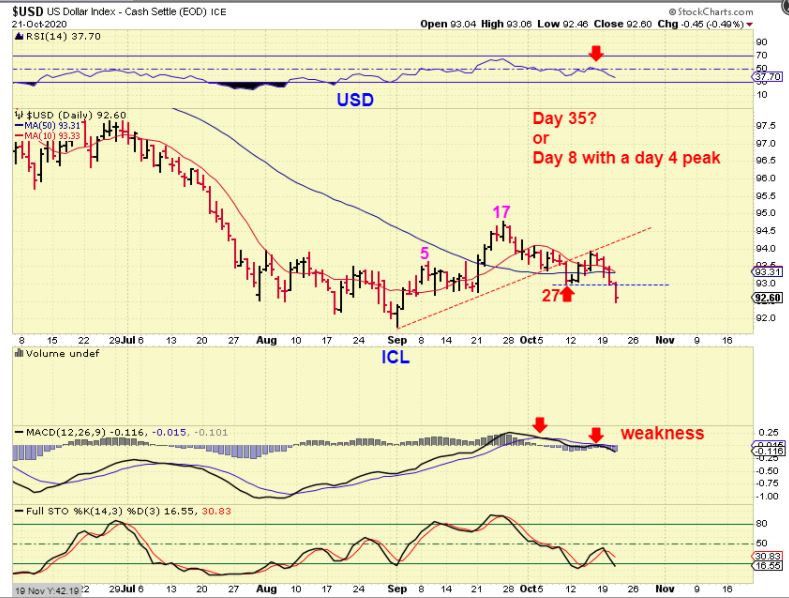
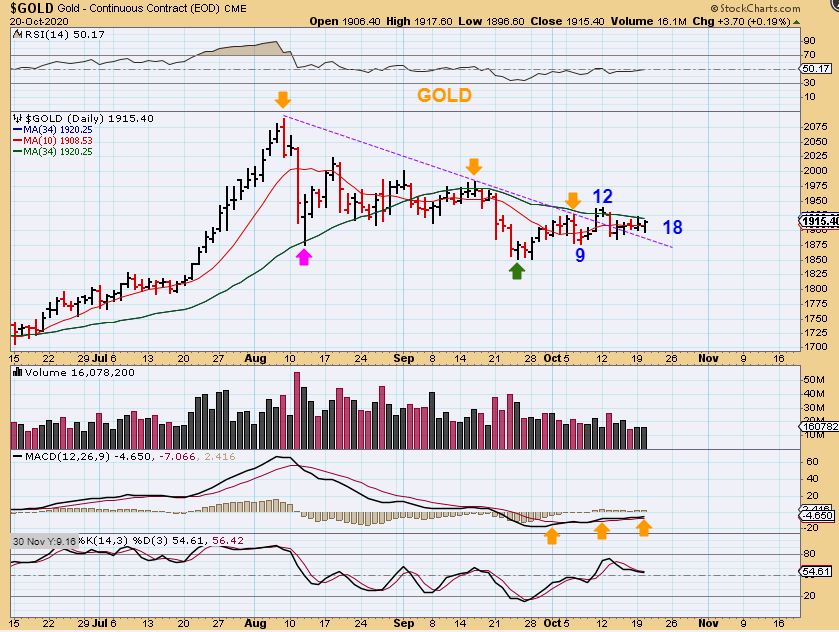
SAME CHART: Using technical analysis, I would simply say that at this point I just look at this chart as :
A ‘Bounce’ or ‘weak looking rally’ from September lows that could be rolling over. It gained & then lost the 50sma and now the MACD & RSI (1.5 months out of the lows) simply look weak.
GOLD Intraday: Early yesterday I was pointing out that Gold Might break above the day 12 highs on day 19. That would be bullish, because in a 5th daily cycle, you wouldn’t really see that kind of strength. That would show strength and a possible R.T. Daily cycle forming. That leans toward this being a very choppy first daily cycle.
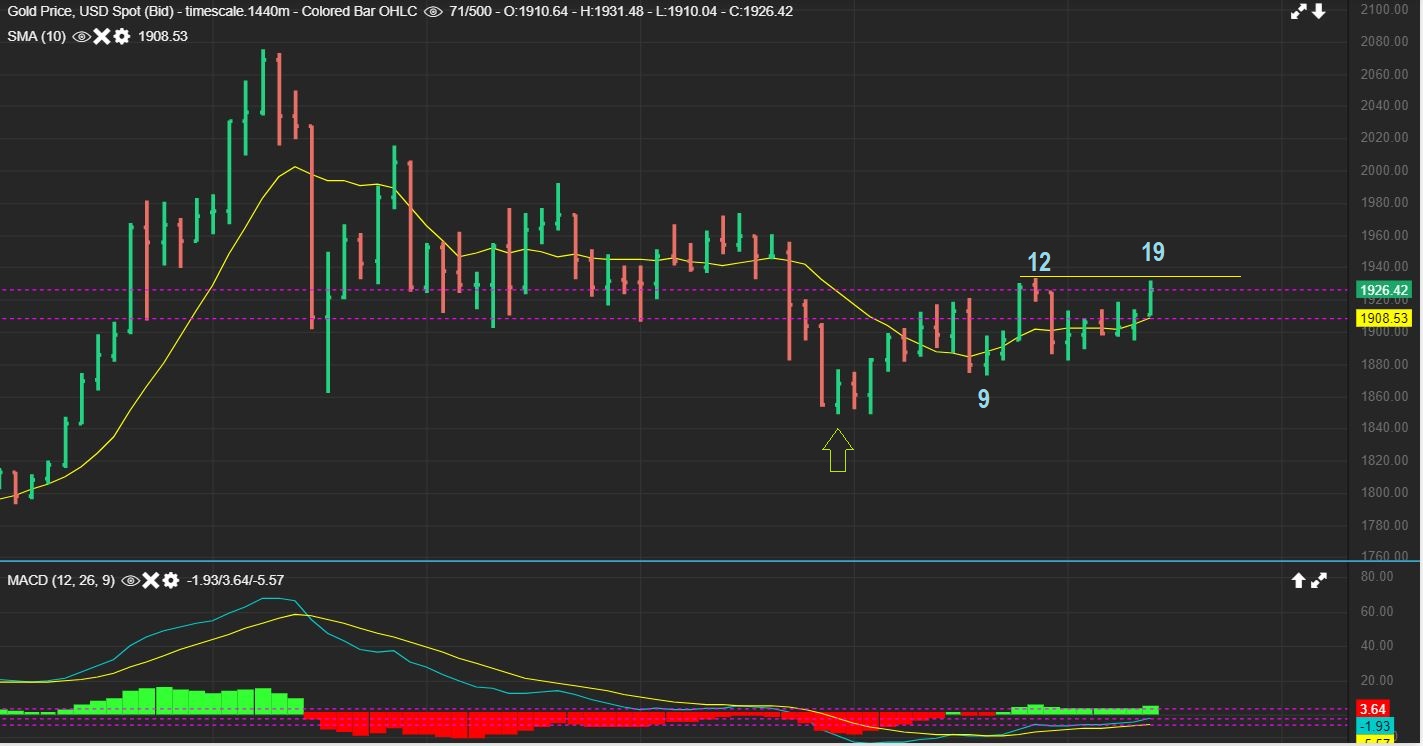
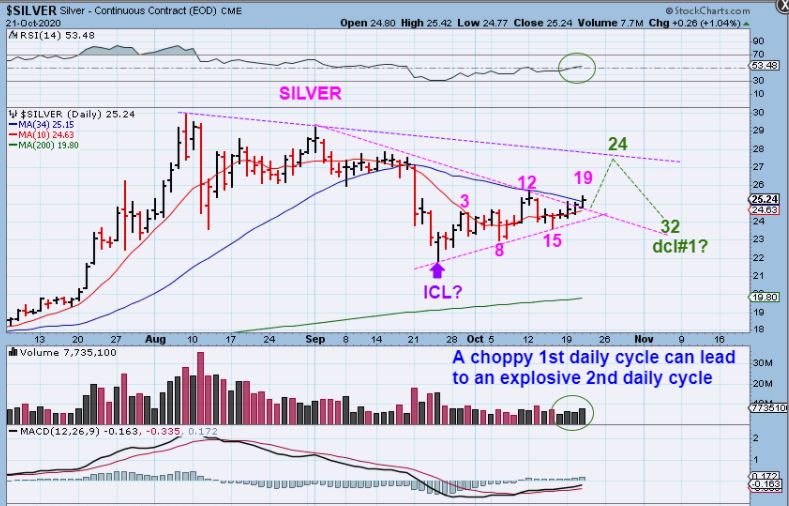
GOLD AT THE CLOSE – Gold did NOT break those highs, but it was close. The 50sma acted as resistance, even though the USD rolled over. SO far all we can say is that this has been a choppy sideways daily cycle in Gold. The good news is that if this is a 1st daily cycle ( ICL in place), it is just choppy and sideways. Those are often followed by a strong blast off during the 2nd daily cycle and we would catch that run higher.
YESTERDAY I WROTE THIS, AND BASICALLY WE HAD NO REAL CHANGE YET:
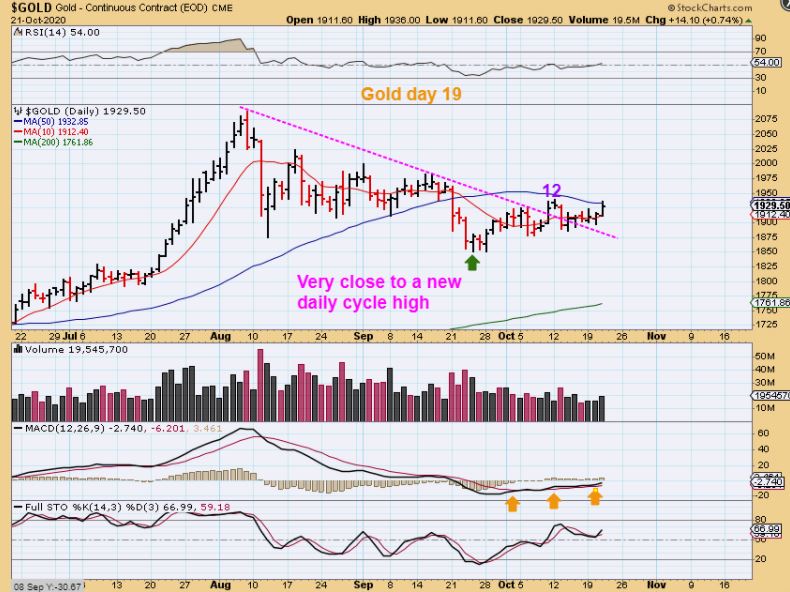
1. BULL: If we break above day 12 to new highs now on day 20 or so? It is Bullish. We don’t get right translated 5th daily cycles. that said…
2. BEAR: The last daily cycle looked quite bullish all the way up to day 25 too, but then it dropped very quickly into that dcl. That can happen too, so this continues to give us a mixed review.
.
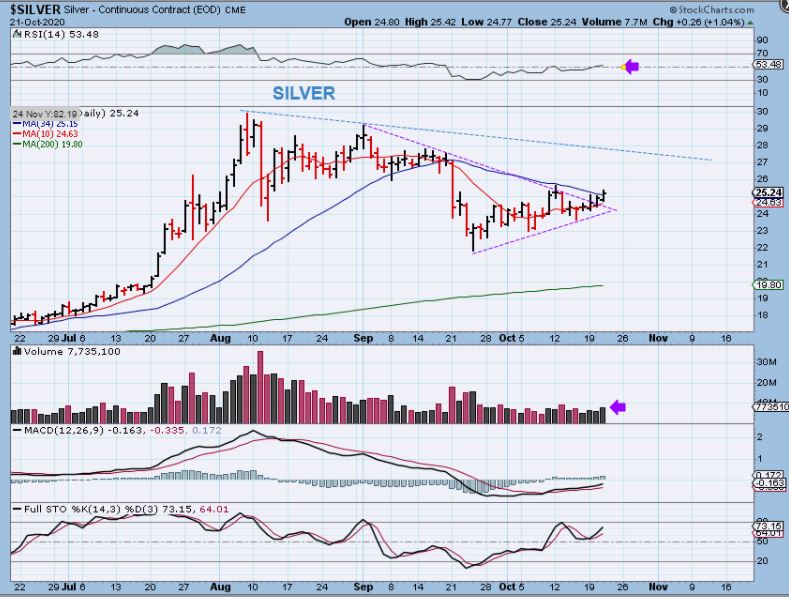
YESTERDAY I WROTE ABOUT SILVER – This looks bullish too, but it also could go either way. The problem is the sideways chop and lack of strong volume on the up days ( so far). A break above the 34sma and a new 1 monthly high would make it seem as though an ICL drop happened in September and this could be the first daily cycle as mentioned in prior reports.
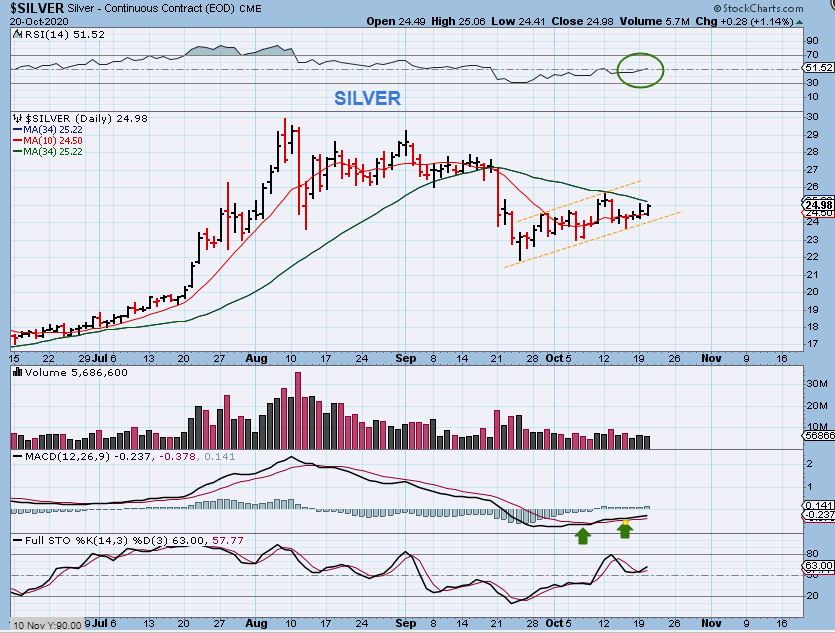
SILVER #1 – Silver did break above the 34 sma, but not above that day 12 high. Volume did increase slightly.
SILVER #2 – We are on Day 20 as of Thursday. So far we did NOT break above the day 12 highs, but we are very close.
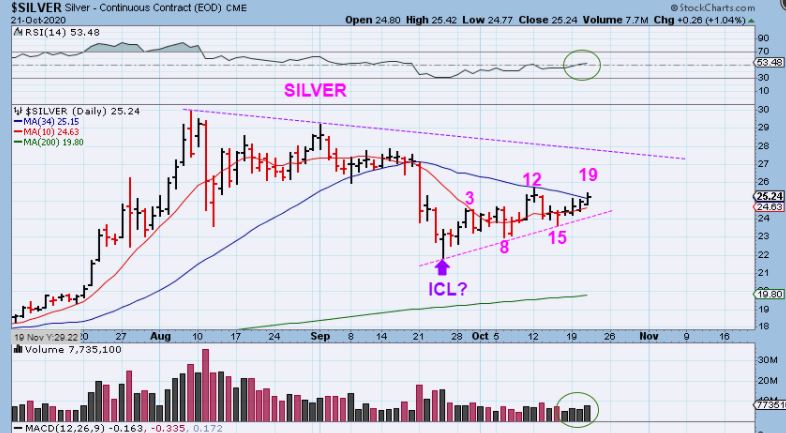
SILVER #3 – I would have expected a drop to the 200sma as an ICL (and we still could), but so far this resembles an ICL with the last drop. IF IT WAS AN ICL, we might see a run up to the upper line as drawn here, and then a drop to the dcl near elections might put price right back to where we are now. This would become the major buy opportunity that likely precedes a strong rally out of this consolidation.
.
Yesterday I had 4 charts of GDX and nothing really changed, I will include one of those charts here again. You could go back to yesterdays report for a review GDX there if you wish, but I’ll quickly cover it here too.
.
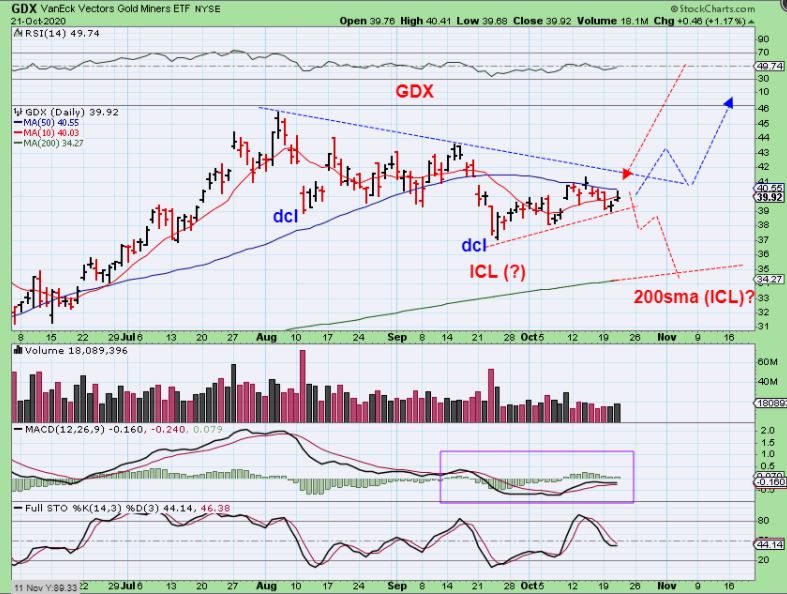
GDX #1 – GDX was actually capped by the 50sma with a small pop & drop. That was surprising with the USD drop & Gold & Silver pop.
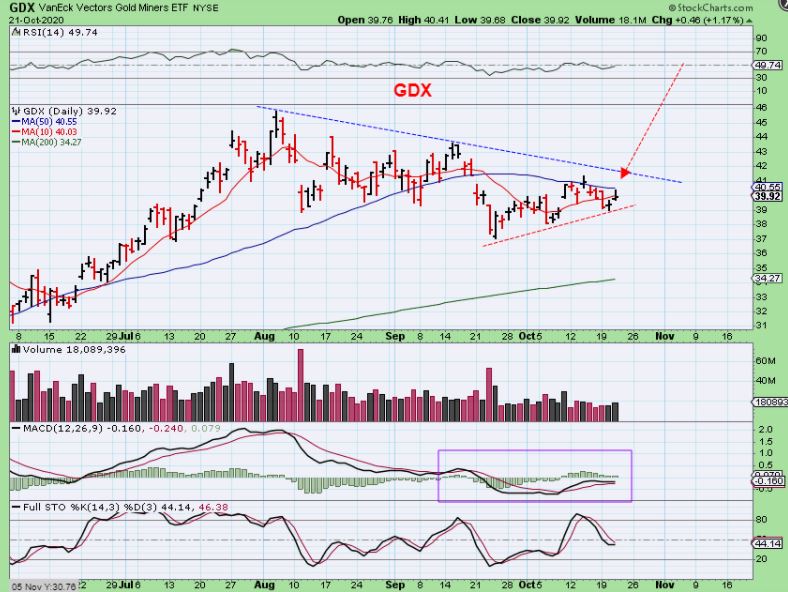
GDX with our 2 scenarios shown:
.
1. If that was the ICL drop in September, this could just be a very choppy 1st daily cycle. It also still has time to break out on day 20+ and then dip to a dcl (Blue Arrow). The good news is that the dcl could then land right back here & complete a choppy sideways first daily cycle. The 2nd daily cycle should be the rocket ship ride higher.
2. Since GDX only has a small pop & drop yesterday with the USD dropping & Gold popping yesterday, this still may be a weaker final daily cycle. If it is, it may drop to an ICL as we close in on the US Elections/ FOMC mtg (Red Arrow). I would guess that the 200sma could come into play around the time of the US elections.
3. Unfortunately, the choppiness reduces clarity in a big way. Either of these scenarios is still possible.
.
FROM YESTERDAY: SO LETS JUST TAKE A LOOK AT THE LAST DAILY CYCLE :
.
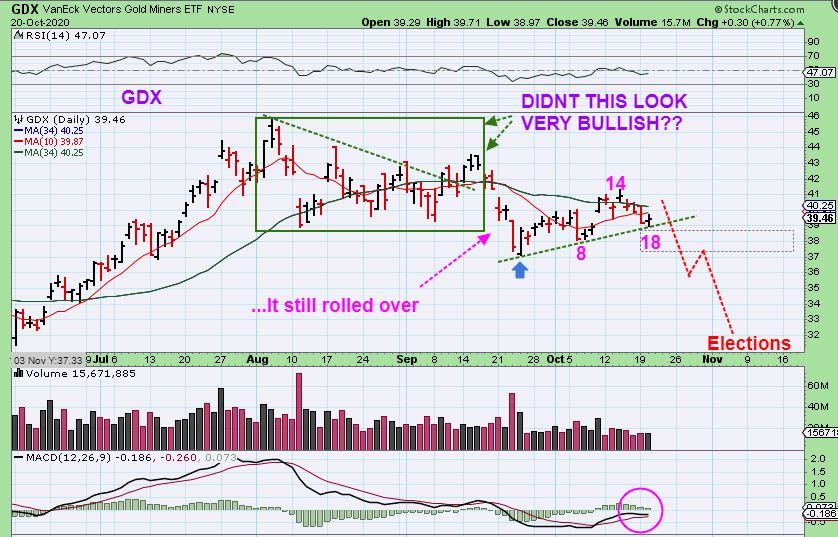
GDX – That last daily cycle looked pretty bullish in that sideways chop too. Look at the Green Box.
1. It pushed toward the highs for 3 days and then rolled over quickly.
2. I just wanted everyone to see that bullish looking box, because this current set up looks bullish too but it did roll over.
3. So if you buy this or add here, just know that we may get one more drop ( its better to know that than to get surprised). These last 2 daily cycles have been FAR MORE choppy that the run up in the first few daily cycles seen on the far left.
.
The choppiness in all sectors is making most ‘short term trading’ difficult, but all choppiness eventually comes to an end and leads to a directional move. For the General Markets, this can be a buying opportunity with a stop, or a good place to add to current positions. I will mention more set ups if and when we get moving higher again. First I want to see if we get a reversal and start to continue higher.
.
For the Precious Metals we will either see a drop into an ICL, or a pop and drop into a first daily cycle low. It seems that the timing for that catalysts will be closer to the next FOMC Mtg and the US Elections. Patience will pay off, because whether we pop or whether we drop, it should be followed by a strong daily cycle after the next dcl (ICL?).
.
For now the blockchain stocks ( RIOT, MARA, CAN, NXTD, FTFT , and a few others ) are the ones trending higher, and the Medical Marijuana stocks are also remaining bullishly set up, ignoring the General Markets shakiness. I’ll briefly discuss both below.
.
Enjoy your Thursday trading!
.
~ALEX
.
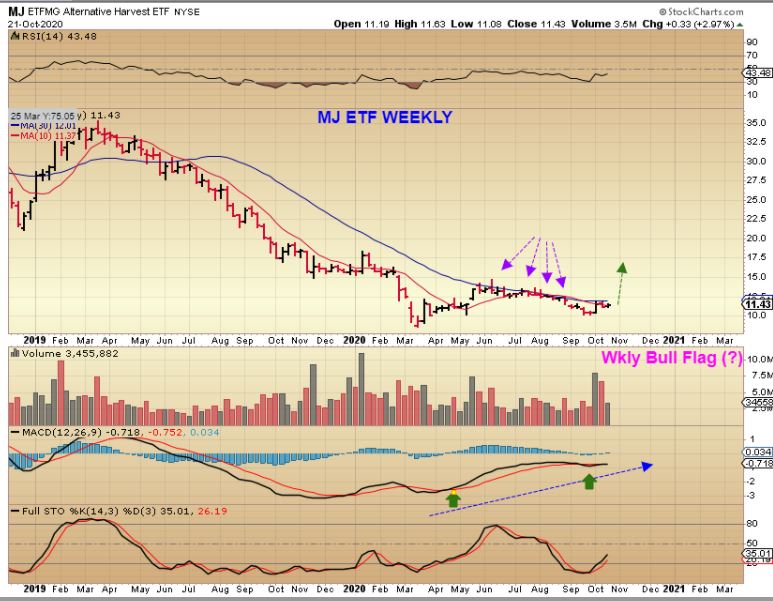
MJ ETF WEEKLY – As mentioned, many Medical Marijuana Companies are starting to set up bullishly, and the ETF reflects that. This looks like it is oversold and ready to break out above resistance. With this double bottom, the MACD has been strong.
.
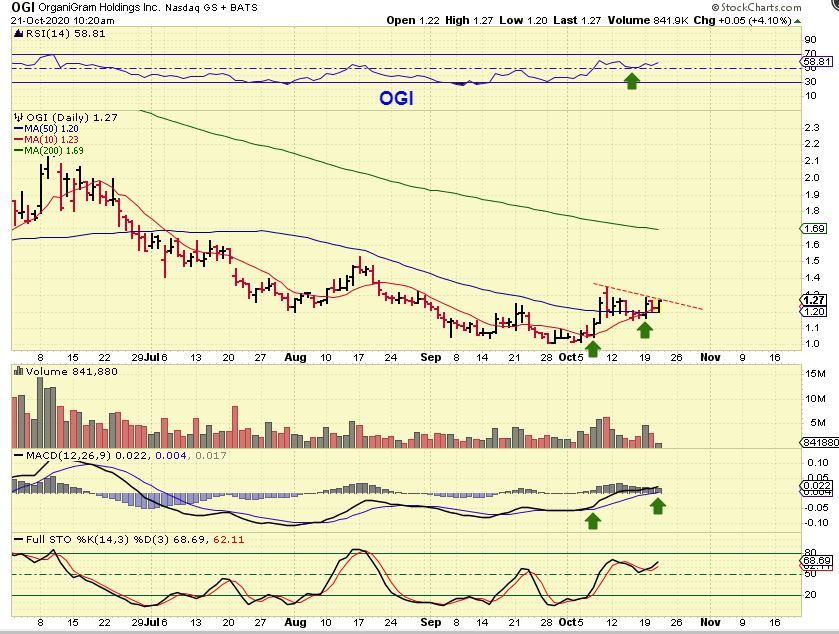
OGI remains bullishly set up in the MJ Sector.
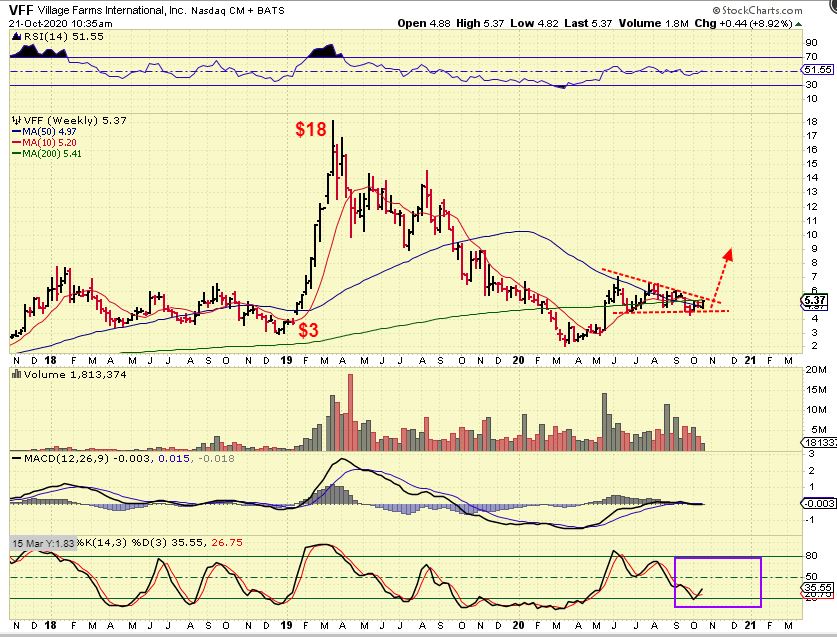
VFF WEEKLY – I just happen to look at a few Weekly Charts in this sector and VFF Really caught my eye as a bullish set up with good potential. In 2019 this ran straight up from $3 to $18 and now it has dropped and based out. This is now a tight base in a triangle formation and it is reasonable to believe that a break higher could really gain some traction over time.
Did you notice that in 2020, this already ran from $2 to $7 and then built the bullish triangle? Theoretically the next leg could run to $10 (100%).
.
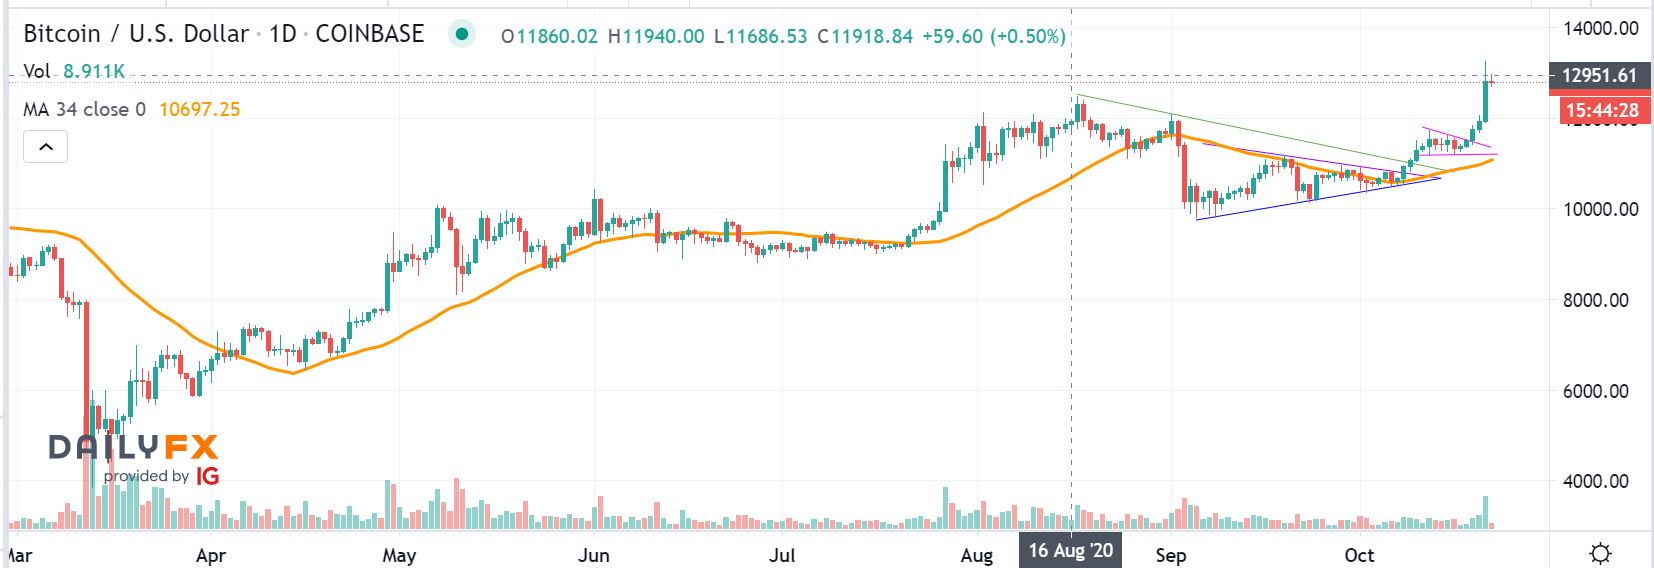
BITCOIN rallied above $13,000 overnight and the Blockchain trades are doing well. This MIGHT Pause here since it reached the more recent August highs, but it could also continue higher. Lets me show you what I’m looking at…
.
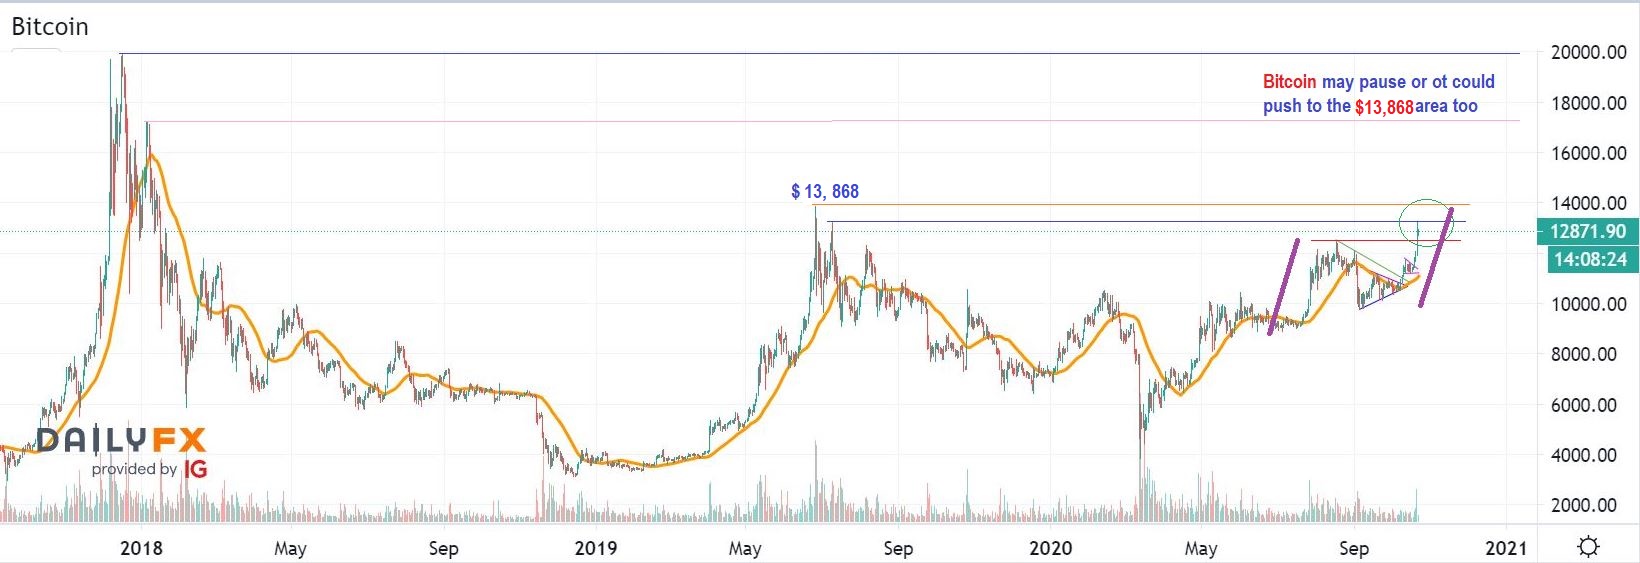
BITCOIN Stepping back we see that Bitcoin pushed above the August 2020 highs this week and ran to the July 2019 peak. The June 2019 peak is $13,868, and that may be next on this run. In fact…

.
BITCOIN – a measured move from the recent June to August run would also point to that $13868 area. After this target is hit, we look at the longer term…
.
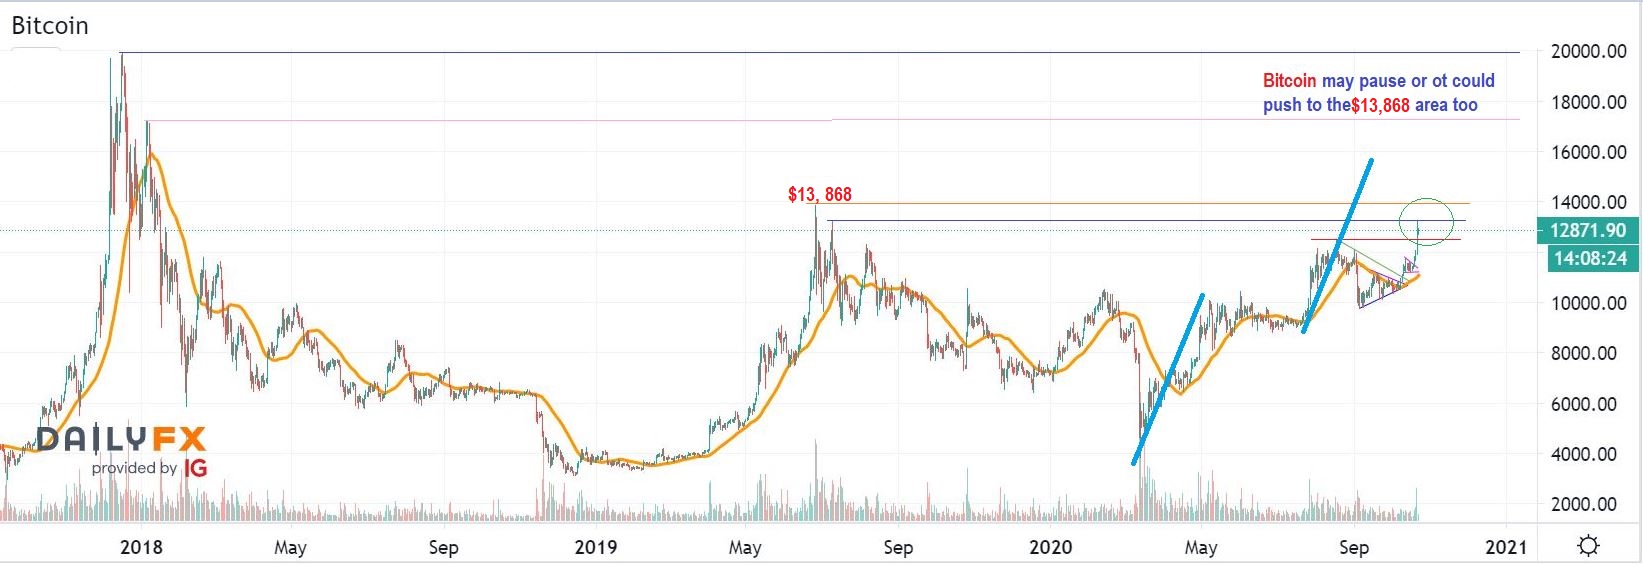
BITCOIN made a strong run out of the 2020 lows and then consolidated. If we did a measured move from those 2020 lows to the first peak before that consolidation started, you reach up toward $16,000 and eventually the 2018 peaks. As you can clearly see, we do get consolidations that can last for months at times, so I’ll just take it One step at a time.
My first target of $12,500 was reached, then the $13,250 was tagged overnight, and next? The June 2019 peak of $13,868 is certainly not out of the question.
.
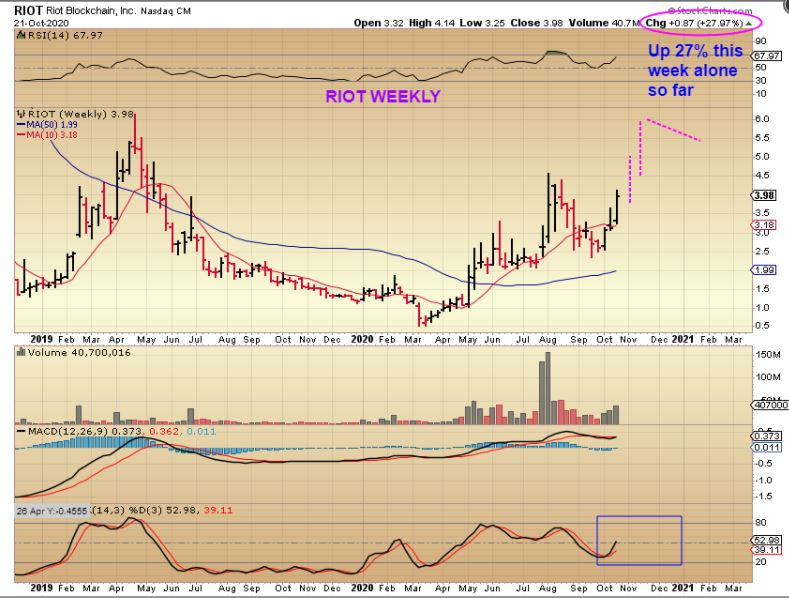
RIOT WEEKLY – The RIOT, MARA, BITCOIN trade has been playing out very nicely. Yesterday CAN, NXTD, FTFT and a few others joined the race. I do expect more upside seem on the Bitcoin charts above, but there are no guarantees in trading, right? So sell some on the way up to lock in gains if you wish, or raise a stop and hope that we don’t get a large gap down one day. These do move swiftly in both directions.
.
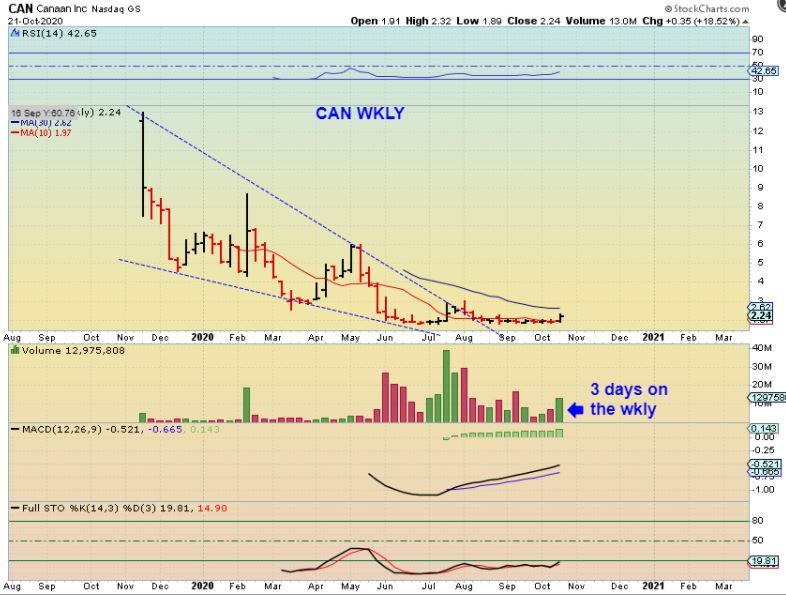
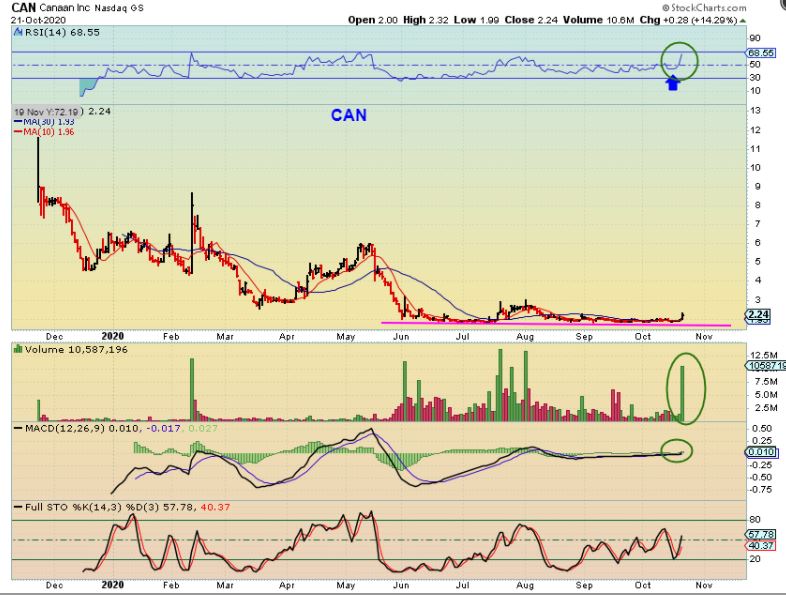
CAN DAILY – This is another company on the blockchain list, but it wasn’t responding to Bitcoins rise until yesterday ( Thx SOG for mentioning it). I jumped in as it started to leave this long base. It closed up 14%, so it may seem hard to buy, but I’m showing it because…
1. If it dips- you could buy the dip if you add it to your watch list, or
2. You could start a smaller position here and let it ride. Add later.
3. You can see the upside potential if this sector remains hot. This would be the lows coming out of a base, and…
.
CAN WEEKLY – This is a nice pop out of a very oversold weekly flat base. Putting it on your watchlist and finding a way in over time could pay off nicely, again- if this sector remains hot. I think that it will, with the normal consolidations along the way.