
Weekend Review September 19th
For this weekend report, I just want to try to keep it simple. I have not been tweeting this month, so I do not have any new subscribers. That means that everyone here knows what my expectations have been and what the charts and recent analysis have been reporting back to us. I DO SEE A FEW THINGS that happened after the FOMC MTG that I want to explain, and we’ll have to watch next week to see what comes of it. I do think that we have some great trading ahead in a few sectors too. We just had a FED WEEK, and that may have affected some things a little, since we did see choppiness Wednesday & Thursday. Lets just get into the report, with past expectations in mind, and review what we have right here and now. 🙂
.
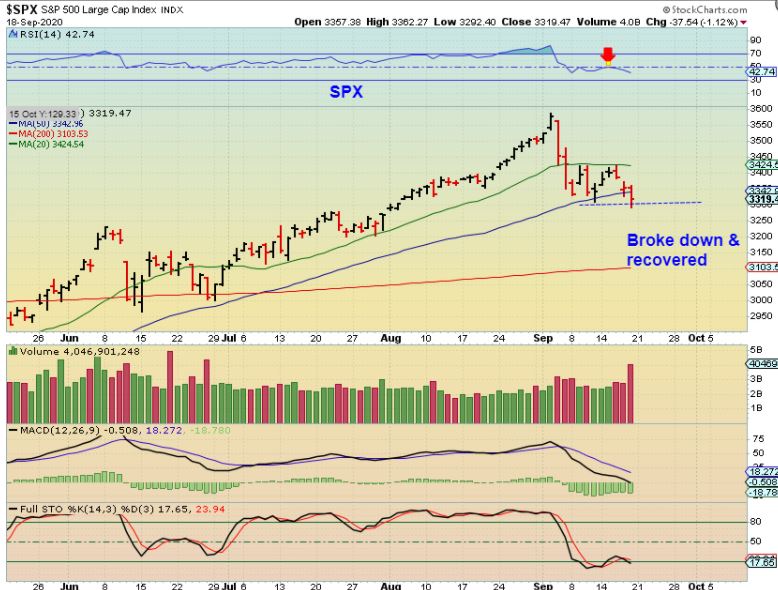
SPX DAILY – I expected the recent lows to hold as a dcl, since that daily cycle is about 60 days long. Do you remember when they Fed would announce low rates, and the markets would take off higher? Well this time we broke down post Fed Wed-Friday, never closing above the 10sma.
1. Did our FOMC MTG affect things long term? Maybe.
2. We broke the recent lows Friday, and this could fail & now plunge, but will it? Maybe , maybe not…
3. It is still possible that a dcl is going to come next week out of this low? Either could now happen, but let me show you a short term bullish view…
.
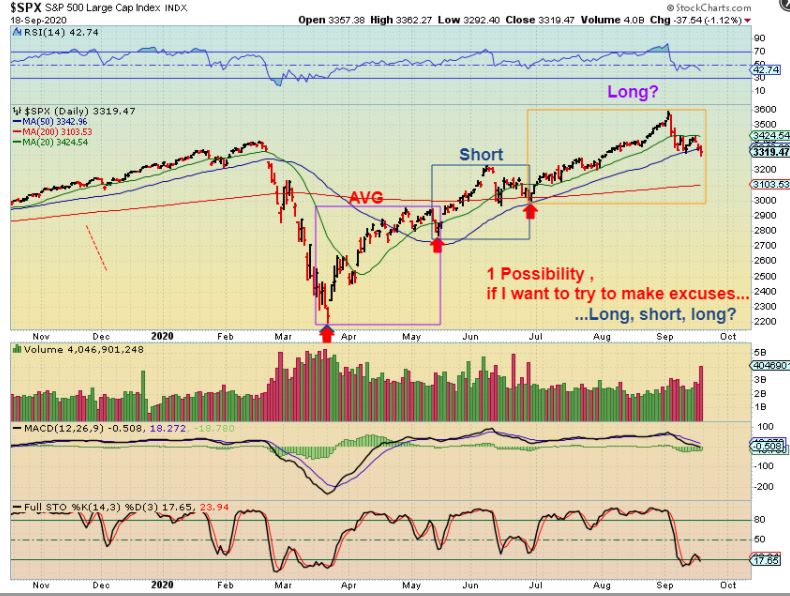
So yes, We could just sell off here if a new bear market takes over, but here is 1 other possibility.
.
SPX DAILY – We could get a dcl next week with this extra long daily cycle, because look how short that last one was. We now have to wait and see, so Stay Frosty, be cautious, and use stops.
.
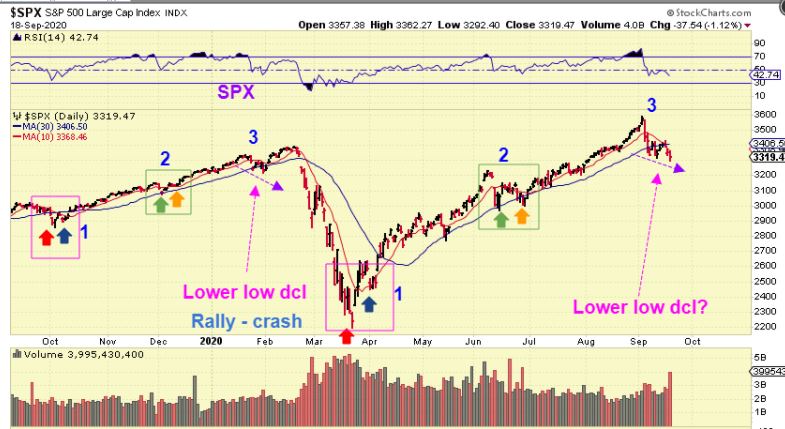
CHECK OUT THIS CHART CAREFULLY – 1 ( we see a higher low) & 2 ( Another Dip & Higher low) & 3 ( Lower Low rally crash). That could play out that way again.
.
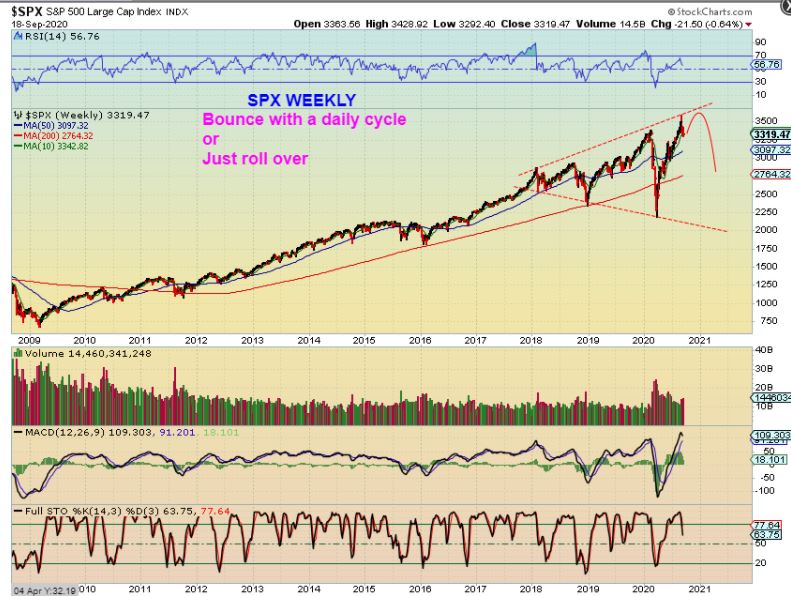
SPX WEEKLY BIG PICTURE – Bounce & roll over or just start to roll over? We need to be prepared for either.
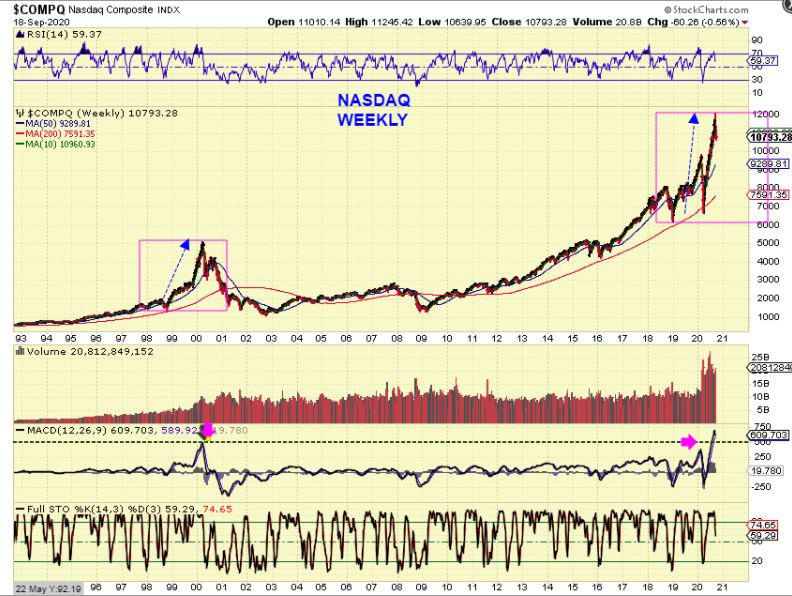
NASDAQ Blow Off Tops – This has been as steep or steeper than the blow off top Tech Bubble. We need to expect it to end in a similar manner too. It is unsustainable and I have been saying that a drop is just matter of time.
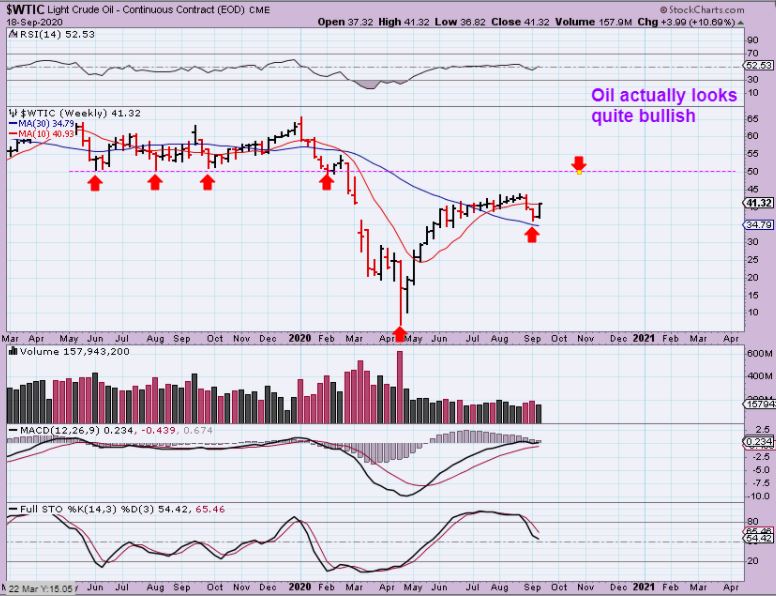
WTIC WEEKLY – Oil actually looks bullish after reversing last week around the 30 week ma. It also slightly regained the 10 week ma. What next? It looks like Oil goes higher, but also…
.
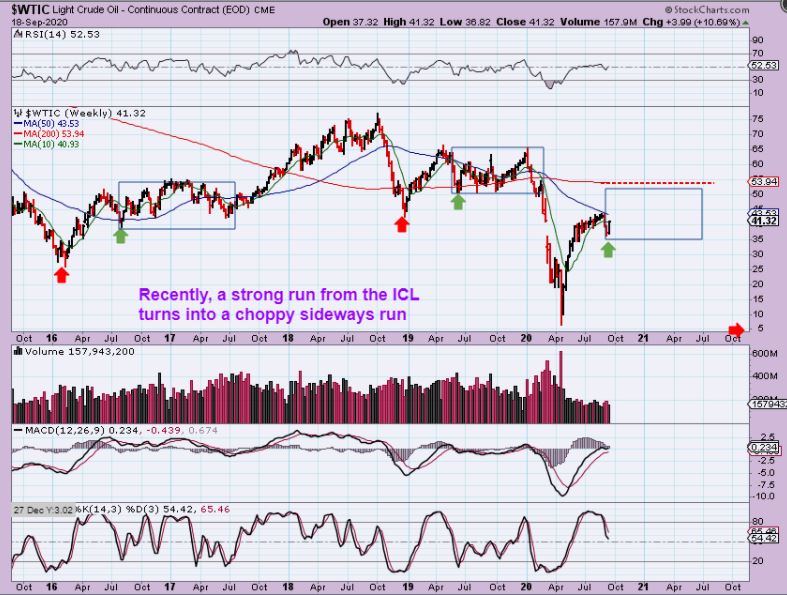
WTIC – In the past, we have seen a strong run out of the ICL (Red arrows), and then things just got choppy ( Green arrow low and into the choppy Boxes), so I would keep that in min. Right now we can say that
1. Oils lows seem to be in for now, but it may become choppy after another decent bounce here.
2. Note: Sorry, but I don’t know how or when that red arrow on the far right jumped over there, it was placed at our last ICL.
.
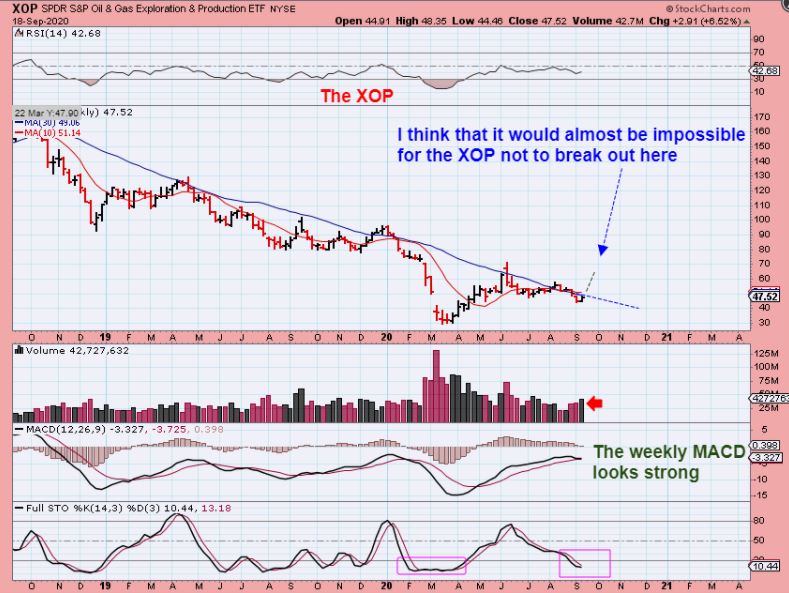
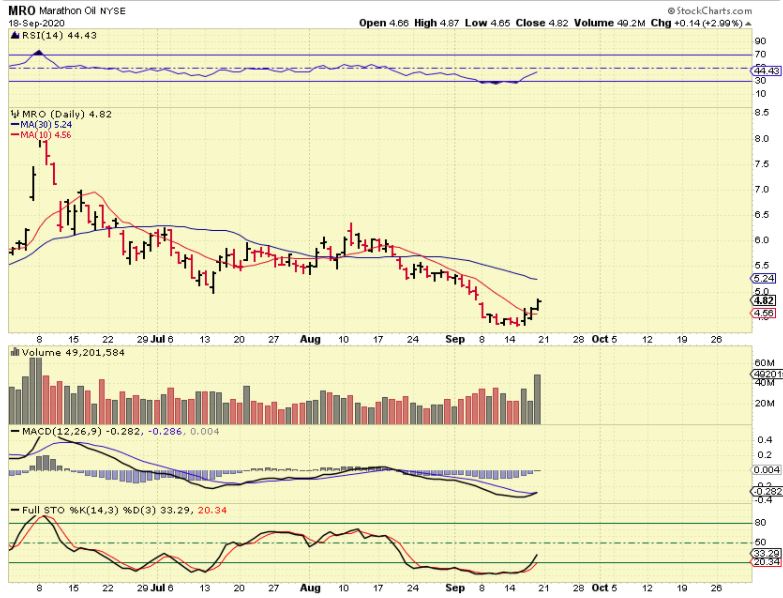
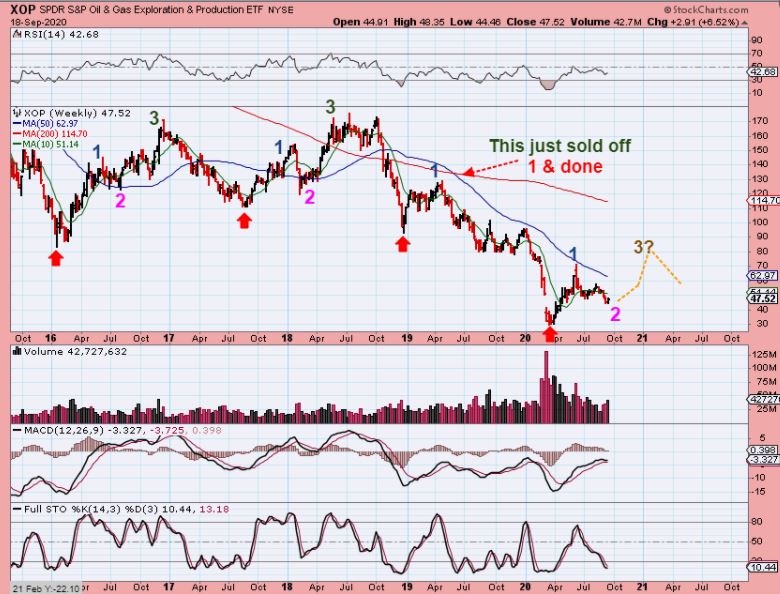
XOP – I find it hard to believe now that the XOP won’t break out since Oil has a low & it is pushing right at the resistance. It should break higher with Oil now, so some Oil / Energy stocks may begin to benefit. I will be going through my watch list ( APA, AROC, OAS, CPE, NOG, MRO, VLO, etc for example ) for set ups.
Of that list, I do think that some ( Like MRO for example) do seem to be moving out of their lows as buyers are stepping in.
.
IMPORTANT NOTE: THESE ARE JUST LABELS 1,2 & 3. I AM NOT DOING E.W. HERE, I AM SIMPLY NUMBERING THE MOVES 1-2 -3 FOR THE READER TO BE ABLE TO FOLLOW WHAT I AM SEEING.
.
XOP – I looked at past XOP set ups coming out of the ICL ( Red Arrow) and we just had the run to ‘1’ and dipped to ‘2’ and then a higher high as ‘3’. It would seem that if we are to repeat what we’ve seen in the past, a run to new highs as ‘3’ is possibly next. That also would make future Oil / Energy trades possible, but read the chart. One of those did fail.
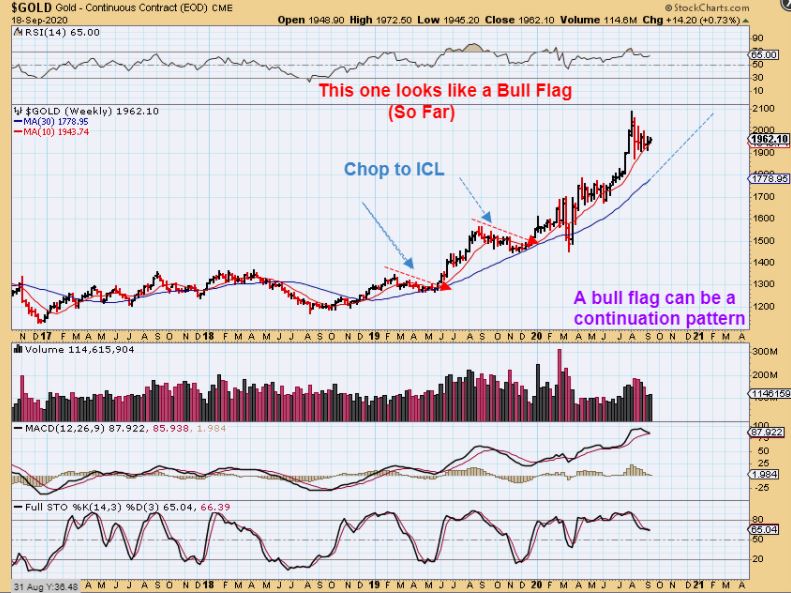
GOLD #1 –
1. We have discussed sideways chop to the ICL in the past, and I am again pointing it out here. We would likely have another daily cycle if this played out.
2, We also discussed ‘stretched’ or ‘extended’ Intermediate Cycles that ran for 9 or so months in a Bull run. So right now we still have a Bull Flag type consolidation. It is a Bull Flag until it isn’t, so…
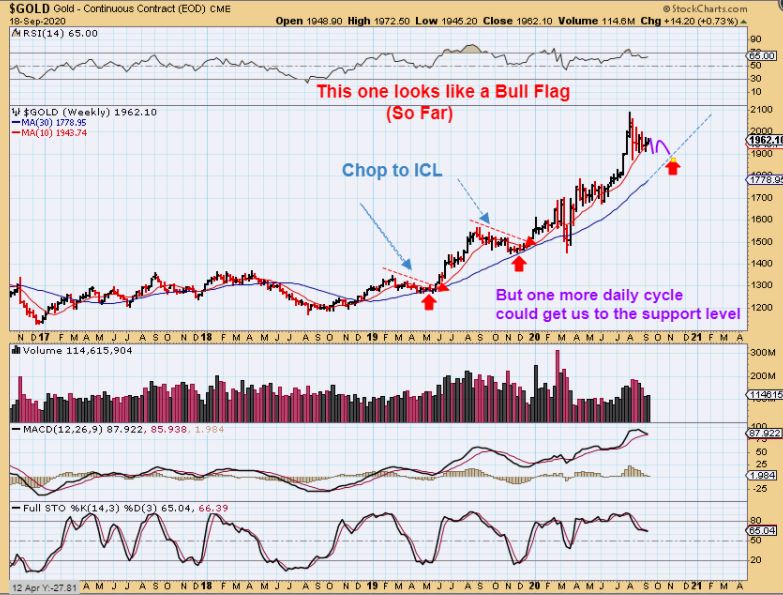
GOLD #2 – This is a Bull Flag that Can break out higher, unless it just continues to chop sideways and gradually lower into an ICL as seen here. Right now the direction is inconclusive.
SILVER is also just a Bull Flag consolidation, and even though this climb looks ‘steep’, as though it could drop…
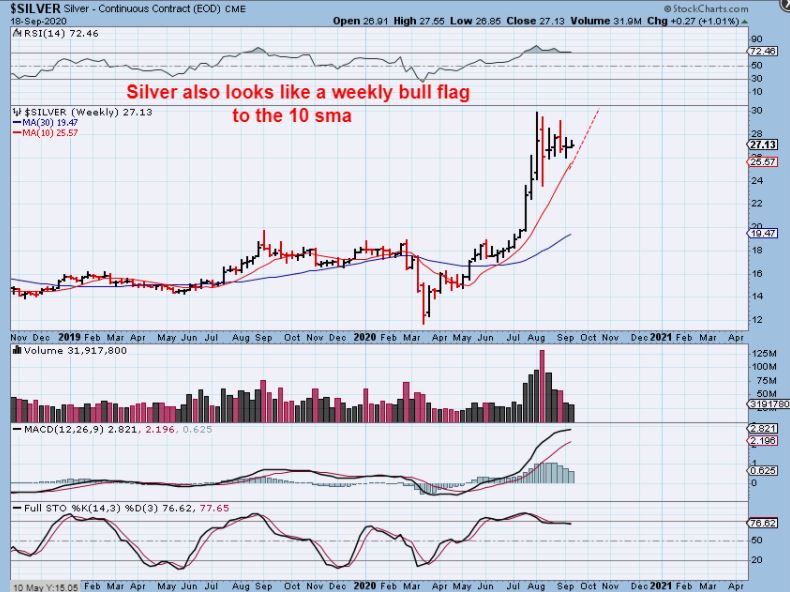
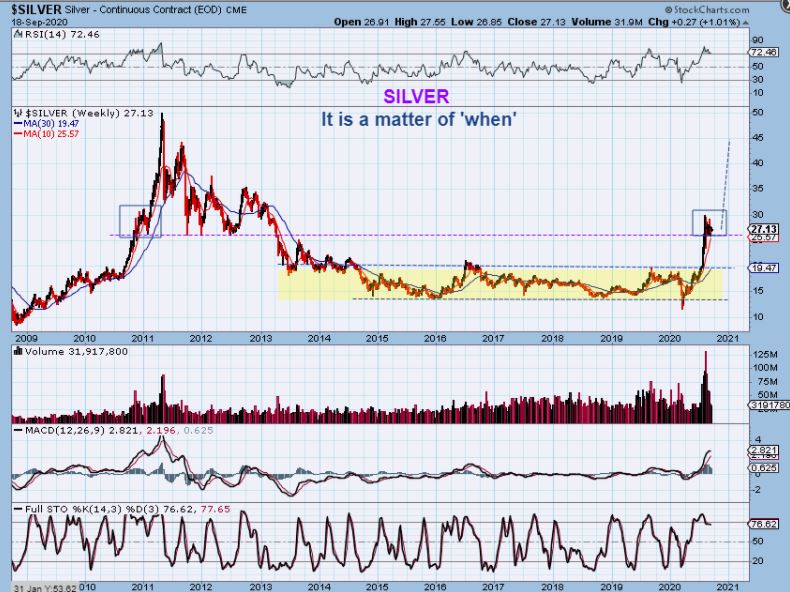
SILVER remains in that $26 area that I have been discussing for weeks / Months ( $27 this week) as a pause. Again we look back to 2011 and when Silver ran from $15 to $50 it just ‘paused’ here between $25 & $30, very similar to what we see now. See the chart for similarities.
.
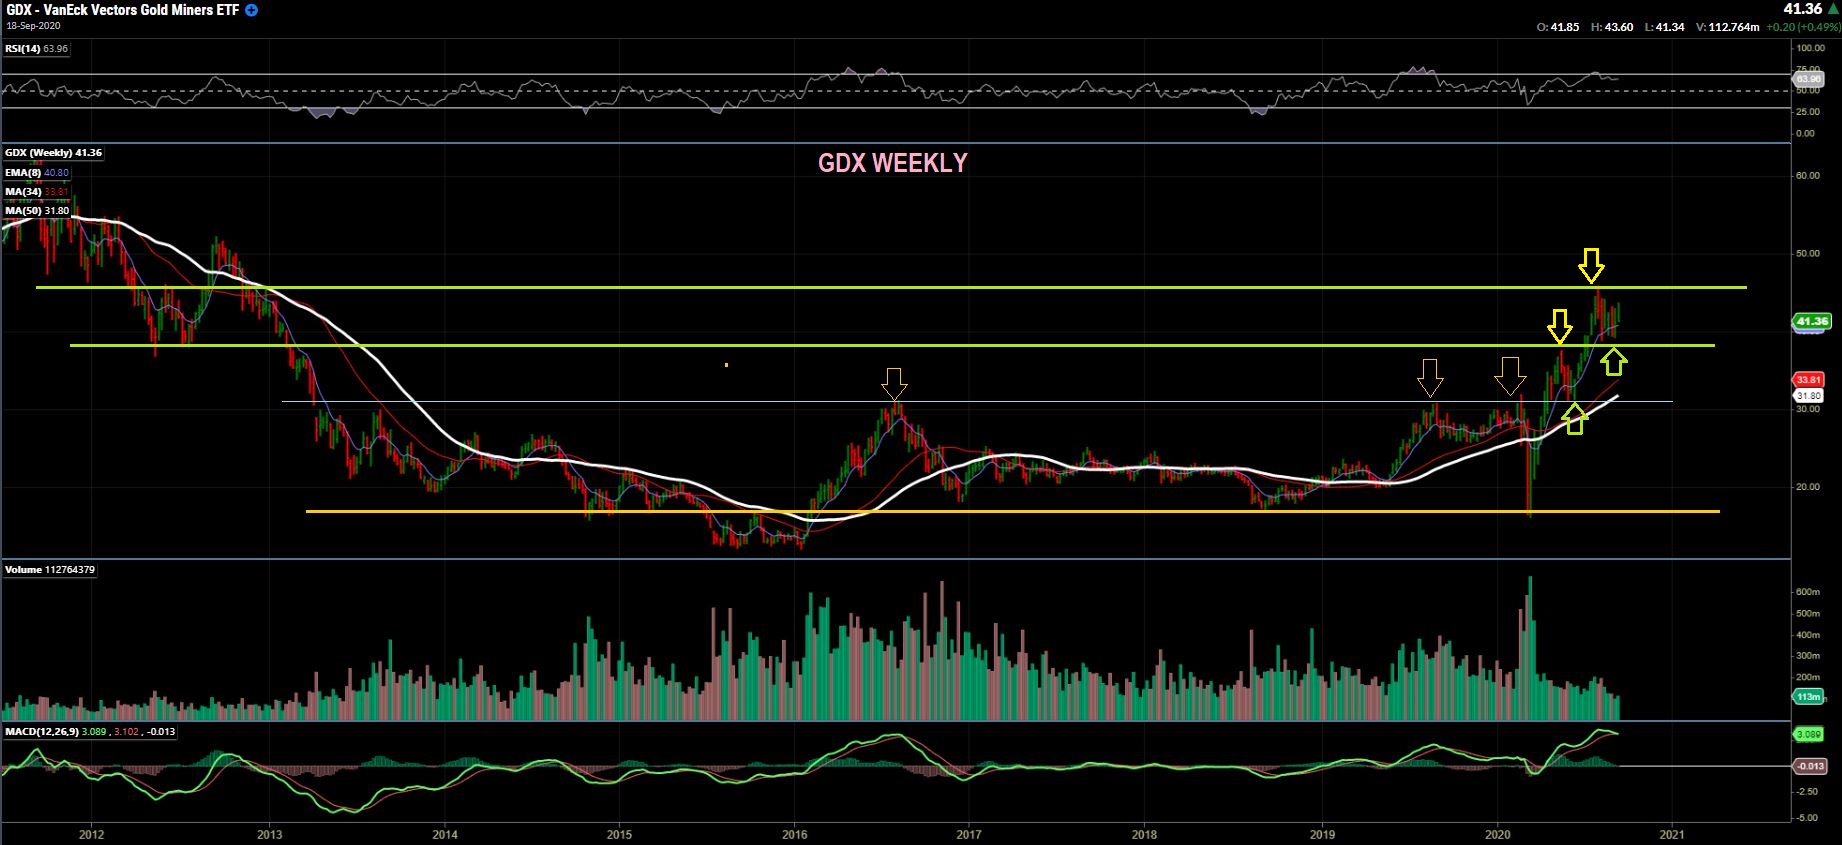
GDX WEEKLY – The GDX ETF has been bullishly consolidating within a parameter that would be expected for a bull run. A deeper drop into an ICL may become less likely if this continues and we should remain alert to the idea that we could get another leg higher in more of an extended run after a consolidation, rather than a deep dip now. A more meaningful pullback into a deeper ICL could then take place after an extended run. It is a very tough call at this point, but …
,
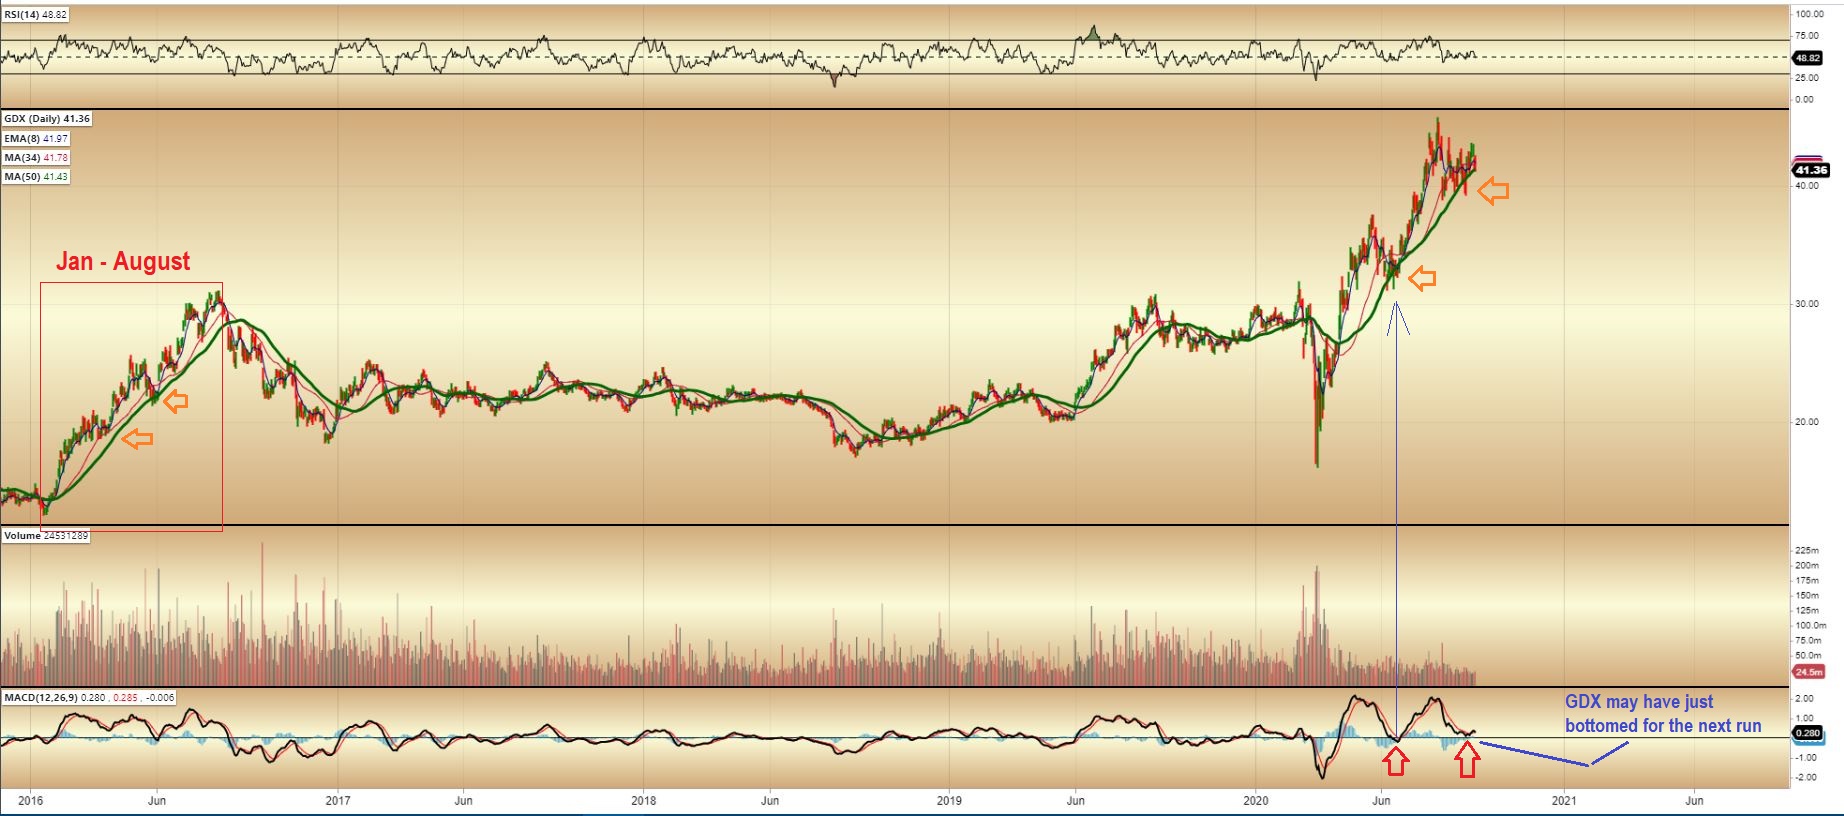
GDX DAILY – In the daily time frame we have churned & consolidated enough to satisfy various reasons why a consolidation happens (Overbought, sentiment, etc) . The 2016 run had a milder drop in May and continued higher for what you would see as a Jan to Aug run. It looks similar to what we see now too, using the Green 50sma as a loose guide.
.
Same chart: Also take note of the lower indicator ( MACD) . That looks like a low has been put in place.
.
The Review:
.
– The General Markets are having trouble getting solid footing within he timing of this dcl. Whether or not that changes remains to be seen, but ever since the ICL in March I have been saying that my expectations were for a final run higher and then the Markets Bull Run could then be done .
.
– Oil seems to have bottomed & a trade may form there with oil & Energy Stocks. I will keep my eyes on the watchlist.
.
– Precious Metals have held up very well. We are in the timing that ICLs usually form ( 6-7 months), but over time they have formed bullish consolidation patterns. That means that right now we are now at a point where they could break down into a DCL (or ICL) or they could even break out higher and extend the bullish run. WE ARE SEEING Some Miners break higher, some are leveling off after a pull back, and we are seeing some break lower too. I have been the variety pointed out in the reports. See droopy charts of GORO, IAG, DRD & HMY vs better charts KGC, LGDTF, AEM, etc.
.
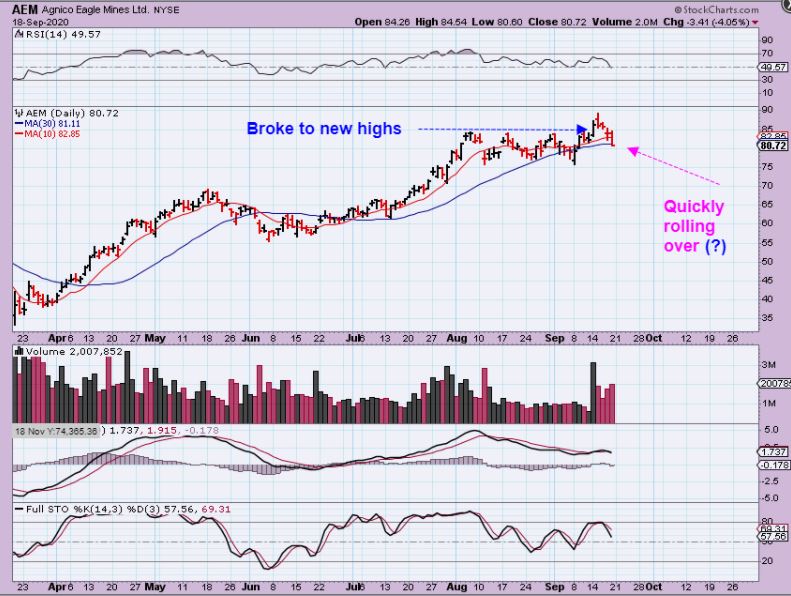
One warning is that when a dcl comes due, and on day 25 we are coming due, even a strong looking break out could get caught in the selling and become a false break out. Let me give you an example:
.
AEM broke to new highs Monday, and may have sucked in new buyers on the break out. Suddenly it rolled over with a weakening MACD now. Caution is still warranted until we see how this dcl plays out, an it is due this week or next really.
.
I will continue to discuss these things in the day to day daily report. Enjoy your weekend!
.
~ALEX
.
I just quickly want to mention again that I am seeing some of our COVID plays that paid off VERY WELL in the earlier months of the year coming to life again. In April, May, June, etc we traded MRNA, NBTX, VXRT, NVAX, INO, IBIO, HTBX, CHFS, BNGO, BIOC, NOVN, and so many more. Many of these gave Awesome Gains—-unless you held on & rode them all the way back down. I have always taught that selling some on the way up is a great way to lock in profits and stay profitable, and use a trailing stop to prevent riding them down. Now this sector has pulled back , died down, and actually looks set up & ready to go again. I put that thought in reports this past week, and now I’d like to just quickly show you a couple of examples that were mentioned in recent reports. This means that normal or controlled pull backs to support areas can become places to add.
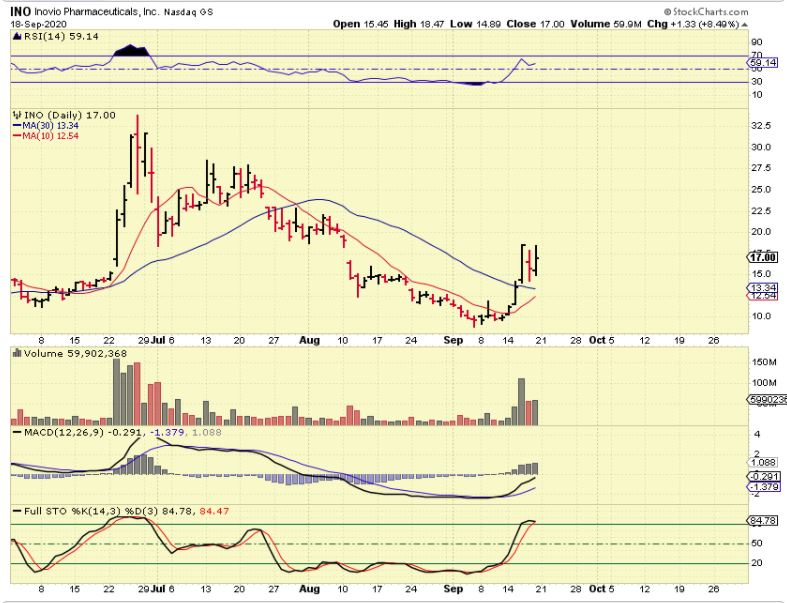
INO was mentioned with a bullish POP off of support. A pull back could be bought, but it also might just take off higher.
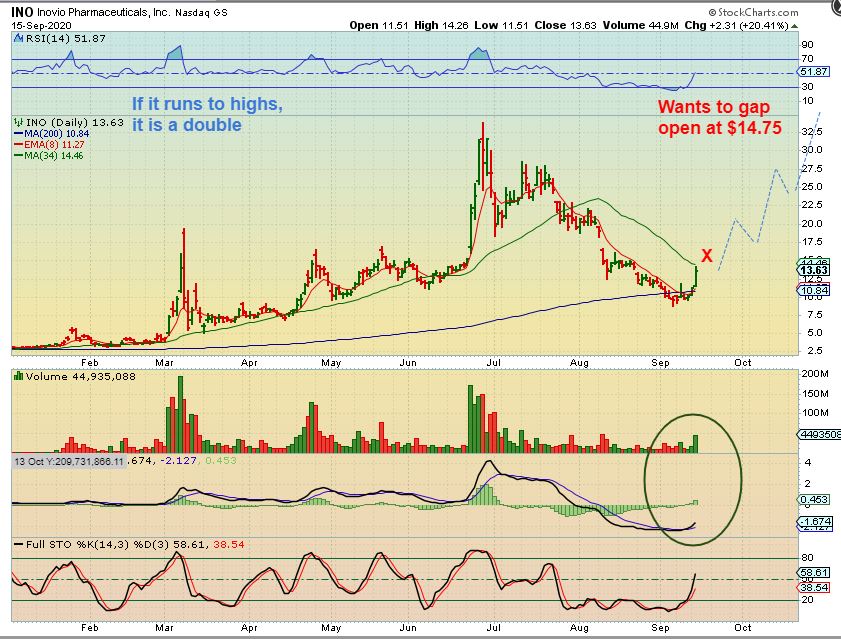
INO – It took off 30% higher the next day, but then pulled back Thursday. Friday it moved 8.5% higher again. These may start to bull flag or just continue to climb higher. So far this tiny move was $9 to almost $20!!
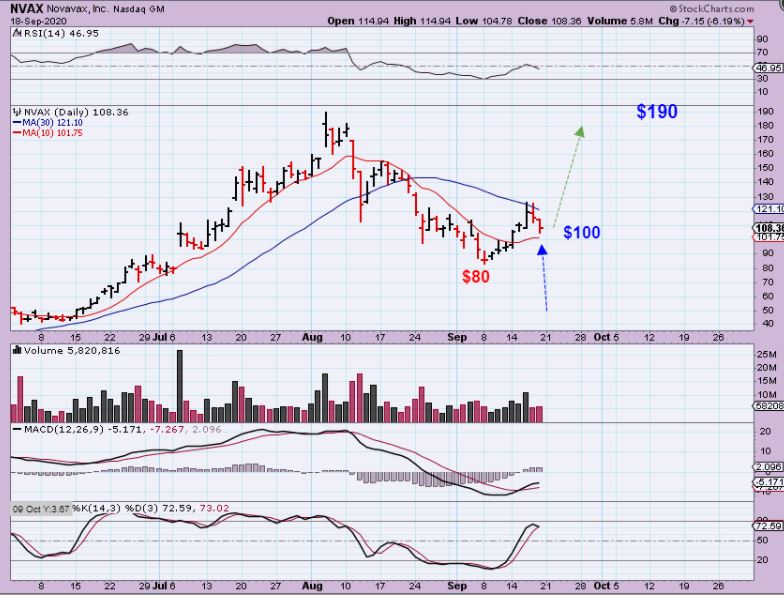
NVAX was pointed out on Sept 14 as a break out at $100. We had made nice gains on just the partial run in the past. I mentioned it again in the next report and now…
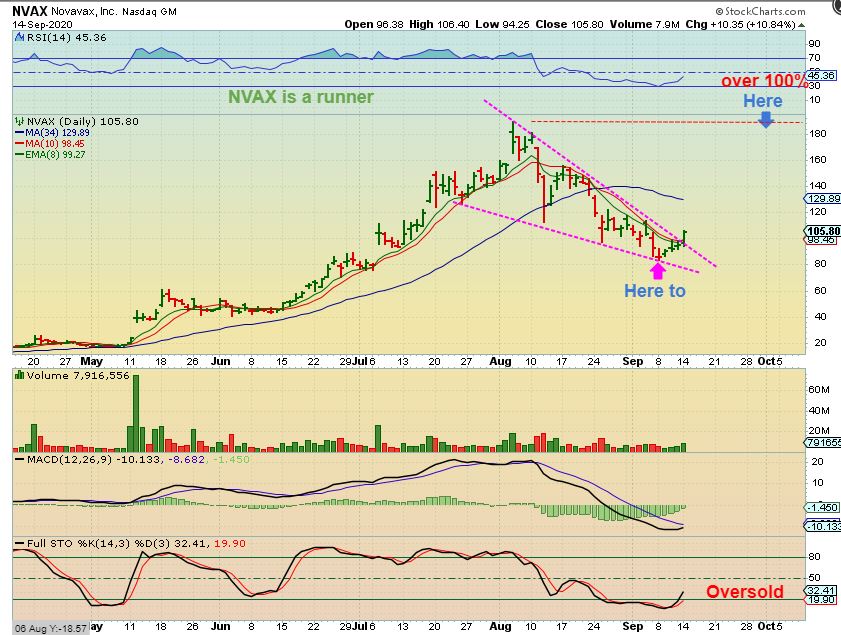
NVAX ran to $130 and has pulled back to $104 Friday. This would be a place that I would add to my position if I bought it earlier . Starting a position here is fine too.
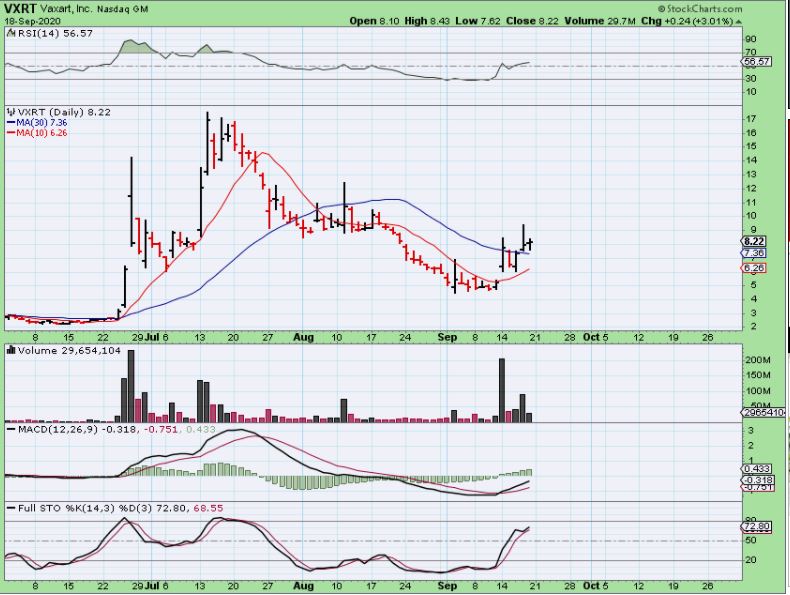
VXRT also Popped 25%, dropped, and popped again. This tiny move was from lows to highs Under $4 and over $9. You can see how big the moves are.
.
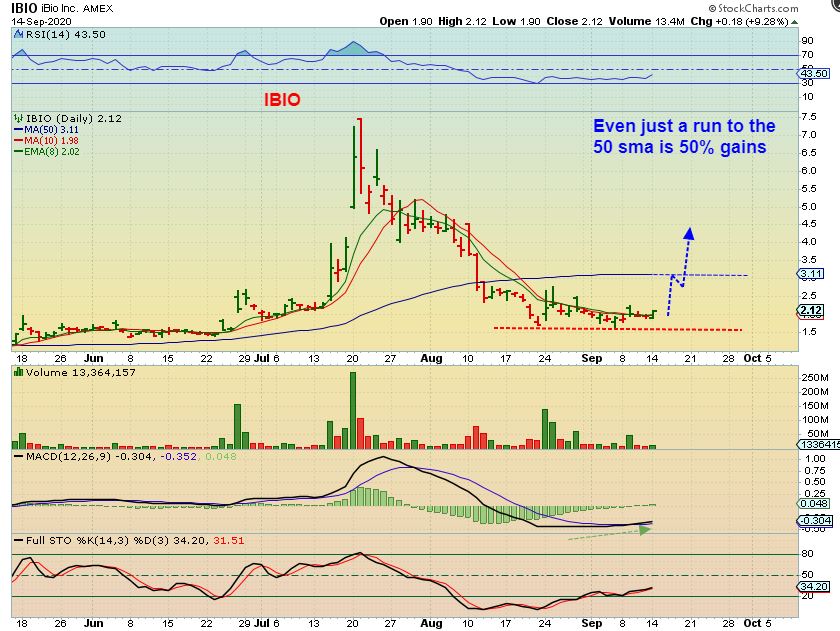
IBIO – Many of us make good money on IBIO in the past. I mentioned that I bought IBIO in this flat base set up, and a small run to the 50sma would still be strong gains. A break out would be excellent gains.
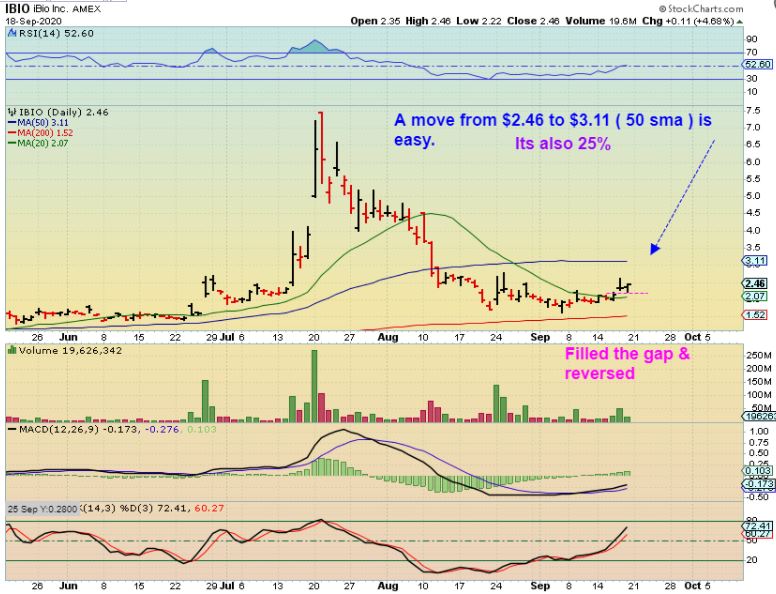
IBIO – It is slowly climbing higher and its still a 25% move to the 50sma. I think that it will do better than that if the company doesn’t release any bad news. Good news could blow it through the 50sma easily and back to recent highs.
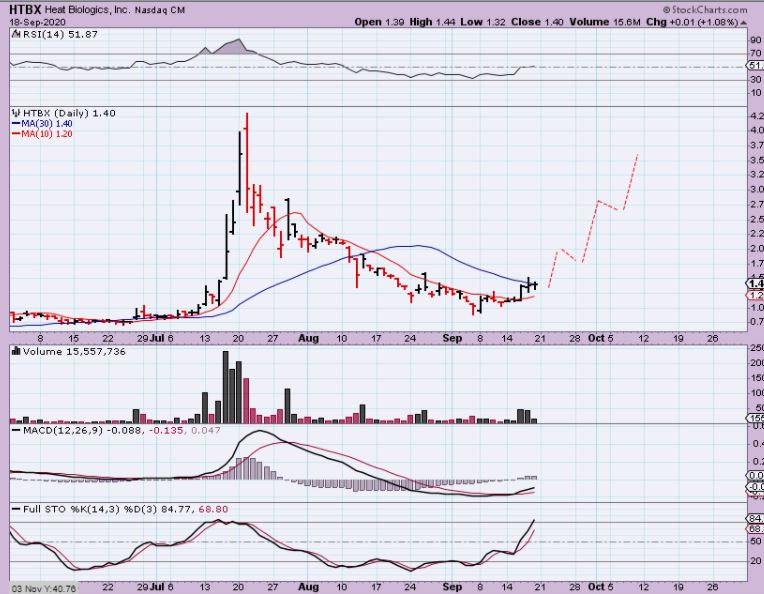
HTBX – Many of us also did very well on this one in July, when it was a buy in a flat base at 70 cents. I sold on the way higher, but it was still 100% gains and 200%, gains and more. I mentioned buying it this week and I added on Friday . The potential is good.
.

