Weekend Report – A Change Of Seasons
This weekend report will show how I think that certain areas are continuing to show signs of a change. Some sectors may just be growing older and other areas may be close to starting a fresh start. THAT will lead to new buying opportunities, and by the end of this report, you will see what I am talking about and looking forward to. Most of what I have been discussing for the past few months does seem to be playing out, with just a few minor exceptions that will be pointed out along the way. A great buying opportunity in the Miners seems to be closing in. Let’s see how last weeks trading has shaped up our projections…
.
.
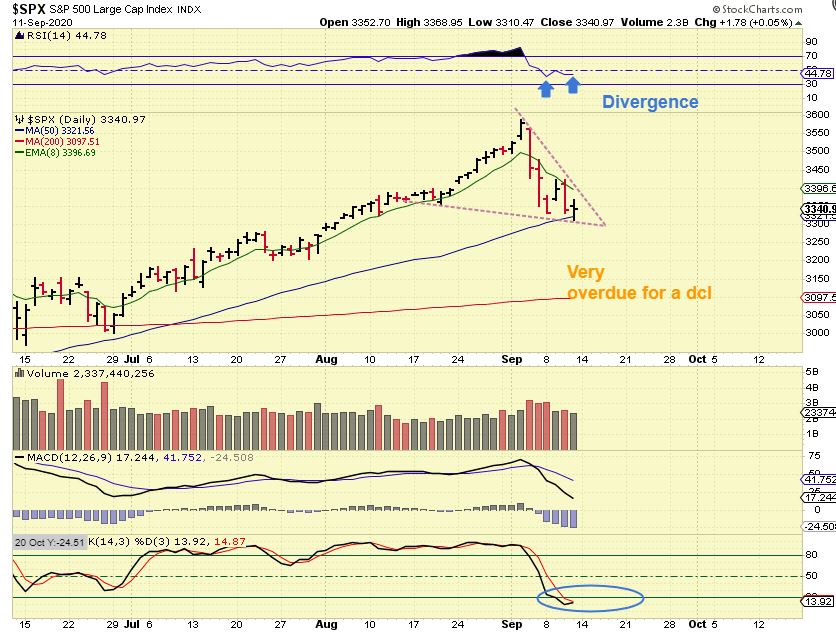
SPX DAILY – No change here really. We are late for a dcl, so we are watching for a confirmed swing low and the drop on Friday reversed to green by the close. I see a little divergence in the RSI at new price lows. A bounce rally next week should be a dcl.
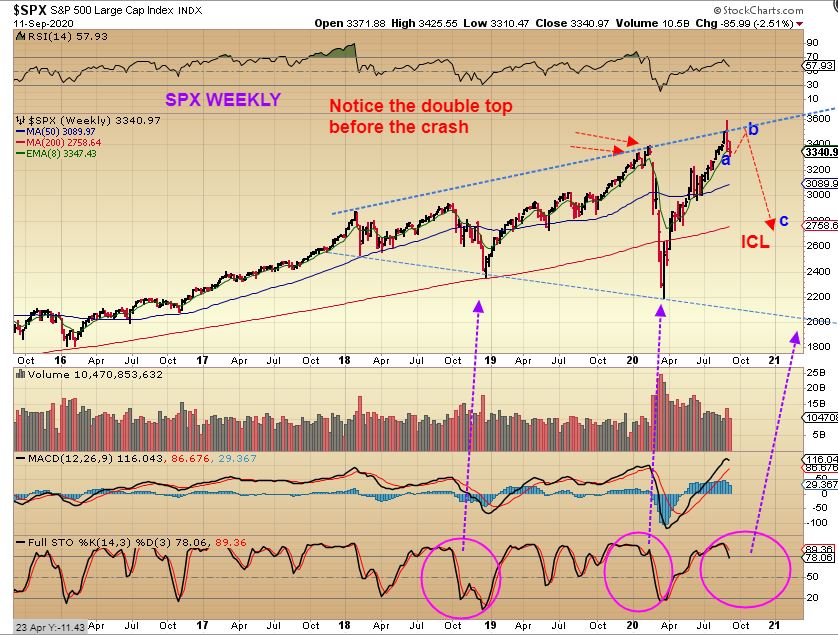
SPX WEEKLY – Look at the 2020 double top before the crash. We could see that if we get to new all time highs. If it doesn’t break to new highs, it may be the a-b-c drop to an ICL that we have discussed & drawn here.
.
I mentioned that with this next DCL, I would look for signs of weakness or maybe a change in character. In my opinion, we are already seeing a change in character. Notice that in the next charts…
.
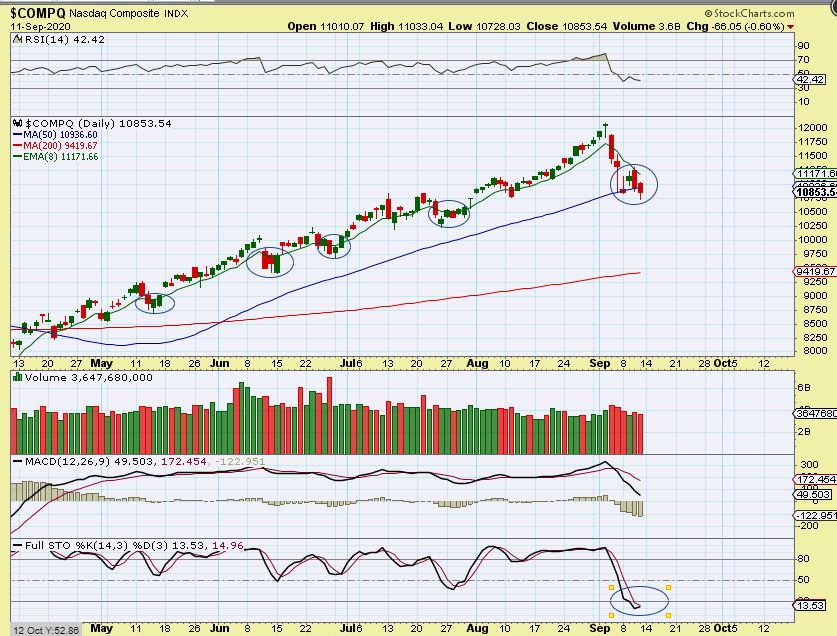
NASDAQ DAILY – The Friday drop made a new low and then it tried to recover. Past lows took 3 or 4 days to stabilize too (circled).
– Next look at the RSI. Closing below 50% is a change in character from past dips.
– Look how deep the stochastics plunged.
– I see a large MACD cross. I see a change in character & this looks weaker.
NASDAQ WEEKLY – We have closed below the 8 week ema. WILL WE BOUNCE? Or might this dcl provide a week choppy sideways bounce & just roll over? We’ll need to watch how this plays out closely. So…
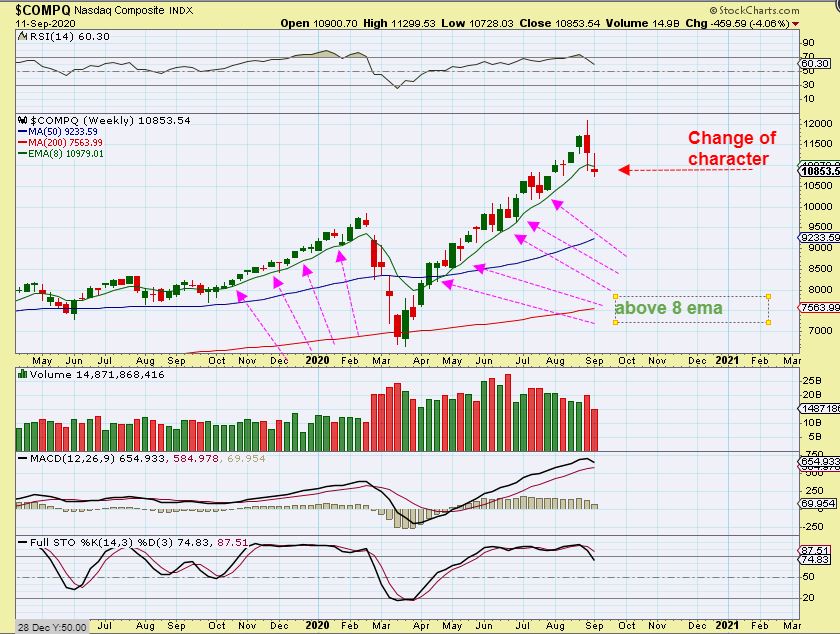
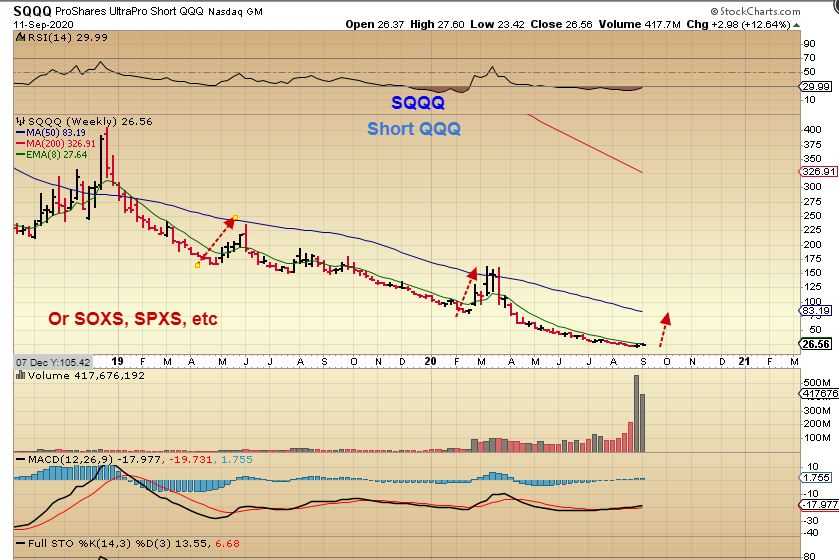
SQQQ Short The QQQ – After a possible bounce / rally here, The next good trade for the General Markets might be shorting the General Markets. Those that like to use ETFs or Ultrapro baskets can use SQQQ, SOXS, SPXS, etc and the gains could be quite big. The timing for this might be during the next daily cycle.
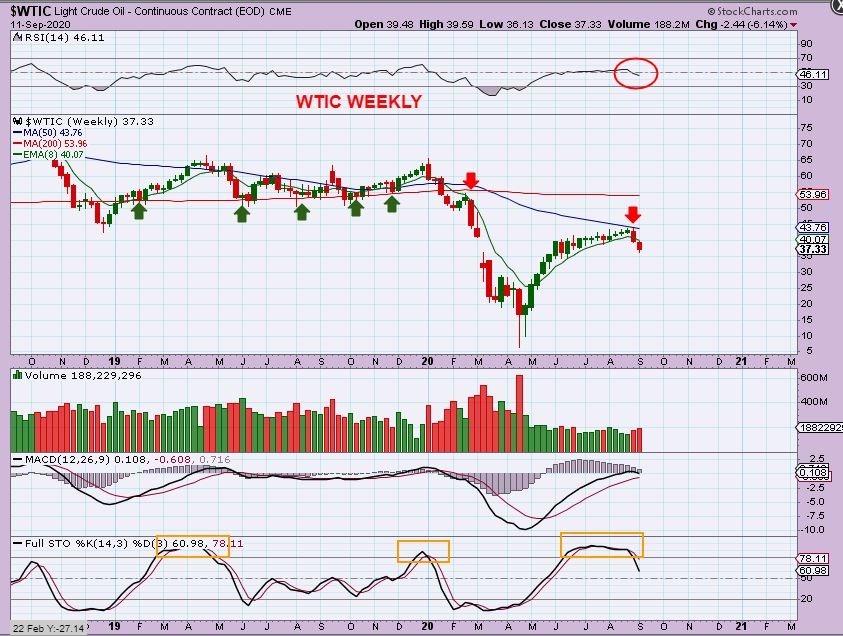
WTIC WEEKLY – Oil prices have dropped and the weekly was basically rejected at the 50 week ma. This did not play out as I expected, since I thought Oil would break above the 50 & run up to back test that red 200ma. The XOP started to falter even before Oils price broke down, so we left our thoughts of a good long energy trade behind weeks ago. Oil may be ready to seek out an ICL with the General Markets.
.
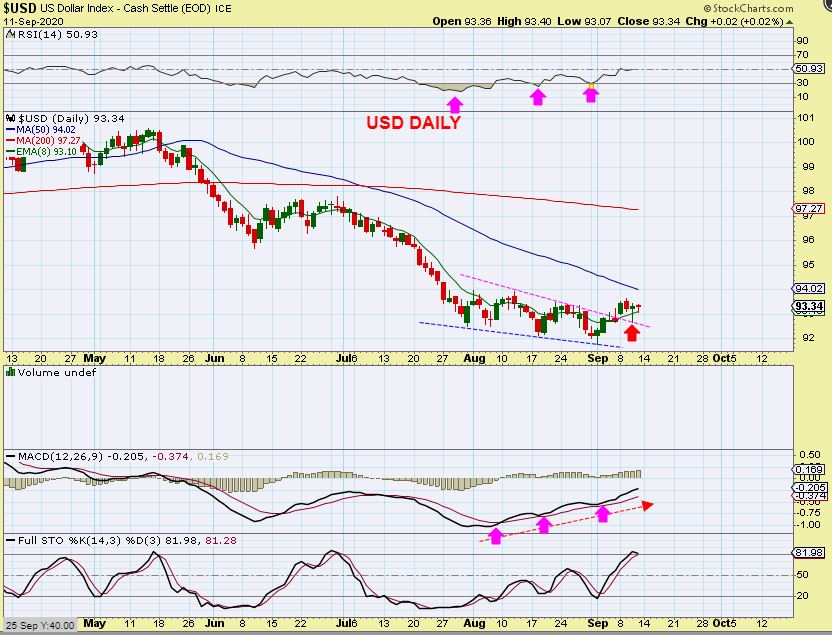
The USD DAILY: This showed strong signs of divergence as it dropped to new lows, so I called for the USD to bottom ( Dcl possible ICL) and rally with Gold likely topping & dropping. SO FAR, this is a small bounce and Gold has topped but it has also had a minor pull back.
.
IF the USD rallies, I would have had to expect Gold to dip. Right now however, Gold is a pennant, a bullish looking chart set up. Maybe Gold can resist heavy selling pressure, we just don’t know, so let’s look at what we have to far with the precious metals…
.
GOLD WEEKLY – Here I am pointing out ( 2019) 2 normal dips into an ICL in a Gold bull market. We are due for a dip like that, but so far Gold has formed a bull pennant.
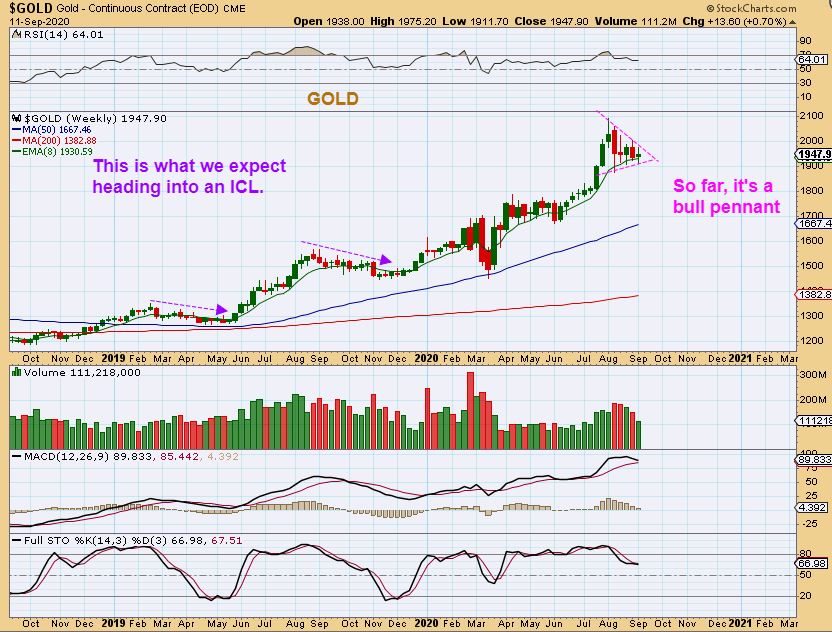
Now that some time has passed Gold is at the apex and should be ready to break either one way or the other, so we can see what happens next week.
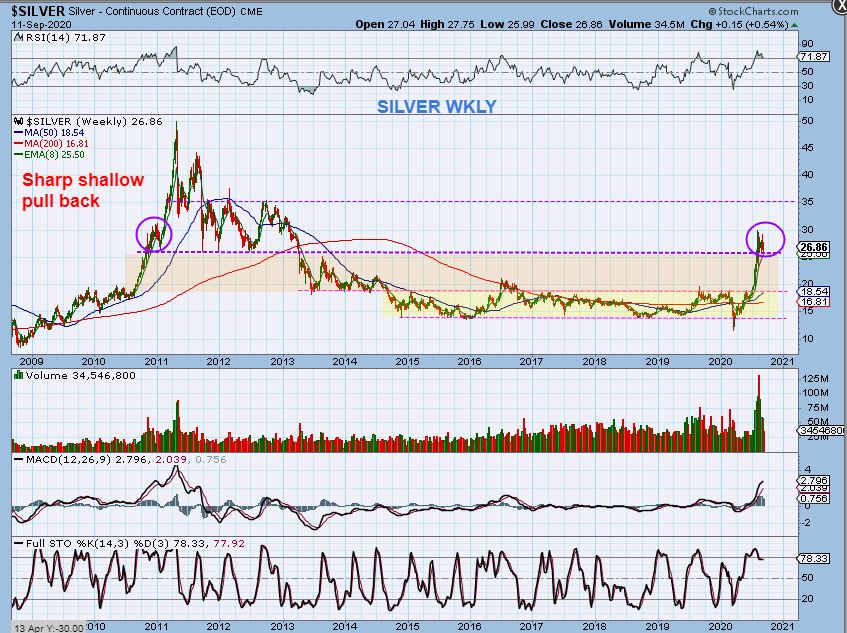
SILVER WEEKLY – The big picture for Silver has not changed at all. Week after week we end up in that $26 area 🙂 Look how much this is starting to look like the 2010 – 2011 run. If this were to repeat, Silver could run to $50 after finishing up this consolidation. This chop can last 1,2,or even 3 weeks more (ICL), we just can’t tell. THE USD may affect that.
.
GDX WEEKLY – I do see that GDX could drop further, since it has a support level down at the $38 area, but from $41? That isn’t a very big drop either, so it may just chop lower. What do I think about these current set ups, now that they have had time to play out for a few weeks? …
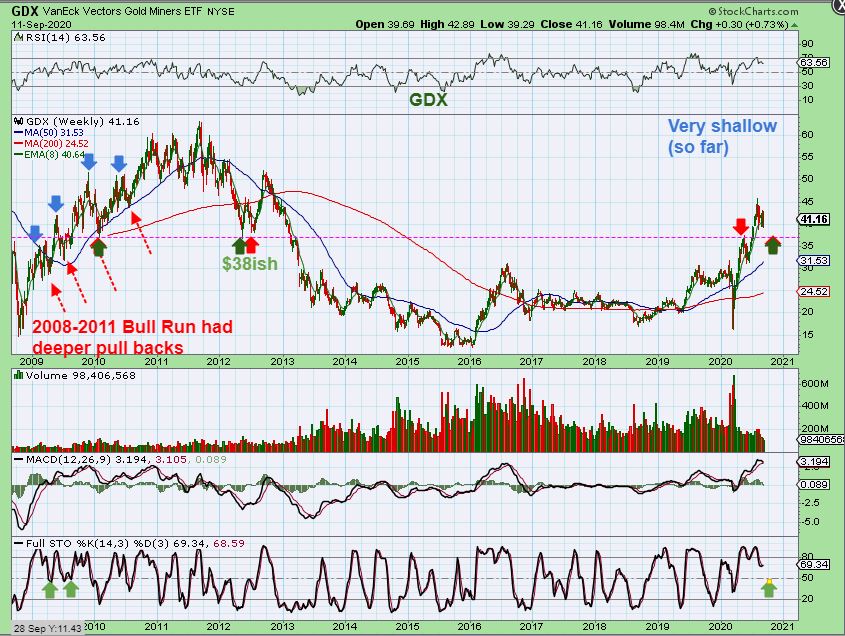
What do I think about the current set ups, now that they have had time to play out for a few weeks? Well, we didn’t get a deeper or prolonged drop into an ICL in precious metals yet, but we have chopped sideways. Is that drop still ahead? It just may be that we chop sideways & gradually down for another week or two, since we are only on day 22 for Precious metals, but they held up fairly well so far. That leads me to now wonder if we see this next…
.
– The General Markets could be finally starting to show signs of weakening, and this next bounce could be a final weaker move higher.
.
– The USD also looks ready to bounce higher, that may affect the Precious Metals
.
– It just may be that we consolidate / chop sideways and even down a bit lower like we have been doing in The Precious Metals. Then when or if the General Markets top & drop, the Precious Metals could become a safe haven for traders this time, and take off higher out of a more Shallow ICL.
,
– This bounce in the general markets could last 2-3 weeks, and since Gold & Miners are at 22 days, they can chop & drop for 2-3 weeks.
,
– ICL’s come on average around every 6 or 7 months, and we are now 6 months forward from the March ICL. When that next ICL is in place, the Miners could become the best trade in town again. They make very fast gains when they run and we could expect another 3-4 months of upside out of the next ICL. We saw that in March to July/August. We are now starting to get closer to the next run, so are you ready to make a small boat load of money in Miners? I will discuss a few Silver stocks in this current scenario below.
.
I still think that we have a little more time left, but that choppy wait since the late July early August ‘peak’ may be nearing the end. I can’t wait to see how these markets continue to play out over time. We just continue to evaluate & take things step by step, and we will be ready for that change when it comes !
.
Enjoy your weekend! 😁
.
~ALEX
.
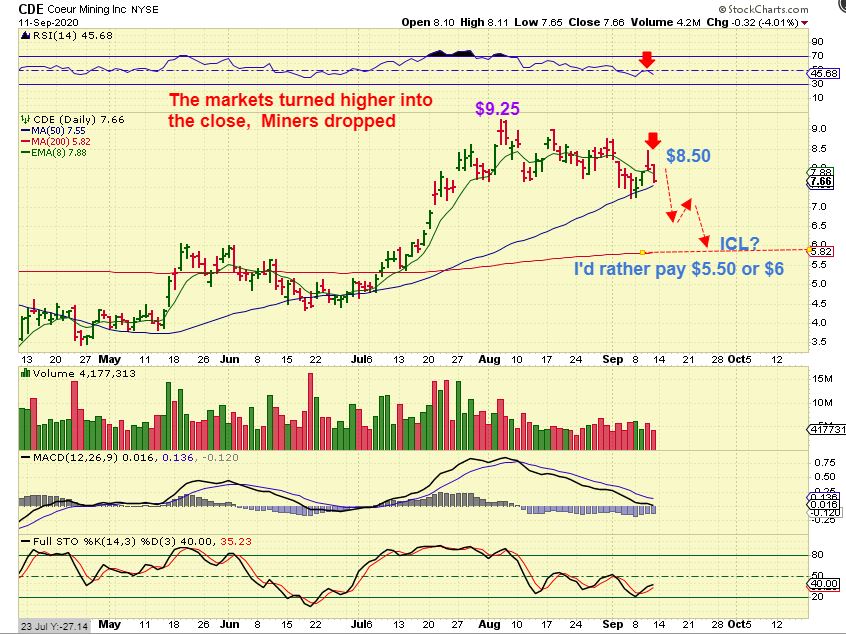
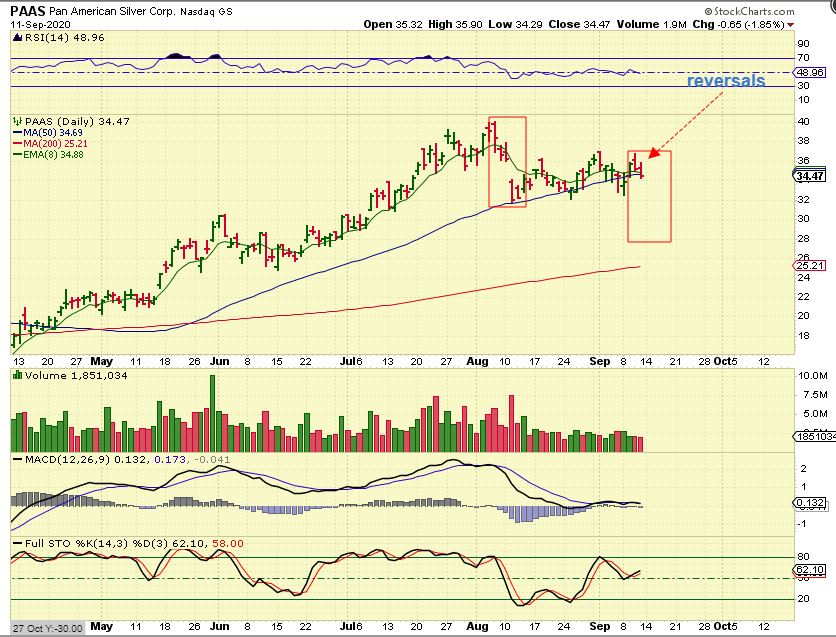
Just a quick thought: We saw the markets drop & reverse higher into the close Friday. Miners did the opposite, reversing lower into the close. So if we see the Markets dcl in place, and the Miners Dcl is due in 2 weeks ( 10 trading days), we could see that bounce in the markets and drop to a dcl for Miners. Let’s just quickly review 3 silver charts.
.
CDE popped & dropped Thursday and then did drop another 4% when the Markets reversed higher. That was $8.50 Thursday, $7.65 now, and we could get a sale price of $6. A drop from the peak $9.25 to say $6 dcl? THAT is a nice sale price.
PAAS reversed and slightly pierced the 50sma. In 2 weeks it could gently sell down toward the 200sma. It peaked at $40 in early August, it is now $34 and could drop under $30.
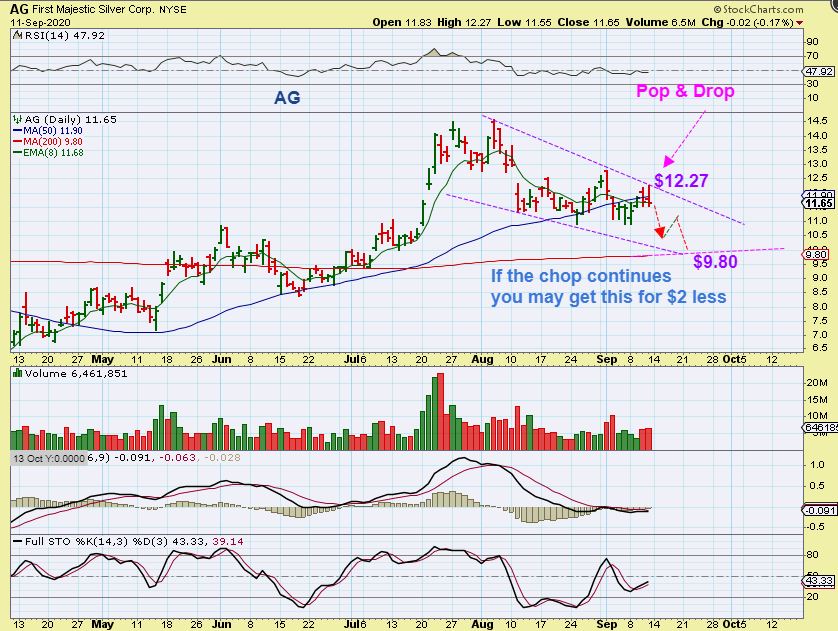
AG – This one peaked at $14.50 twice (July & Aug) and is now $11.65 after a Pop & Drop Friday. Ag looks like it could even drop back to the 200sma at $9.80. It may or it may not, but if so then selling in late July / early August at $14.50 & re-entering at the ICL price of $9.80 would have saved good money – even with a milder ICL.
.
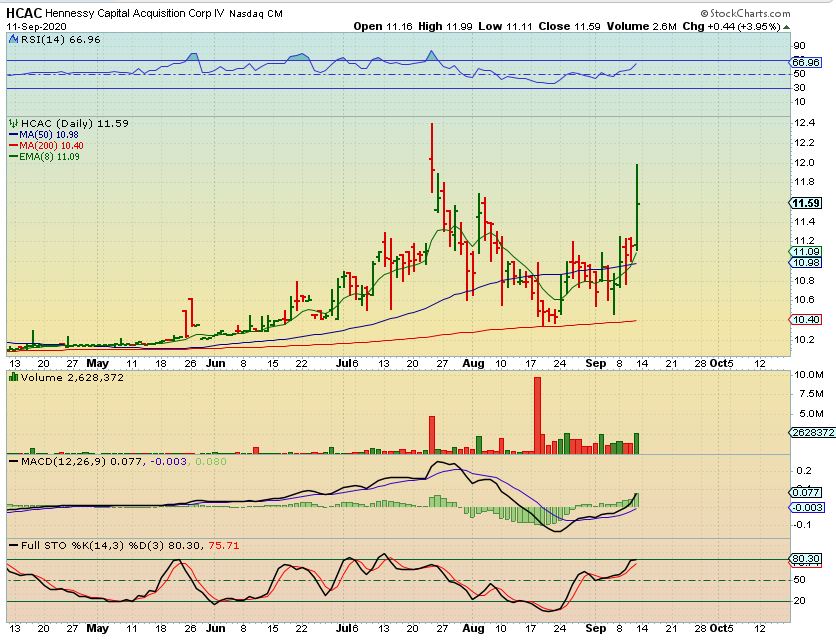
Meanwhile, these long trades in recent reports that I took, Like LCA, HCAC, GRAF, SPAQ, WKHS, etc are still working out nicely, despite the market drop & choppiness. So here is how I am viewing long trades like this…
.
HCAC – This was a nice pop Friday , even with the markets dropping. The SPAC sector is hot.
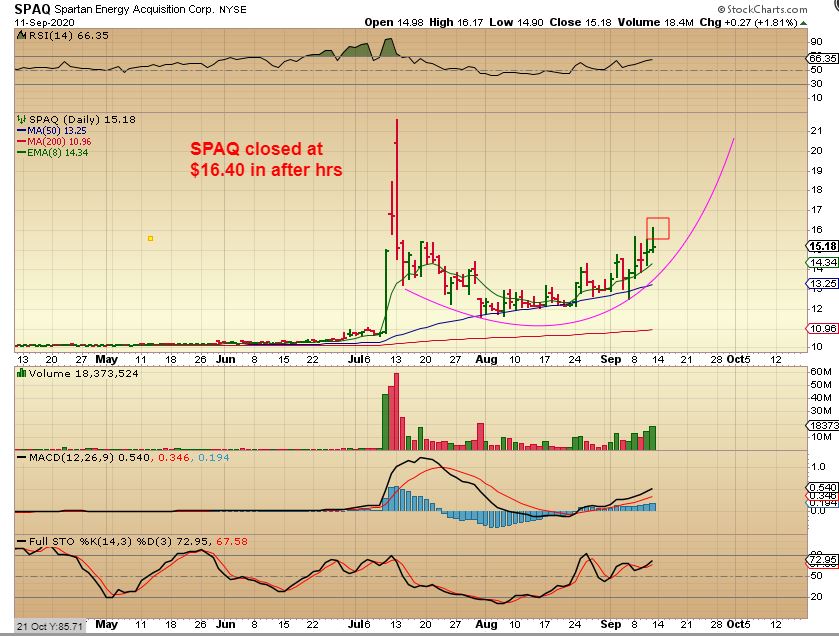
SPAQ– This trade was purchased in the base in the $12 area as it chopped sideways, looking for it to return to $21. It started to push higher so I posted this chart August 25. It popped from $12 to $14 in 2 days. It has been a bit hard to ride with wide swings after this push, but it is working out as expected …
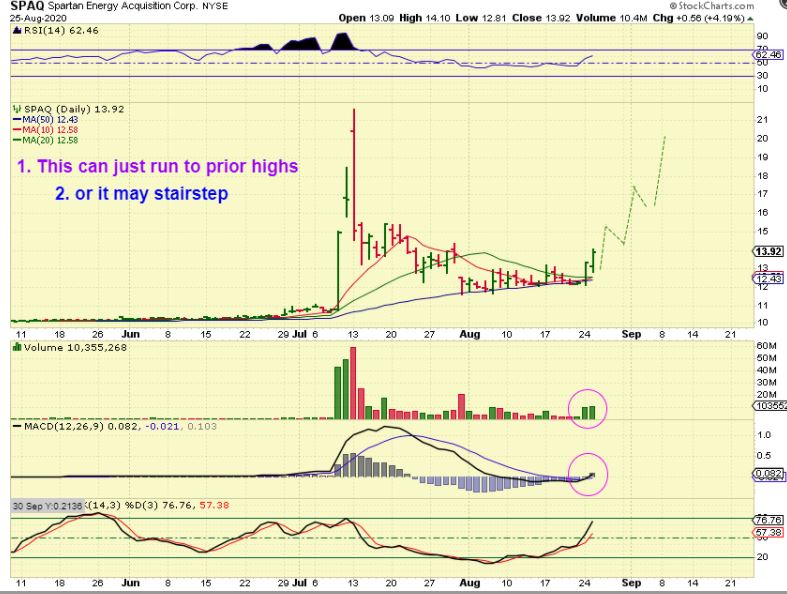
…and now has a series of higher lows. It closed over $16 in after hrs Friday. There should still be time to run to $21.
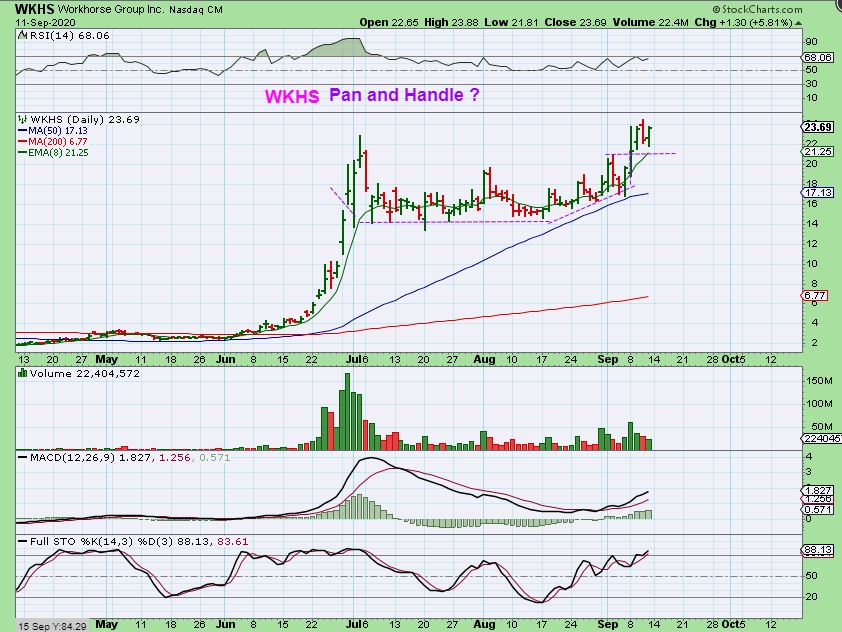
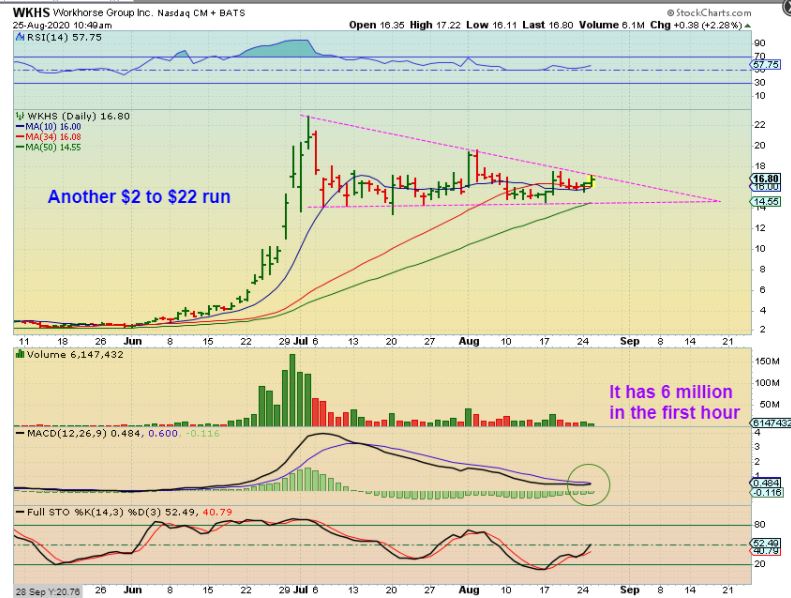
WKHS – was a buy at the $14 – $15 consolidation area. It looked ready to break out here at the $16 area. This was an intraday chart and it already ran from $16.11 that morning to $17.22 and had pulled back a bit as another good place to buy or add..
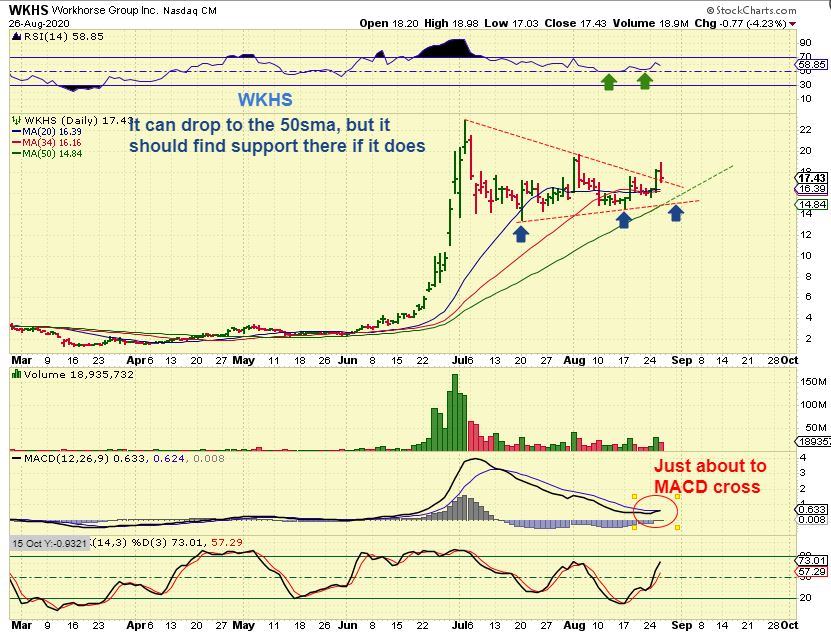
WKHS – We got the pop ( break out ) and a back test, now at $17.40. The MACD turned bullish.
WKHS as of Friday. It hit $24 this week and has formed something similar to the cup & handle, I just call it a ‘Pan and handle’ with a long flat base. This may now just stairstep higher along the 8 ema or 10sma.