September 5th Weekend Report
The US has a long weekend, so the US markets will be closed Monday. We had a very active week last week, so let’s take a look at the weekly charts and the big Picture and see where things stand.
.
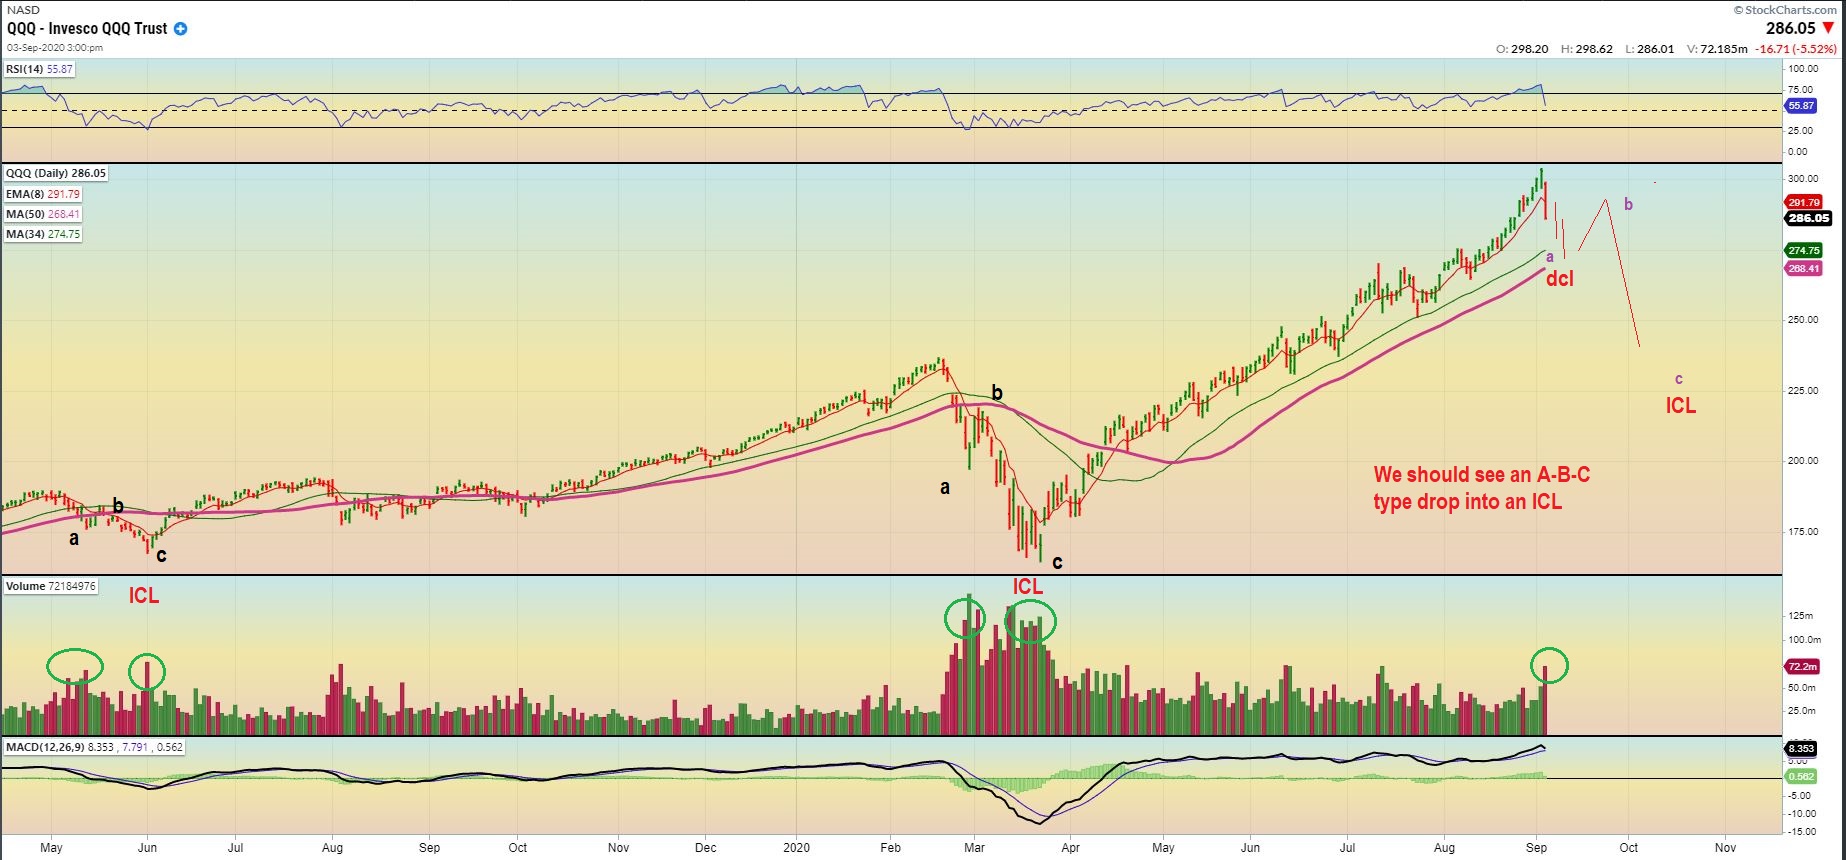
NASDAQ DAILY – We were VERY late in the daily cycle, so I was expecting a drop any day, I even mentioned Stay Frosty several times in a recent report for just that reason. Then after Thursdays crash down, I said in the Thursday Night report that I expect this to put in a dcl quickly and probably bounce…
.
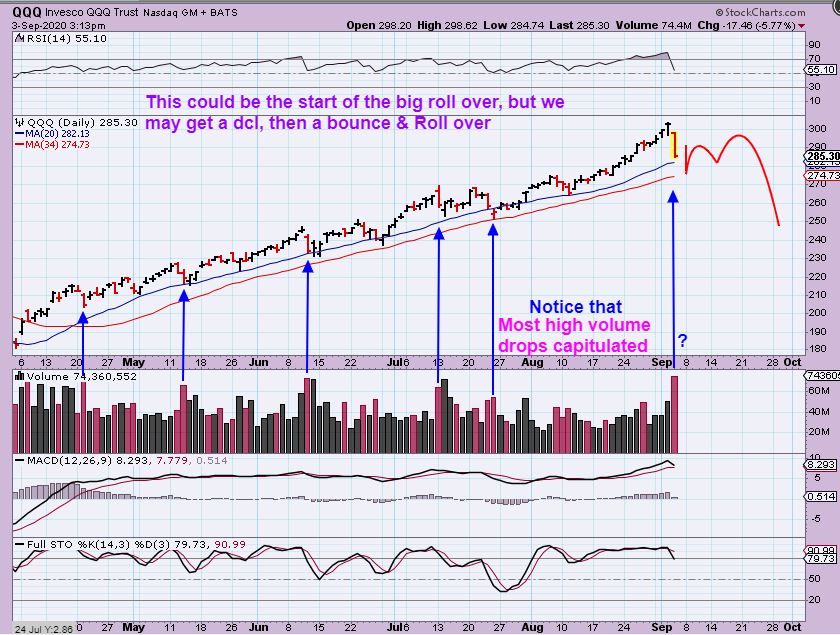
Thursday nights report said: So I see Large Volume 1 day drops here, and then the dip was done. Buyers stepped in and day 2 became a reversal. Will that happen Friday? We’ll see. So with this, we could still get a dcl here, a weak run higher that rolls over into the ICL.
I also pointed out my doubts about this drop continuing because of Airlines & cruise stocks-they were Green Thursday and again Friday with the sell off.
.
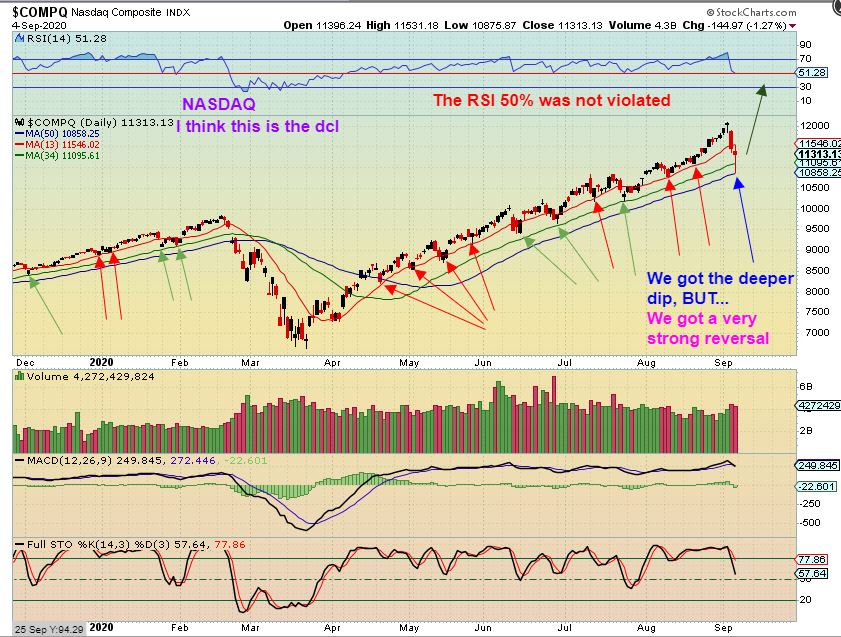
The second day of selling did see a reversal as I expected, but this sell off also DID go deeper than prior ones. Notice that we hit the 50sma. So at this point, I think we got a Daily Cycle Low Friday, and we’ll see next week if a swing low forms next week. Then we look for strength or weakness daily.

NASDAQ DAILY – I took note that the RSI 50% was not violated, so the next run can actually break to new highs and continue bullishly. I have to now wonder: Will this continue to go parabolic, maybe straight up after a quick shake out here, to trap some bears and shake out weak hands? Or are we topping very soon as a L.T. Daily cycle? Well…
AS A REMINDER: I DREW THIS EXPECTATION AS A BEARISH ROLL OVER INTO AN ICL SOON, but this will not be an a-b-c down if we make new highs and that reversal was pretty strong Friday. Just as a reminder, I drew this as my idea of a possible a-b-c down with the next DCL, A Weaker Bounce, then Roll Over. A NEW HIGH NEGATES a-b-c down.
.
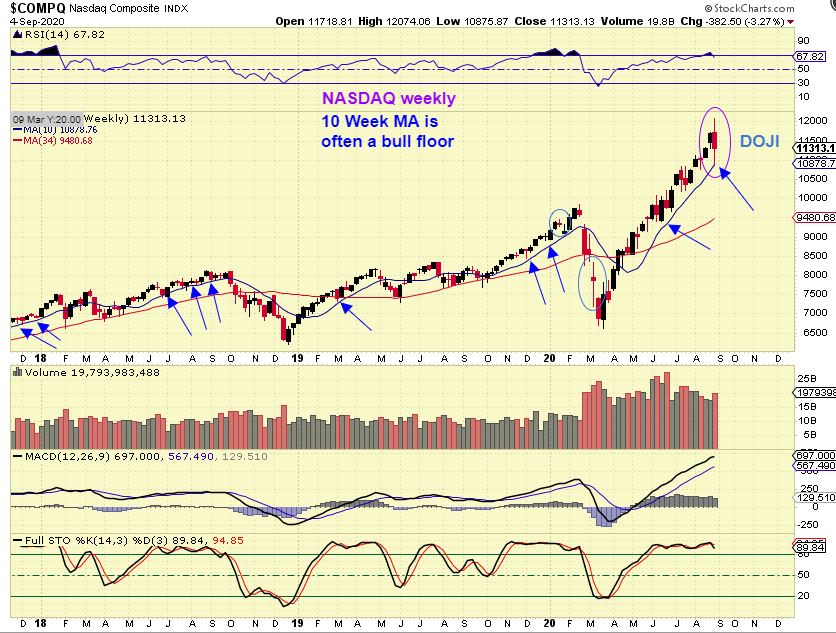
NASDAQ WEEKLY – We actually have a DOJI at the highs here on the weekly. That is a big Caution for Bulls, since Dojis reflect indecision in the direction, but they also have proven to be continuations patterns.
So is this just a pause or a Top? It is not clear at this point, but it is still tradeable going forward, since a swing low and a dcl could form next week. We’ll also need to look at other things. This really gets tough because a bounce off of the 10 week MA is also normal Bull Action, and we did that. We do not yet have a CLEAR BEARISH signal.
AND THEN I SAW THIS:
.
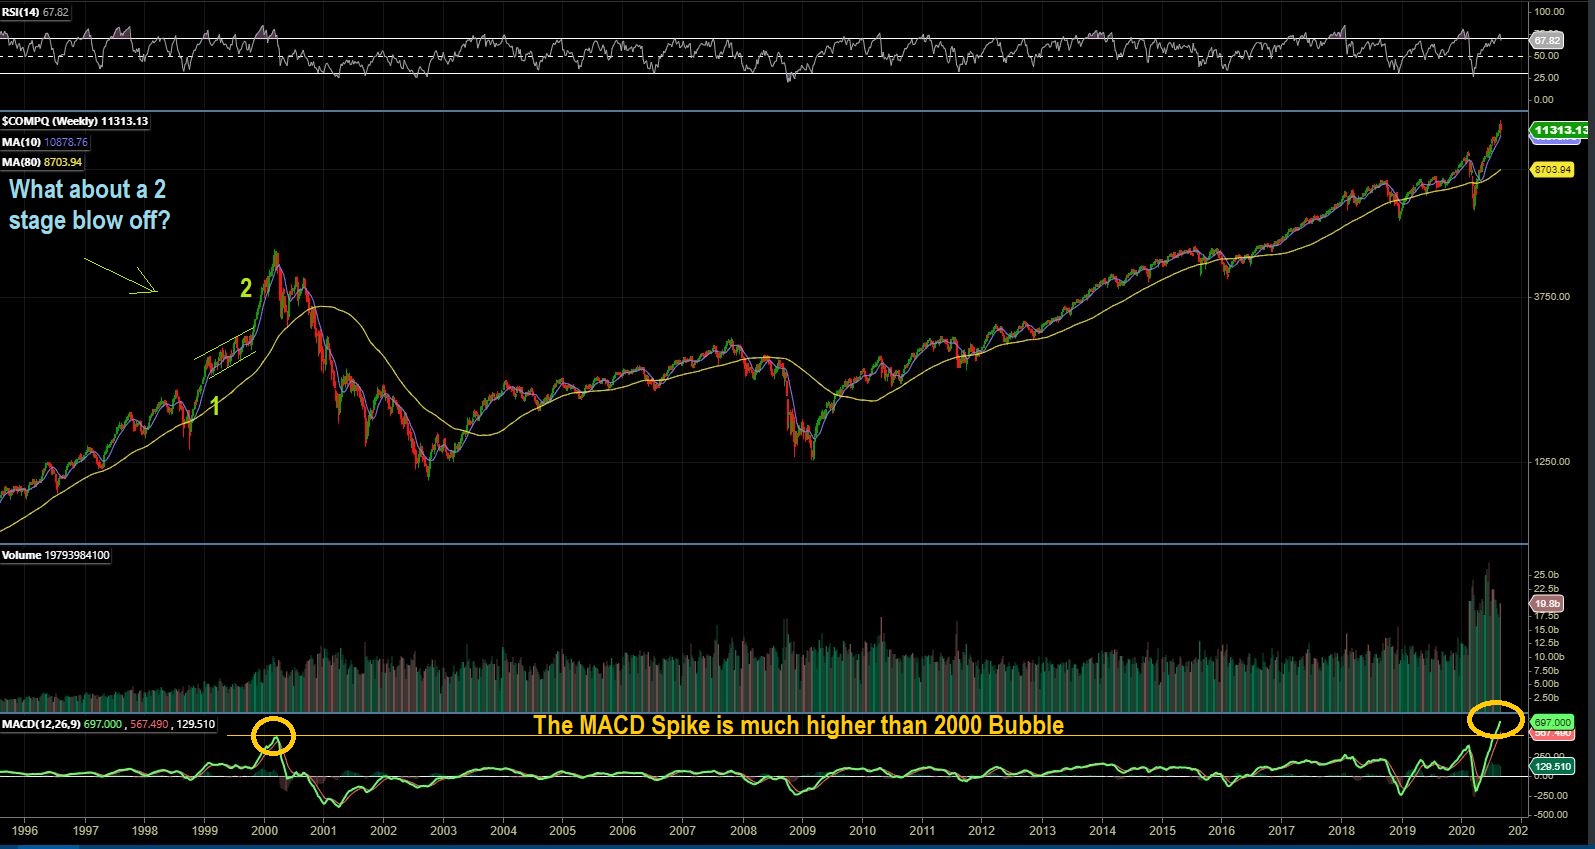
NASDAQ 2000 top & Now – This did not help at all. I noticed that the NASDAQ 2000 blow off top had 2 stages. When I look at that first run up out of the shake out crash, I now see that our current run looks like that first stage run after a crash too. Is this indicative of a continuation? Tough call, because notice that the MACD is currently spiking Much higher & steeper than the 2000 peak. These are similar but there ARE differences in these 2 time periods too. These are similar, reflective in some ways, and different in other ways. Lets zoom in on 2000 again. Click on charts to enlarge if you don’t have a touch screen.
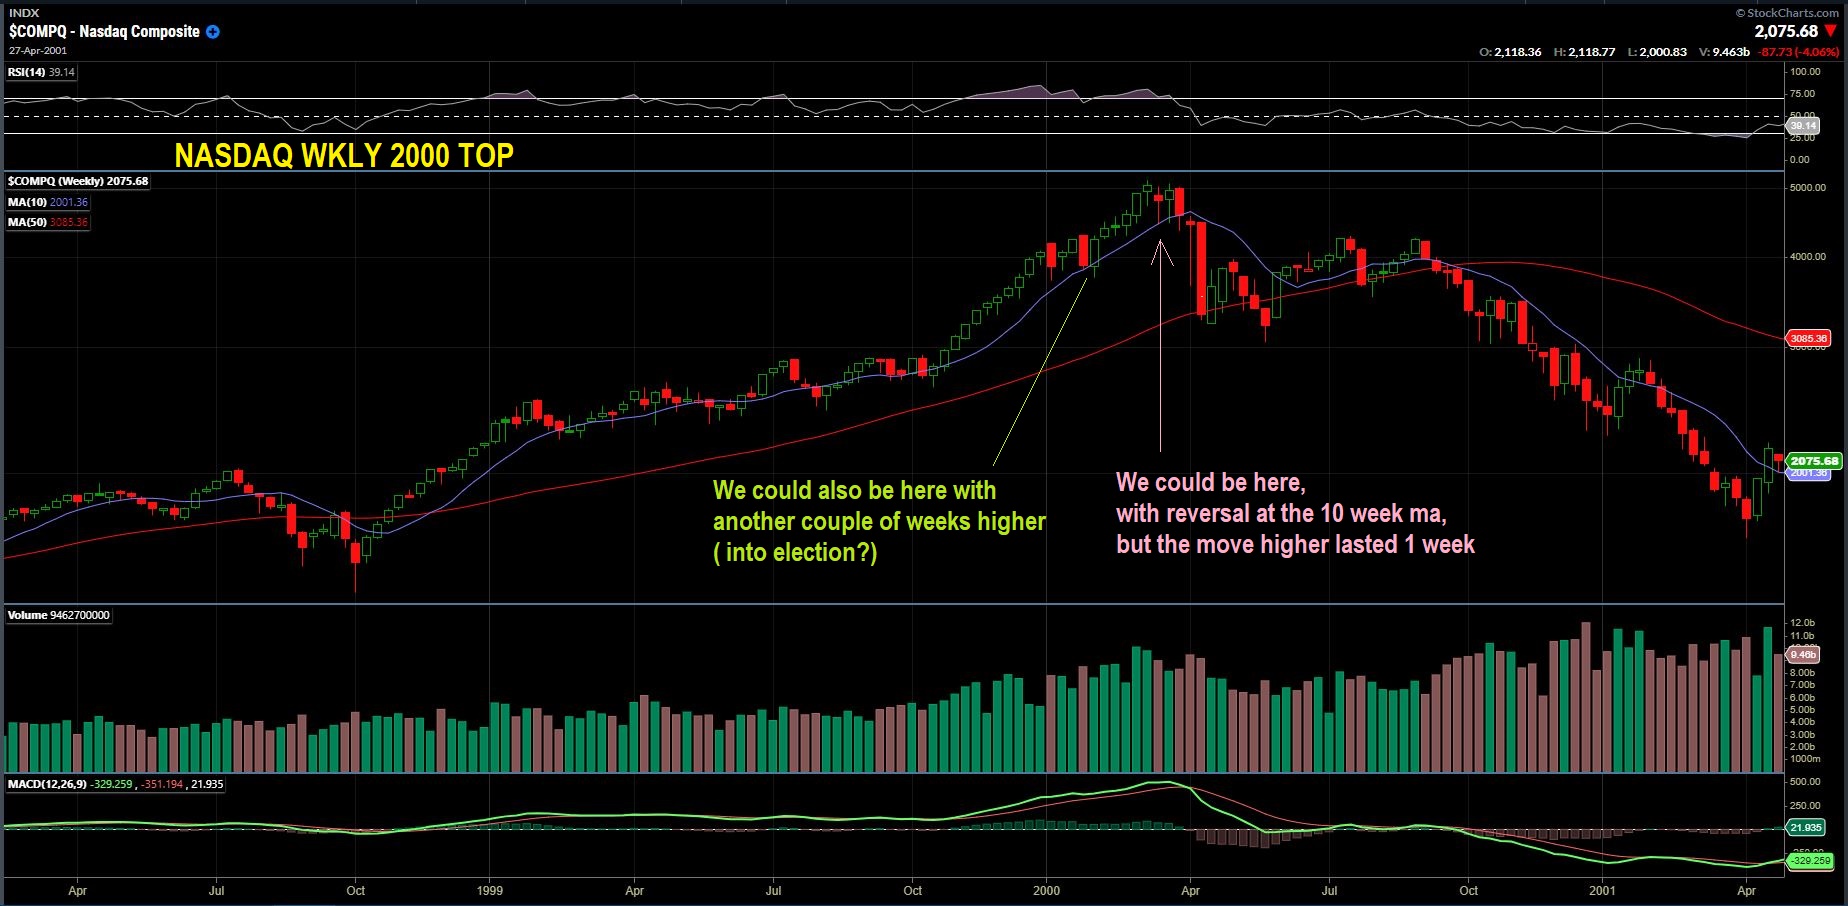
NASDAQ 2000 Top Weekly: Here I am simply pointing out that on the way to the 2000 top price dropped to the 10 week ma (See the green writing) and ran for a few more weeks – Another daily cycle. Also if you look at the very top though, it had a reversal candle right off of the 10 week ma, and then topped in the next 2 weeks ( Pink writing).
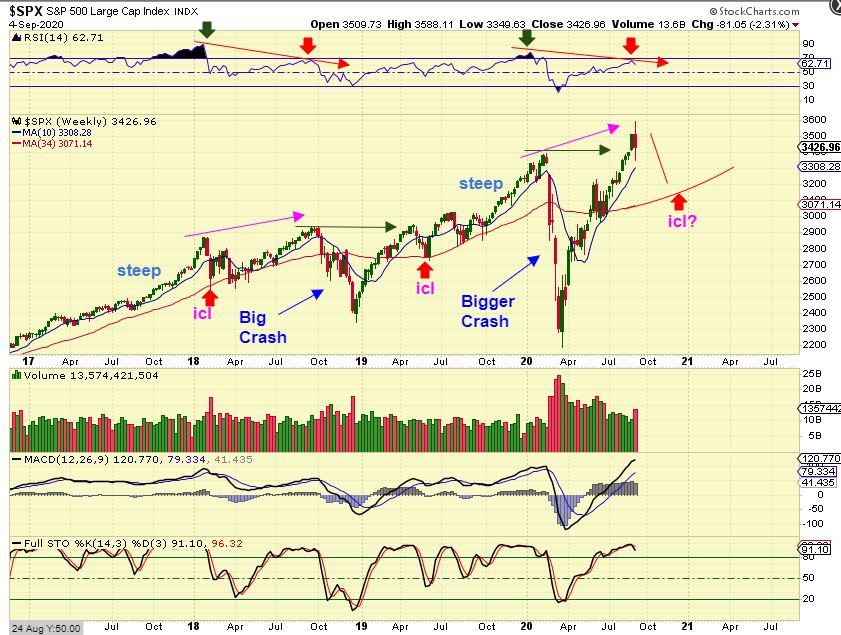
SPX WEEKLY – Comparing 2000 with the current SPX set up is useless, SPX never spiked higher then. This does look like a broadening top or bullhorn pattern though. That can lead to a top, but it can slide higher along the red line too.
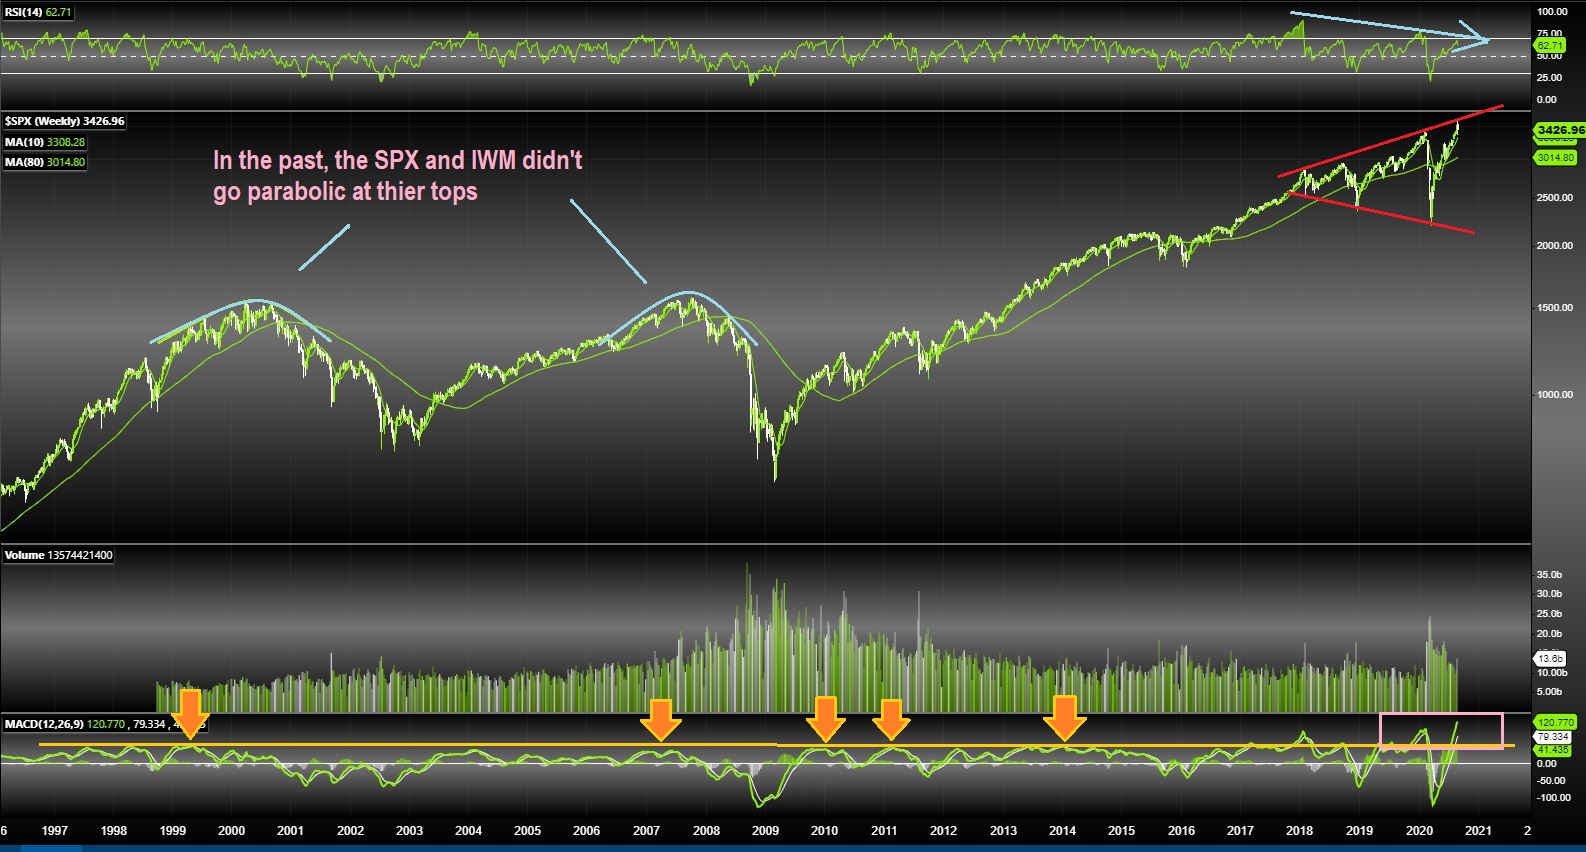
SPX WEEKLY DOJI – A Weekly Doji formed here and we do have divergence with this new higher high, similar to the higher high double top in 2018. That double top rolled over.
.
THE SAME CHART – I thought that it was interesting that in 2018 we saw
– A strong steep rally into Jan peaked. It then crashed followed by a rally into the first week of October peak. The Markets then a year end crash to an ICL.
– We just had a strong steep rally into Jan/Feb and crashed, then rallied into a higher high heading toward Oct, with a weekly Doji.
– So we may see that “steep rally, crash, double top, Crash” heading into elections. Notice that each crash has been much bigger than the prior one.
WTIC WEEKLY – Oil dropped this week, and lost the 10 & 34 week ma. It may just be a sharp drop for a couple of weeks and then another move higher, as shown with the ** Marks on the chart on prior runs. Oil looked strong right up until last week. That 1 candle last week changed the big picture for now.
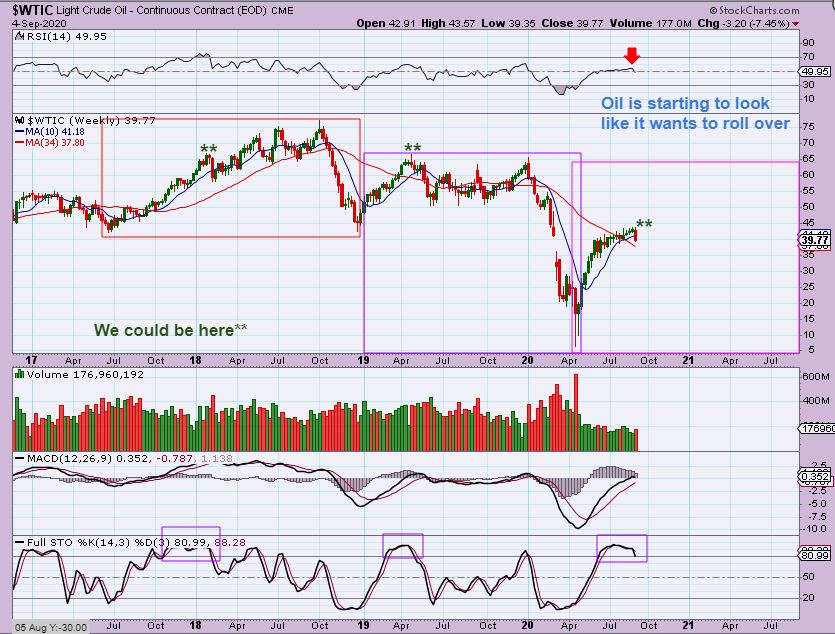
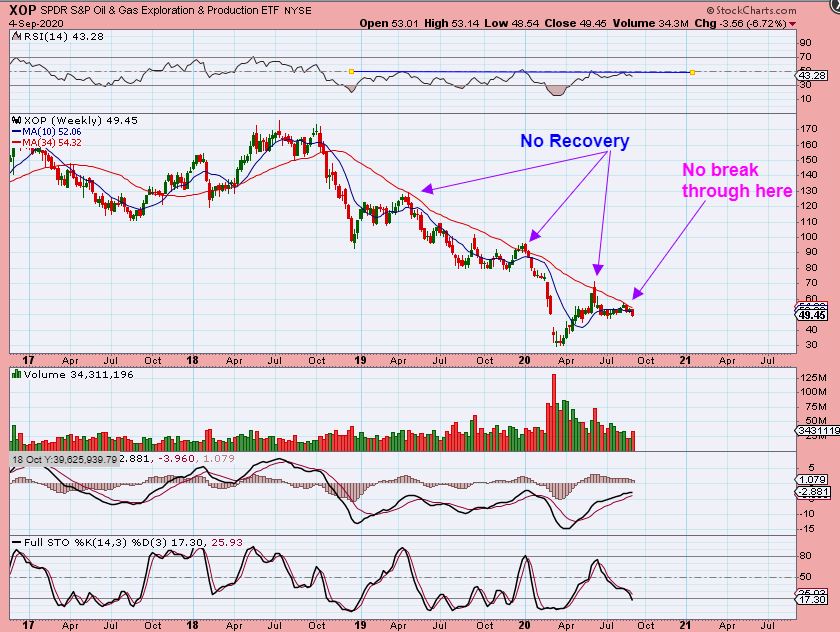
And The XOP has struggled at resistance. The Oil / Energy Trades that I was looking for have been put on hold as of 2 weeks ago. The XOP is leading Oil.
.
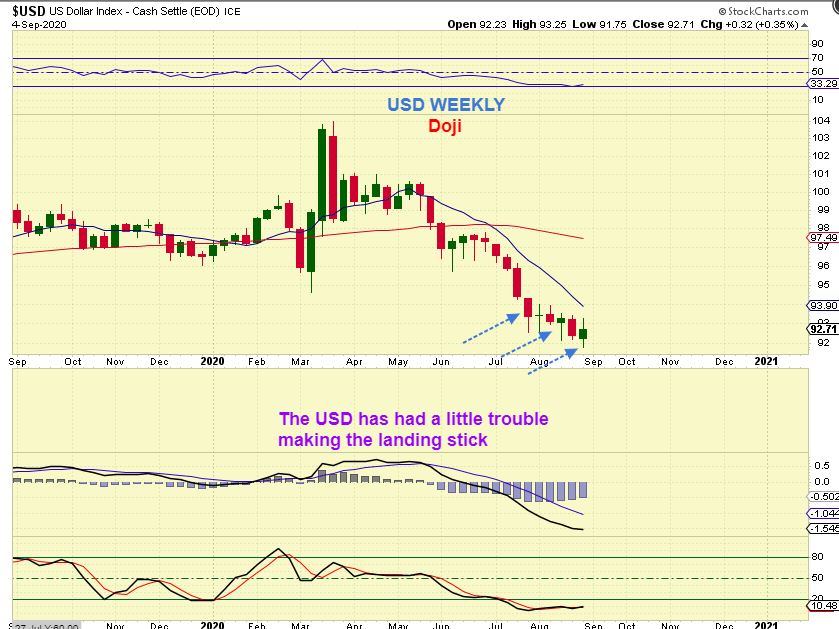
USD WEEKLY – We have had possible bottoming or reversal candles week after week, but the USD has not been able to stick the landing. There is reason to believe that the Lows will stick though…
.
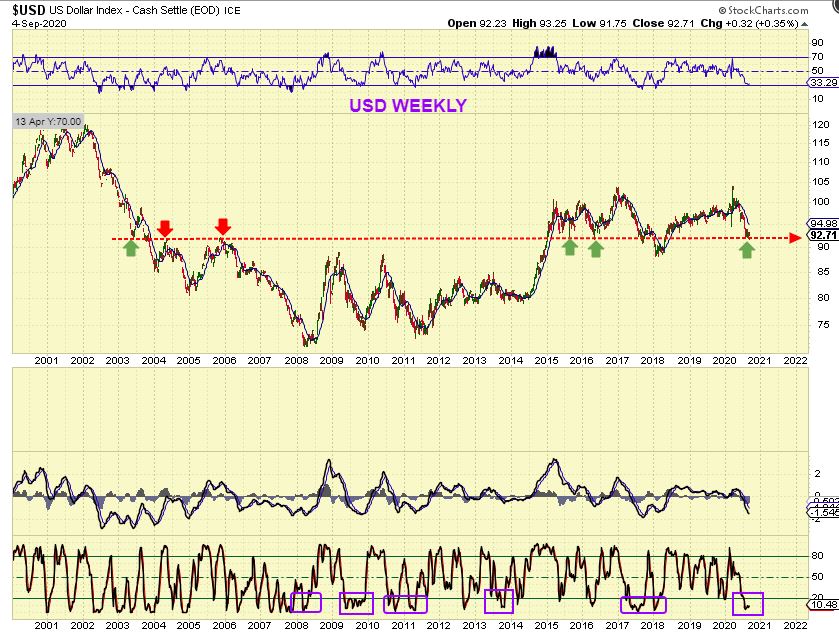
USD BIG PICTURE – We are at a long term support / resistance area, and…
.
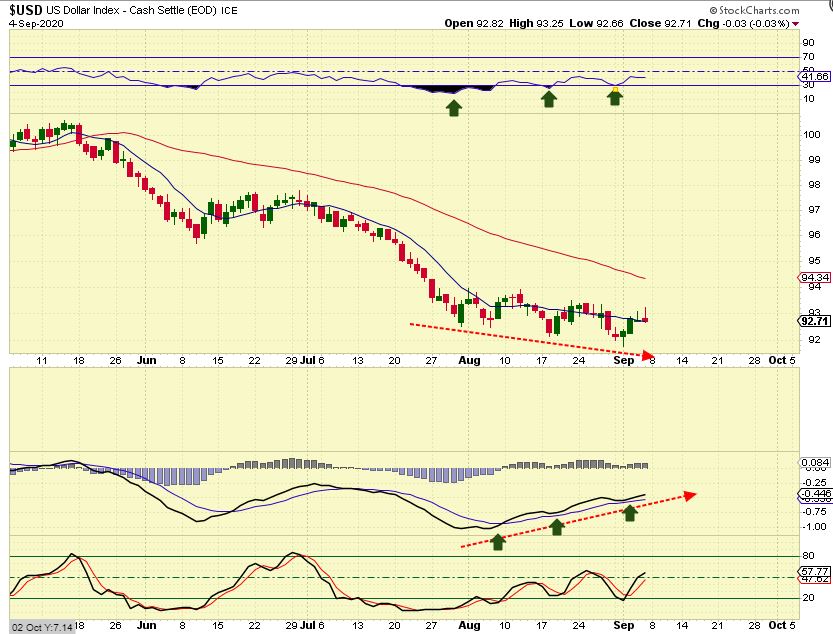
USD DAILY – I have pointed out the rather strong divergence in the daily chart with a series of lower lows.
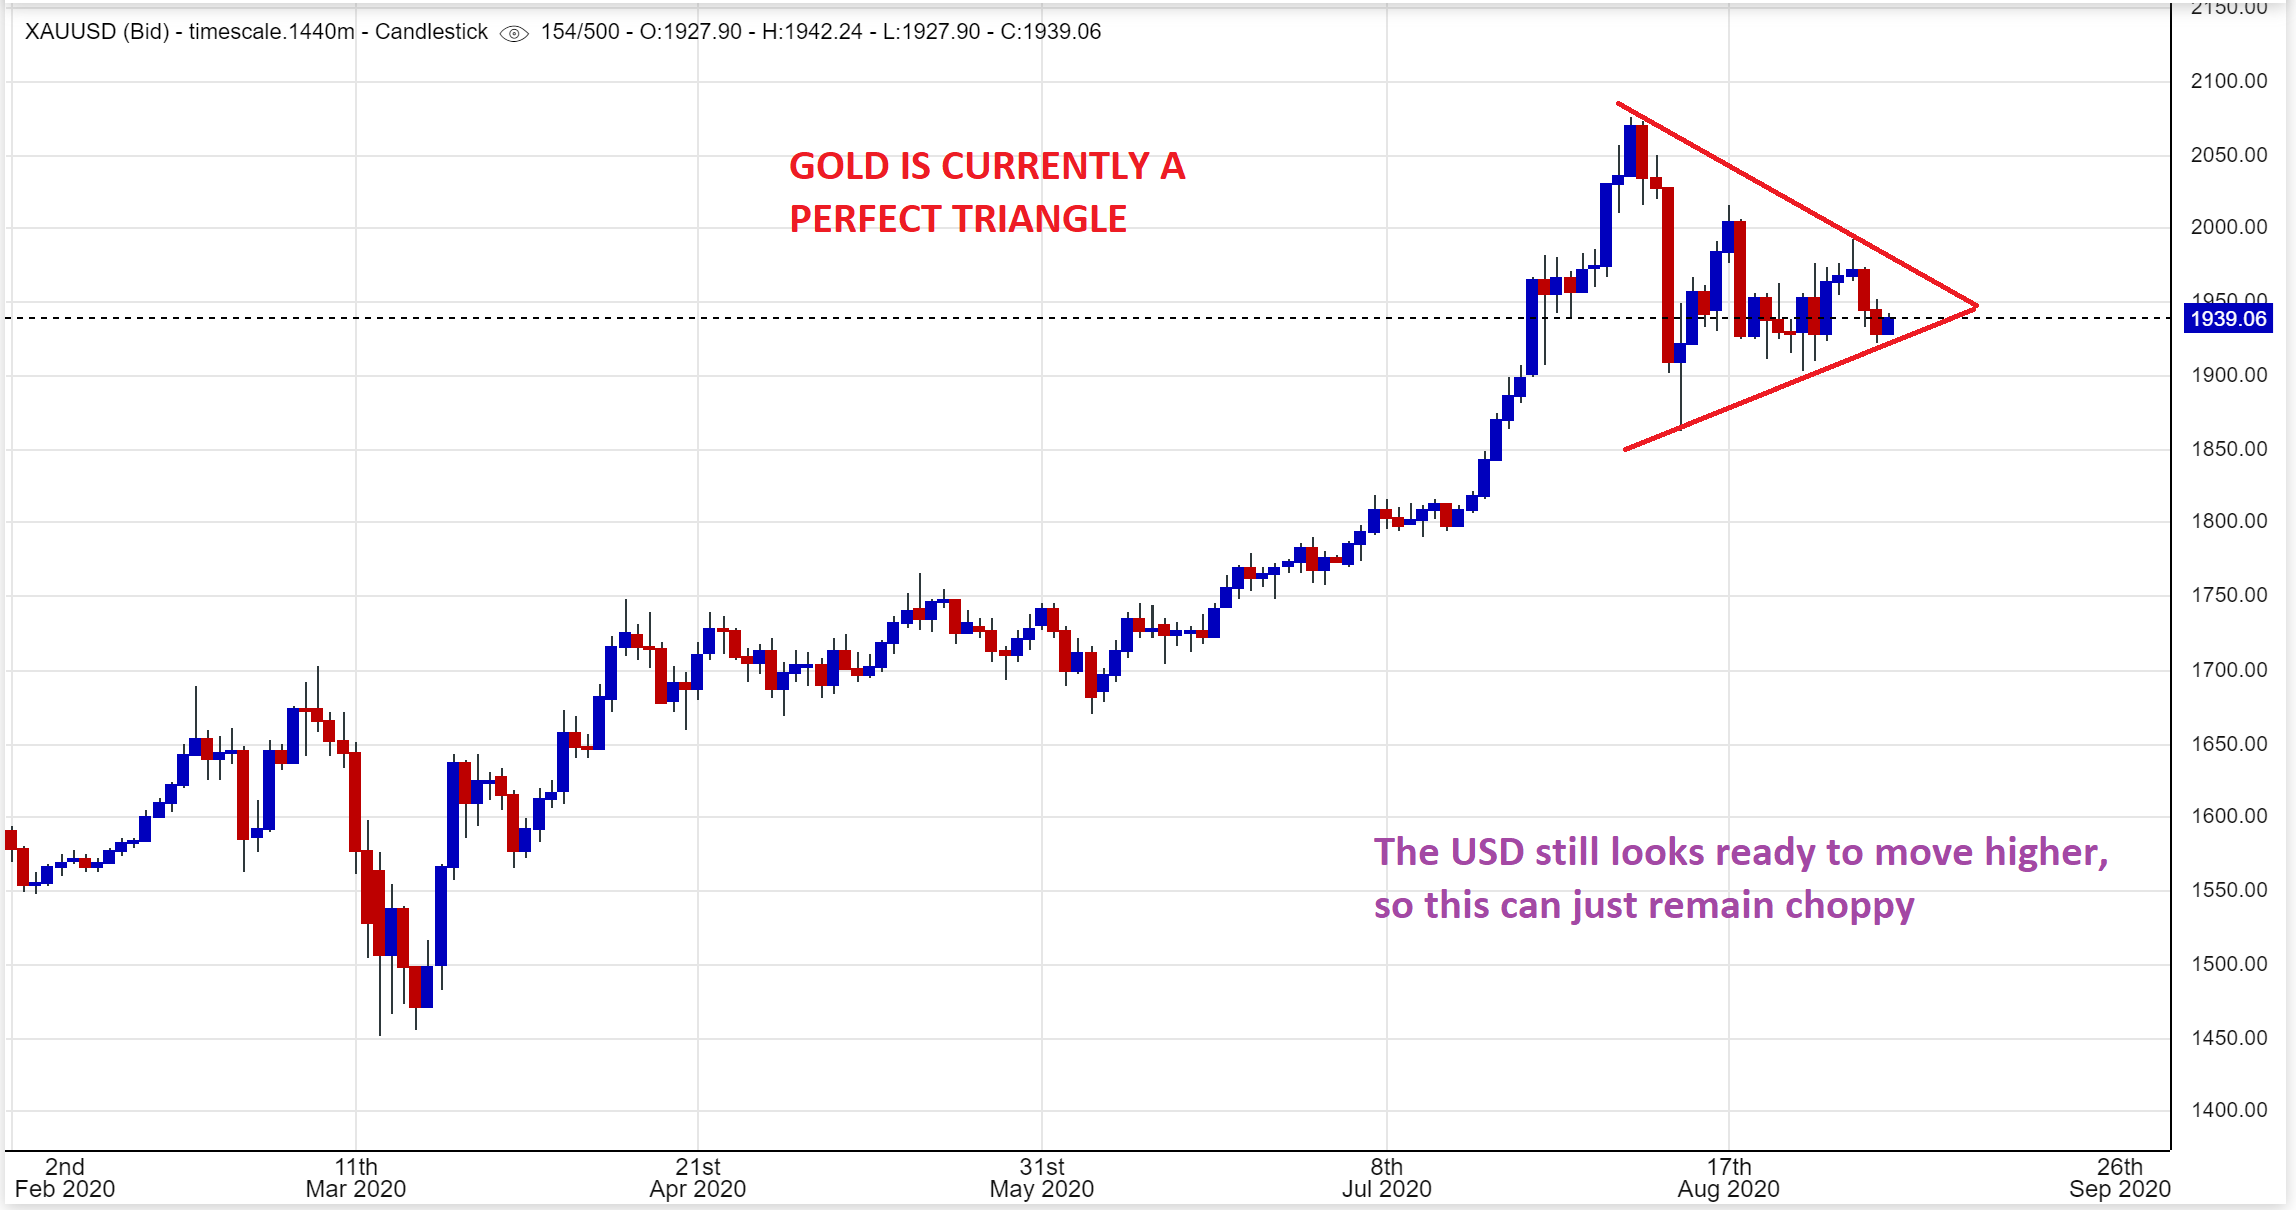
GOLD is a pretty perfect triangle at this point, and that could be a bullish pause. It would seem that of the USD rises, Gold will break down though, and it is 1/2 way through the current daily cycle, so a dcl will be due in 2-3 weeks. Another possibility is a break out higher and choppiness into the next dcl. Later you will see why I am thinking of this.
.
I always like to look back at the 2000 – 2011 Bull Run and see how it performed.
.
GOLD – It had normal pull backs to dcls and ICLs all the way higher. There were strong runs and weaker sideways runs, but we always had normal pull backs, so it is good to keep that in mind. I do see some milder ICL dips, and some Deeper or sharper ICL Dips. Please read this chart for more information.
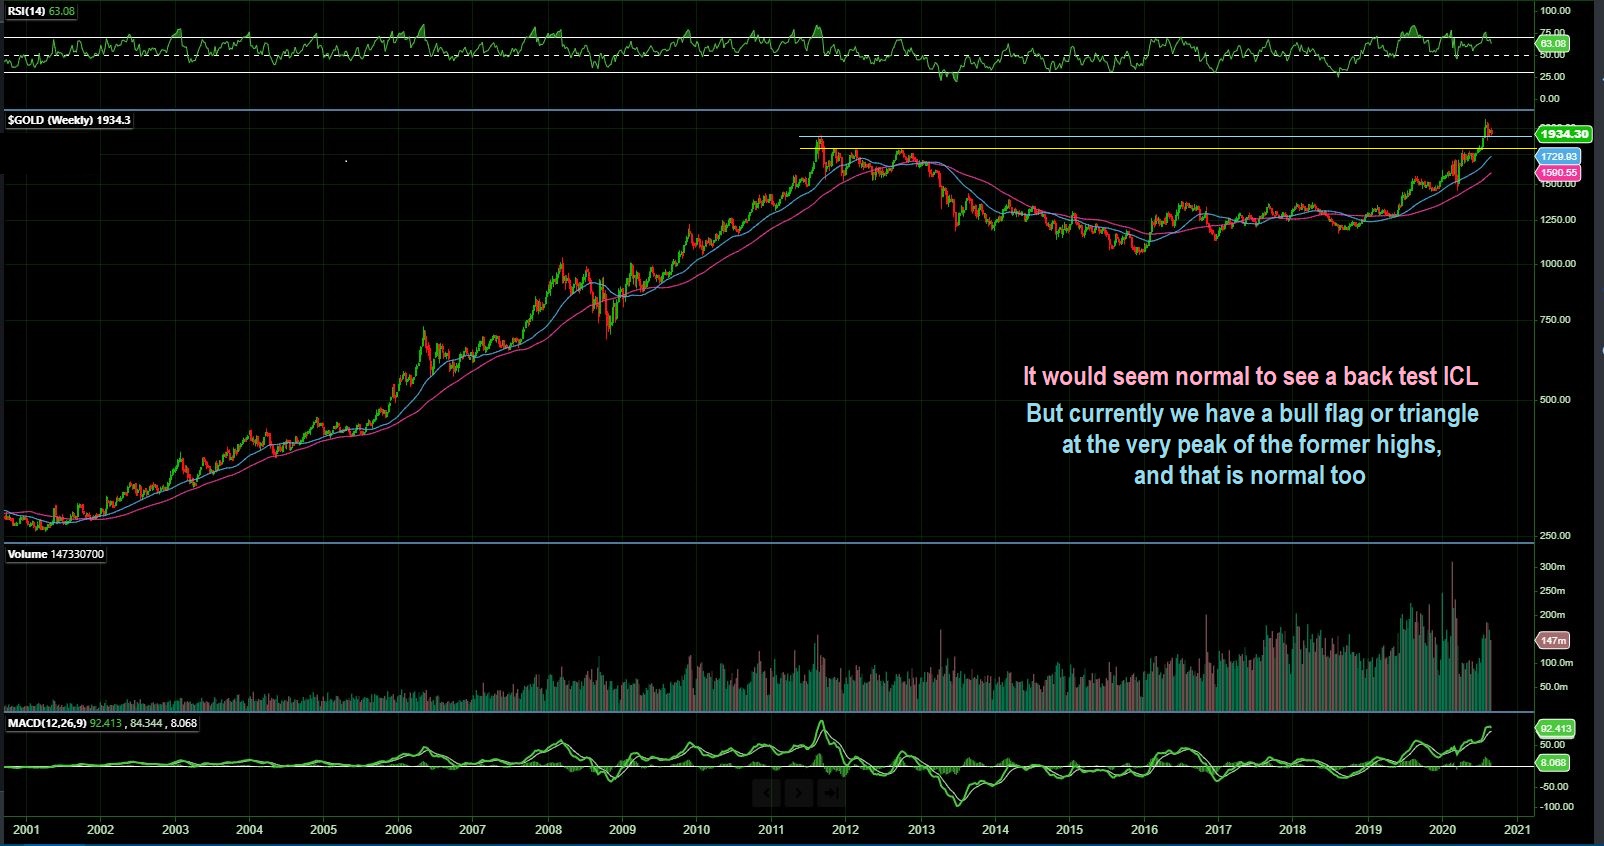
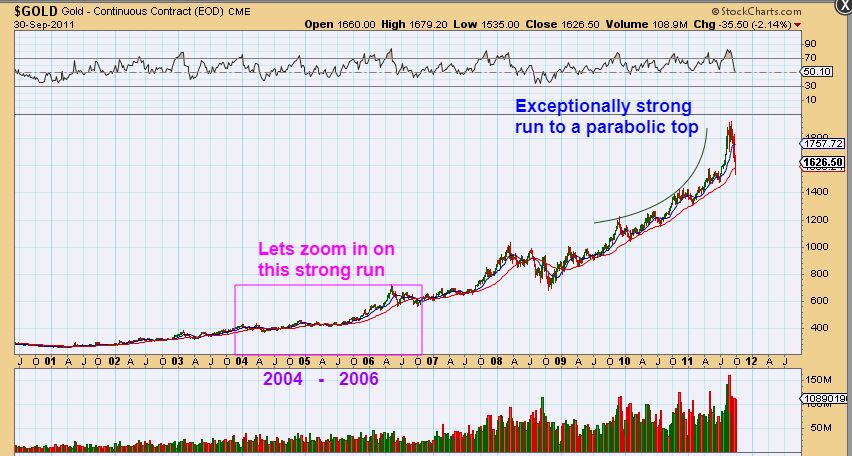
In that 2000-2011 Gold Bull Run, it was obviously stronger at the end, the parabolic top. I also see a strong run in 2004 to 2006 and then Mid 2006 to 2008. Lets zoom in and see how a STRONG run in Gold acted, since we have been in what seems to be a strong run in Gold lately.
 .
..
With the strong run, I see 2 stretched Intermediate Cycles ( ICL to ICL) in this run for GOLD ( See ‘Here & Here” ).
.
– One stretched cycle lasted over a year with an April 2003 ICL to an April double top peak in 2004. Then after a sharp drop we see a normal length rally from May ICL to Nov peak.
– Notice the February 2005 ICL to the peak in May of 2006. Really? I do not see a clear ICL between Feb 05 ICL to the June 06 ICL, do you? That is because that became a parabolic run too. So…
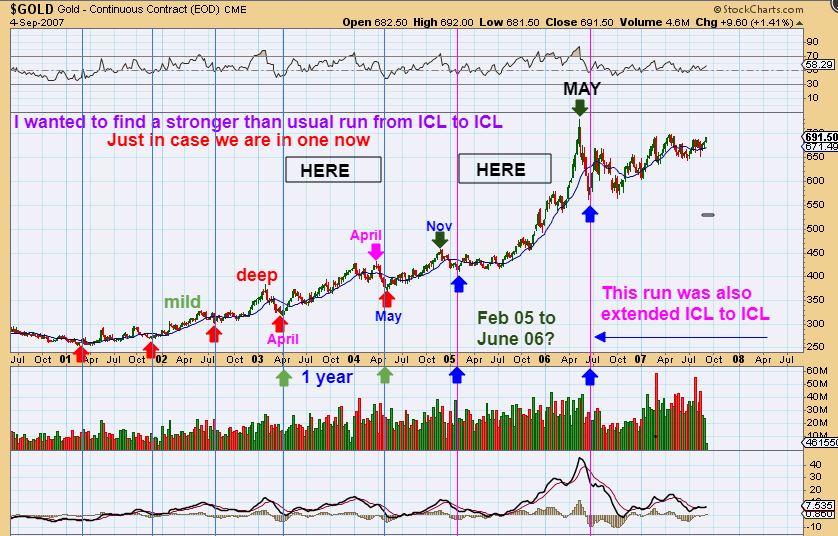
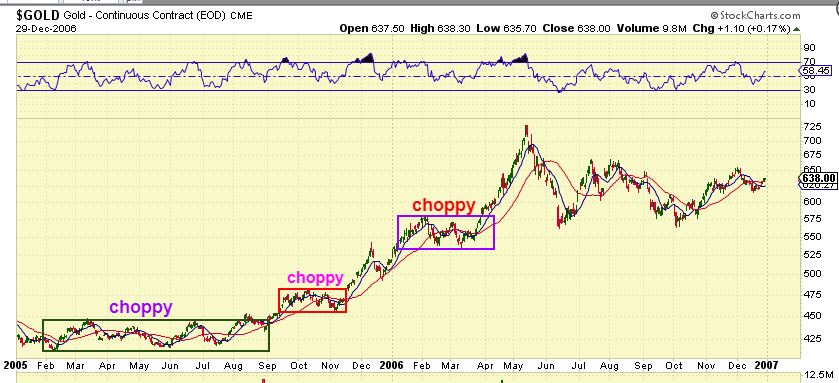
This is the same chart: Could that happen now? Just look at that Feb 2005 ICL to the peak in May 2006, with no visible ICL. It is possible that we could see that on this run. Why? Notice that back then It followed a long choppy sideways run from Oct 2005 to about Oct 2006.
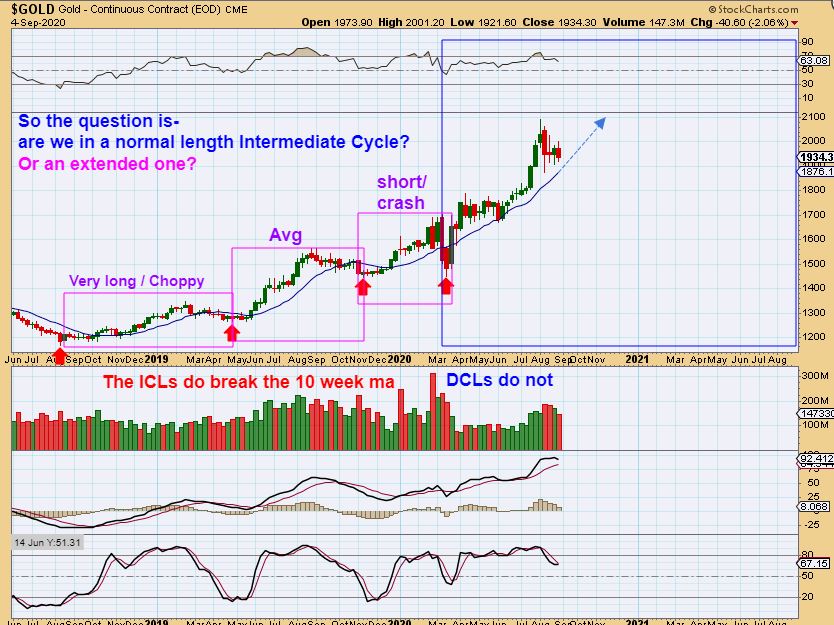
GOLD just had a long choppy sideways run in 2018-2019 & after a run, the drop into the ICL in 2019 was choppy. Then this run started. It has a crash in march 2020 due to covid concerns, but rising from that crash was a sideways chop into the dcl. Now we are sideways chopping into the dcl here too.
There is nothing that says that it ‘Can’t’ keep running into a parabolic run with no visible ICLs for a year too. Is that the Most likely scenario at this point? No. We are almost on day 20, so I have to expect choppy trading and a dip into a dcl, maybe ICL as the main expectation.
.
So again, We are almost on day 20, so I have to expect choppy trading and a dip into a dcl, maybe ICL as the main expectation, but I also wanted to show you the day to day trading in 2005 to 2006. Even if we were going to do that kind of a run that we saw in 2005 to 2006, it was not straight up…
.
GOLD – This was that same run from Feb 2005 to May 2006 on a daily chart. So we rejoice at a run that lasts over 1 year without an ICL, but lets take a closer look. It is a lot different looking day to day, right? I see long choppy sideways consolidation Feb through August ( 6 months of chop), then a rally and then…
– Look at the choppy area September through November ( 3 more months of choppiness). That was followed by another run, and then…
– 3-4 more months of sideways chop before the last major run. Do you know what that would mean right now? That means we would go sideways chopping 3 months (now until December) before the next rally higher. So we see no visible steep ICL Drop, but this was week/months of choppiness between rallies.
.
.
So do you remember when I said: “Another possibility is a break out higher and choppiness into the next dcl. Later you will see why I am thinking of this.” That would match the kind of choppiness that took place in 2005-2006 when the extended Intermediate cycle was choppy and sideways , and did not sell off very deeply. Only time will tell.
.
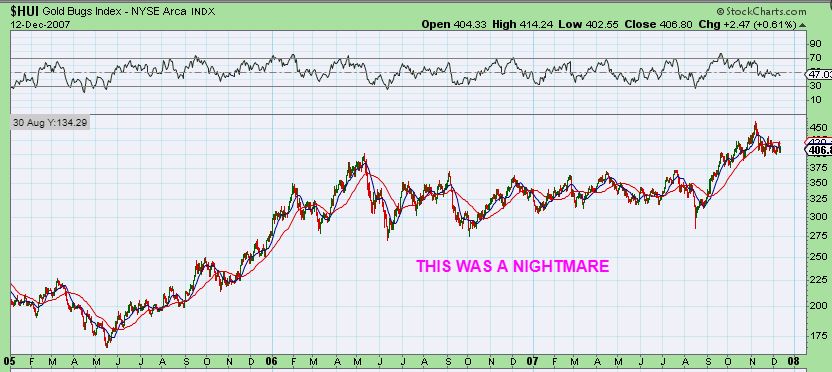
HUI 2005 to 2008 – I cannot even tell you how bad something like this feels. After that strong run, This choppy sideways move lasted almost 2 years sideways, and it WAS a Bull Market. This is why I try to find a few trades in other areas, while I let the Miners chop around. You never know when the chop will stop and run will unfold.
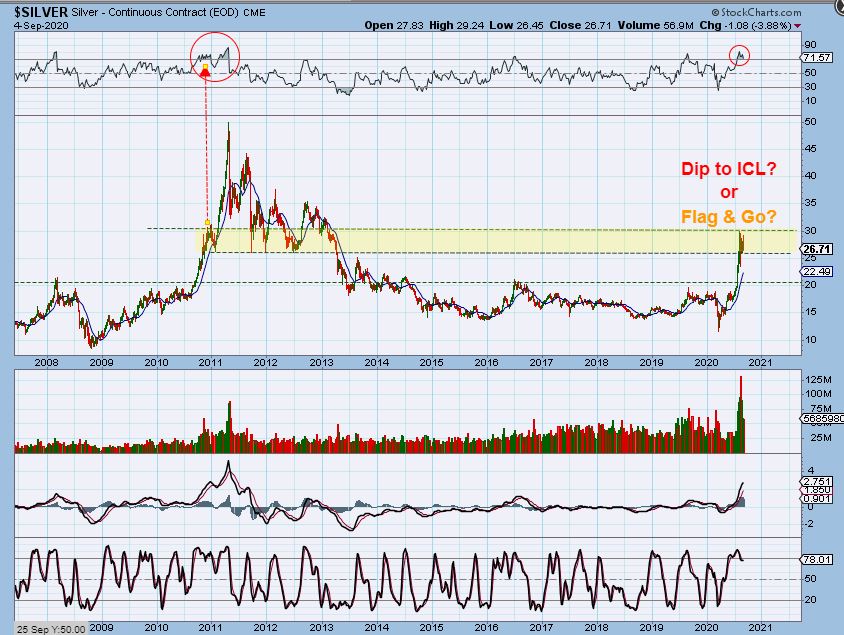
SILVER is still in that $26 resistance area. This can chop into a Bull Flag or back test in an ICL, as mentioned in last weekends report.
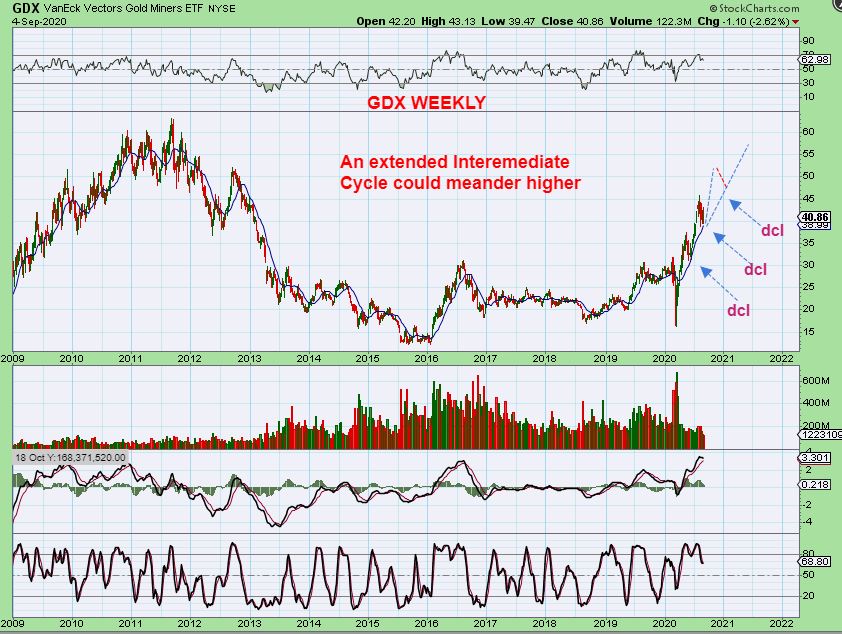
THE GDX has been chopping sideways since putting in a day 5 peak, so we are seeing choppiness at this point. They didn’t crash with the General markets Thursday & Friday, so that is encouraging, but are they going to Pop, Drop, or Chop from here? We honestly can’t tell. I do see some weakness in the MACD & RSI on day 18, so I remain cautious even though it didn’t sell off with the Markets.
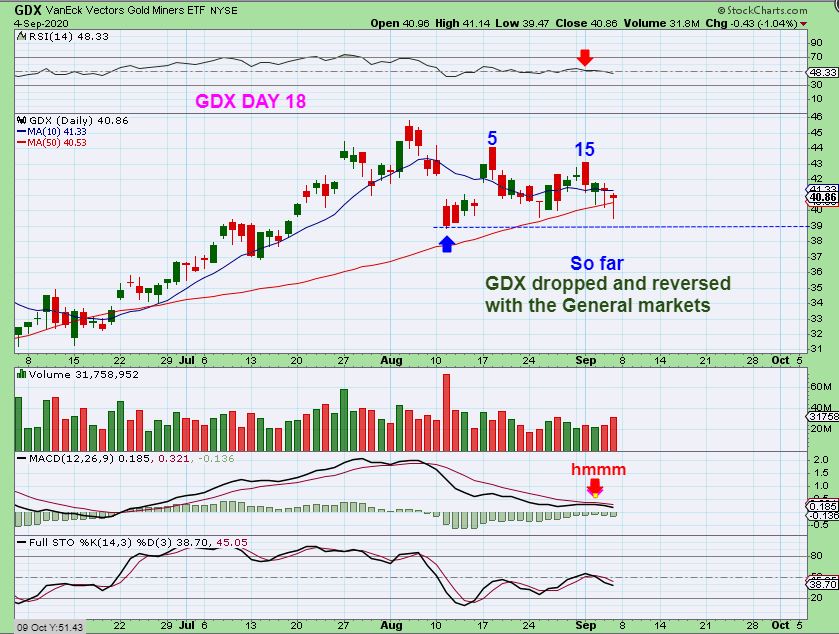
GDX (Miners) did run into a resistance area and have been chopping back down to a dcl. An extended Intermediate cycle can cause this to simply run as drawn, higher. Miners do seem strong for a late stage daily cycle, since an ICL is coming due. Friday was day 18 of a possible 33 or so day daily cycle. It is hard to know if this will Pop, Drop, or Chop, but it is getting late in the daily cycle. Time is running out.
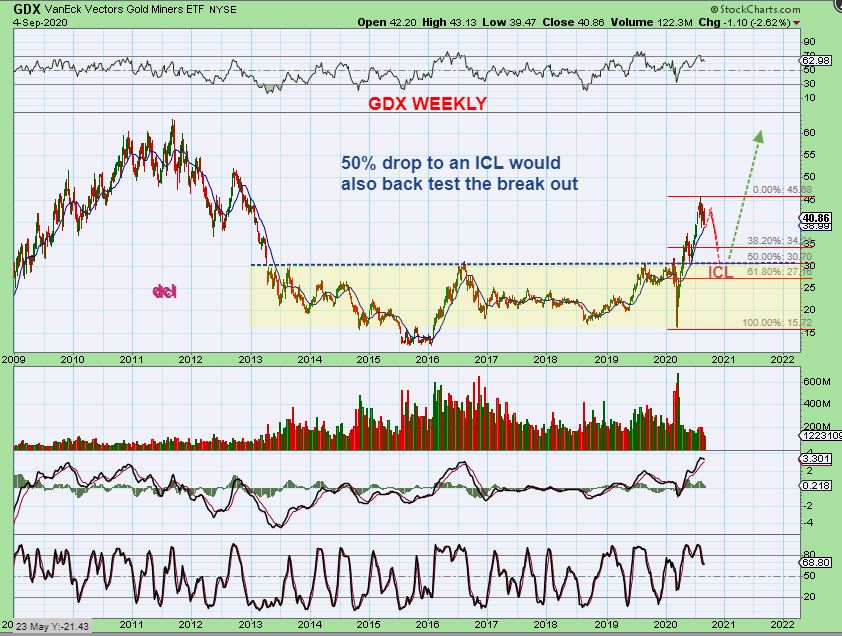
GDX – I need to show what a 2 month drop into an ICL could look like. A 50% drop lines up with a back test, but I almost feel that Miners aren’t going to be allowed to drop this much without Buyers stepping in. A 38% drop is reasonable, or a choppy sideways move like we saw in 2005 with a gradual dip into a dcl (mild) can happen if buyers hold price up.
.
– The General Markets were extended and overdue for a dcl, so we got a mini crash. I said on Thursday nights report that I think it would quickly lead to a dcl. Friday saw a strong reversal off of the 50sma, and I think that the selling has finished up for now, with the reversal Friday. Friday was actually a buy with a stop under the lows in Technical Analysis. Now we wait and see how this next Daily cycle unfolds. This can go extreme parabolic, or top L.T. & drop into an ICL, and that drop would be a big one.
.
– Oil dropped and OIL stocks are seeking out their dcl. There is no real good trade opportunity there as far as I can tell.
.
– The USD has been due for a dcl and an ICL, and we see divergence at each pop & drop to new lows. The USD was shown to be at a long term support/ resistance area, so it may have found the bottom for now. A ride in the USD is thought to send Gold lower into the next dcl.
.
– GOLD & SILVER both seem to have bullish set ups, with a possible triangle forming in Gold. We are due for an ICL every 6-7 months on average, and we are now 6 months past the last one in March. We need a little more time to see what will happen going forward, triangles CAN break down too, but because we are seeing GOLD & SILVER hold up well on month 6 – I decided to look at PAST times when Intermediate Cycles got extended and the Precious Metals only chopped along sideways. This happened for weeks and Months at a time ( Unless we were in a parabolic type run). So we need a little more time to see what this sideways move will lead to, but currently we are due for an ICL drop.
.
– GDX, GDXJ, & SILJ are choppy and sideways with ‘peaks’ early in the daily cycle at day 5. We are at day 18, so this is now late in an Intermediate Cycle and being about 1/2 way through the daily cycle & price is still at the lows. we would expect choppiness and eventually a drop into a dcl. We are due for an ICL drop, but individual Miners can hold up and act on their own merit.
.
~ALEX
.
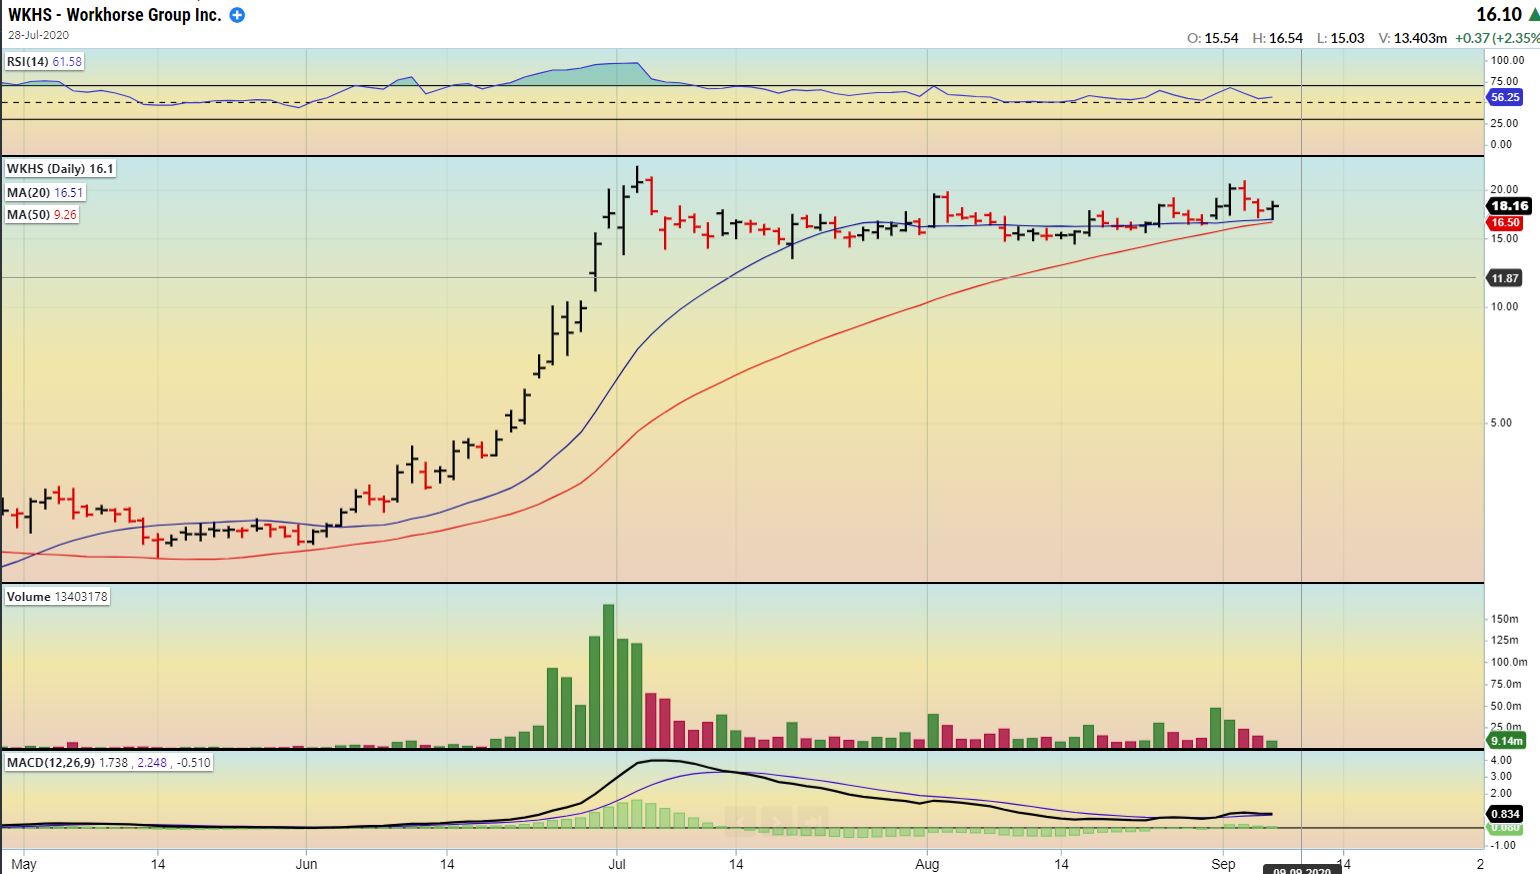
WKHS – I own this and have mentioned it many times, so I just wanted to point out 2 days ago it was over $20 and by Friday it dropped as low as $16.80. That hurt, however, that also only brought it to the 50sma & it bounced. I posted this chart of the bullish reversal in the live area …
.
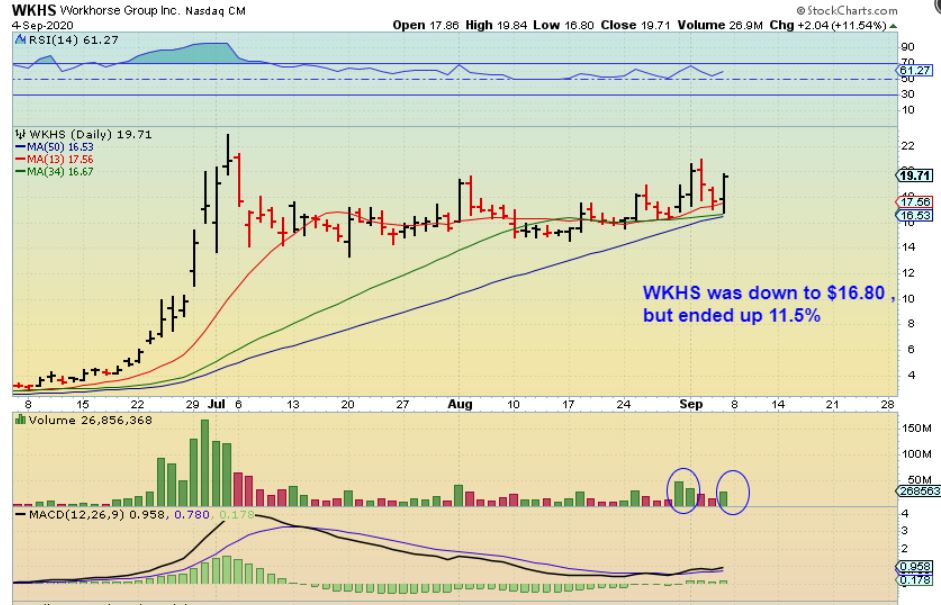
WKHS rallied to close up $2.04 , which was up 11.54%! WOW! These are not easy to trade with BIG moves like this, but you can see that during the entire NASDAQ slam down sell off, WKHS, SPAQ, and others simply did a normal dip & recovered. This MIGHT now take off & run. It erased the entire Thursday & Friday dip.
.
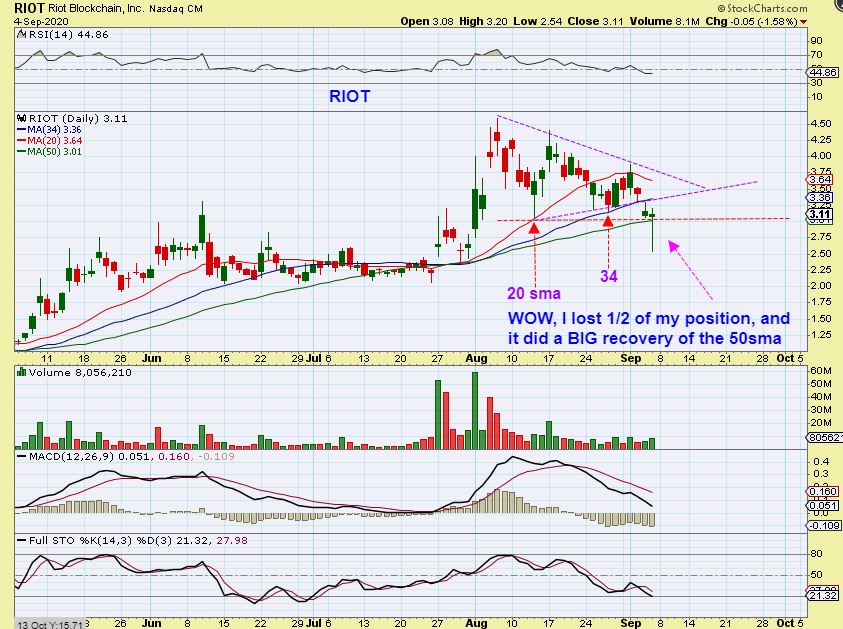
RIOT BY REQUEST: To be honest, this was a rough ride. I sold some on the way up, and I re-bought at the 20sma reversal and added again at the 34 reversal. Well, I stopped out of those ‘Add Ons’ Thursday after breaking UNDER a triangle at those levels. It held the 50sma, so I almost re-bought, but I wanted to see what the markets do on Friday. RIOT crashed Friday and reversed and re-gained the 50sma? Wow! I did not re-buy, because I was away when it recovered. I now need to quickly consider a repurchase, because that looks to be the typical ‘shake out”.
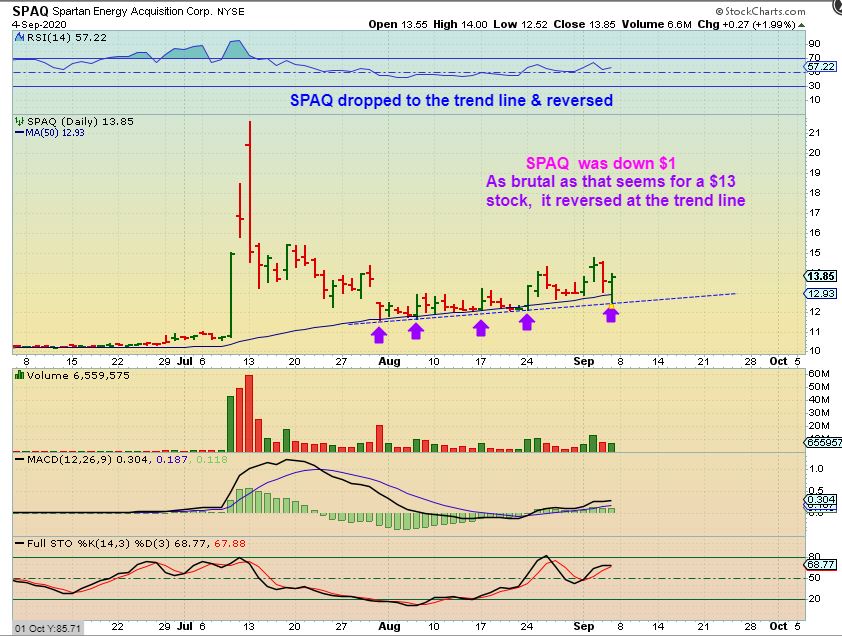
SPAQ – This can still run to the $20 area, especially if the General Markets continue the parabolic rise. This kind of Dump & reversal resets sentiment. People HATE buying now, but once things start to move upside, shorts cover, buyers jump in and we get rallies again ( at least for the first part of the new daily cycle).
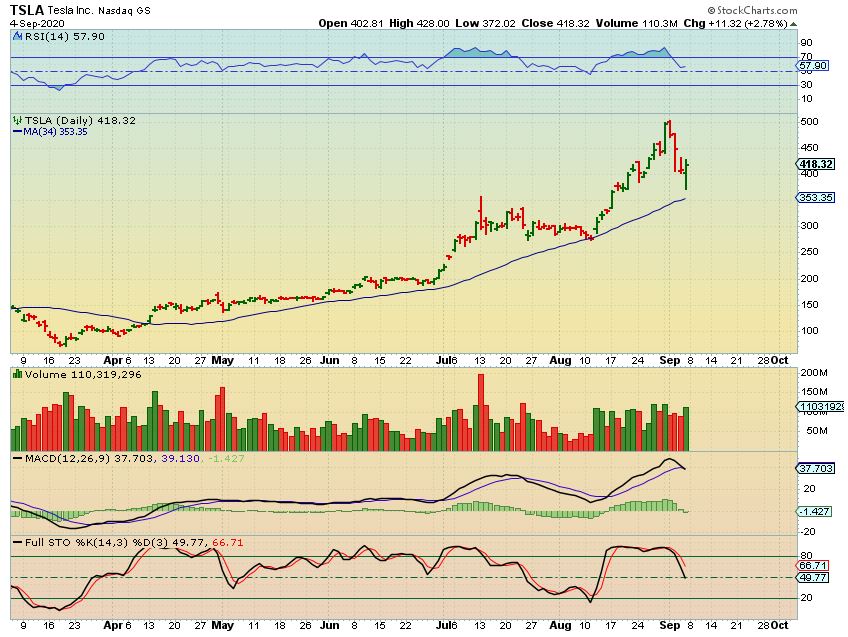
TSLA – We saw a reversal in many stocks, but I want to point out something. TSLA looks normal…
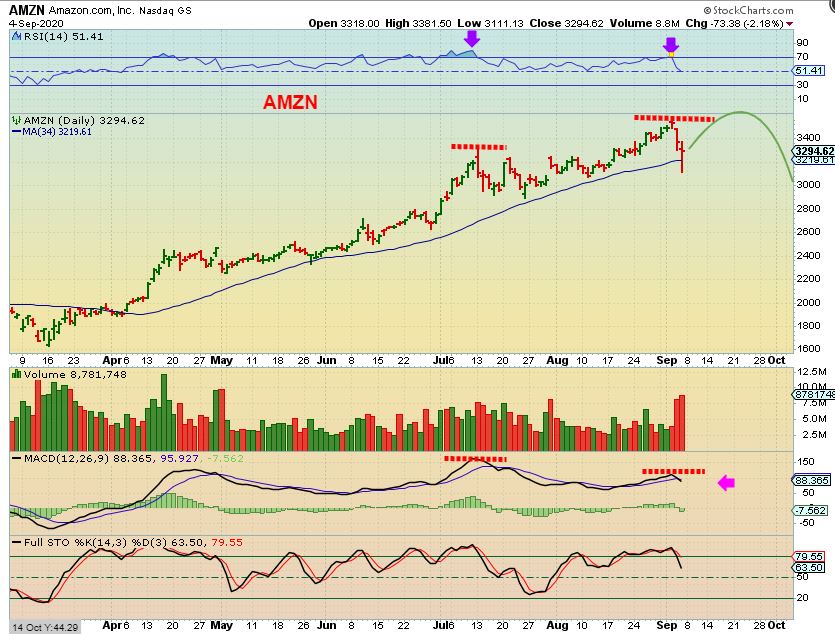
AMZN – This actually shows divergence at the higher high, so we would have expected the drop. The problem is, if it goes on to make new highs again, the divergence may just increase. This could be a sign that the General Markets are finishing up their run, so I will be watching the leaders as well as the General Markets themselves.