Week In Review
As a reminder, the month of August and particularly the last 2 weeks of August can be choppy and tricky as even a few good set ups break down with lack of buying or follow through. For that reason, I am more than 50% cash and keeping any trades or position size small. I look forward to the possibility of a return to more normal trading as soon as September, and especially looking forward to a drop in the precious Metals sector to get us down to our ICL. THAT should prove to be a Great buying opportunity. Let’s look at the past week (s) in the markets.
.
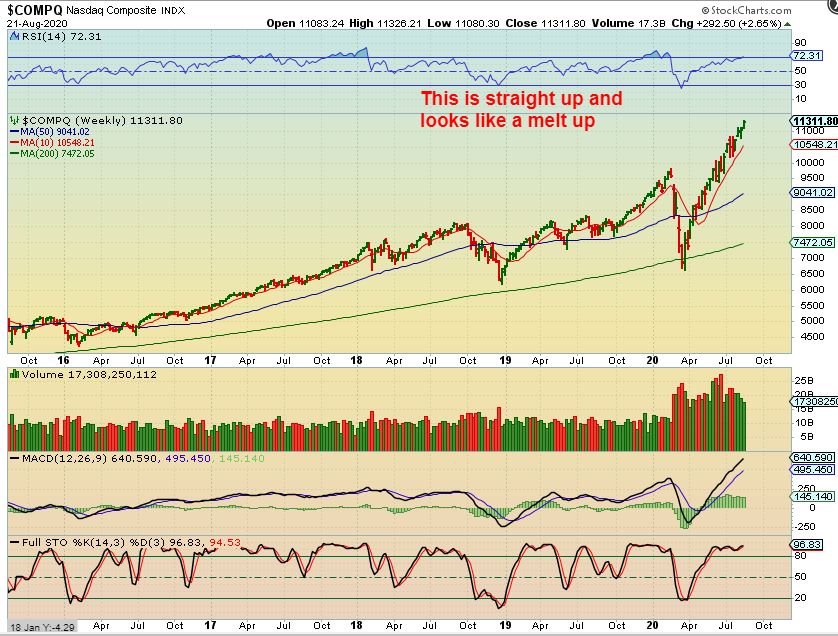
NASDAQ– This weekly chart really says it all. The General Markets put in a V-Bottom recovery and are still running strong. While using daily charts, some here have been able to remain in much of the move higher with stops under the 13 sma, but this is getting a bit extreme and doesn’t seem to match the economy under Covid conditions. Now let me remind you of something I pointed out a few weeks ago…
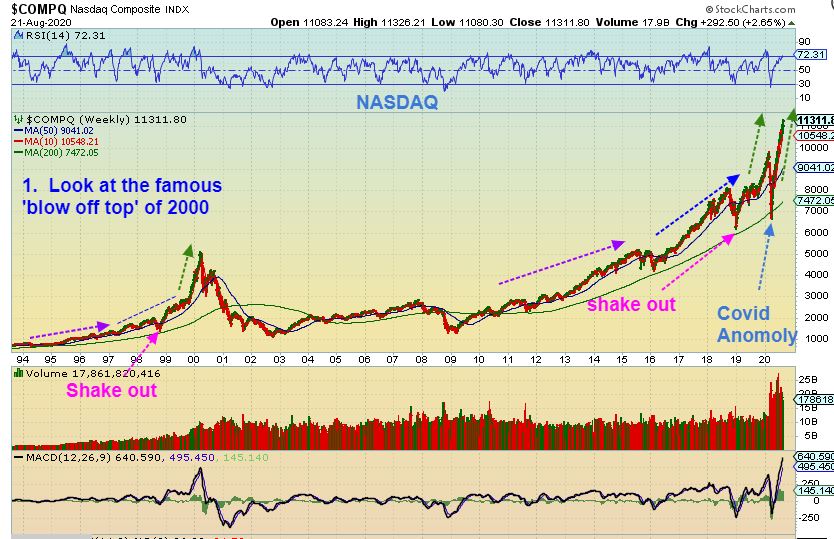
NASDAQ– EVERYONE remembers the ‘DOT-COM BOOM, PARABOLIC TOP” of 2000. It was very bullish, but like all blow off tops, it ends swiftly and doesn’t recover for years. Does this move look just like a twin of that run higher or what? Notice the similarities as we see …
1. A Steady ramp up for yrs ( more of a 45 degree angle).
2. A Sharp drop as a shake out / slam down move.
3. It then ramps straight up, and many think it’ll never end.
4. These are very similar
NASDAQ– Notice the MACD. It is hard to say when this will end, but this is getting extended and becomes unsustainable at one point. The RSI has divergence at the top . When they do drop, it may be a great shorting opportunity simply using SQQQ, SOXS, etc. JUST DON’T BE EARLY ON THAT TRADE.
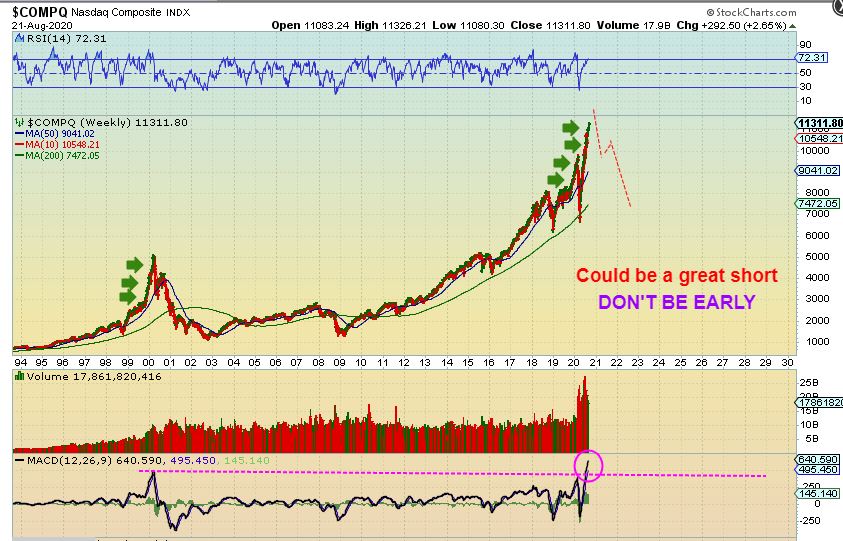
I have to wonder if the month of October, which is notorious for being bearish, ends this run as we go into the Nov election. I may short this when I see that the time is right, but being too early can be very painful.
.
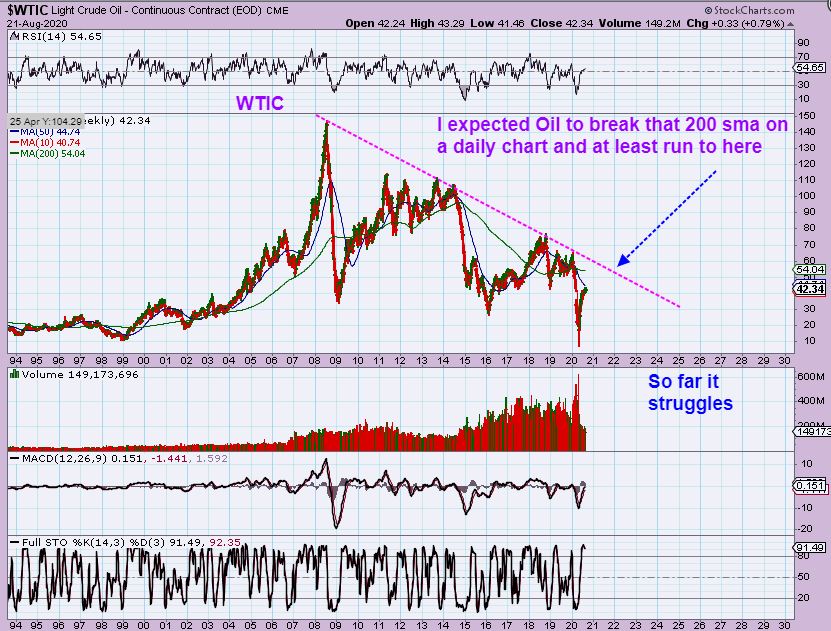
WTIC – I have been expecting OIL to push higher ( And it has slowly done so, but very very choppy). Unfortunately, Oil Stocks are not following at this point. I’m watching this sector daily, in case they’re just doing a 1/2 cycle dip or stalling.
.
GOLD & THE USD
.
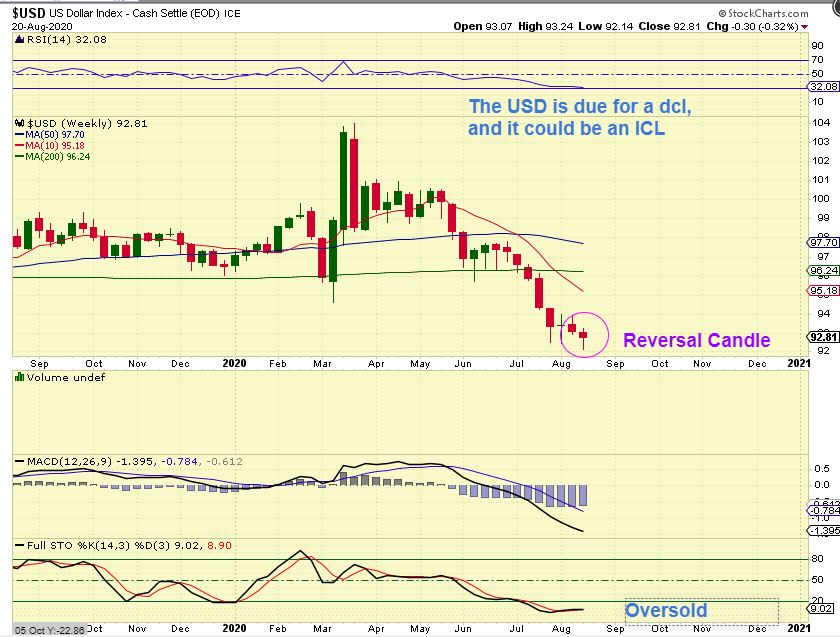
USD – I discussed the USD & GOLD. They do seem to be back at their inverse relationship.
1. The USD dropped sharply for weeks in July,
2. Gold ran up sharply in July.
We now have what looks to be a solid reversal at the lows. Gold is due for a ‘Peak’ and a drop into an ICL, The USD is due for a low, even its own ICL. This is quite oversold too.
.
So The USD is due for a low, and has a weekly reversal, and Gold is due for a Peak
.
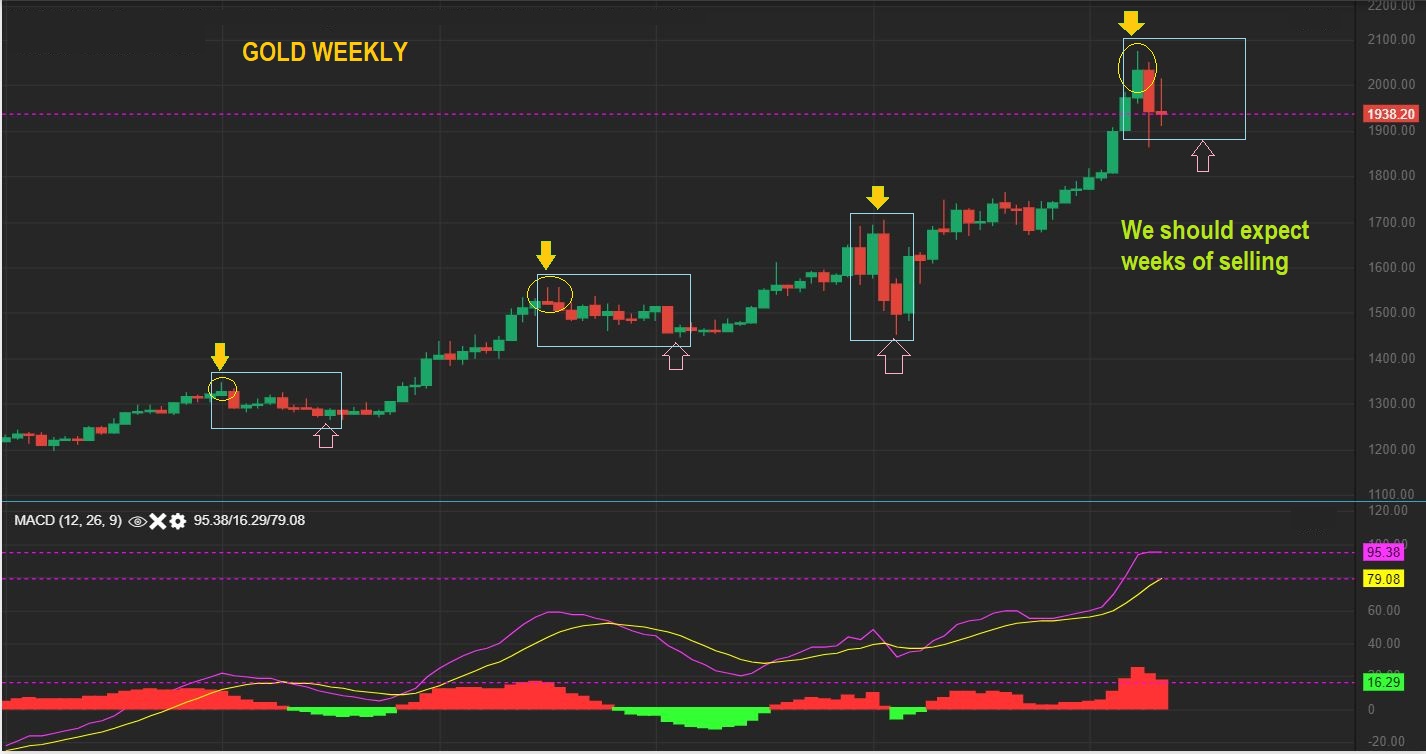
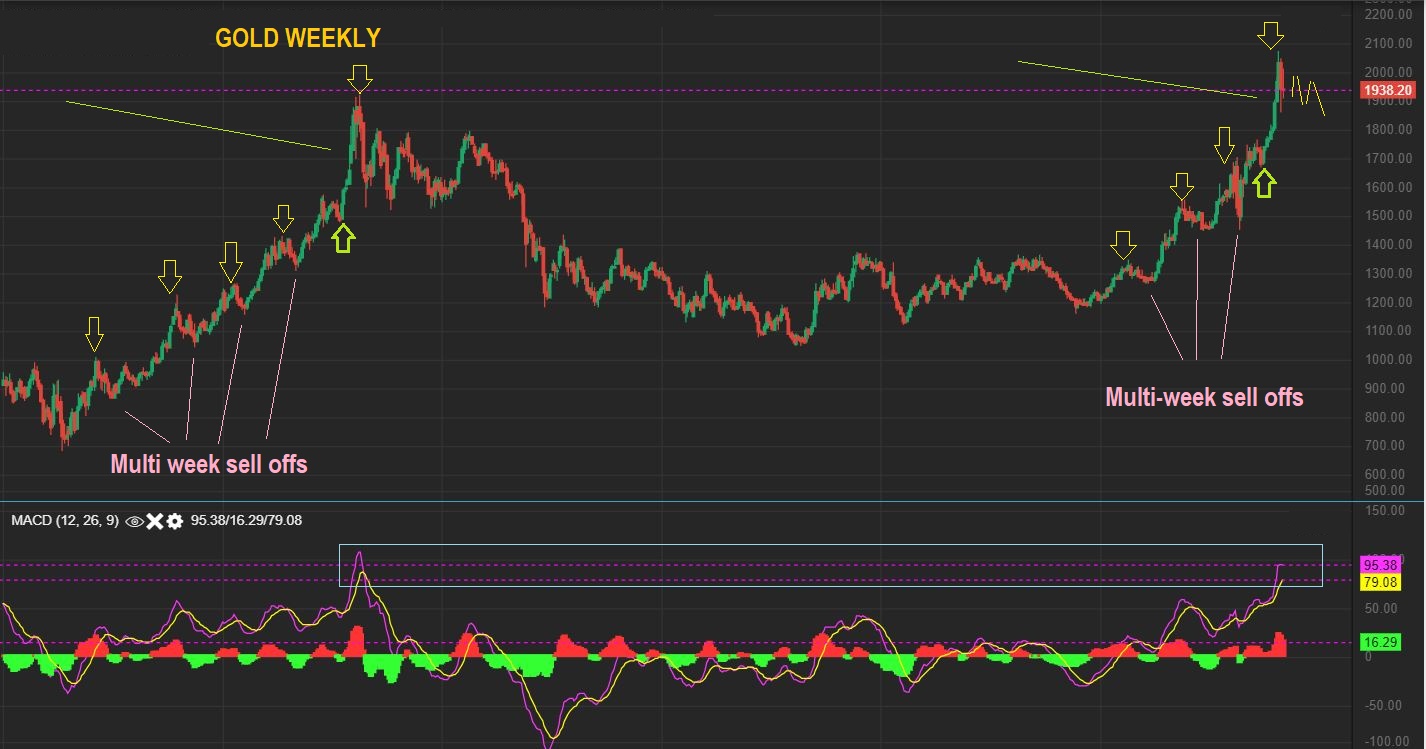
GOLD WEEKLY #1 -We do have a weekly reversal Candle. I think GOLD has peaked. Past reversal ‘peaks’ have stalled & then dropped with either a month or more of selling down to the ICL, or a sharp crash to the ICL. Will it be different this time. I seriously doubt it.
.
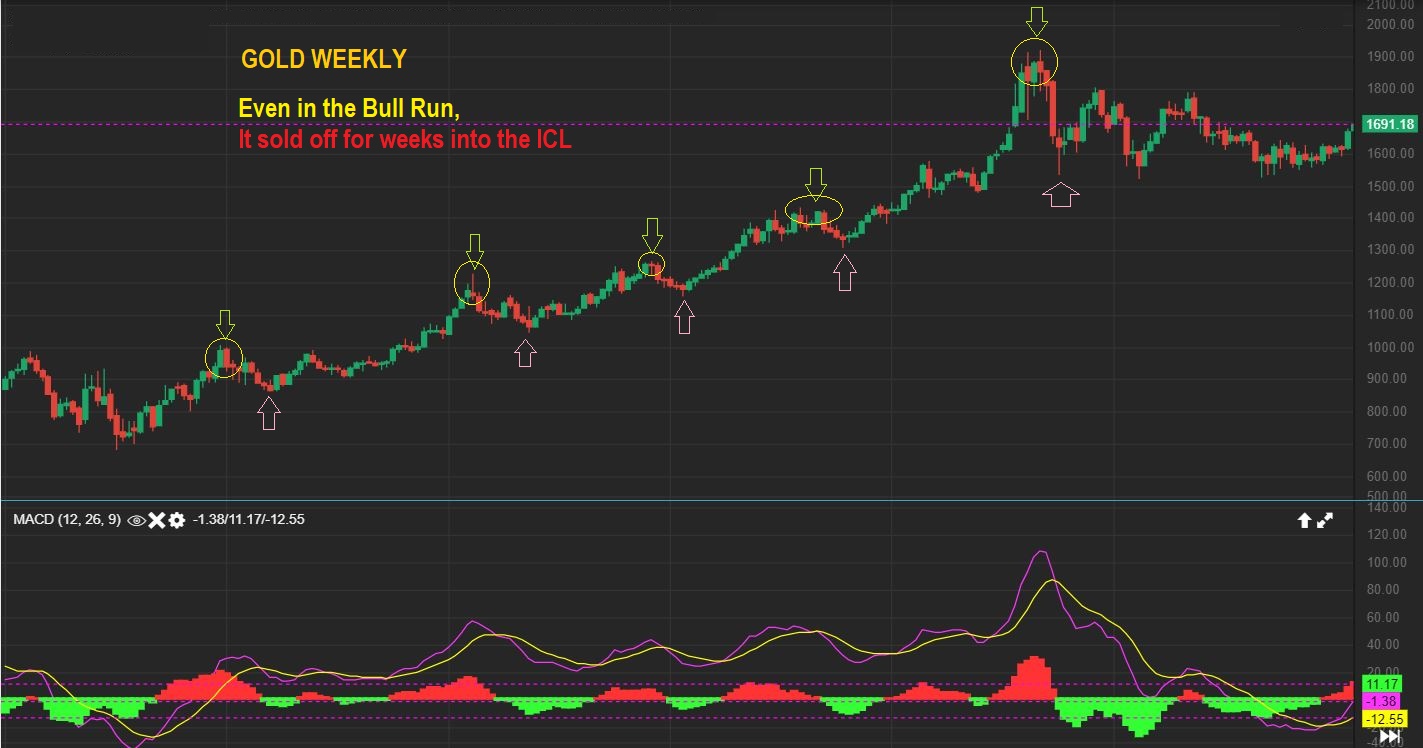
GOLD WEEKLY 2008-2011 Bull Run – Read my chart & look at these examples of ICL Pullbacks ( I missed one right before the parabolic ramp up). We learn from past experience.
.
GOLD WEEKLY – I’m just going to make this next much hated statement and move on, 🙂 because it does occur to me every time I look at the long term chart…
” This straight up rally actually looks very similar to the end of that 2008-2011 run at the Yellow arrow.” Ok, don’t hate me for saying it, but I have looked at this chart last week & this week and it was the first thing that pops into my mind, so I just had to say it. I’m not lying when I say that, but I’m also not saying that they are the same and will end the same. They are nearly twins, but circumstances are a bit different. I do think that we will take a rest and we are due for a drop into an ICL.
.
GOLD WEEKLY – So taking another look at this chart, Golds rapid rise & one week sharp drop should indicate that we are ready for a consolidation, and that drop into an ICL that could take weeks. We could have 1 or even 2 entire daily cycles into that ICL, and that would be a September or even an n OCT low. U.S. Elections? US Dollar topping after its 2nd daily cycle? We’ll see.
.
SILVER WEEKLY – I Pointed this drop as a possibility over the past 2 weeks, and it is still a possibility that I will be looking at. This is just a rough idea though, nothing exact. A gradual Bull Flag drop in Silver could do this. 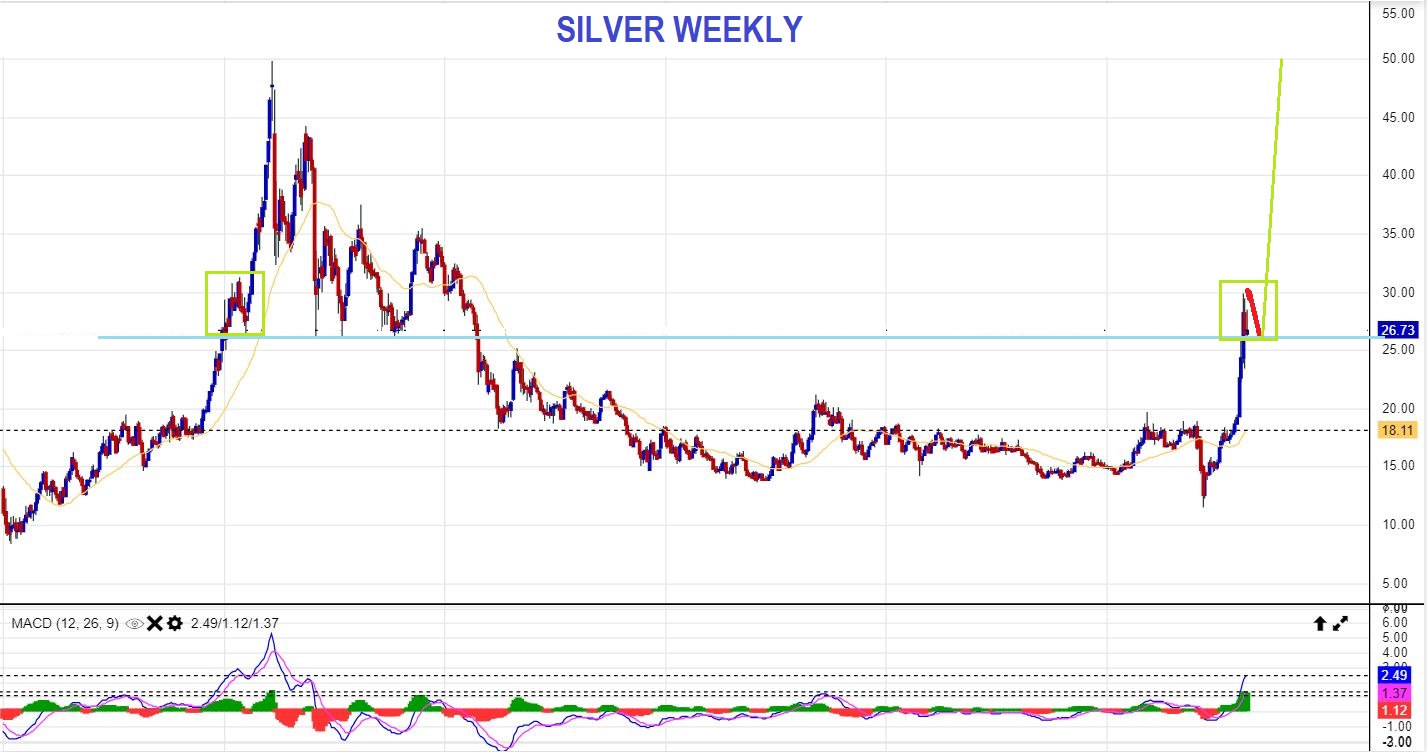
.
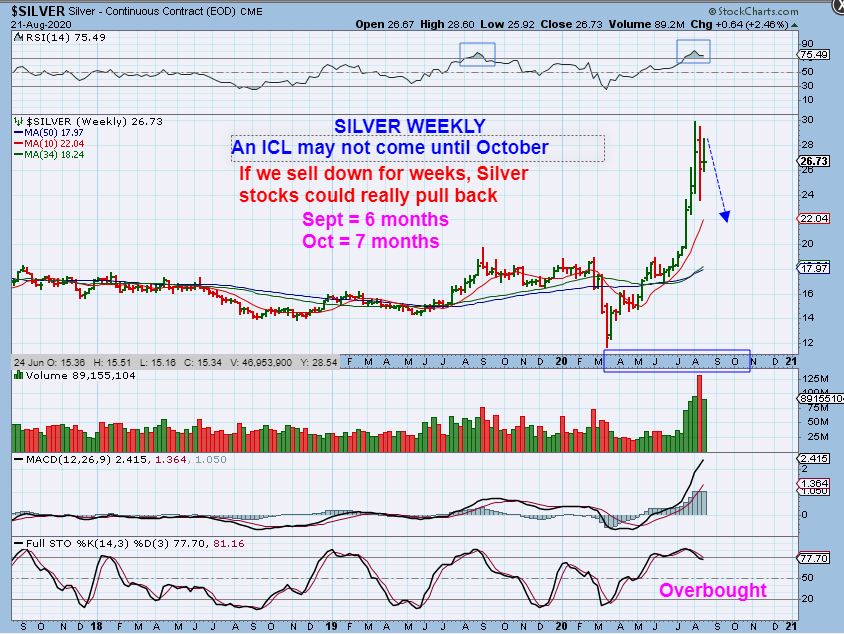
After discussing Golds possible drop leading into October for an ICL, we have to think: “What if Silver ends up taking 2 daily cycles into October for an ICL too?”
.
SILVER WEEKLY – Can Silver just chop very wide and make a giant Bull Flag here? Yes, that may be more of the idea mentioned in the chart Above that we first considered. Now we also need to understand that Silver could drop sharply into an ICL and remain bullish too. Read the chart. An ICL came in March, so Sept = 6 months and October would be 7 months .
.
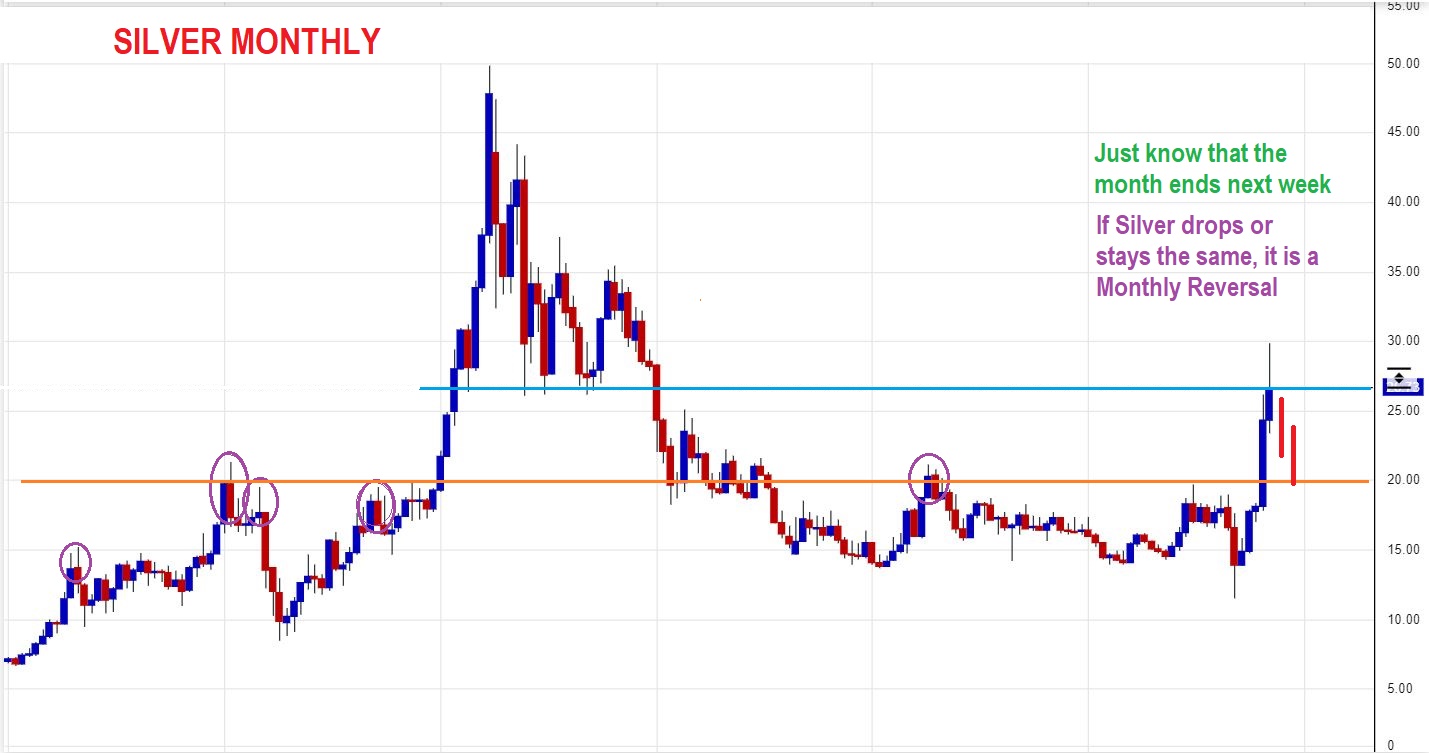
It is 1 Week too early to look at Monthly charts, I agree,  but please indulge me as I try to picture and plan for the future.
WHAT IF Silver just chops sideways or drops next week?
.
.
SILVER MONTHLY– We have a Monthly topping candle if we go sideways, and it only gets worse if Silver drops from here. A Sept pull back ( 1 daily cycle) and (an Oct daily cycle into an ICL) might look more like this. This would be totally normal in a Bull Market too. A back test of the recent break out.
.
.
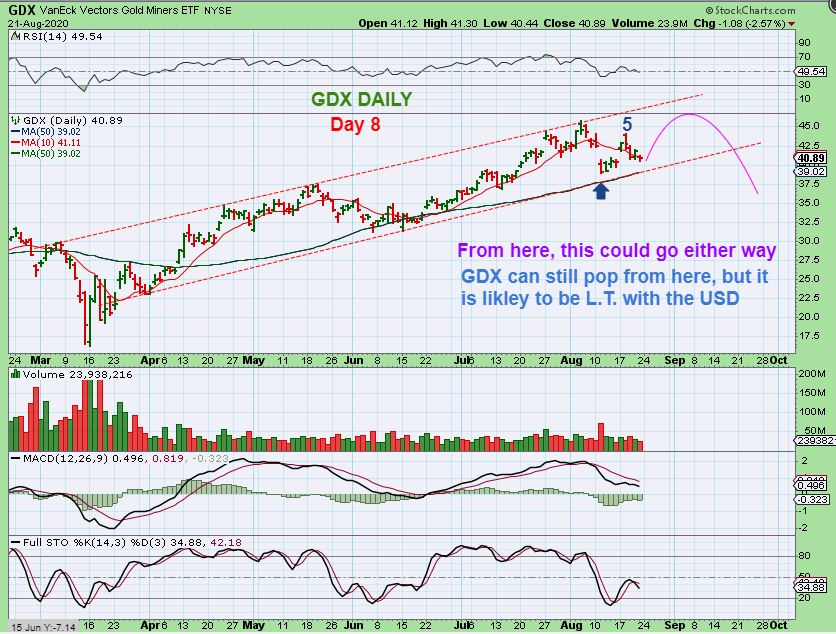
GDX DAILY – We are on day 8 and the peak can come on day 12 or so too, so yes- this can go higher as drawn. I keep in mind that the MACD remained weak even with that recent bounce. The USD may be bottoming, Gold seems to have pealed. I STILL EXPECT IT TO BE A L.T. DAILY CYCLE, AND IT SHOULD EVENTUALLY ROLL OVER, breaking that lower trend line.
.
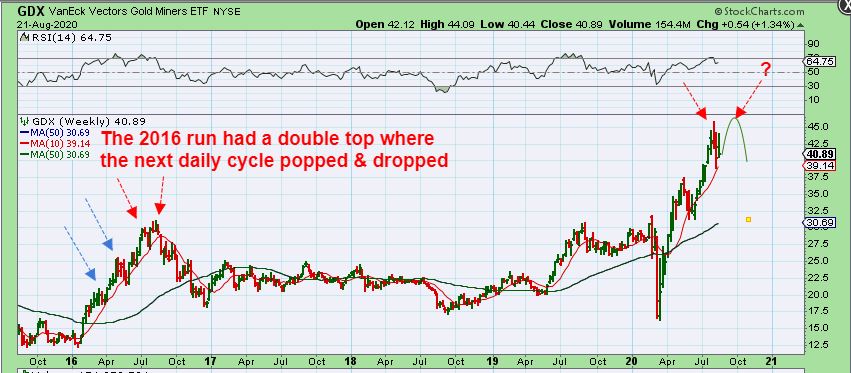
GDX WEEKLY – Reminder: Last week I pointed out that in 2016, the rally topped with a double top due to a daily cycle breaking to new highs and rolling over too. So any rally next week would be considered by me as a short pop.
.
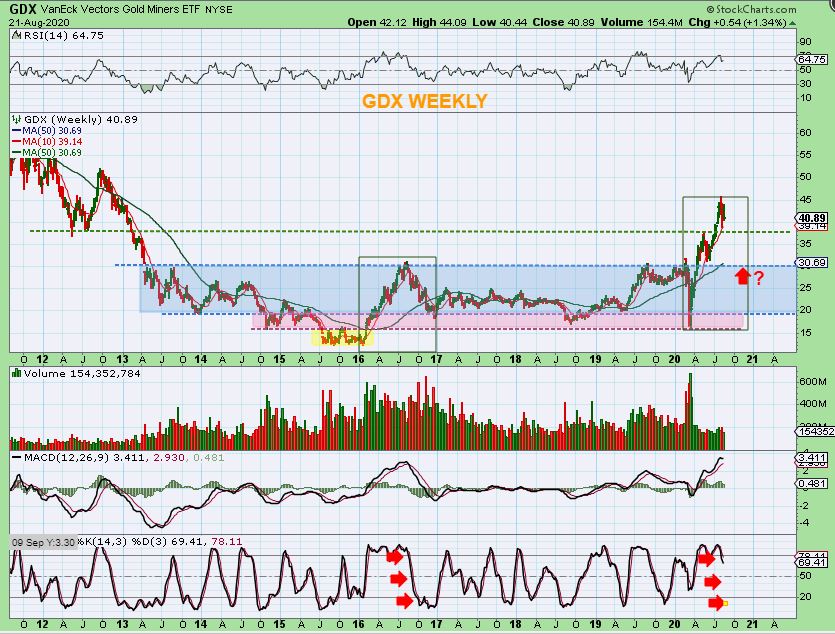
GDX WEEKLY BIGGER PICTURE – Can this really drop to $30 where the red arrow is? It could. That is a normal 50% drop, so even though it may not go there, I just need to show that it could. 2 daily cycles lower into October would do that to the GDX in my opinion. We are overbought on a Weekly Chart.
.
Look at that 2016 drop on this chart. It was quite a bit more than most thought it would at that time too. We had daily cycle after daily cycle lower.
.
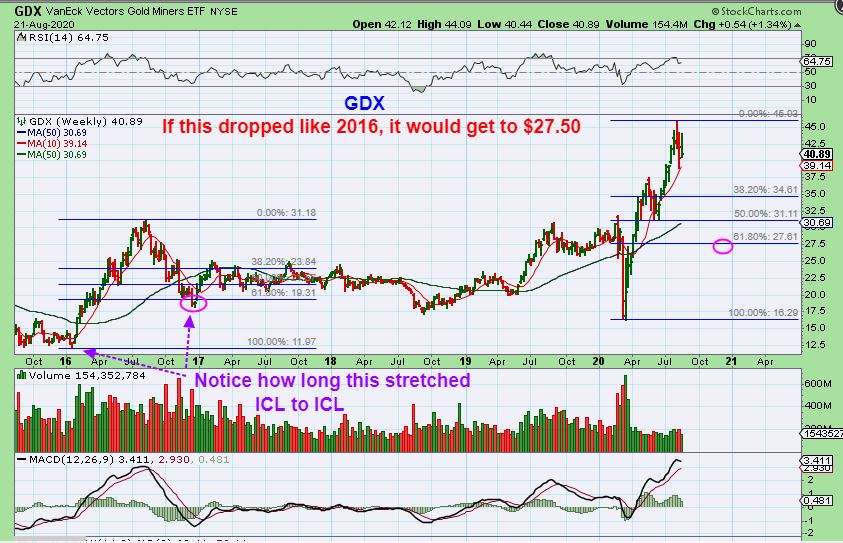
GDX WEEKLY 2016 – That 2016 intermediate cycle really stretched ICL to ICL. We saw an ICL in Jan 2016, and the next wasn’t until Nov- Dec 2016 ( Purple arrows) . You can somewhat see 6 daily cycles, 3 up and 3 shorter on the downside too. If we currently dropped under 61.8% like that one did, we’d be at $27.50 and sentiment would surely be cleared. I personally think we may just drop to 38 or 50%.
.
So as a quick wrap up:
.
– The General Markets are running higher and could be in a runaway mode. We are late for a dcl, but that Nasdaq looks very much like the 2000 blow off top to me.
,
– Oil is slowly chopping higher, but not very strong, and Oil stocks are just too choppy at this point.
.
–The USD put in a divergence with a lower low on the daily last week, and the weekly chart is a Reversal low. It could be an ICL, that could drop Precious metals.
.
– Gold , Silver, and the Miners have reversals at the highs here. They are due for a drop into an ICL, and to be clear, I’m not talking about a buying opportunity after this week. We are on day 8 of a possible 33 or so daily cycle. And if the USD put in an ICL, it can have 2 or 3 good daily cycles, and that can extend Golds drop to October.
.
I will, of course, continue to cover all of this in the day to day daily reports. That means that as usual, we will be right on top of things with a flexible plan as these daily cycles unfold.
.
For now, rest up, stay safe, and enjoy your weekend !!
.
~ALEX
.
The past week of day to day trading was a bit boring. For me, it was also met with a couple of paper cuts too. I mentioned that the last 2 weeks of August can be the hardest, since things often get choppy, Big Traders take vacation, etc.
.
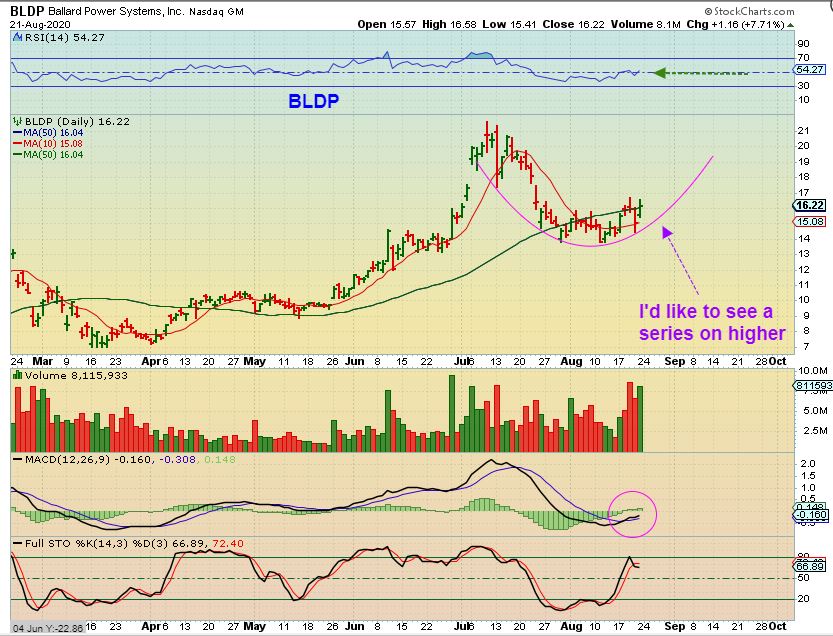
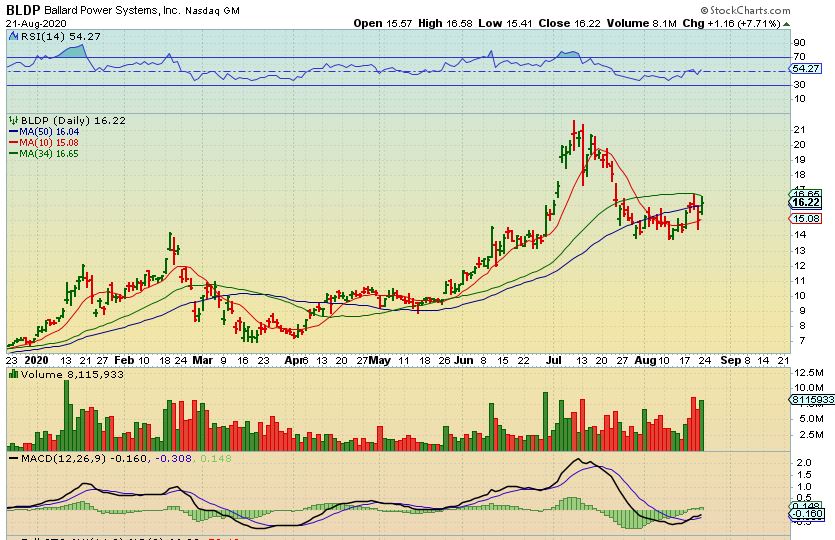
I really liked the set ups on FCEL & BLDP. Great set ups in a good sector, but as you can see from this BLDP chart, it got choppy. It still looks great, but I had a mental stop under the 50sma & Thursday it dropped over $1 so I simply sold it. Yes, it successfully shook me off Thursday, and then spun around Friday and pushed higher again.
..
Side note: I did decide to climb back on Friday at $16.15 , but why? Simply because the MACD crossed higher, the RSI is pushing the 50% area, and price pushed back above that 50sma. The chart is good. Lets look again…
.
BLDP – So I’ll give it another try, but my position size is small enough that my stop will be placed even lower under Aug Lows. It is still a good set up and Volume is increasing. The last low that shook me off matches a round bottom, as shown on this chart. I now hope to see a series of higher lows.