Tuesday August 11th
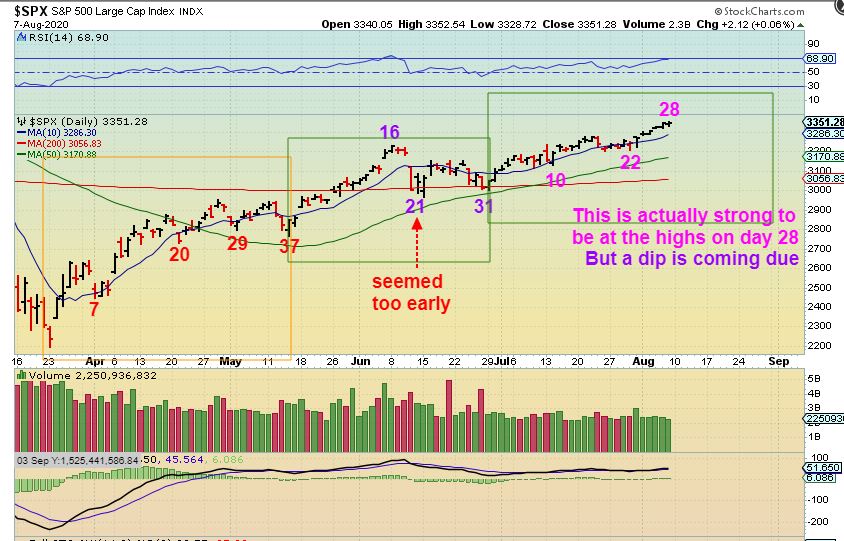
SPX DAILY COUNT FROM FRIDAY – This chart is simply to show you that the first daily cycle lasted 37 days, and the 2nd daily cycle was 31 days. That would put us on day 28, and that is late in the 3rd daily cycle. We may be coming due for a dip soon. Please read the chart.
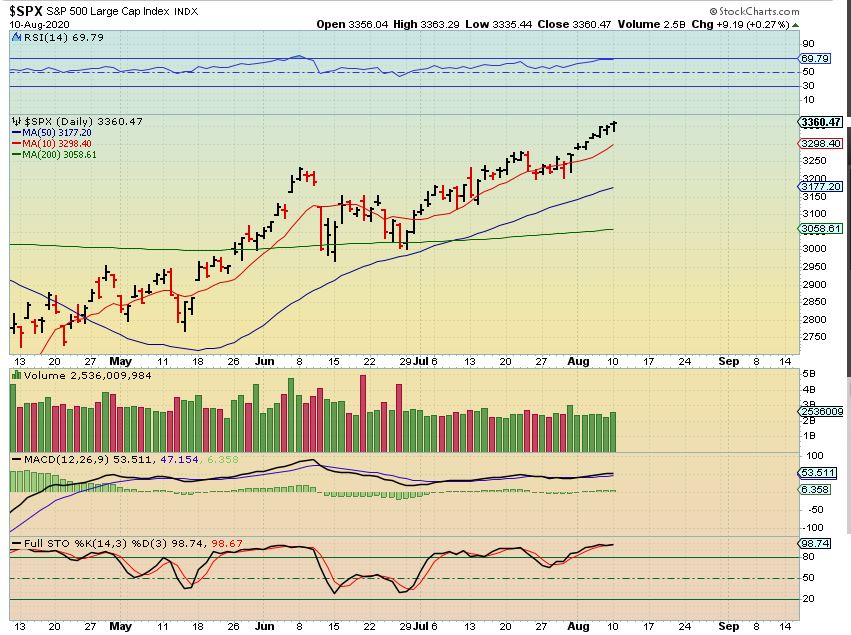
SPX DAILY – So we would now be on day 29, and the markets sold off and recovered again. We are also now at a new peak, so there is strength in this market. This has been a nice run out of that 1/2 cycle low and buying power keeps pushing it higher.
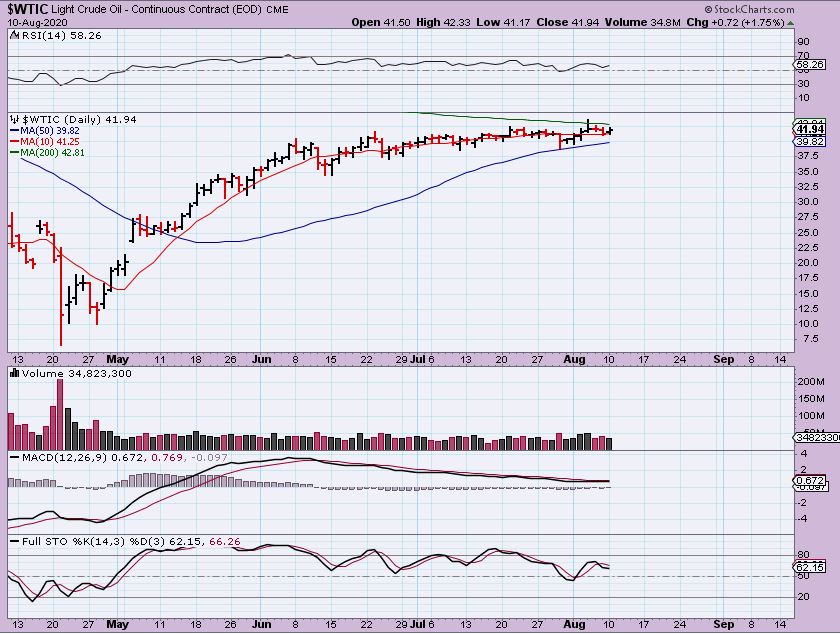
WTIC DAILY – Oil moved higher, closer to the underside of that 200sma, and does look like it wants to break out. In the last report I mentioned that the XOP (Oil / Energy sector) looked to be shaping up ahead of Oil. Did the XOP continue higher?
.
THE OIL / ENERGY STOCKS LOOK SET TO GO. I HAVE BEEN POINTING THIS OUT FOR A WHILE AS THE NEXT POSSIBLE RELIABLE TRADE. DO YOU OWN ANY YET? I have mentioned my list of WTI, ERF, LPI, APA, AROC, SLCA, PVAC, BTE, and several more, so you can keep a watchlist.
.
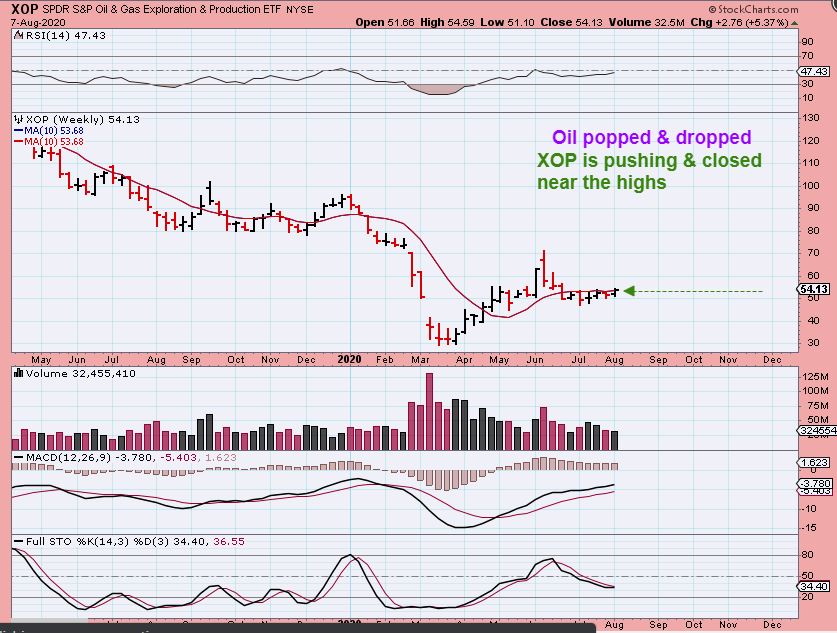
FROM THE WEEKEND REPORT: The XOP closed near the highs and closed above the 10 week MA, which is at $53.68. So Remember that number $53.68. This looks bullish, let’s take a look at something else. I then discussed AROC, SLCA, APA, BTE, etc …
.
XOP DAILY $55.49 an hour into trading Monday, still above $53.68 –I captured this after 1/2 hour of trading to show that The Sector was looking bullish. The XOP was above the red 50sma line. This would be a low risk buy with a stop.
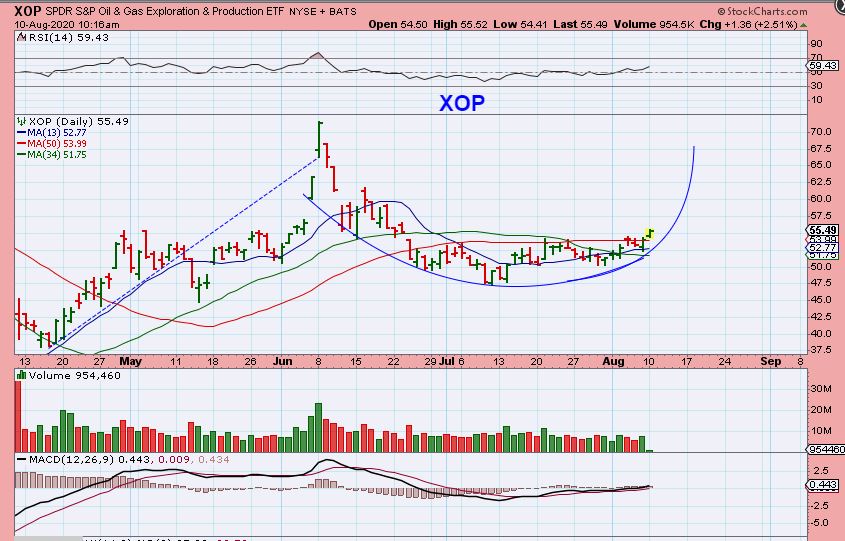
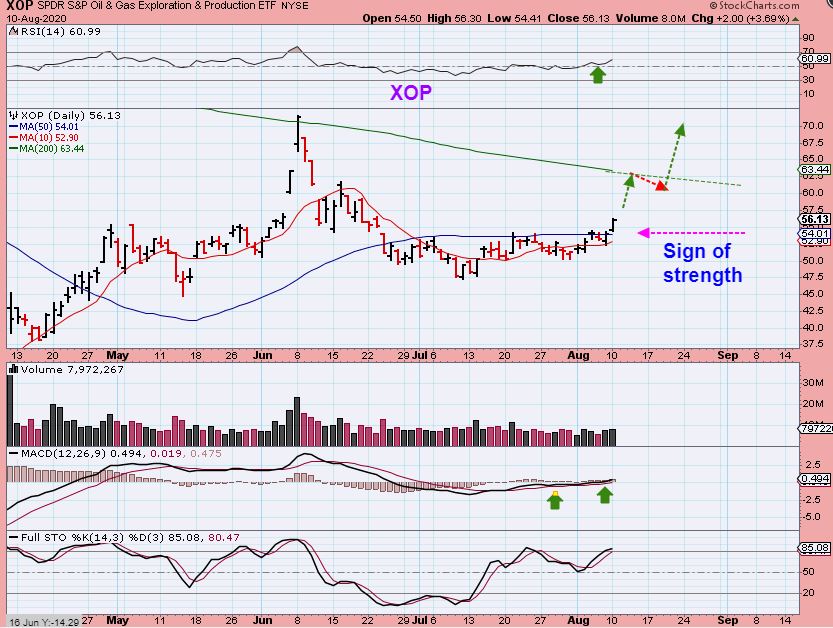
The XOP closed at $56.13, near the highs of the day and is no longer waiting for Oil. Oil & Energy stocks look good, and I will discuss that again at the end of the report.
.
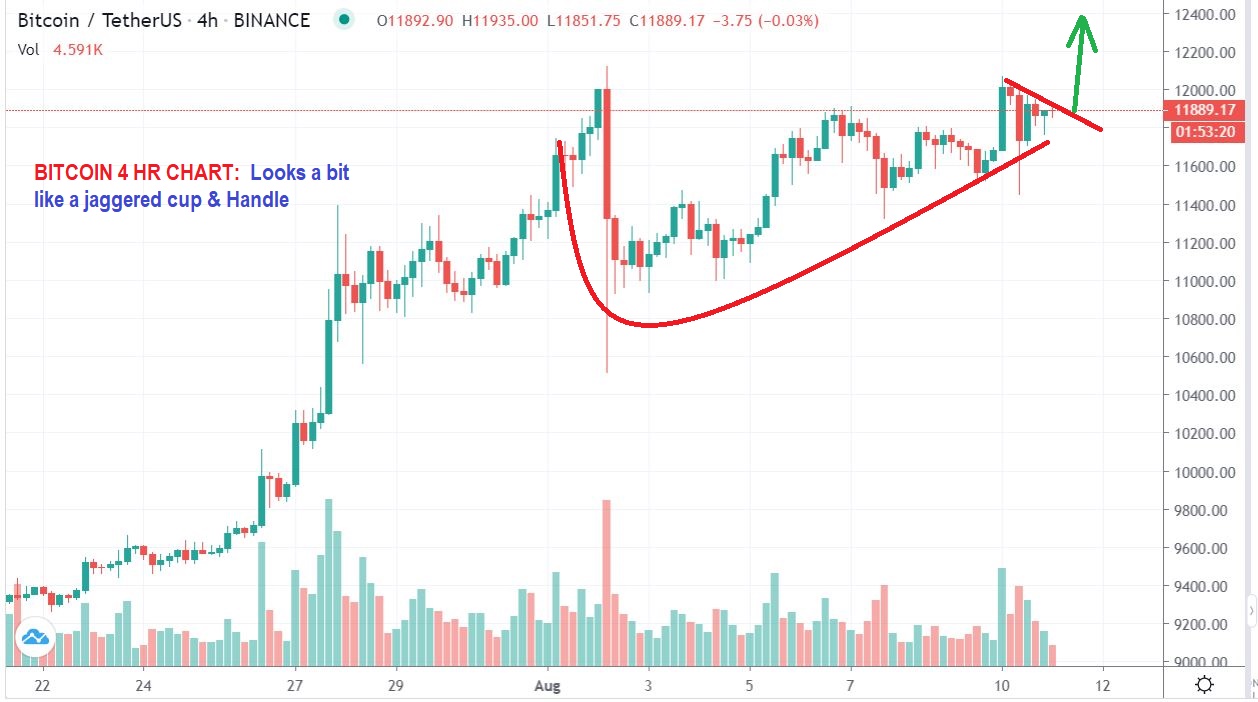
BITCOIN 4 hr chart – Bitcoin has an occasional slam down drop here & there, but step back to the bigger picture and it looks like a cup & Handle. I mentioned in the weekend report that I still expect Bitcoin to climb, so I am still in blockchain trades. If this breaks out overnight, I want to be in the trade, not chasing a gap open.
.
NOTE: RIOT released earnings last night, it looked good and the price held up after hours. Bitcoin dipped a little, and Riot dipped a few cents, but the reaction to earnings is behind us. Hopefully, No dreaded public offering is in the works.
/
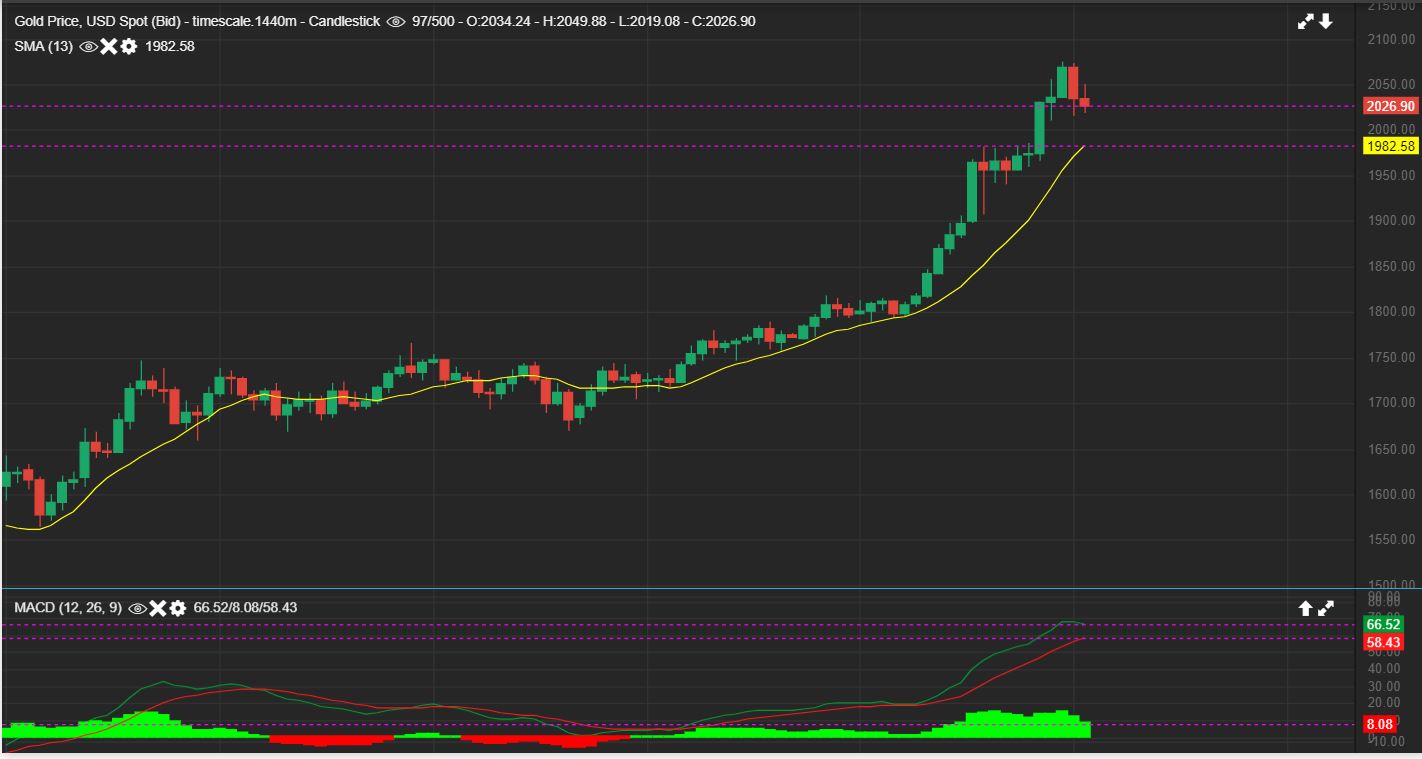
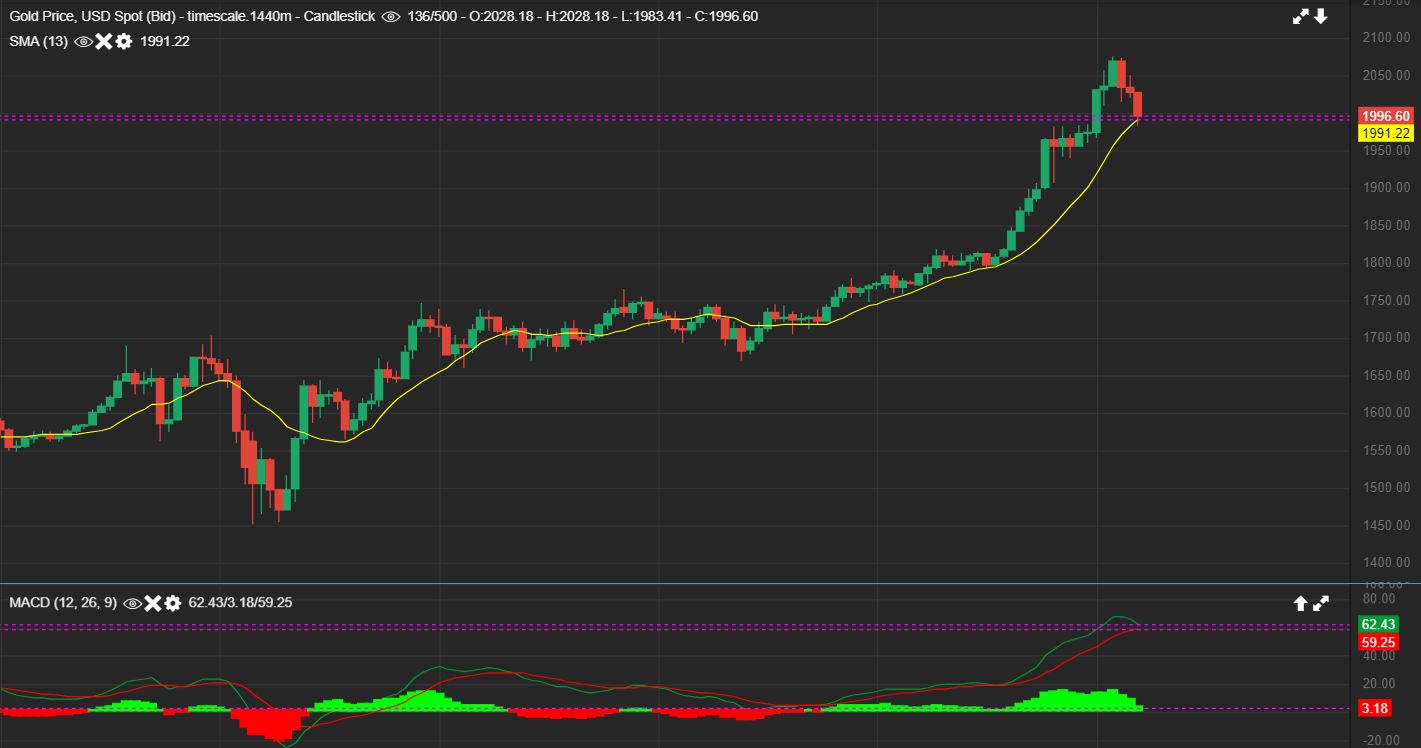
GOLD DAILY – Gold is pulling back mildly so far
.
EDIT: 5:30 a.m. Eastern Tuesday: Gold has now fallen to the yellow line 13 sma over night .
.
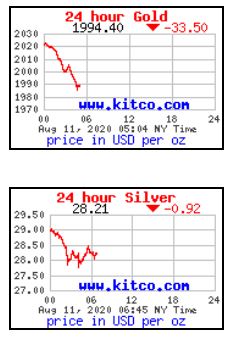
AS I PROOF READ, THIS IS WHERE WE ARE AT…
GOLD down $33.50 and
SILVER down almost $1.00
.
.
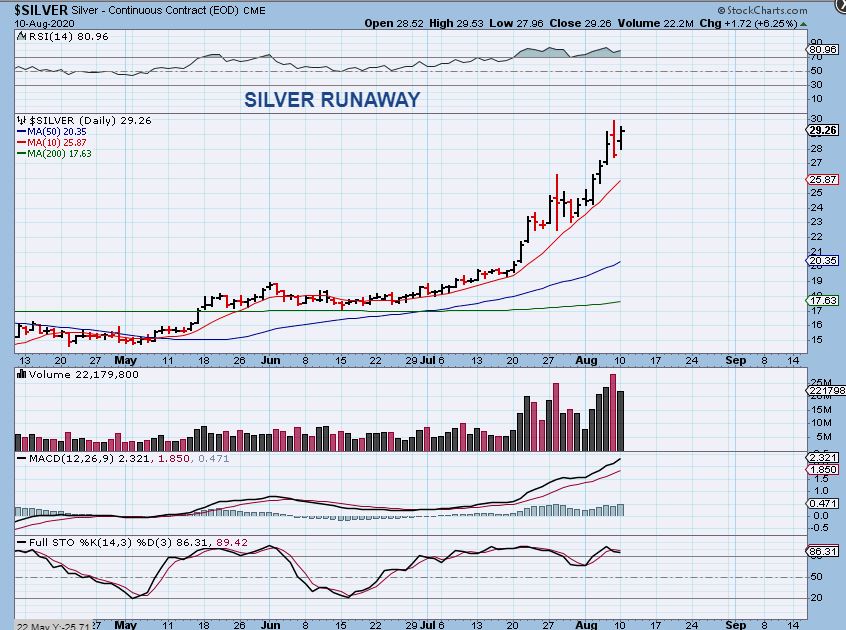
SILVER Dropped Friday and popped higher Monday. It looks like a runaway attempt. ( Edit: Silver dropped overnight and so far just looks like a Bull Flag, but these drops may affect Miners, since they are already dropping before Gold & SILver, they were leading the way ).
.
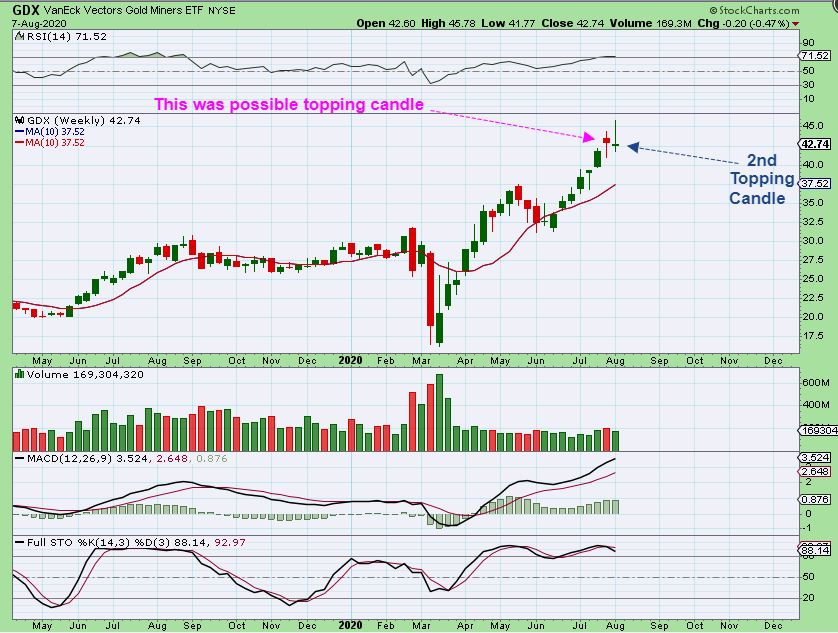
WEEKLY GDX FROM THE WKEND REPORT – Last week GDX put in a topping candle. This week it ran up and dropped again, putting in 2 topping candles in a row. REMEMBER: THIS HAPPENED AS GOLD & SILVER CONTINUED HIGHER. GDX DID NOT, SO MINERS MAY BE LEADING THE WAY LOWER. I did have $45 as a target a few weeks ago…
.
So the Miners as a group, seen here with the GDX DAILY, dropped again on Monday. It actually regained that 10sma early on, but sellers took over and it closed below that 10 sma again ( also turning it down). So day 38 may have looked like a dcl drop, but I didn’t label it that way. This is looking more like one with that trend line break & 10sma curl downward.
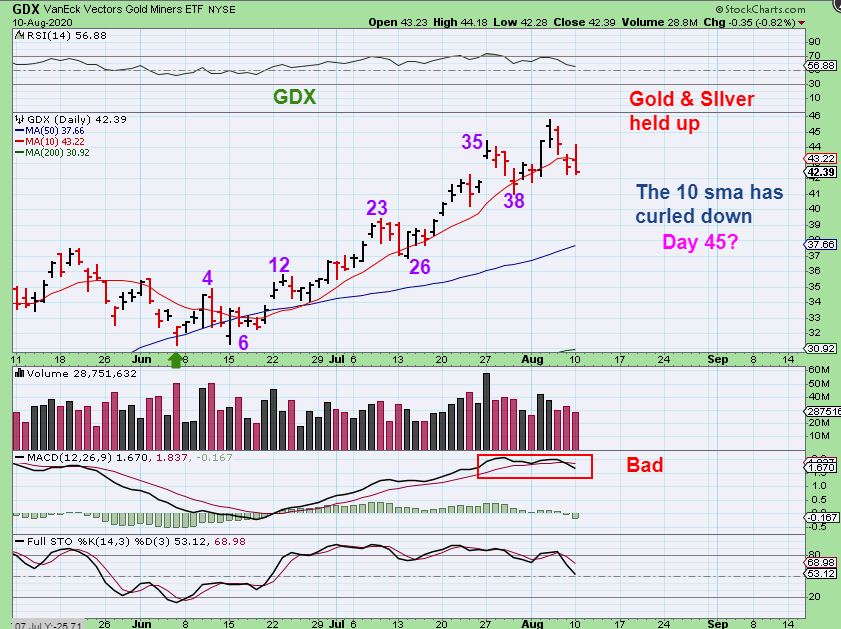
EDIT: GDX same chart: At this point, you wouldn’t expect the dip to be a deep drop, since it is late in the daily cycle. Now that Gold & Silver did drop last night, this may drop further and we can look for a reversal. I had mentioned over a week ago that in 2016, we had mild dips that were just choppy, so we should expect some chop here. That is exactly what we are seeing. I also said that during this time, individual Miners could do their own thing, and we are seeing that too.
.
The General Markets are due for a dip, but each time it starts to pullback it still closes higher. It is due though.
Oil is pushing toward the 200sma, and should break out, since
Energy stocks are leading the way higher ( and they became a buy).
Gold & Silver pulled back over night, and
The Miners were leading the way with 2 weekly reversal candles shown in the weekend report. Basically GDX had a pause at $45 and dipped, and that was expected to a degree. It is possible that since GDX & GDXJ started the pull back, they will bottom first, and we will look for the formation of a dcl in the coming days.
.
~ALEX
.
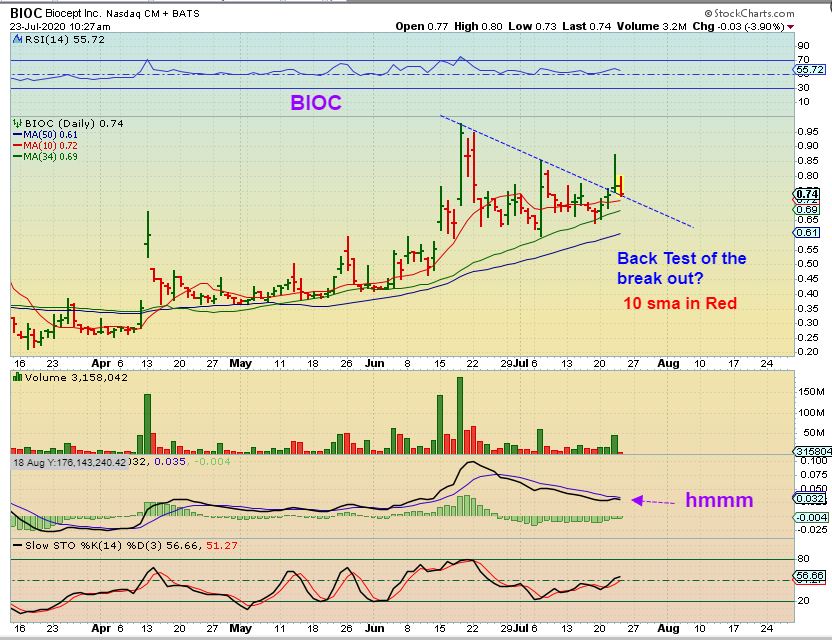
BIOC broke out and doubled from the most recent low, but I just wanted to pull up this older chart from the July 23 report to show you the pattern. This was the consolidation that broke out from that downtrend & then it back tested before really taking off ( $1.30). LOOK AT THE PATTERN.
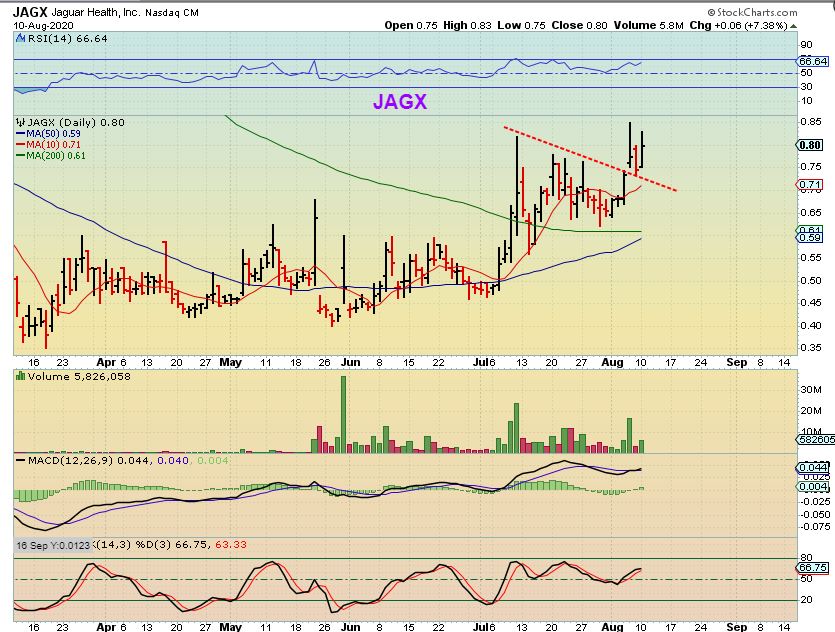
JAGX – This is the same pattern. Scroll up * See BIOC, scroll back and see JAGX. That doesn’t mean this will now instantly double off of the lows, but it is Bullish to break from a consolidations downtrend. The back test held at support, and JAGX pushed higher yesterday. Some of us have been holding this one as a swing trade for a long time. I have been in it from the blue 50 sma line. So far it is paying off.
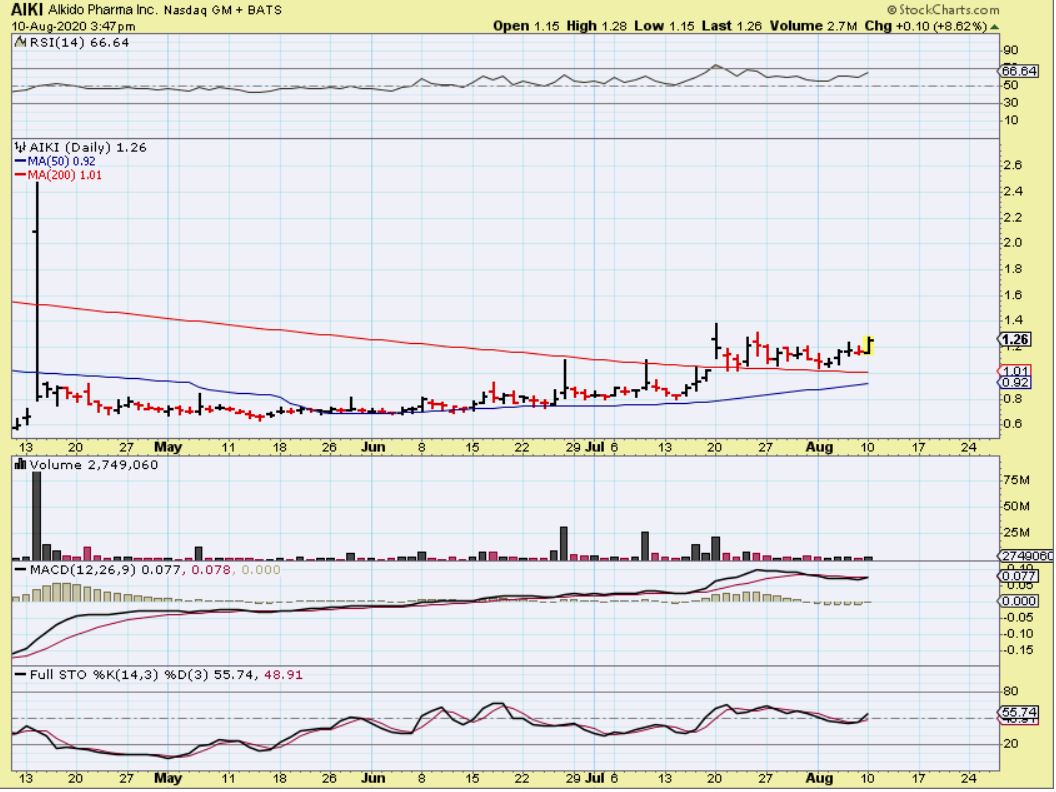
AIKI – So I pointed out this very similar pattern on AIKI yesterday in the live area (similar to BIOC & JAGX). I own this as a swing trade too. With such a long tight base, this only needs some good news , buyers jumping in, shorts covering to really get going. Bad news could drop it to the 50sma.
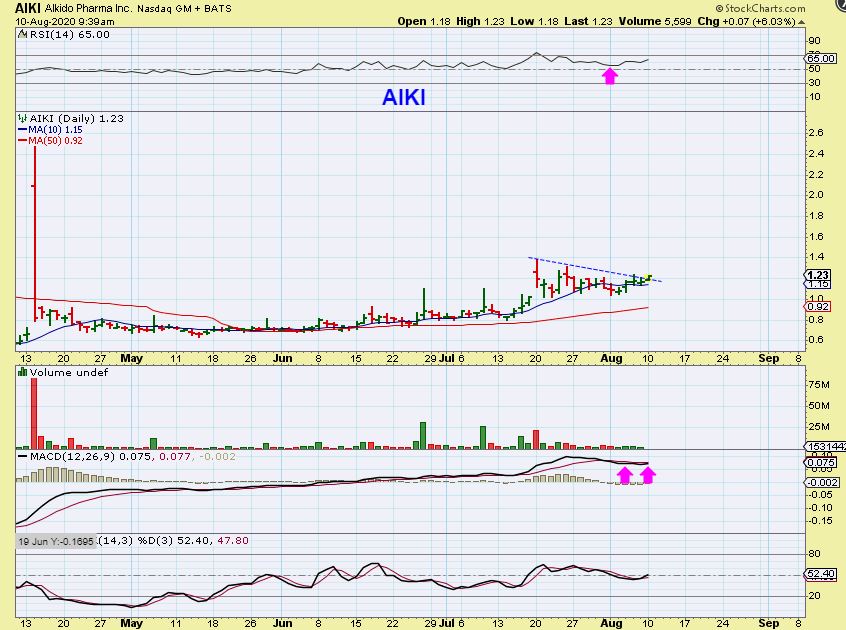
AIKI – It closed the day up near the highs of the day, up over 8%. Look at the set up using the 50sma, and then the 200sma. It just needs a spark, in my opinion, but that could happen today, it could be next week. That is how swing positions go.
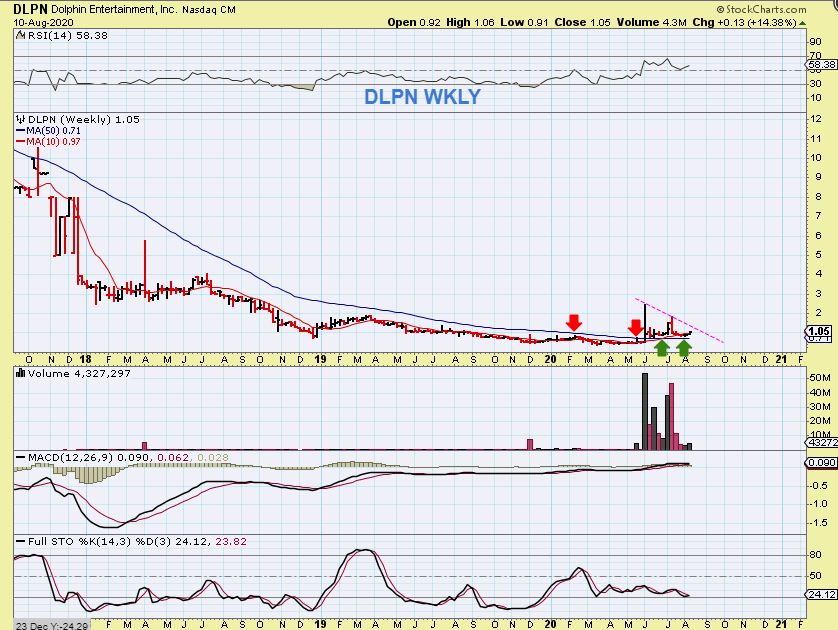
DLPN – I do not own DLPN, but we traded it before and caught a nice pop. It popped yesterday (14%) and may be starting to show signs of life again. I probably will not buy it, but that is because I have more than enough open positions in my trading account, but…
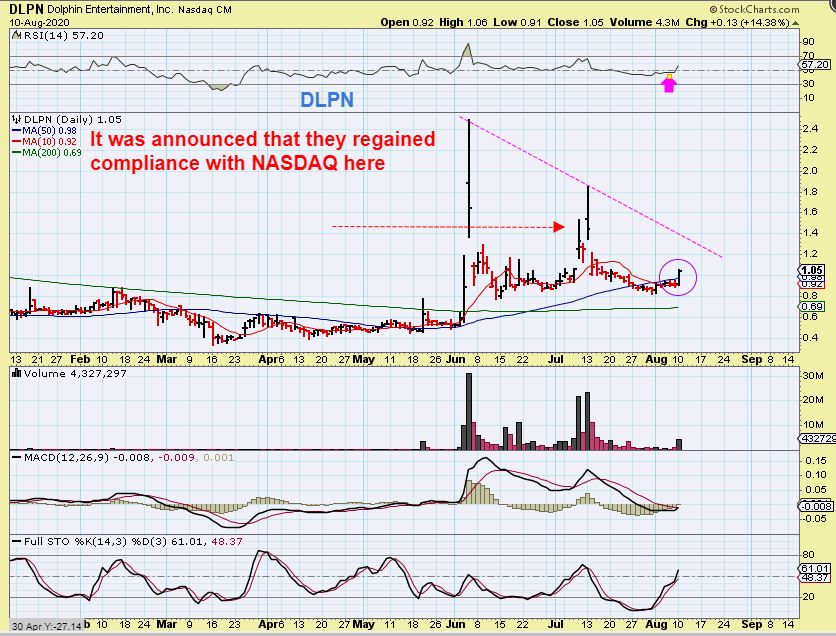
DLPN – I do love the longer term set up, so I will keep my eyes on it ( On my Watch list_ That’s why I saw this pop).
.
ENERGY TRADES ARE RECOMMENDED : I want to just add the little warning that lower priced companies under $1 ( or even a bit higher) may need money and could do a public offering, but some have done that already and may now be fine cash-wise. You can always look up the companies financial ( Due diligence) and see if they have cash on hand.
HLX filled the gap and reversed. I bought this one at the open and posted this in the live area.
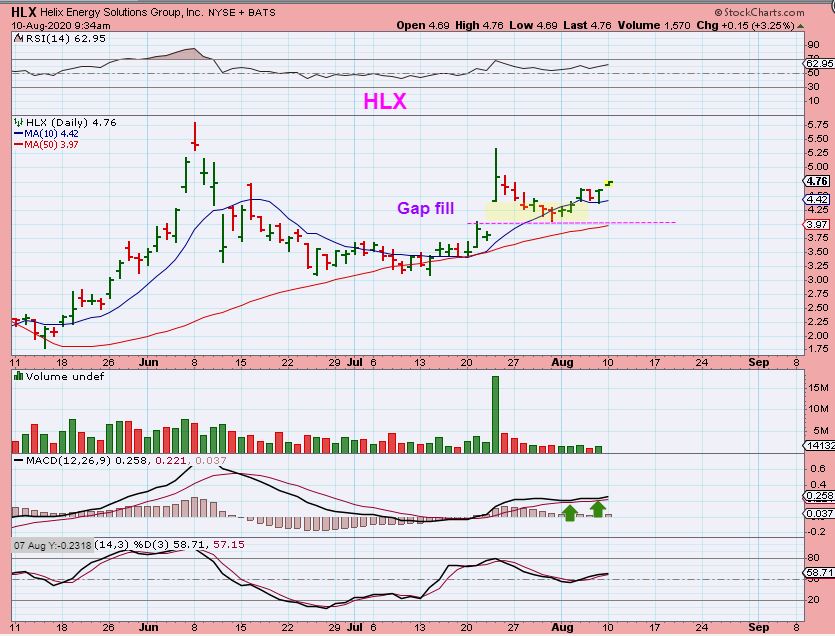
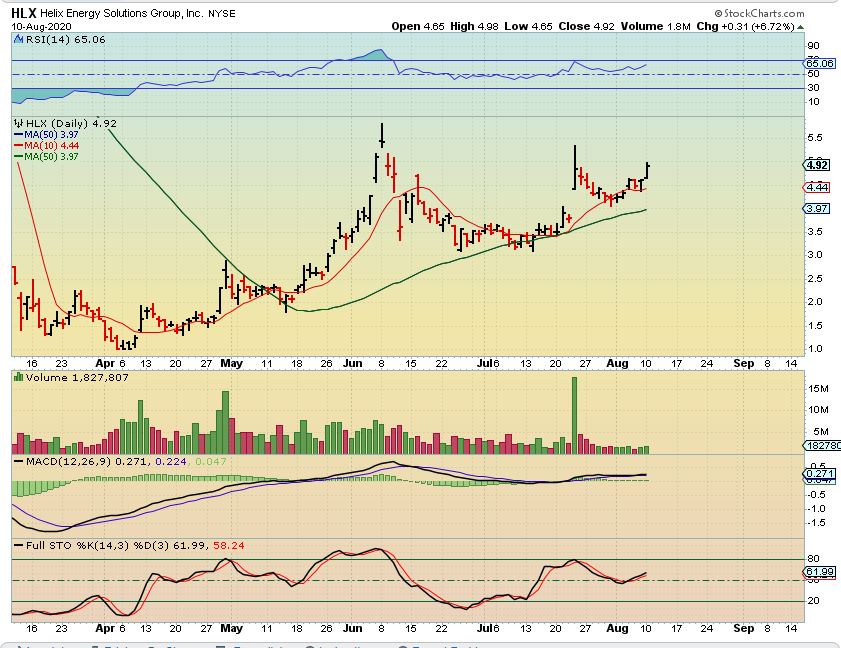
HLX closed up over 8% too, and these do look bullish.
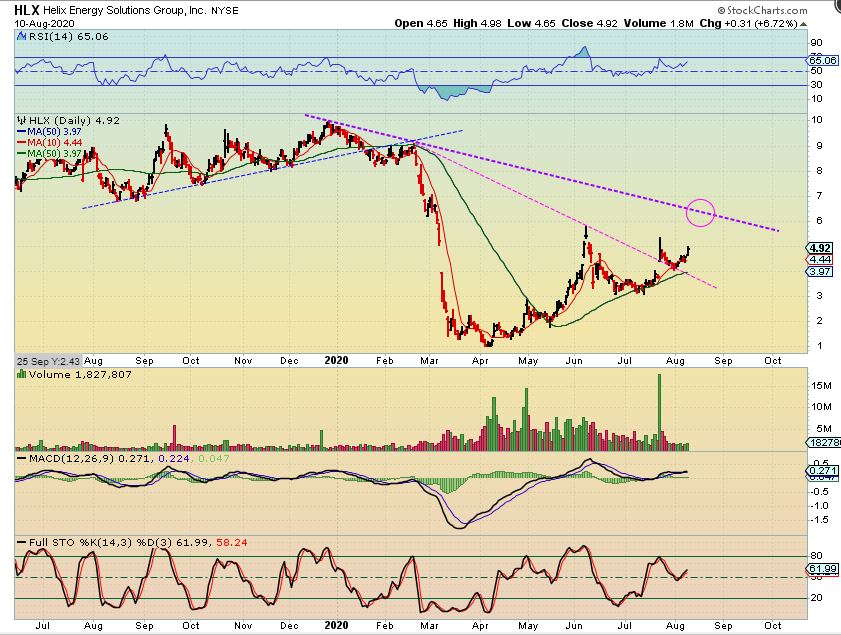
HLX – I always take a step back and look at the big picture to see what may be happening. That gap open looks like a break out & Back test, now it could run to the next downtrend line near $6.50 and it may just break out and keep going. HLX ran from $1 to $6 out of the April lows, I traded it quickly then.
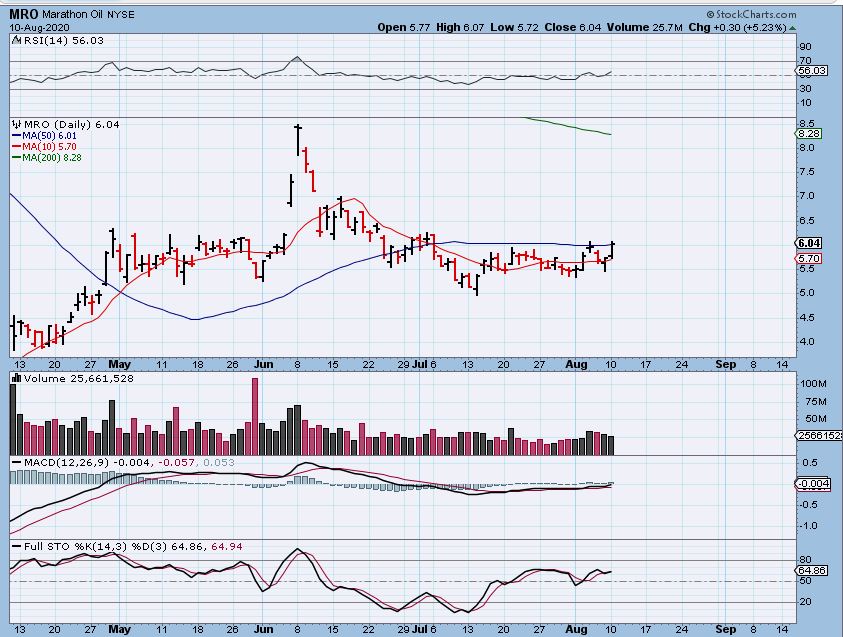
MRO was recommended as a buy last week, as it pushes on the 50 sma. I think that it is ready to break out, it closed 3 cents above the 50 sma 😉
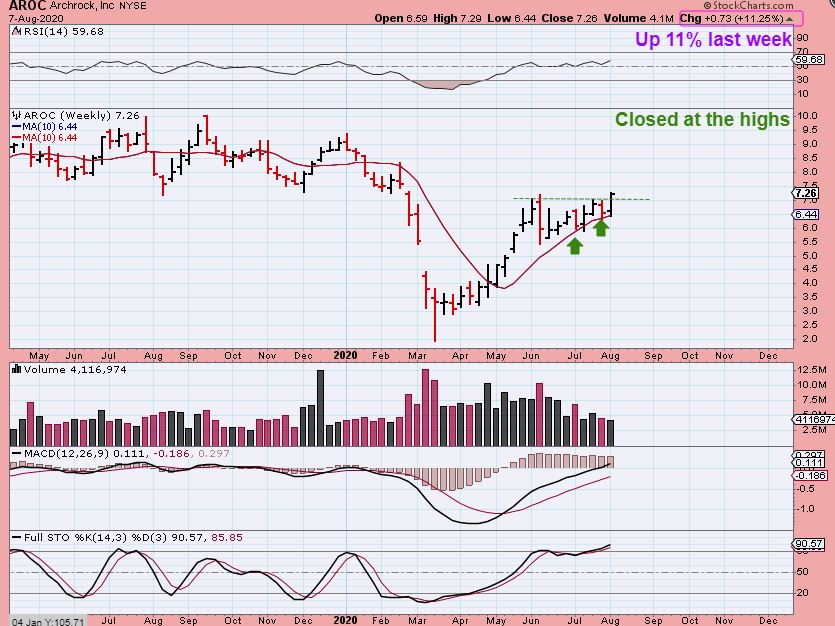
FROM THE WEEKEND REPORT : AROC – Aroc is at new recent highs and closed up 11.25%. Nice Gain. This is a Bullish set up and can still be bought.
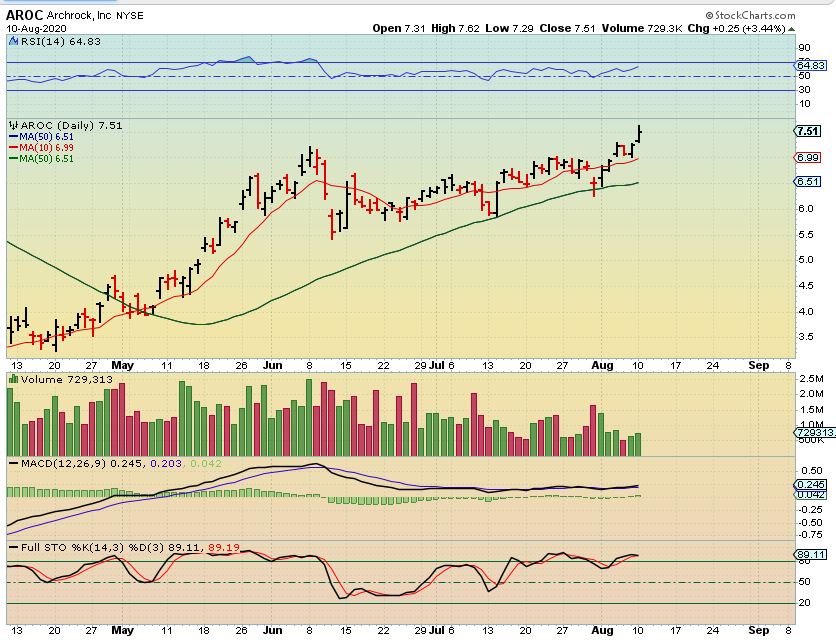
AROC was up another 3.5%, and if it does this for 4 or 5 days, that would be another 15- 17% week of gains ( I do expect a few down days & pull backs, but last week this was up 11% after being recommended here too). This 2 month consolidation should lead to a nice trend higher.
.
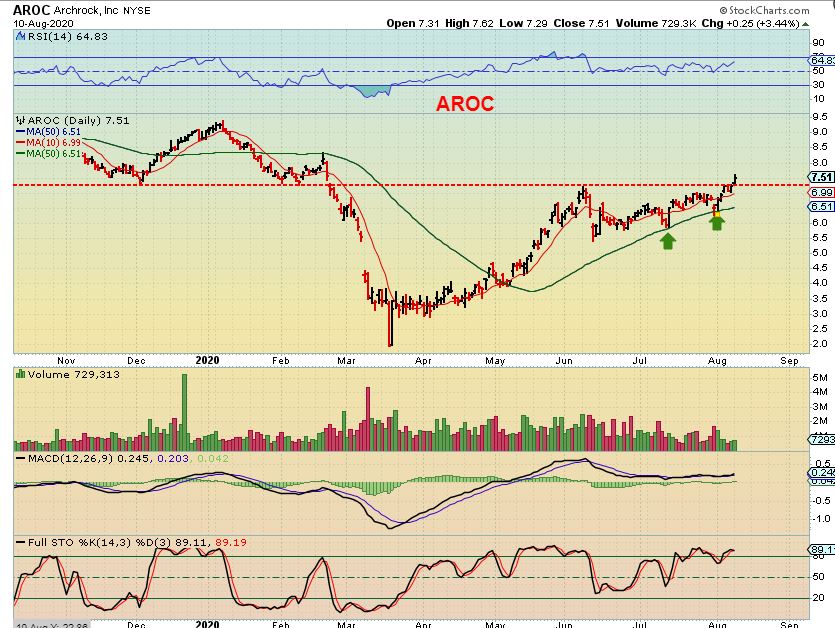
Aroc – Step back and you see that the consolidation built up energy for this one to try to break through resistance and allow it to trade higher. It is breaking into that area now.
.
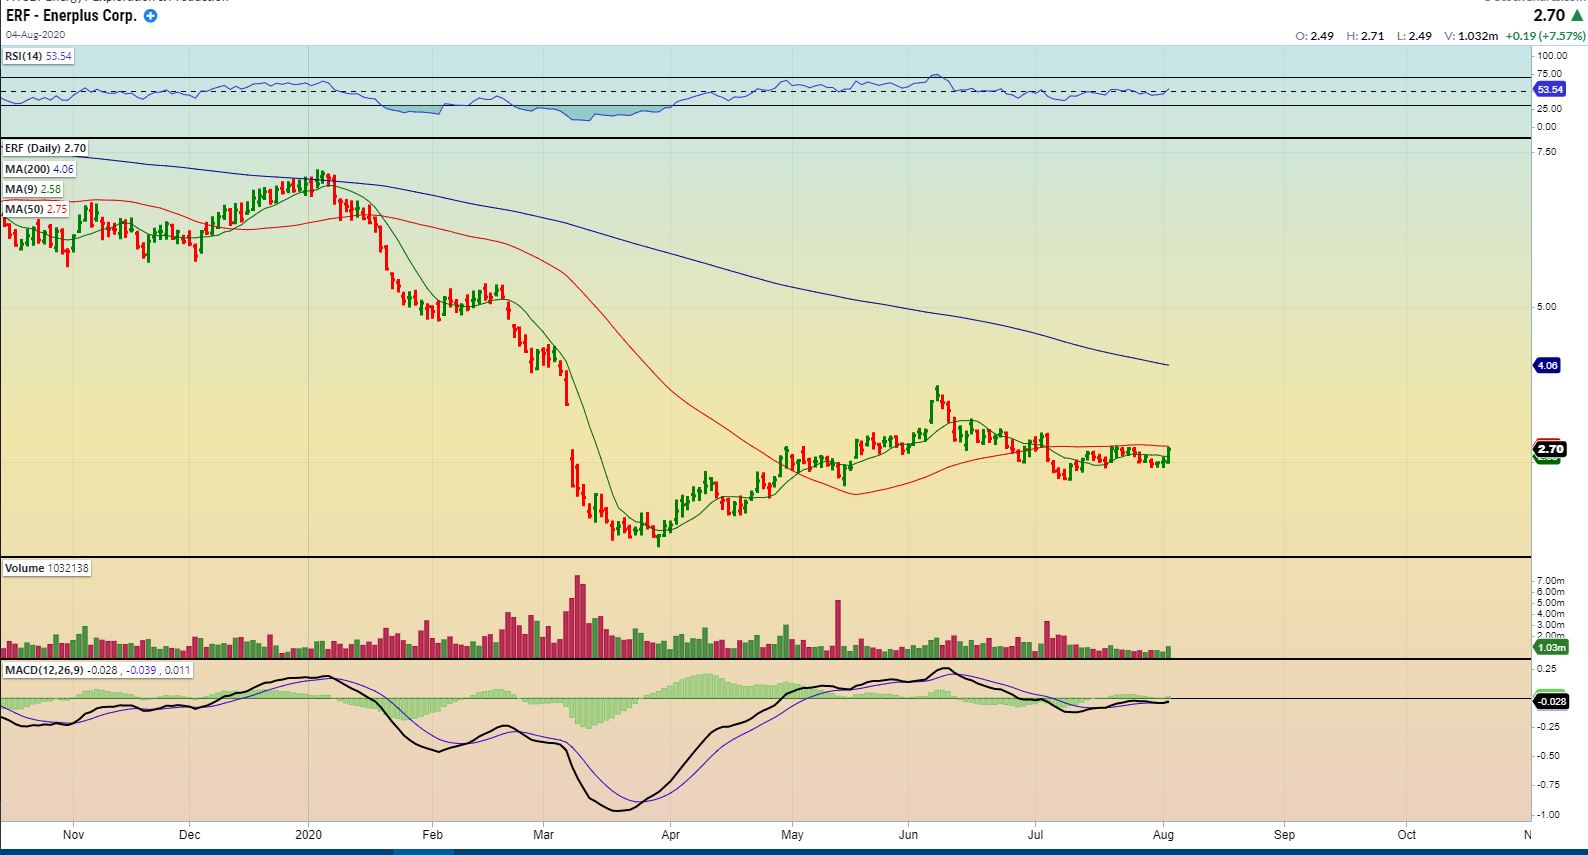
ERF – I pointed out the bullishness of ERF on August 5th ( last week). It looked set to break out as it pushed on the 50sma at $2.70. Volume was starting to grow, this was I still is a buy…
.
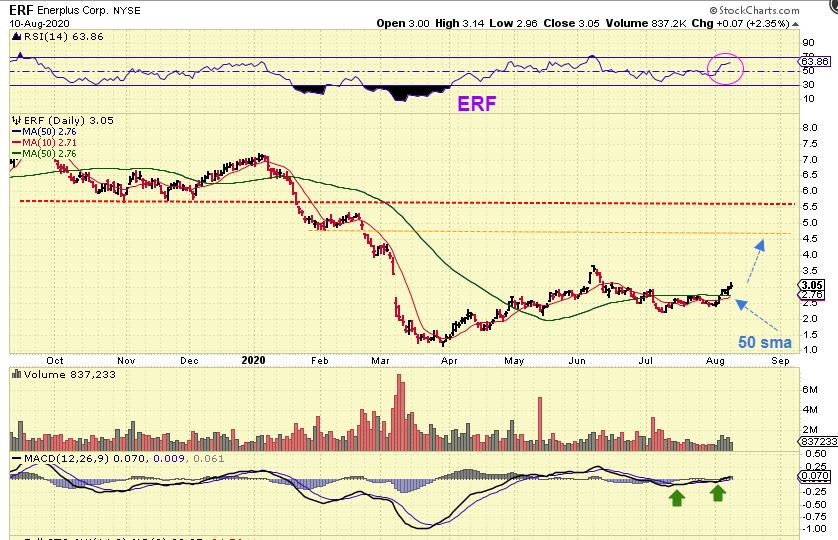
ERF – is still a buy now that it broke above that 50sma. It is $3.05 so it is starting to pull away, and we like to buy low near support and sell high, so this one has made progress.
.
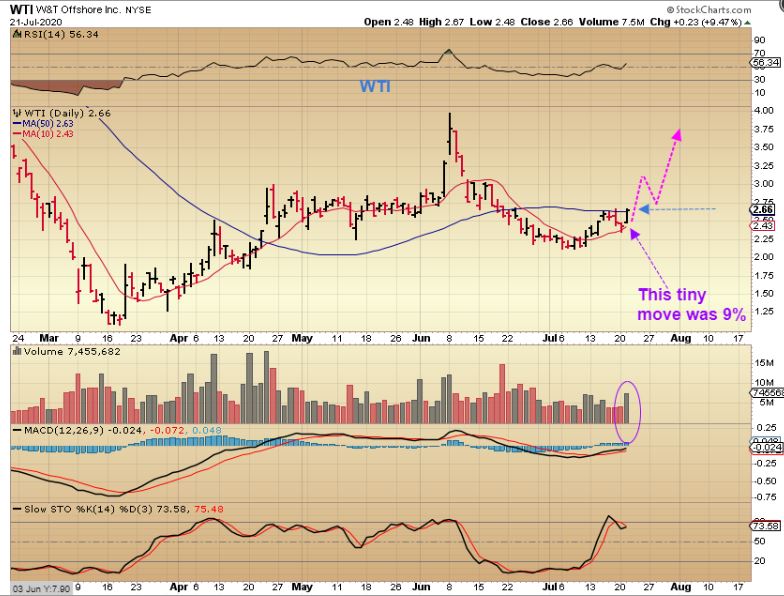
WAY BACK ON JULY 21 I THOUGHT THAT WTI could break out above the 50sma & run to $4.00 for starters. It could be a ‘Buy The Break Out’ set up. Well, we know that OIL never did break above that 200sma so, …
.
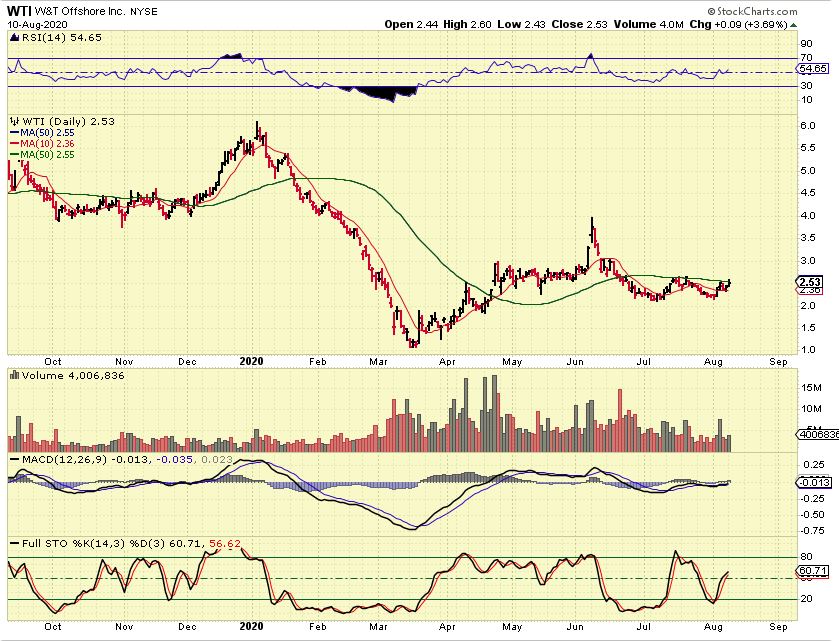
WTI stalled at that 50sma with Oil, but that means that you can still get it for the same bargain prices 🙂 You can wait for a break out above that 50sma , and that is only 2 cents higher, or just jump in here. $2.50 to $4 or more is a great %-Gainer trade, and this may even go higher. With these, you can start small and build on your position, or start with a full position and sell some on the way higher. You may also want to check when earnings are due . ON JUNE 23 Price popped on an ‘earnings beat with higher Production‘ and then sold down with Oil. That USUALLY means that the next earnings release is not for 3 months later around Sept 23.
.
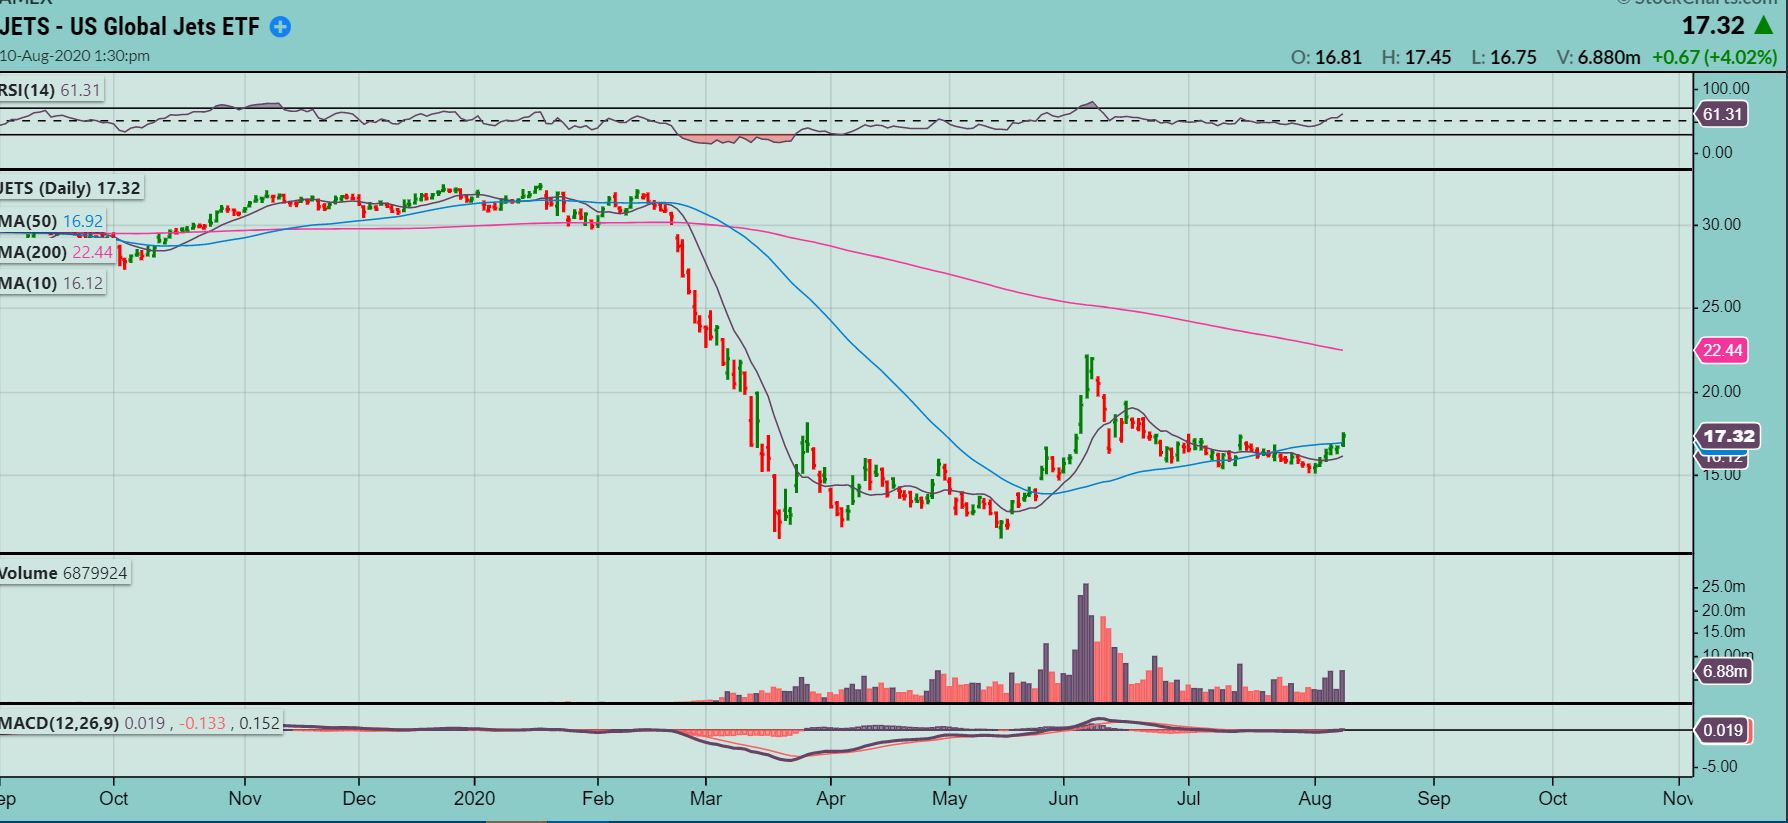
I mentioned airlines in July as setting up bullishly.
You could have them on your watch list. Apparently one of our readers Ravin had them on his watch-list because he gave them a shout out yesterday. Thx Ravin. I cannot explain the bullishness on a business that has slowed down so much, and is threatened with the Corona spread, but charts do not lie. These do look ready to move higher AGAIN. You’ll see why I say ‘again’ as we revue a few.
.
JETS ETF – So this is the ETF (safer) breaking out over the 50 sma with increasing volume, this is a buy.
.
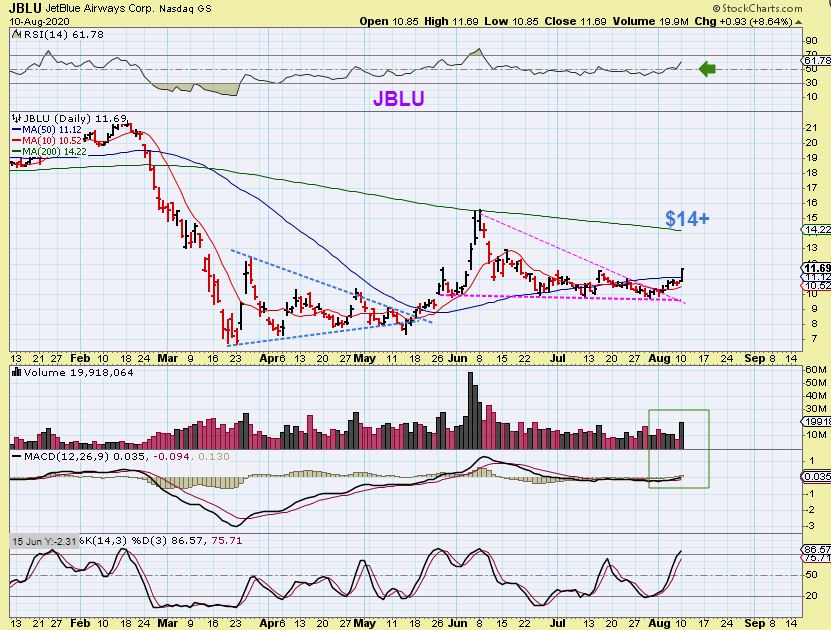
JBLU was pointed to as bouncing along support and getting ready to move higher.
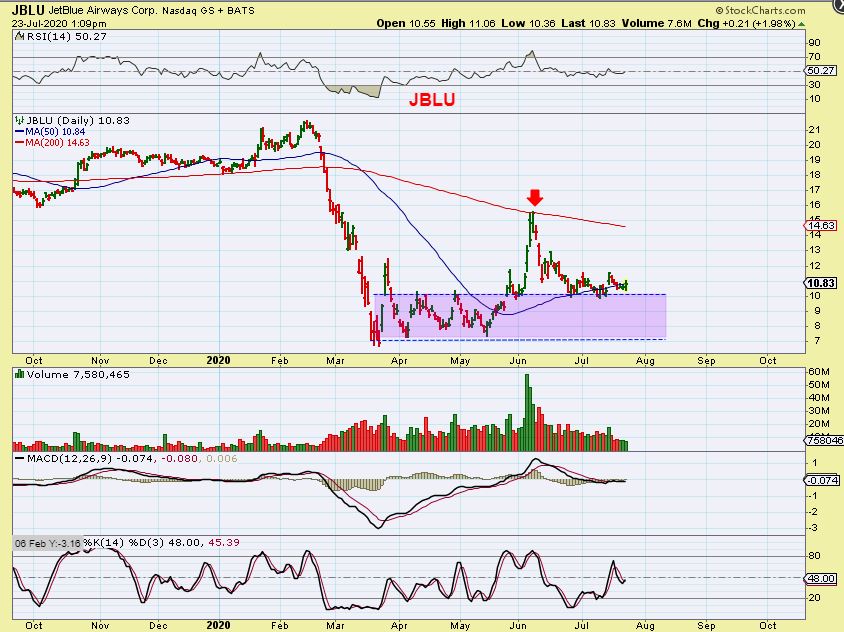
JBLU is an example of an airline stock that is set up bullishly, and volume is growing as it leaves that support area. It actually formed a triangle and has now reached the apex & broken higher. Notice that in March it was under $7 and it ran to $16. Big gains. After consolidating those gains back down to a low of $9+, it looks ready to run back to $14 ( or better). These are big gains.
.
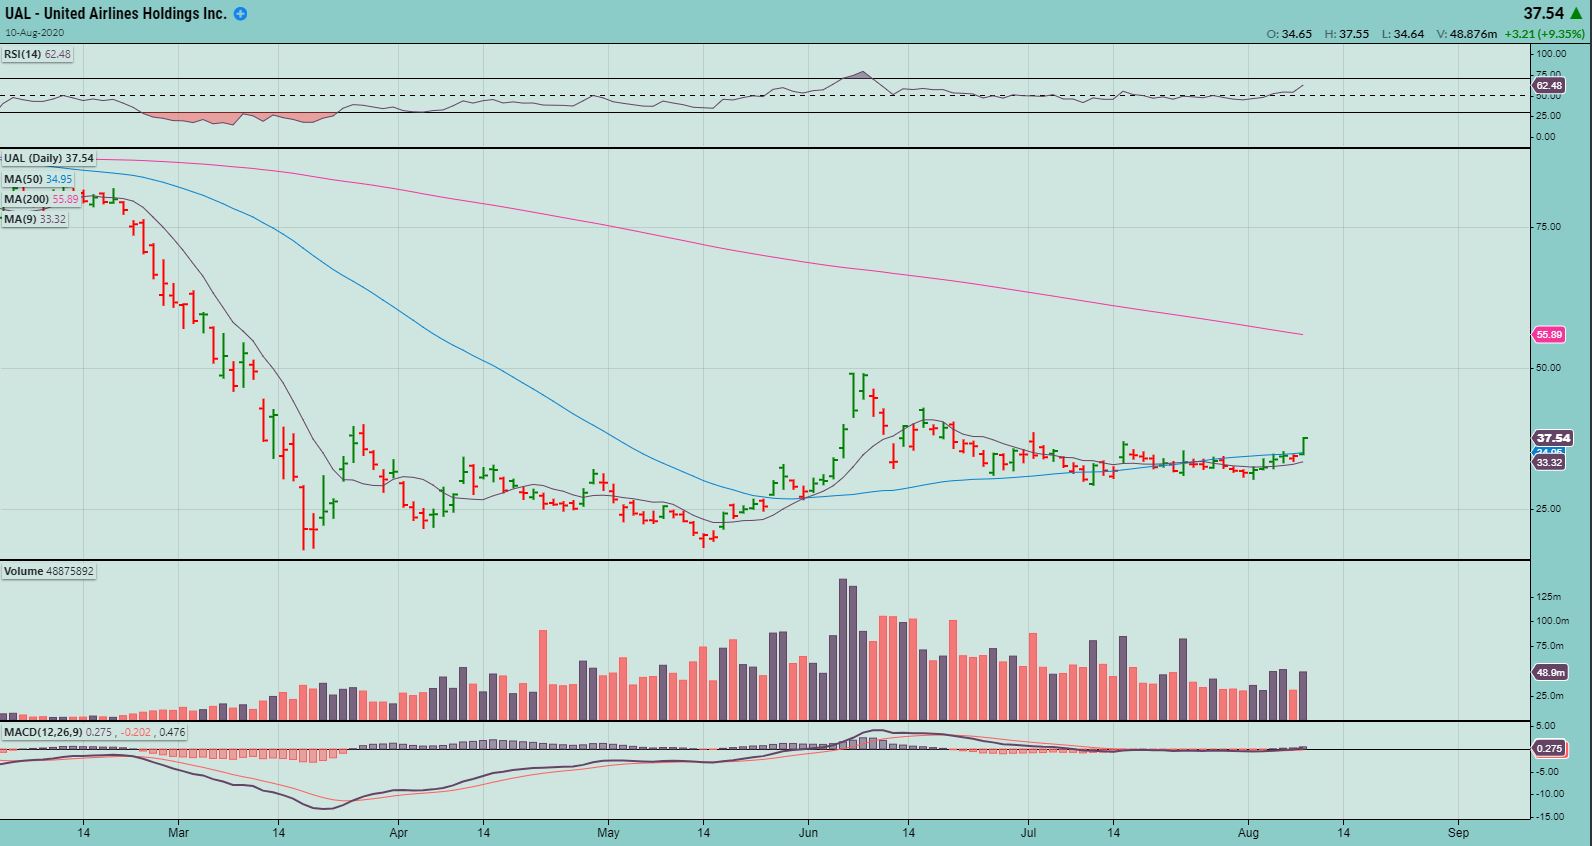
AAL, UAL, DAL, MESA were discussed in that other report and those look bullish too. This is United Airlines breaking the 50 sma with volume. That is a buy with a stop for protection.
.
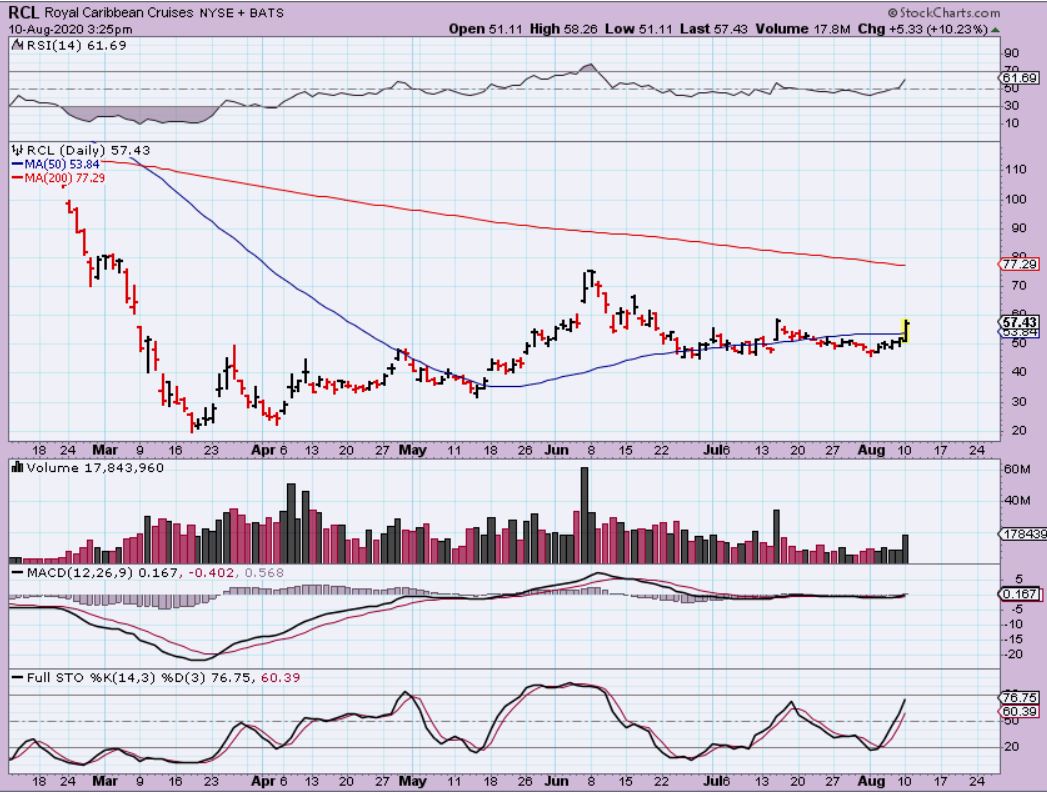
RCL – Cruise ships are also setting sail. If you can believe it, Royal Caribbean has moved from $20 at the lows to almost $80 in June. That was 300% and looks ready to run again. Hard to believe, but ‘it is what it is’, as they say. In this case, it is —bullish.
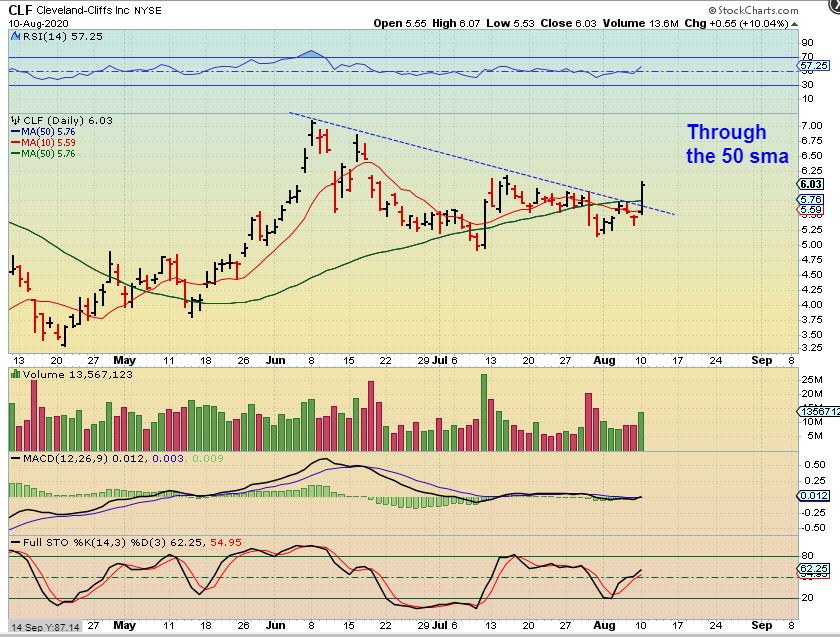
MARIA mentioned CLF yesterday, so I ran through my Metals companies. We had the copper and steel stocks in a report a while ago and they have done excellent. HBM. FCX, TGB, etc were mentioned. ( I have been watching many other shiny objects like Miners and Biotech sparkle, so I lost track).
.
Well after a consolidation, CLF is breaking out above the 50sma, volume looks good, and this may be ready to push above the June highs.
.
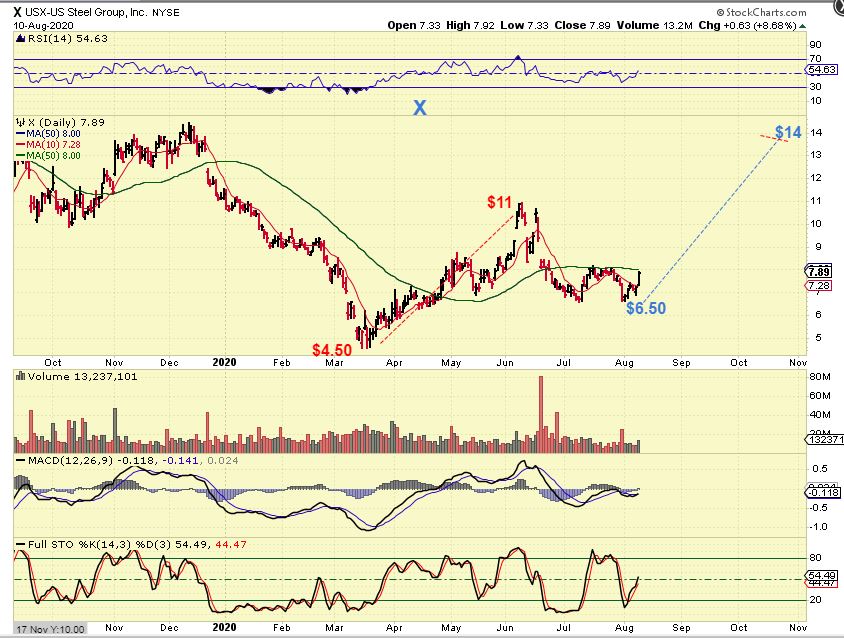
X also looks bullish & is a buy as it pushes on that 50sma. Look at what it did in the last run. $4.50 to $11! Big Gains, big potential now too.