August 6th – How High?
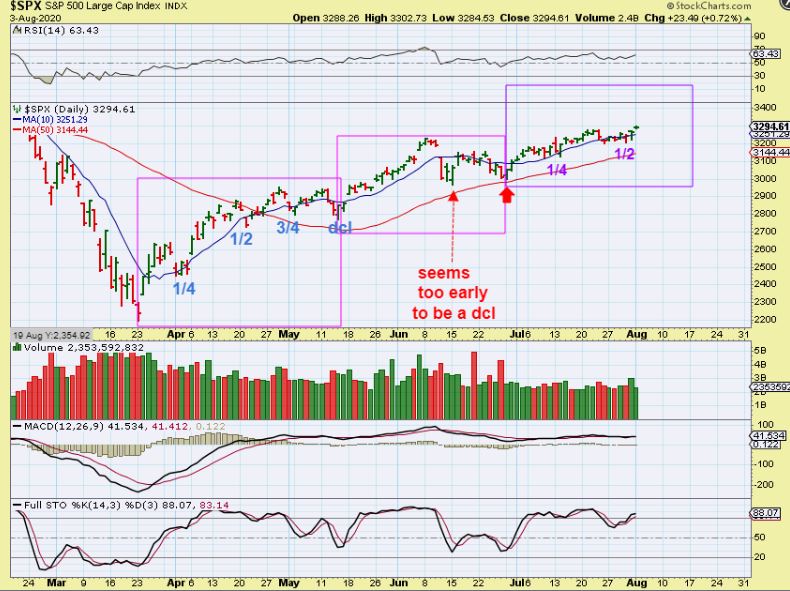
SPX AUG 3 – I had pointed out a 1/2 cycle low and we turned higher
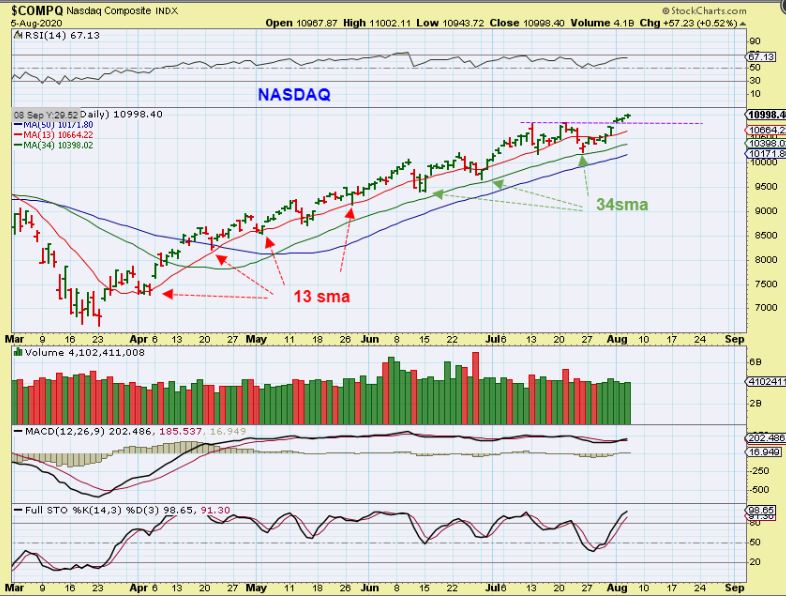
NASDAQ – The markets have continued higher after putting in that 1/2 cycle low . I’m pointing out the 13 sma & 34 sma contacts for the NASDAQ. It remains bullish.
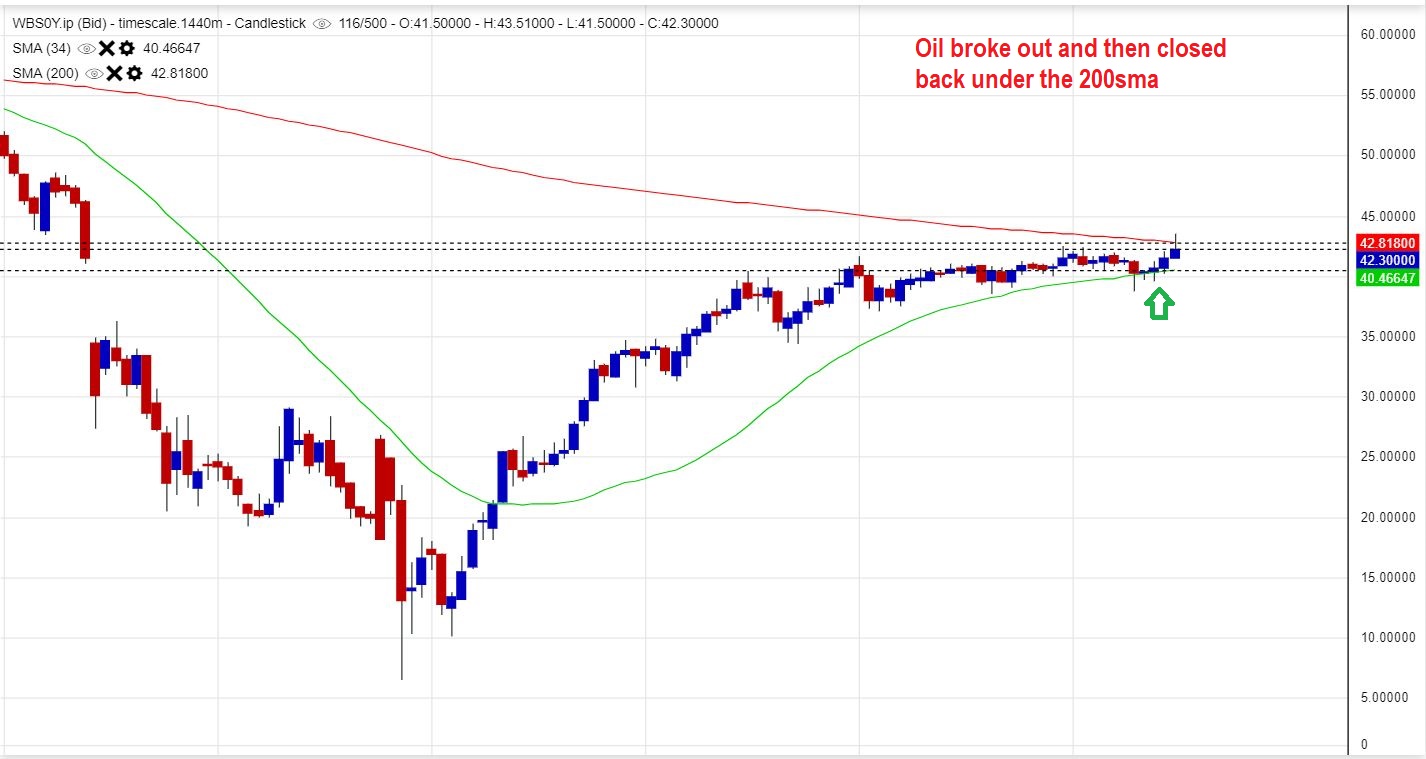
WTIC – Oil popped right over the 200 sma with the Oil inventory report Wednesday, but pulled back as the day continued on. We’ll see if it can push above it Thursday or Friday. I am expecting it to succeed.
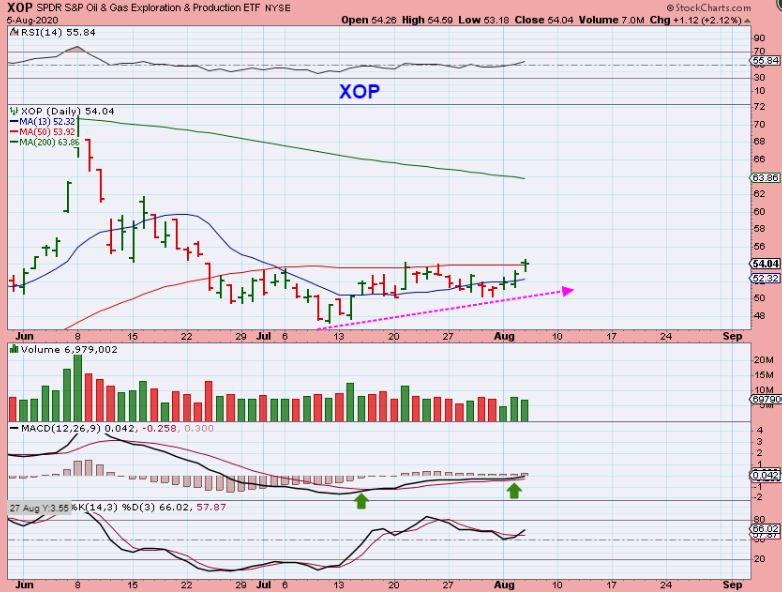
XOP tried to ( and did slightly) gain the 50sma . We need to see more follow through
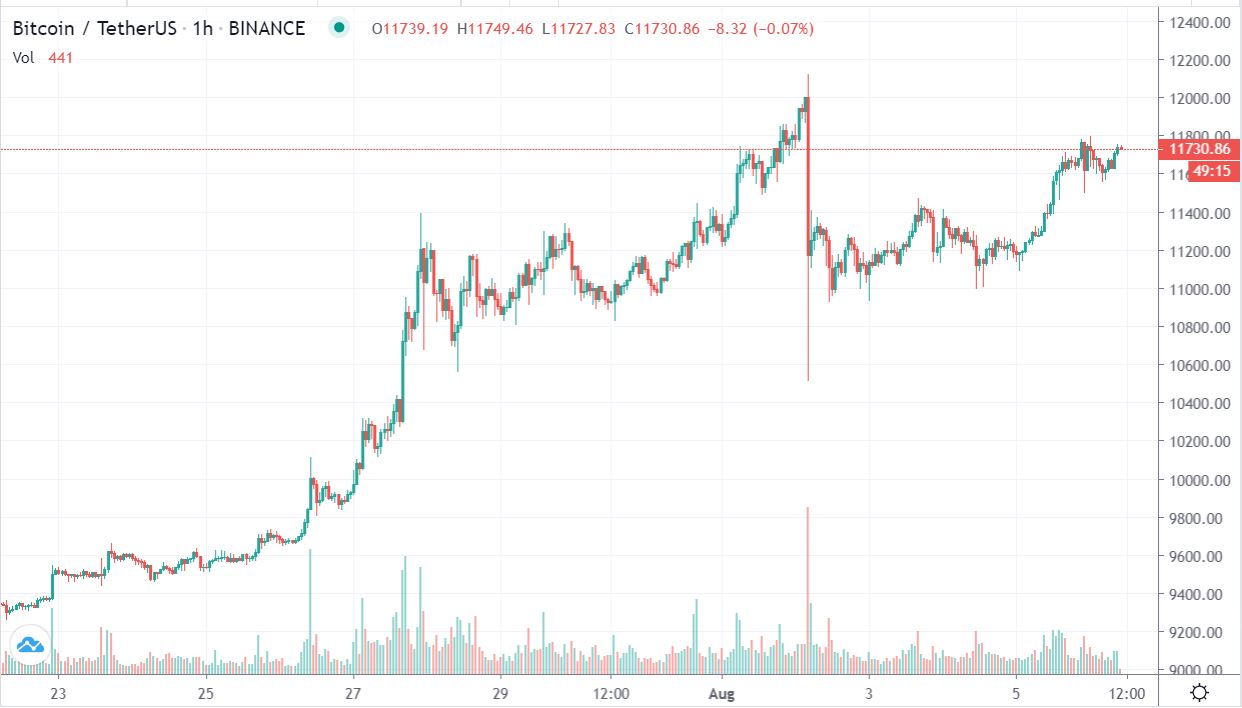
BITCOIN – I mentioned the Fire Pole in the past and BITCOIN has not only recaptured more than 1/2 of it, but also looks to be putting in cup & handle type of formation. This isn’t textbook C&H, but it should play out the same. The handle consolidated the first run, and it should continue higher.
Blockchain stocks like MARA, RIOT, NXTD, and others have put in Massive Gains already, but we are spoiled, we want more please 🙂
.
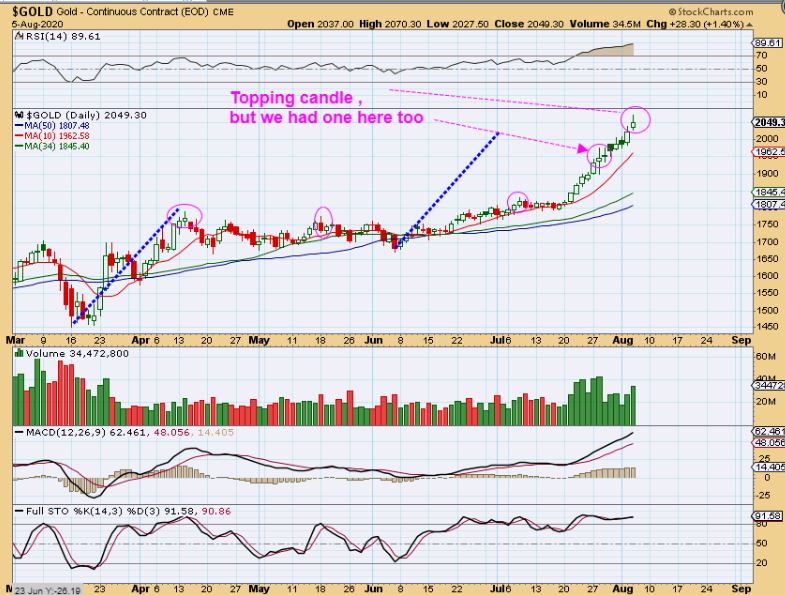
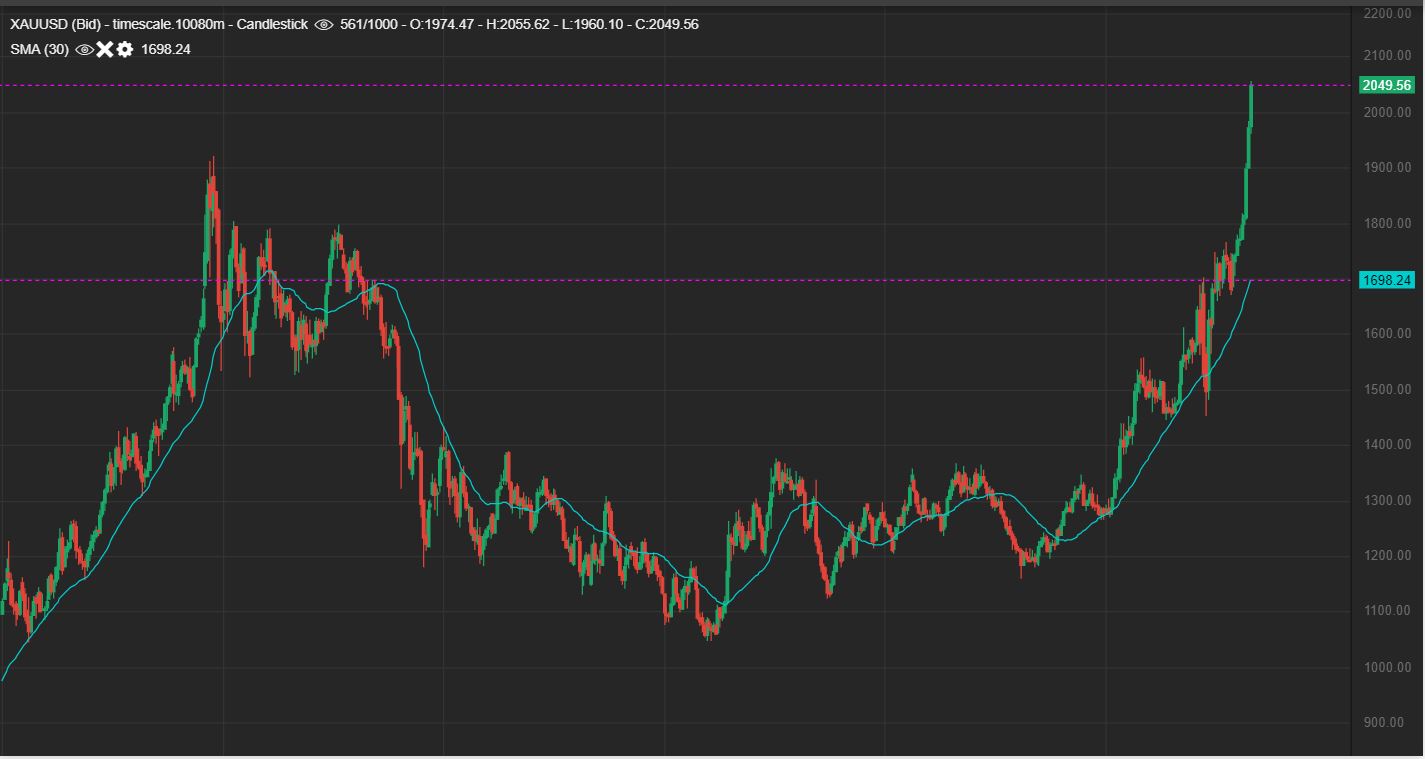
GOLD – These are ‘Usually’ topping candles of indecision, but we saw one a little over a week ago , and price just kept on marching higher. We are seeing a Bullish move in the Precious Metals, and buyers just keep showing up and pushing it higher ( Also those Shorting & being forced to cover may be adding to the move).
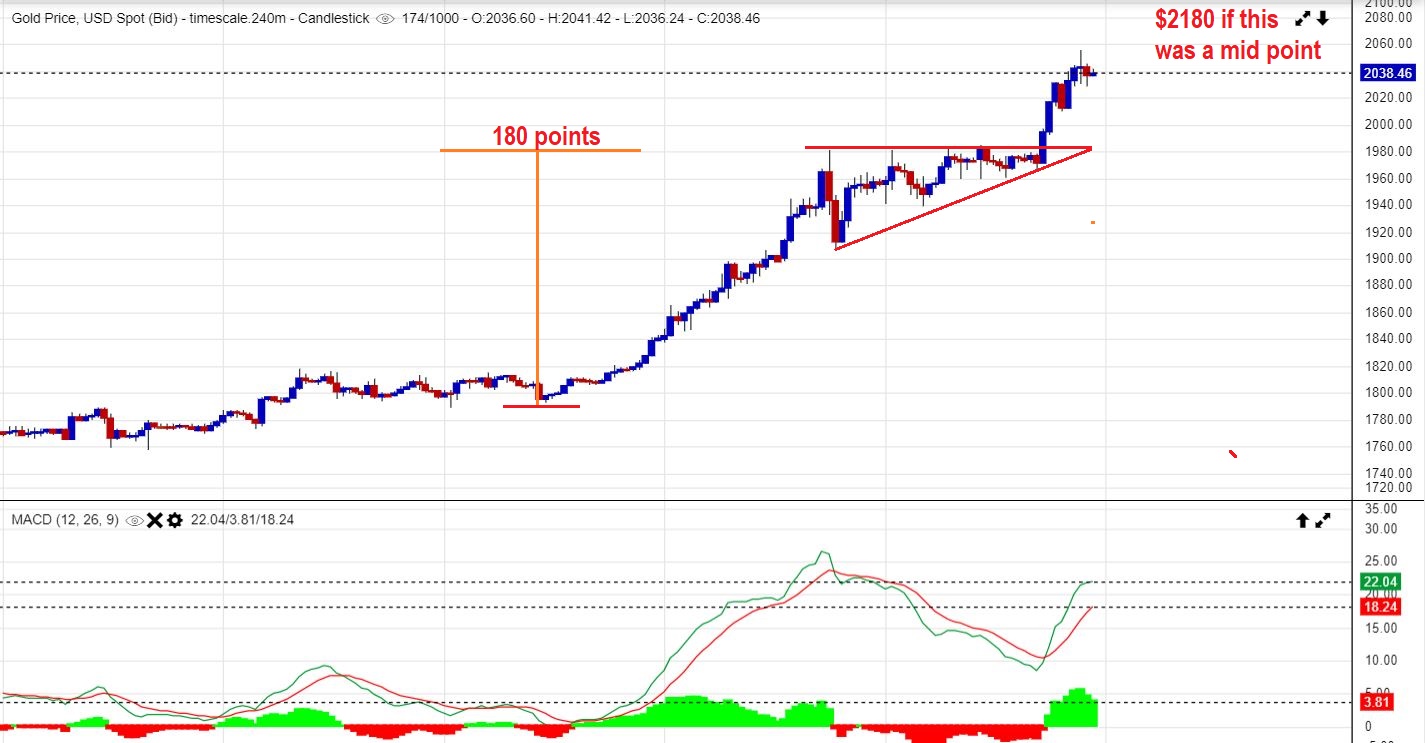
GOLD 4 Hr – I looked at the break out and did a measured target ( this may or may not play out), and GOLD points to the $2180 area . You have probably heard of the California GOLD RUSH in days of old. Let me show you what a Modern Day Gold Rush looks like.
.
This is what a Modern Day Gold Rush looks like. It broke to new highs and is running away. These straight up moves seldom end gently, but how high it goes is anyone’s guess. This is getting parabolic, and it can’t last. Look at the last time Gold Rushed straight up to $1900. The drop that followed was sharp .
.
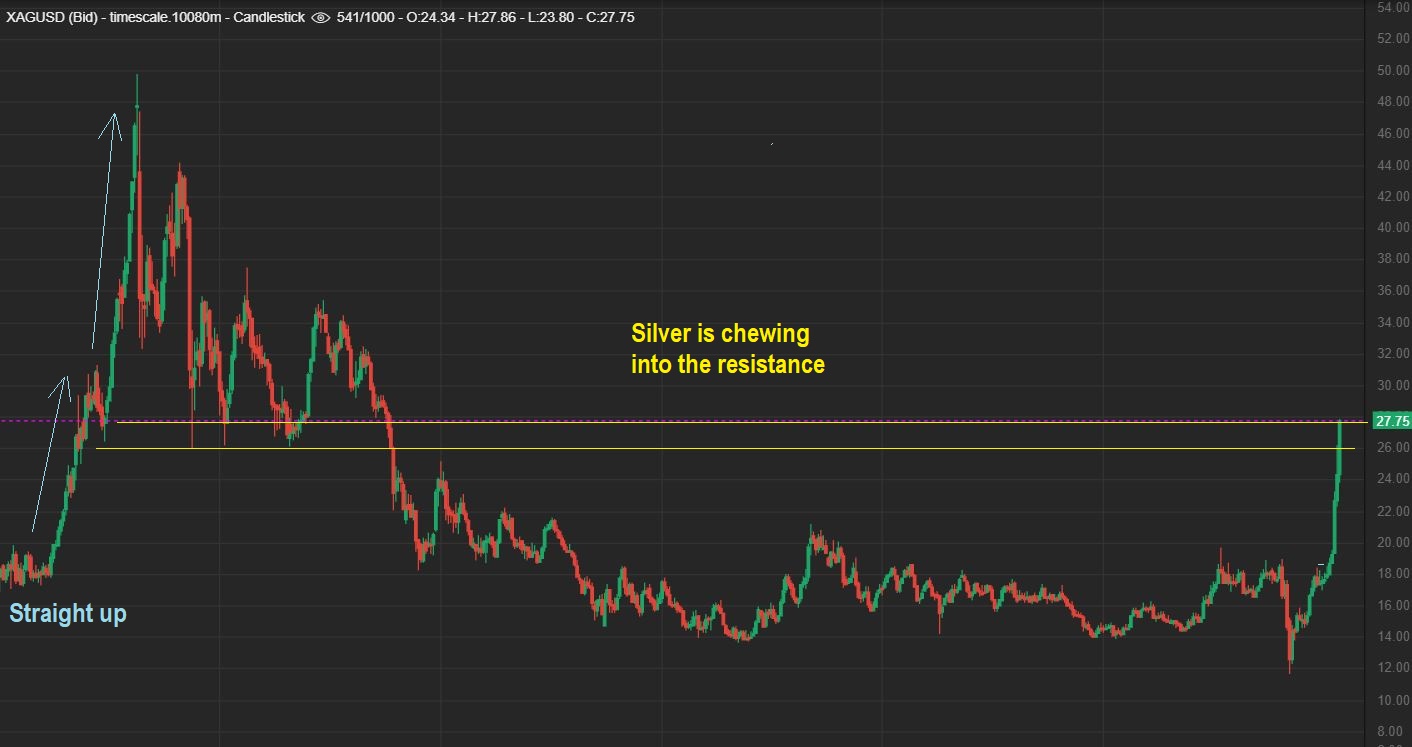
SILVER continued to reach out for new recent highs as I gathered charts Wednesday night.
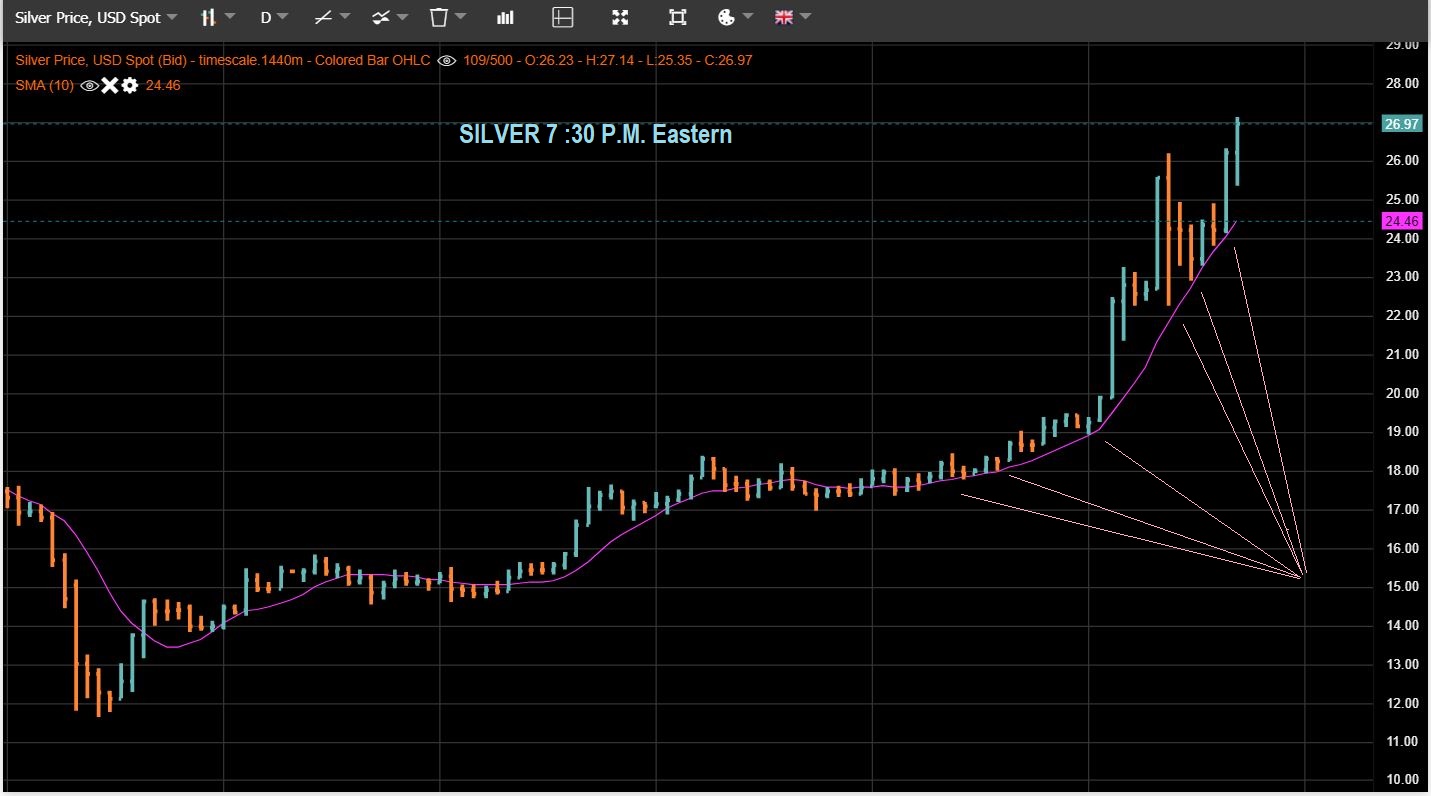
SILVER 6 a.m. – I had the $26 Target with resistance at that area. We paused BRIEFLY and Silver is now continuing to chew through that area.
..
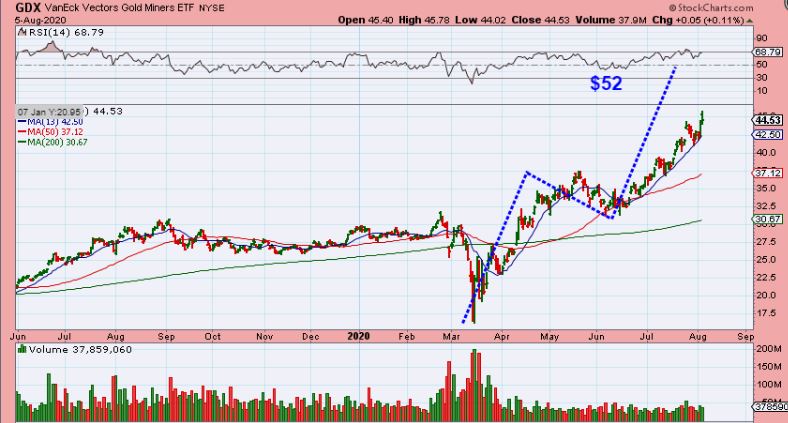
GDX does not look as steep as the Metals themselves. It looks like a normal bullish climb up the 10 sma (or 13sma).
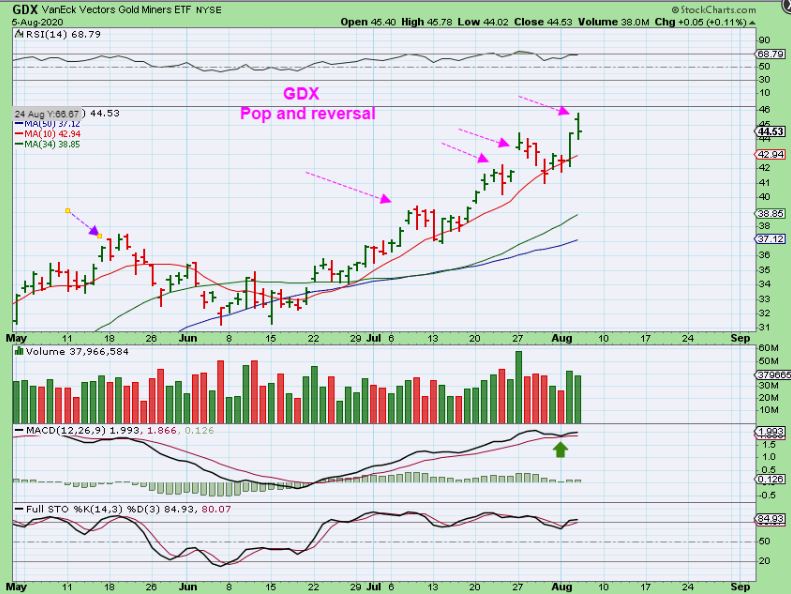
GDX – I honestly don’t even want to show this chart, because the Metals are going straight up and I don’t think that this target can be reached if the Metals go parabolic quickly and then drop sharply. So I am NOT Saying “Go in heavily with leverage, GDX has $8 to go”. I’m just saying that the climb for the Miners has been normal. IF THEY START GOING PARABOLIC TOO, this target may be met, but ‘time’ for that is probably running out.
.
Some Miners actually Popped & Dropped with Metals racing higher yesterday, so set ups do not look as straight up or extended as the metals themselves. I have been asked “Why did some Miners drop if the metals are still at the highs?“. That answer is really just that the markets move that way at times. Some people are likely taking profits. You may even have Insiders Selling since they have good profits . We’ll just look at some charts of Silver Miners and see if anything bearish stands out…
,
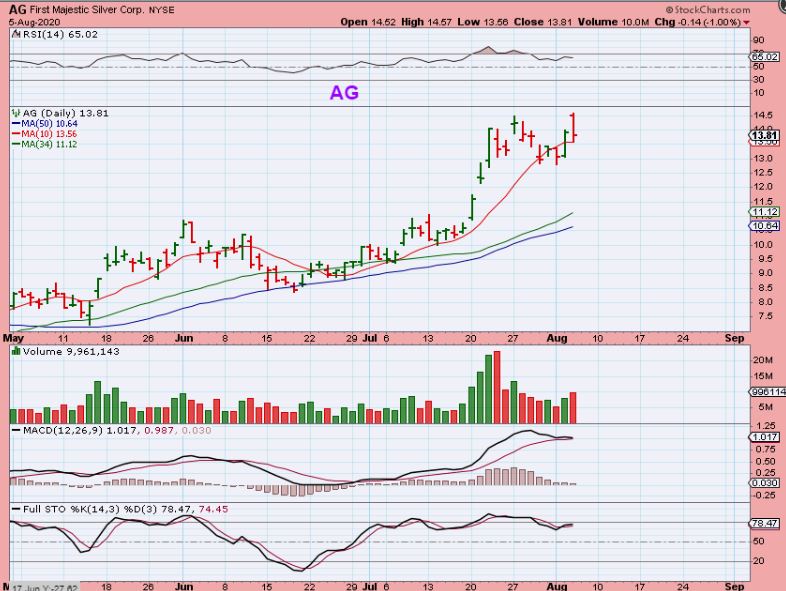
AG – With Silver racing higher, this does show divergence as price reached recent highs. That can lead to choppiness, and I explained that kind of Pop & Drop & Choppiness yesterday with the 2016 run.
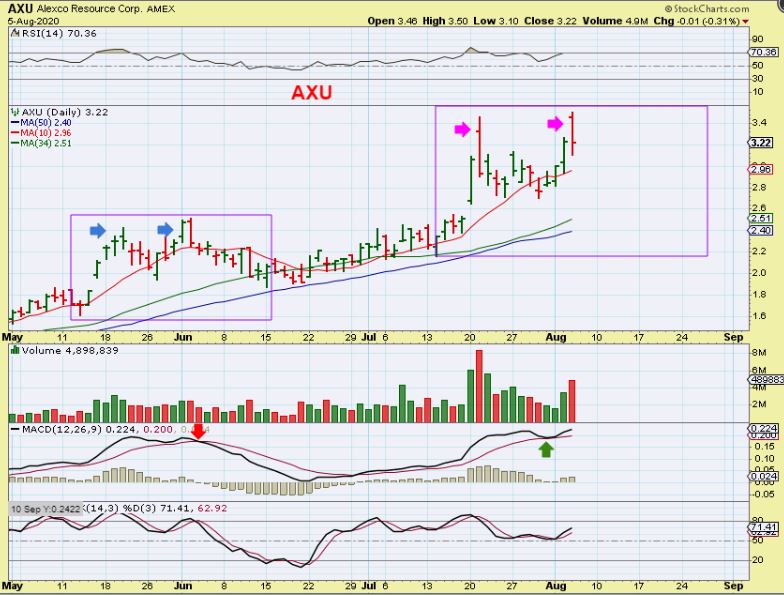
AXU Popped & dropped too. When it did that on July 20, it just got choppy and pulled back to the 13 sma (not shown). The MACD looks better this time than with that May double top, but even that May double top just led to a choppy sideways pull back.
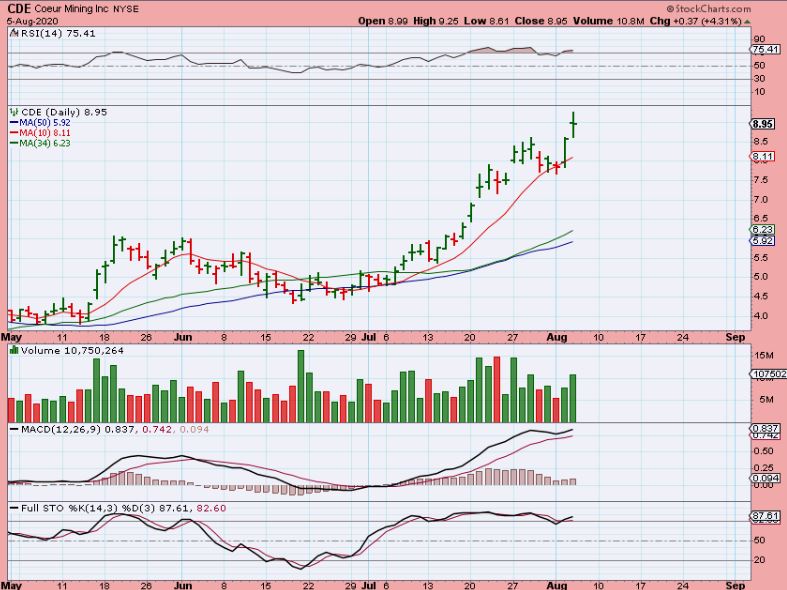
CDE made new highs and then put in a Doji. It can continue higher with Silver pushing forward, but it does seem like we are seeing some profit taking / selling as prices reached new highs.
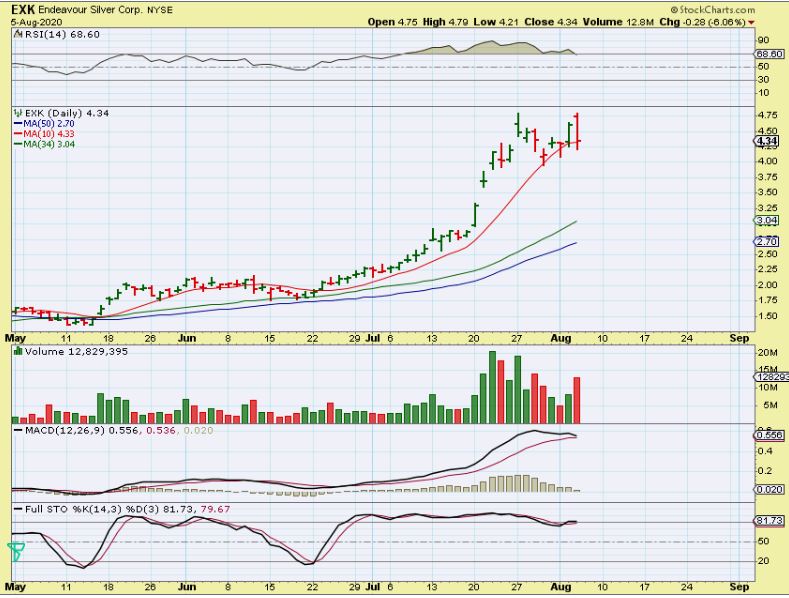
EXK actually almost made a bearish engulfing and this may double top here. The MACD shows weakness at the recent highs and the RSI was lower too (Divergence & Selling at the highs).
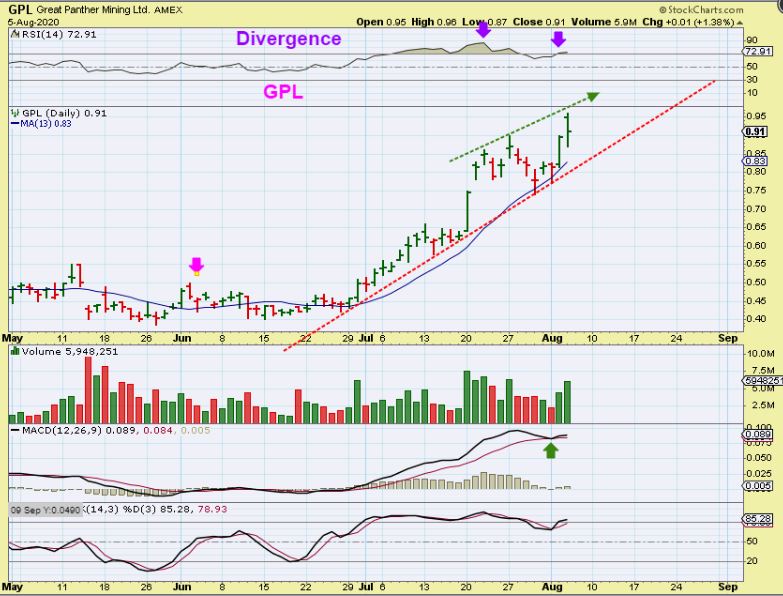
GPL looks good, but it also has divergence showing up. It has moved 100% since late June.
.
I have to be the voice of reason, rather than the voice of excessive exuberance when I see a chart like this. I do not think that it is different this time, and that a move like this will just continue higher and higher and higher. The Gains in Miners have been great, but I wouldn’t want to be in leverage or fully positioned in Miners if this dropped one night and just kept selling off into the morning. These kinds of moves can go higher than expected ( and this already is doing that short term), but these moves often drop very quickly too, and that could happen overnight. Holding that core position of miners or even trading some good set ups until the run exhausts can still be profitable. Just Stay Frosty! 🙂
.
Enjoy your Thursday trading!
.
~ALEX
.
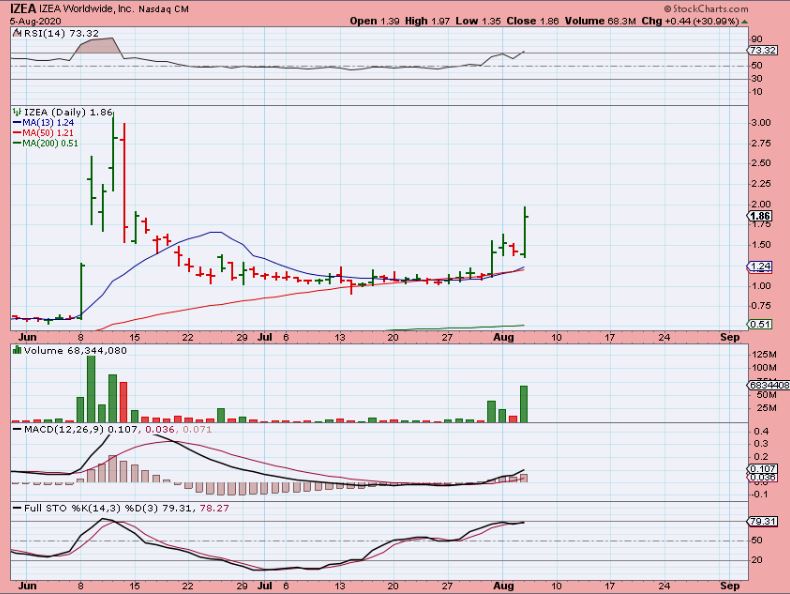
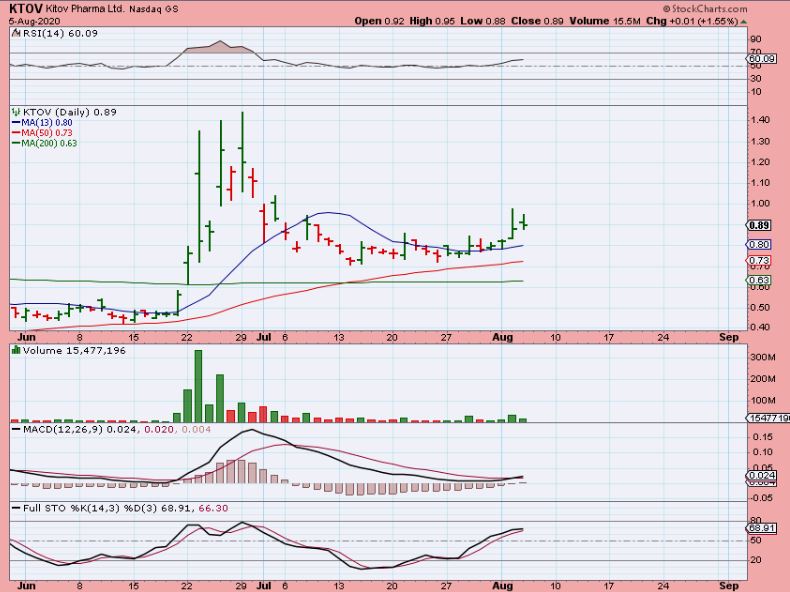
UPDATE: KTOV & IZEA PATTERNS – I pointed out that KTOV has a similar consolidation as IZEA. I liked both, but IZEA had a nice POP, maybe KTOV would follow.
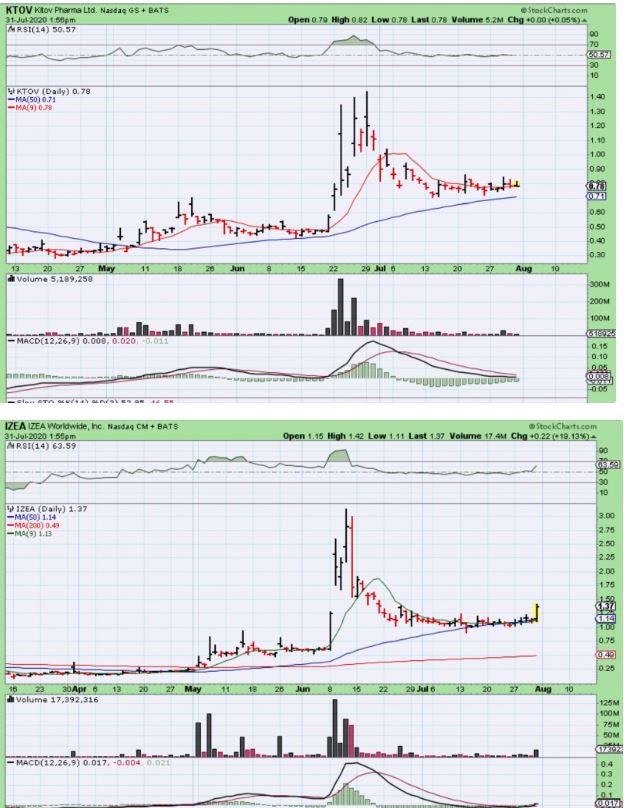
IZEA chopped sideways for the next 2 days and started to move yesterday, so I mentioned that in the Live area, and I captured this chart Midday, because I was going to recommend this as a buy in this report, HOWEVER…
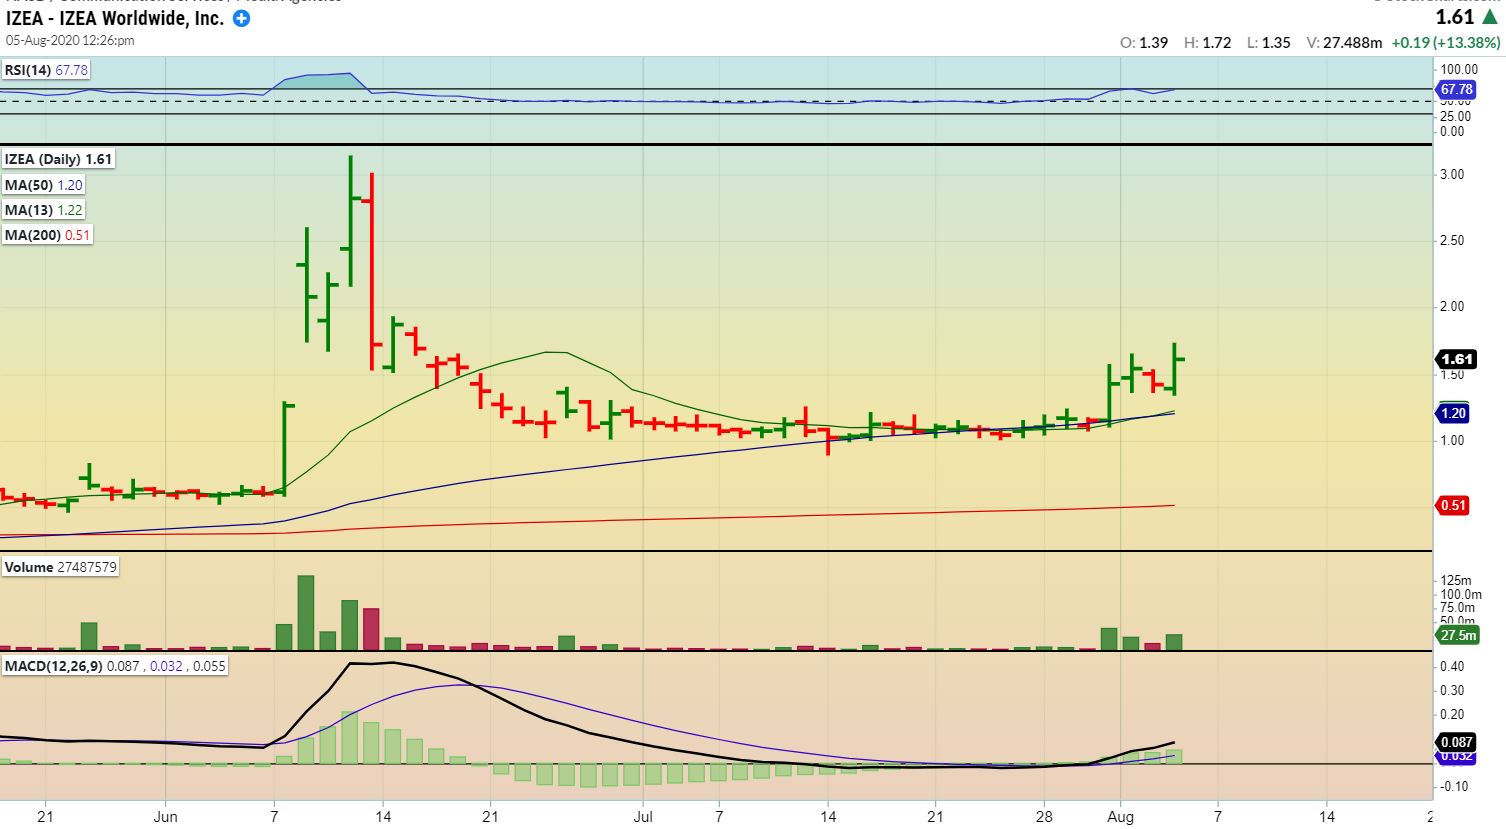
I was going to recommend this as a buy in this report, HOWEVER…
IZEA ended the day up 31%, so now it can be bought if it pulls back. I am still hoping that KTOV follows this kind of move back to June highs.
KTOV has moved from 70 cents to 90 cents. Nice gains really, but is a bit slower so far. I do still own it.
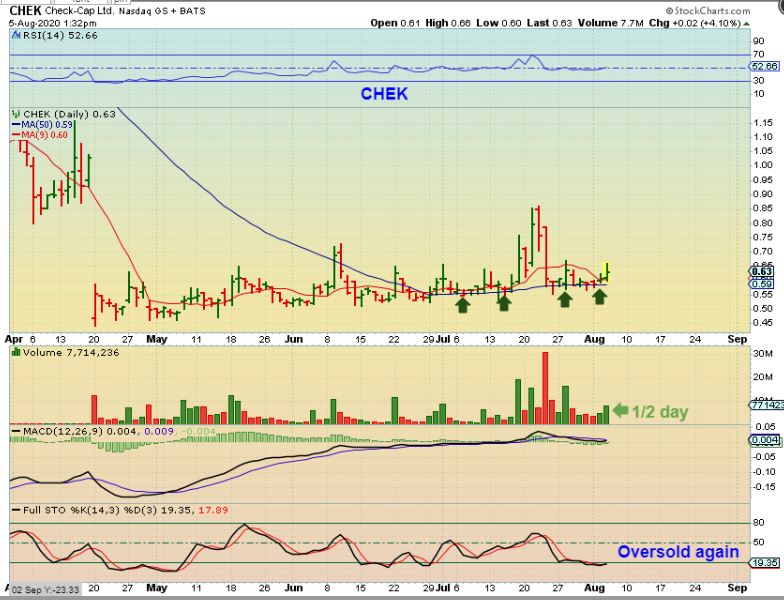
CHEK -We bought this base as it Popped & Dropped in June. We finally got a nice POP, but it did not have the follow through. I sold a small % of mine on that 2nd POP ( It was that Pop, drop, and Pop pattern that I was pointing out) , and then sold the rest as it dropped. It Now looks like it may be perking up again. Volume ended the day near 10 million, so you may want this back on your watch list or even start a starter position in case it pops again ( & runs this time).
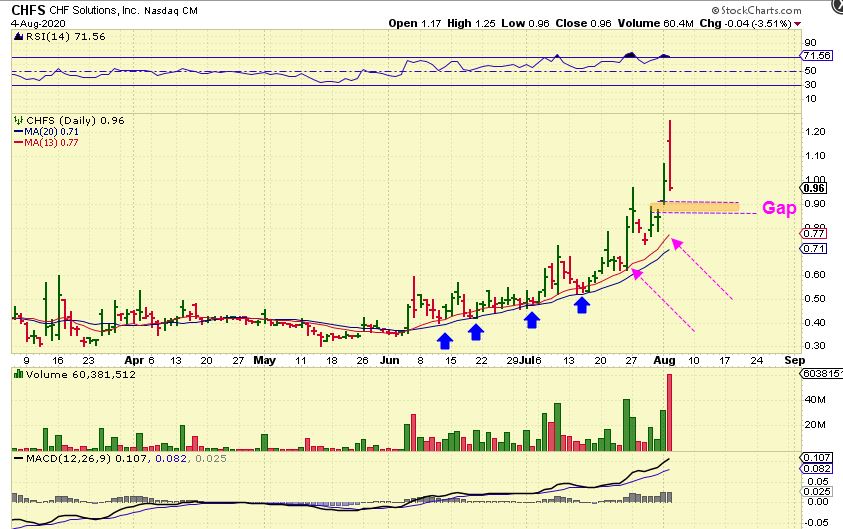
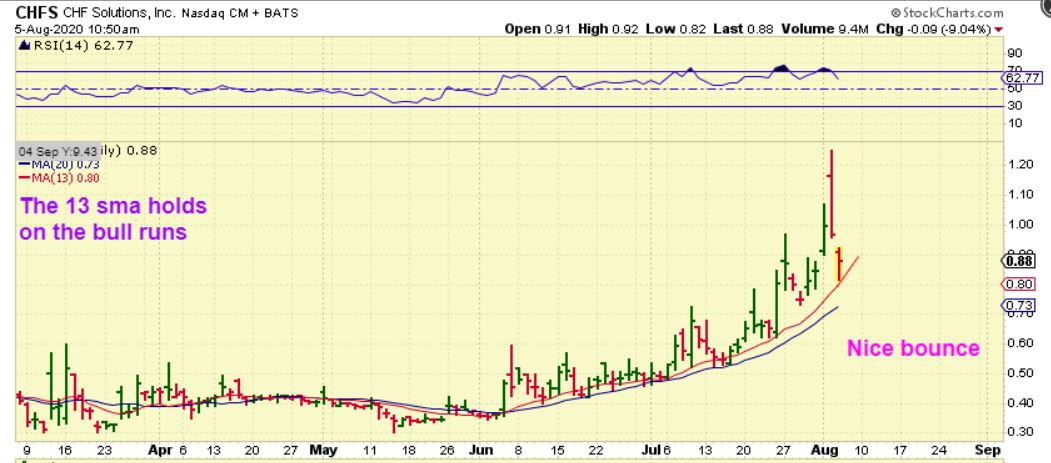
CHFS – Yesterday I pointed out that I am watching the 13 & 20 sma for CHFS. IT also might fill that gap.
.
CHFS – by 11 am CHFS bounced off of that 13 sma, but by the close it dropped back to just above that 13 sma. That is the area that I am hoping holds as support. I sold some of my position on the POP and may re-add if this sets up properly. I would probably lock in the rest of my gains on a close below the 20sma.
.
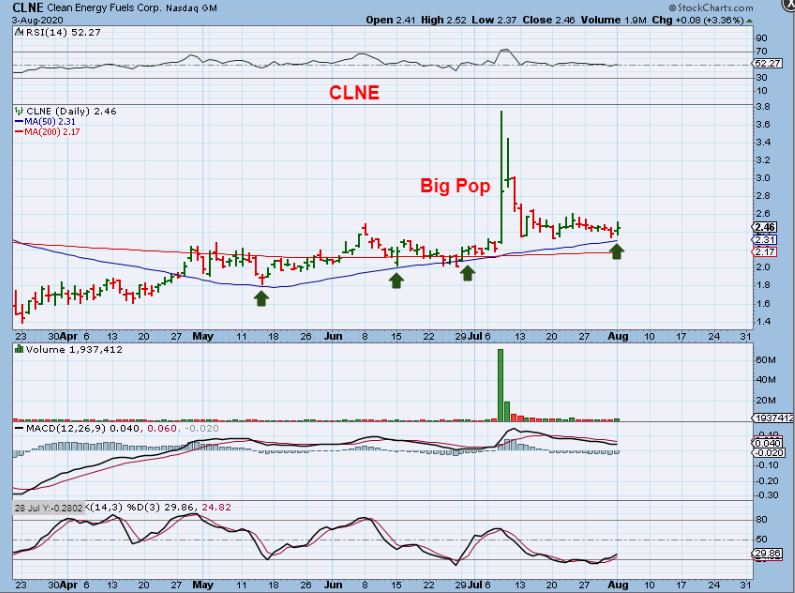
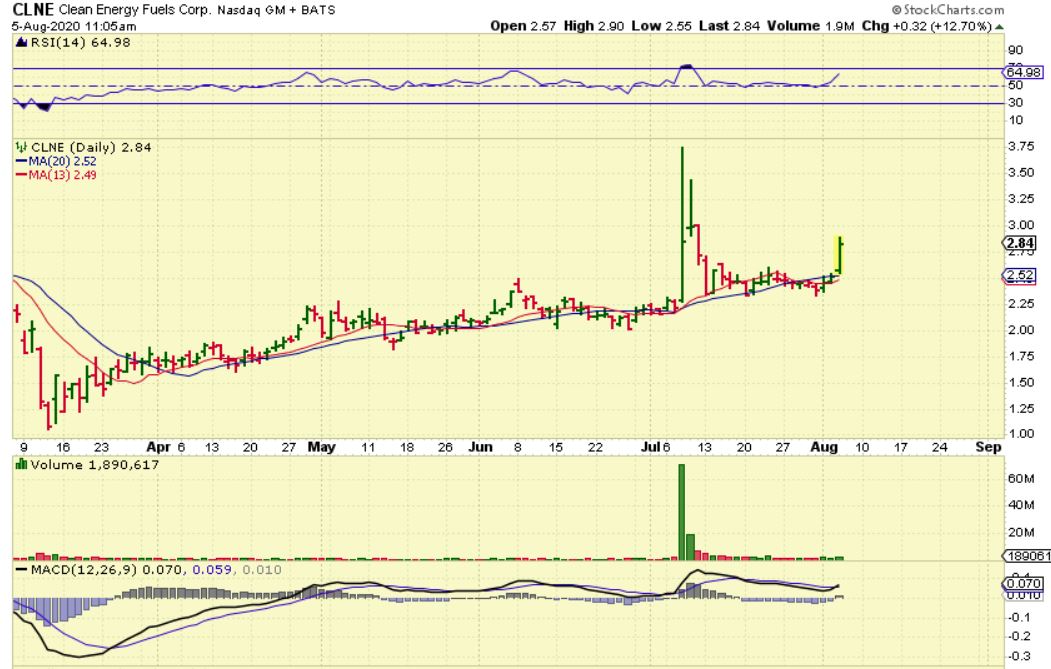
CLNE was mentioned as a Buy at the 50 sma Aug 3rd
.
We got the follow through. This CAN run to recent highs or more, or a short term trader could just cash in that 13% Pop as a nice gain too..
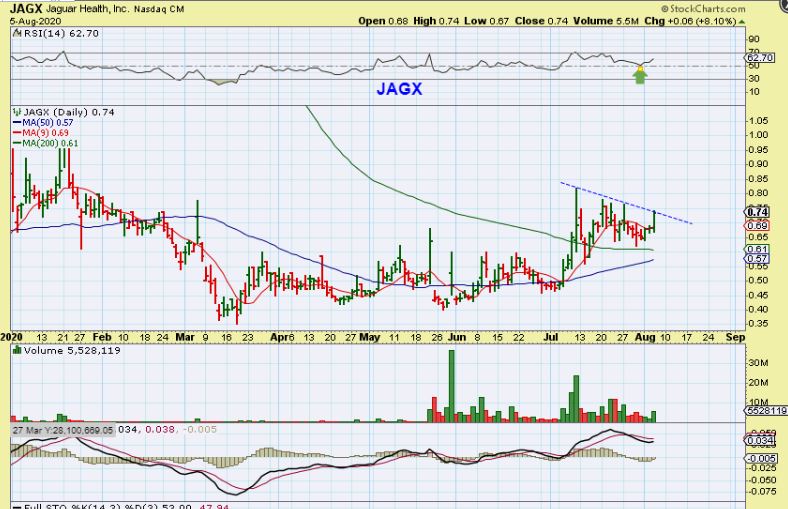
JAGX has been mentioned as a buy at the 200sma and it may be ready to break out. A break of this downtrend line may be a place for me to add, rather than sell the pop. This is a consolidation and a break from a consolidation can run higher for a few days. Volume is increasing, but still light- If it breaks on weak volume, I would sell and keep an eye on it.
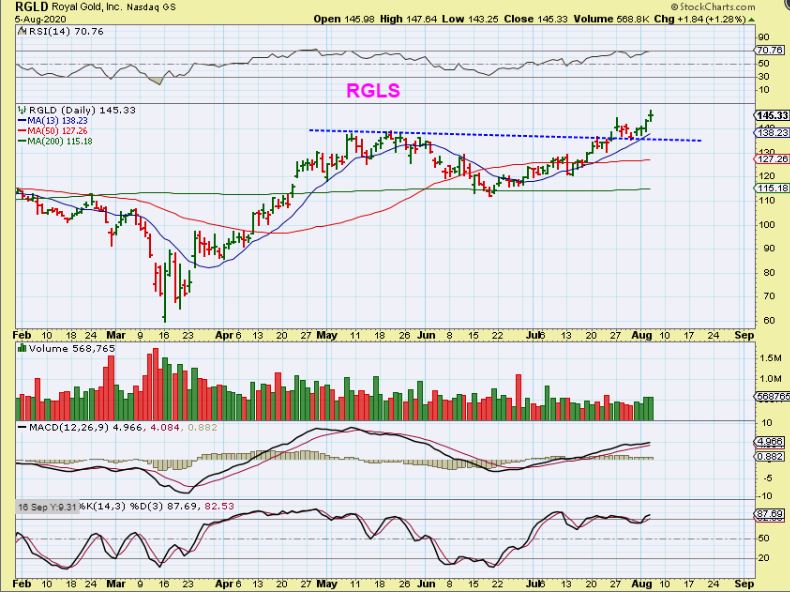
RGLD – THE MINER ( I misspelled the ticker ). I was just going to point out that some of these Royalty companies are not extended and have not done as well in July as other Miners ( see ELYGF, SAND, etc) . This actually looks like a buy as it improves and volume is growing, but use a stop, since this sector may be nearing a top. ELYGF & SAND actually look ready to drop.
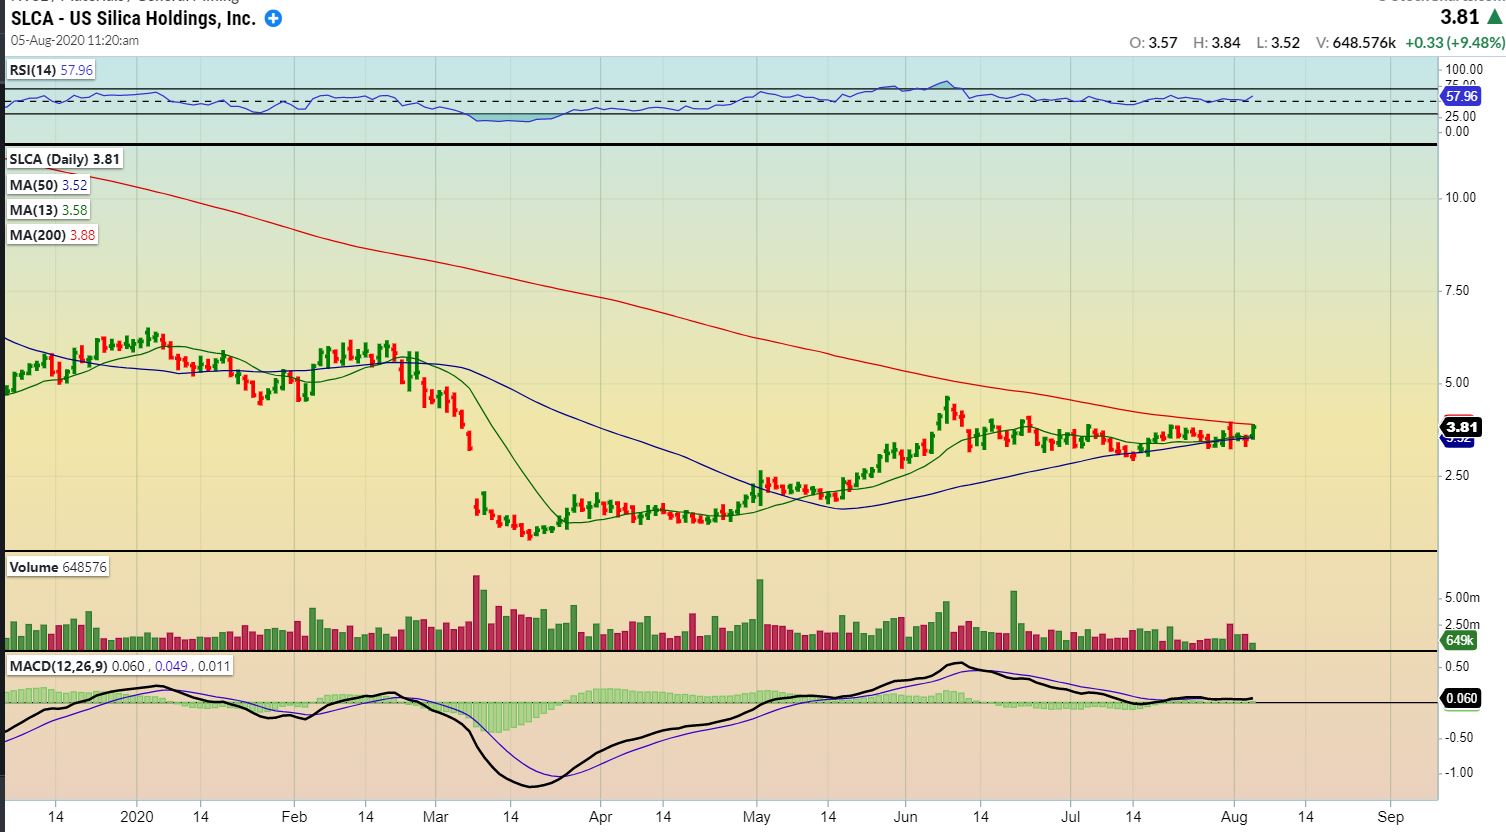
SLCA – I like this set up for an energy stock. If it breaks above that 200 sma, it may find Buyers and push higher quickly. Often stocks pinched between these 2 moving averages do Pop & Run. I Bought my starter position in this tight squeeze yesterday, you can see how tight the stop can be. I will add as it breaks out (if it breaks out).
.
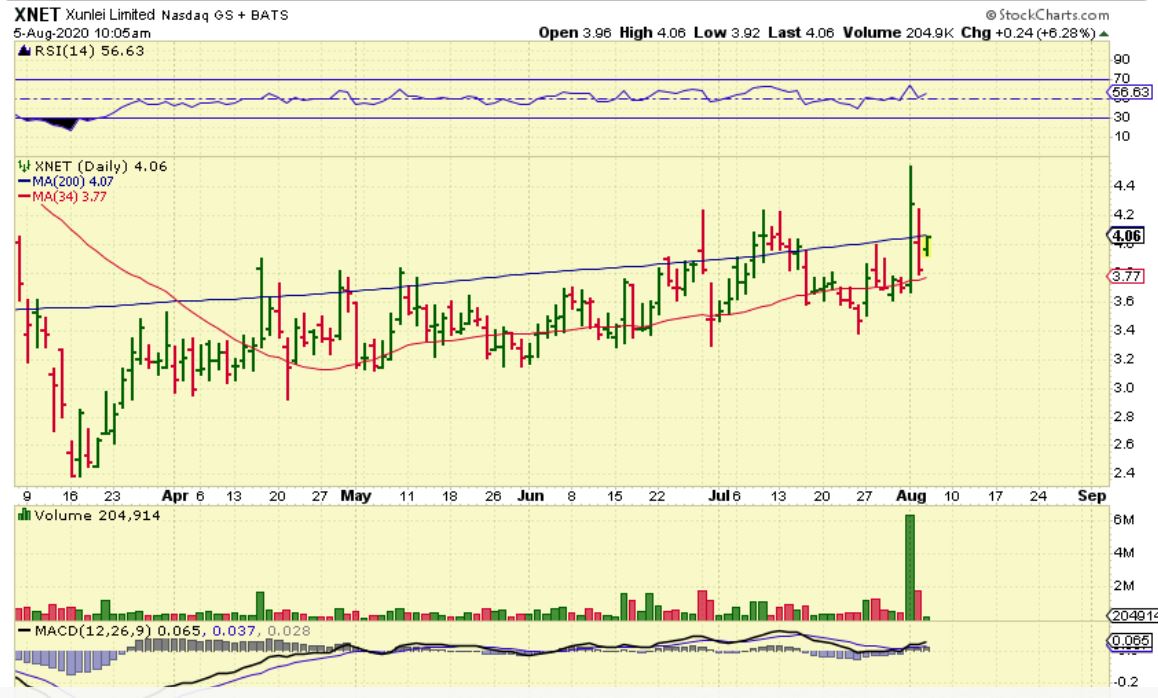
BY REQUEST: XNET ( Yes, I still own it) – It really needs to close above the 200sma for a couple of days to attract more buyers. So far it Popped strongly and they sold it. I didn’t sell any on the Pop this time, since I thought that it would run with Bitcoin.