
AUGUST 1st WEEKEND REPORT
As usual, the Big Picture Weekend Report will cover all areas of the markets, but I think that the daily reports have kept everyone up to date with what my expectations are. With that, I want to mainly focus the most of the discuss the Precious Metals in the weekend report. Let’s get into our charts…
.
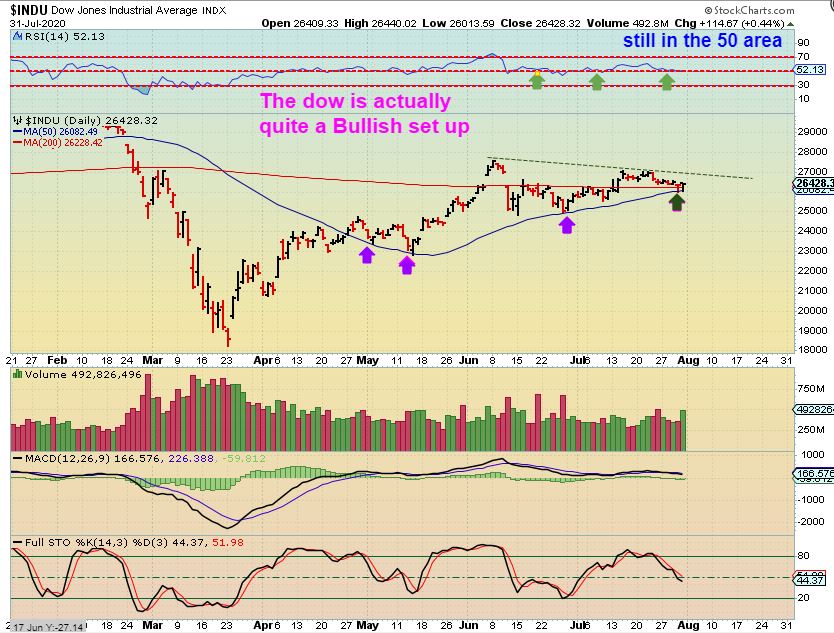
DJIA DAILY – I just want to say this: This is a bullish chart set up. I can’t explain the Bull set up with so much going on with the Corona outbreak, but this remains bullish at this time. We are in the 3rd daily cycle, Corona threatens to harm small businesses& restaurants, less spending, etc plus we had an ugly jobs report. That said, the charts remain Bullish. Trailing stops work so far.
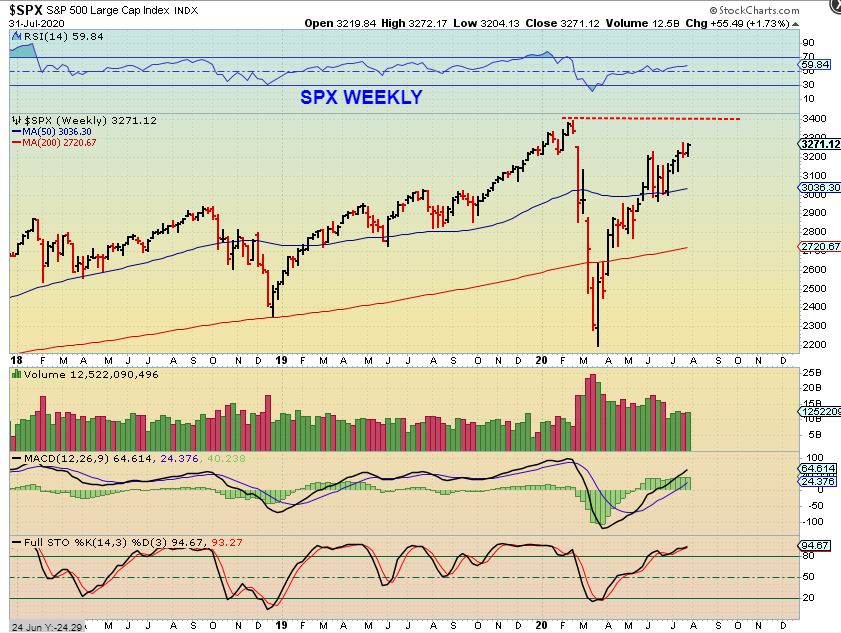
SPX WEEKLY – After bouncing off of the support in June, the SPX is still heading toward the 2020 highs.
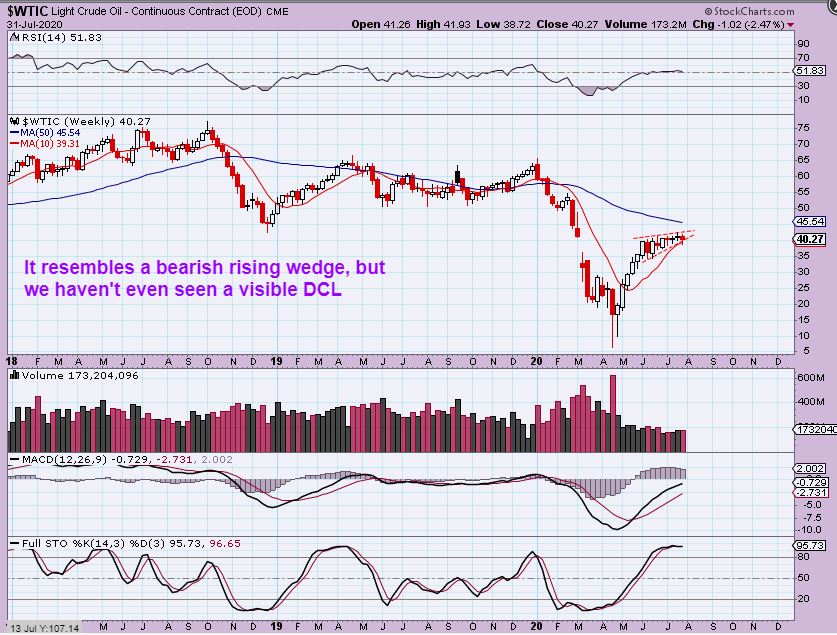
WTIC WEEKLY – Oil has not changed and though I expect a break higher, this does resemble a bearish rising wedge. I tried a few energy trades and closed them due to lack of follow through and choppiness. One was a loss, one was break even, one was a small gain. I will continue to monitor this sector for opportunities, but I’d like to see signs of strength.
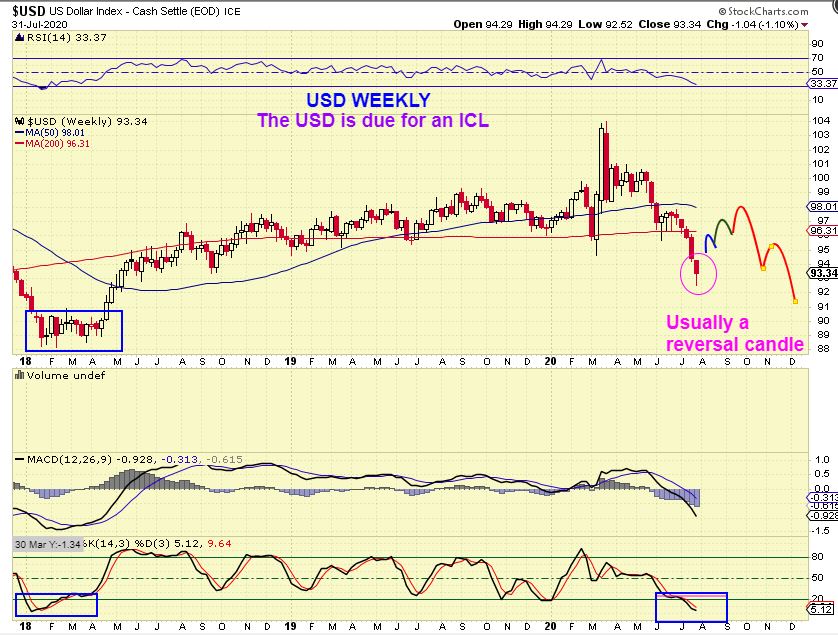
USD WEEKLY – That is a Bullish reversal candle, so now we’ll see if there is follow through. In Last weeks weekend report explained that the USD is due for a low, and that Low could put in a High in the precious metals. We might have seen that play out last week. Re-reading last weekends report if you have time is a good idea, since it was thorough.
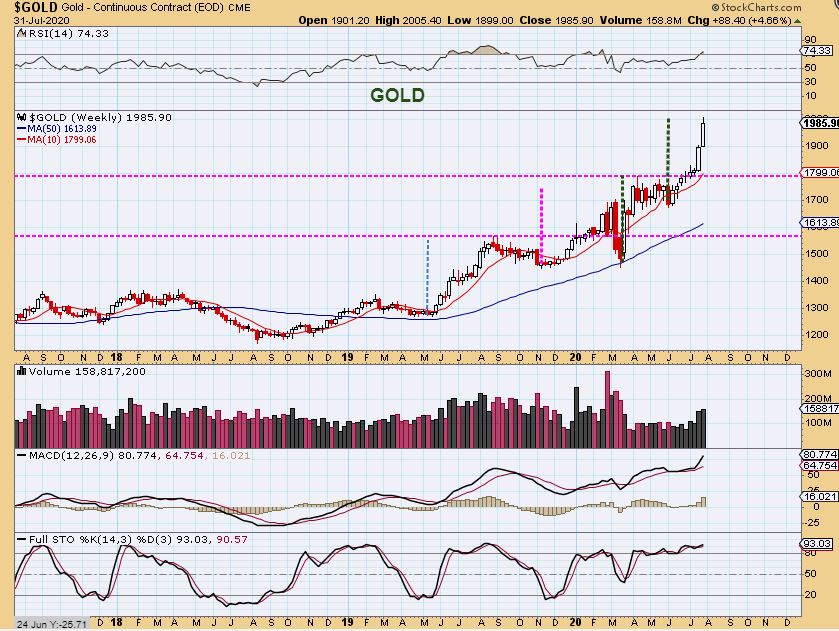
GOLD WEEKLY – Did Gold top with USD bottoming candle? That is not exactly a topping candle, and Gold broke to all time highs, so it is hard to say for sure. The measured moves are fairly consistent so far though (magenta target was cut short by our March crash scenario).
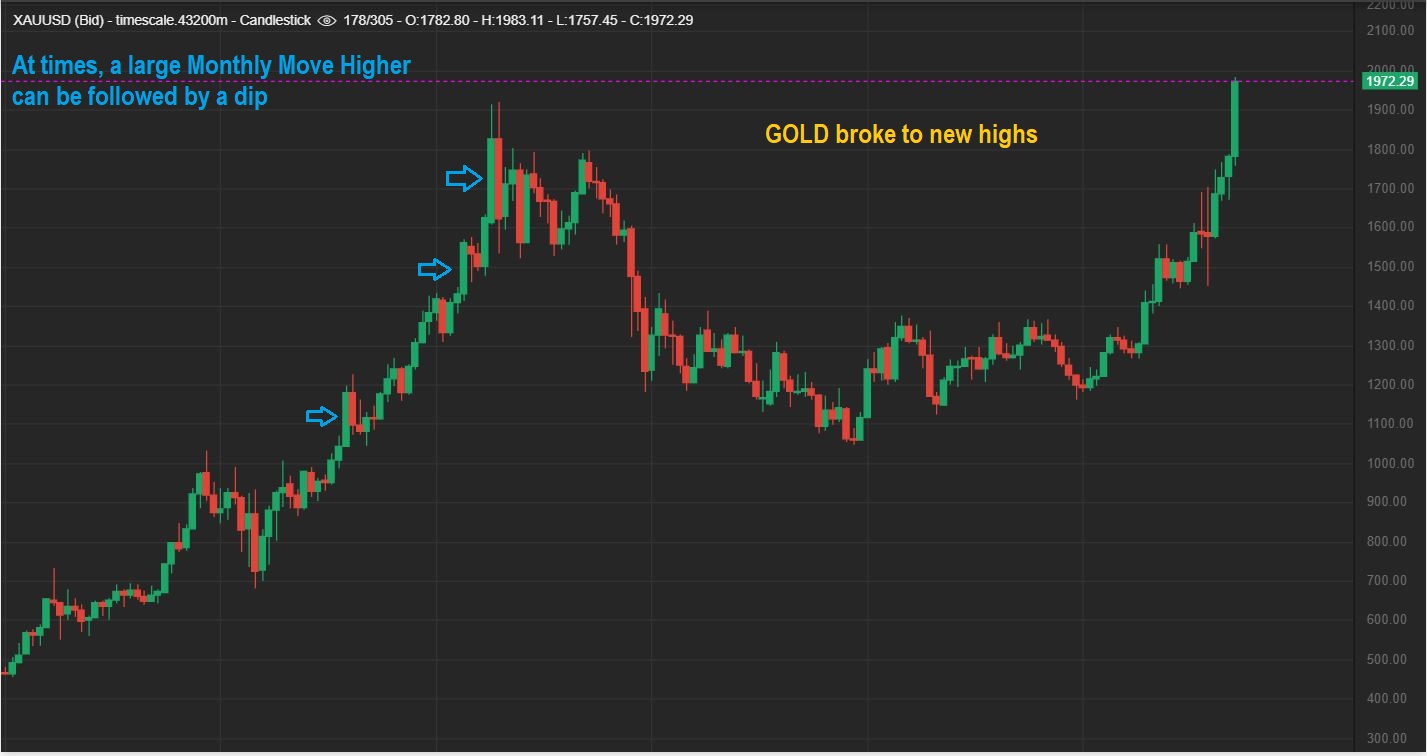
GOLD MONTHLY #1- Here I am just showing that “Yes, that was a strong push for the Month, but we have also at times seen those Large candles followed by small a pull back.” See the chart.
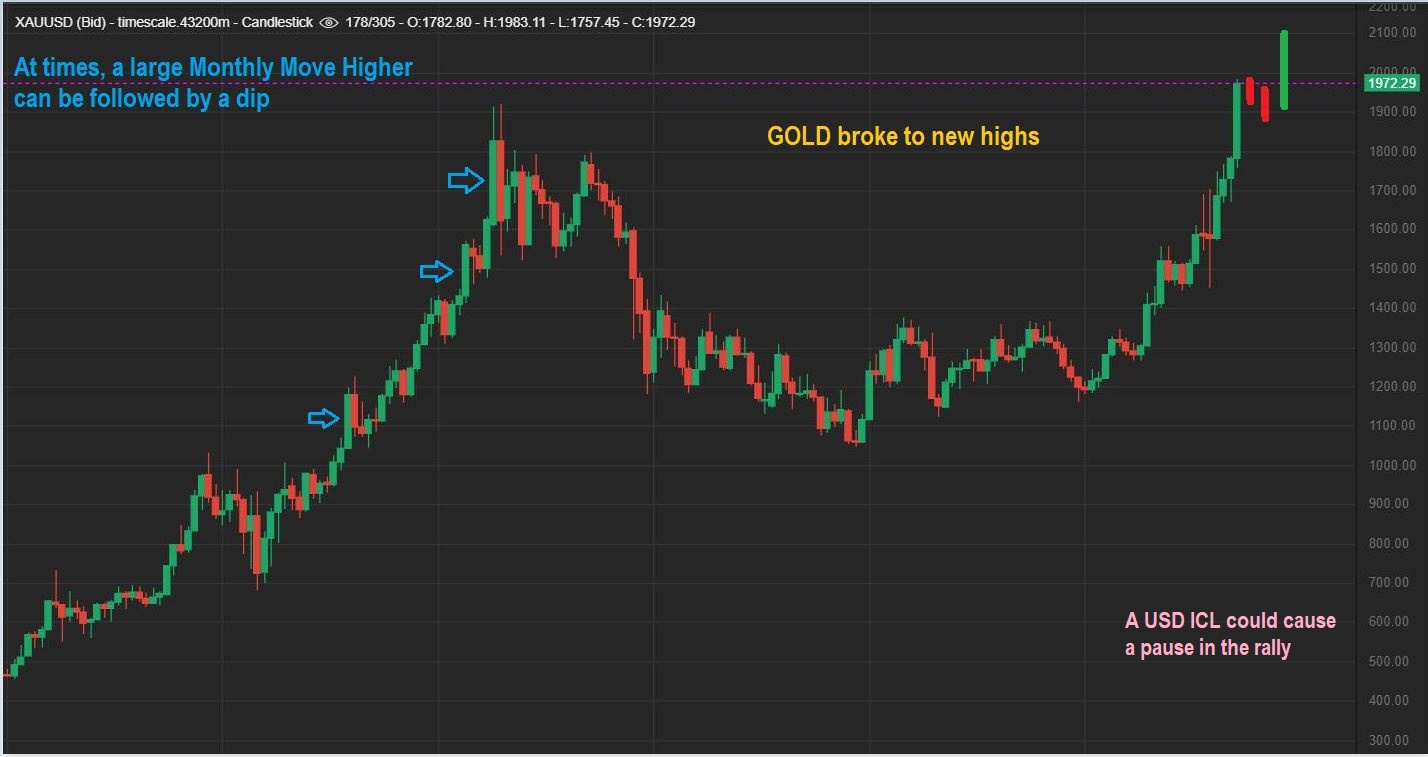
GOLD MONTHLY #2 – if we had a daily cycle or two that simply pulled back in a choppy, sideways manner, this is a Monthly continuation pattern that could develop as a mild ICL. THIS WOULD BE A MAJOR BUY SET UP. OPEN SKIES EXIST FROM HERE.
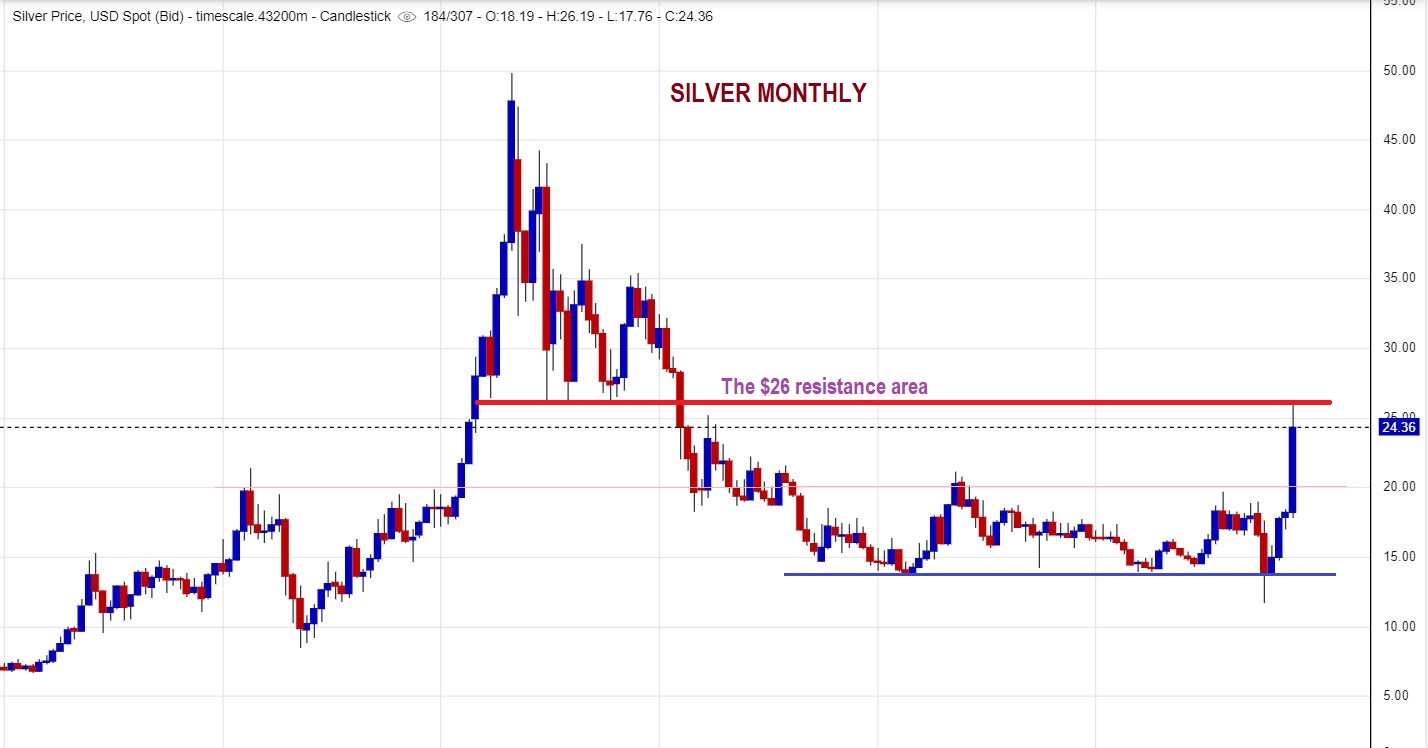
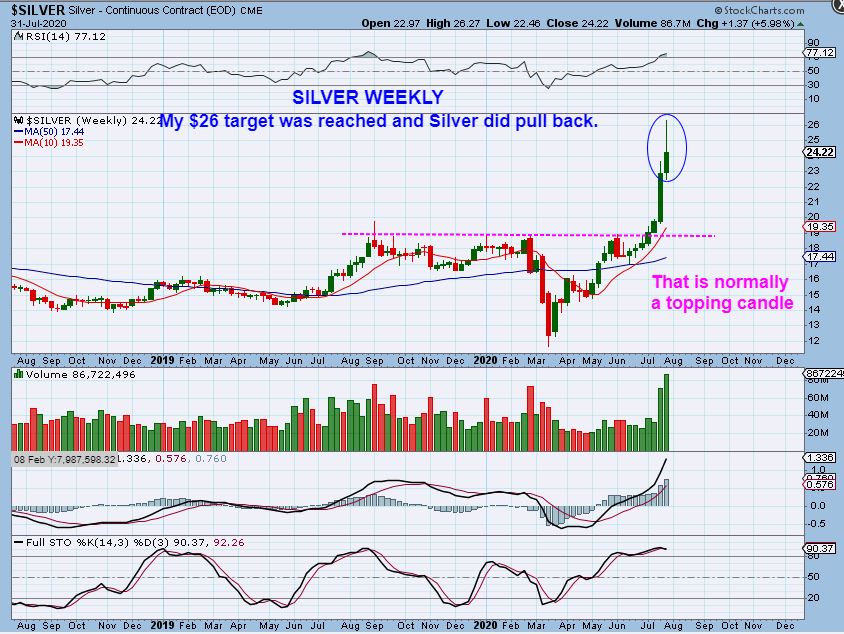
SILVER MONTHLY – Did Silver top with the USD Reversal Candle? It is quite possible. My target was the $26 area, and that is where Silver hit resistance and pulled back. That being said…
The SILVER WEEKLY CANDLE does look like a Topping candle with the USD forming a bottoming reversal. Again, this was mentioned in last weekends report as something that I would be looking for. Now I am seeing it.
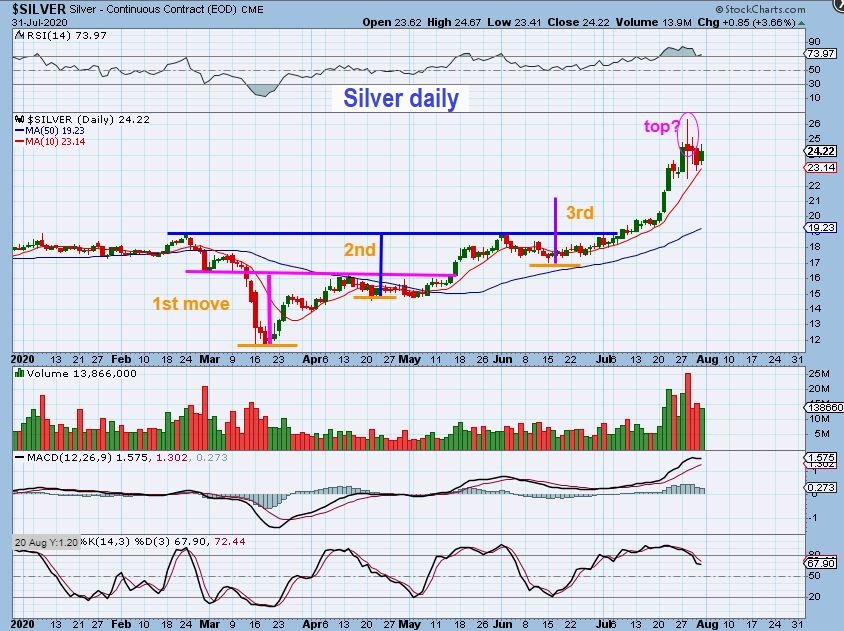
SILVER DAILY – So the daily had a topping candle near the FOMC Mtg and that has been the highs. This measured move was twice what the others did. Are we now in for a deep drop? …
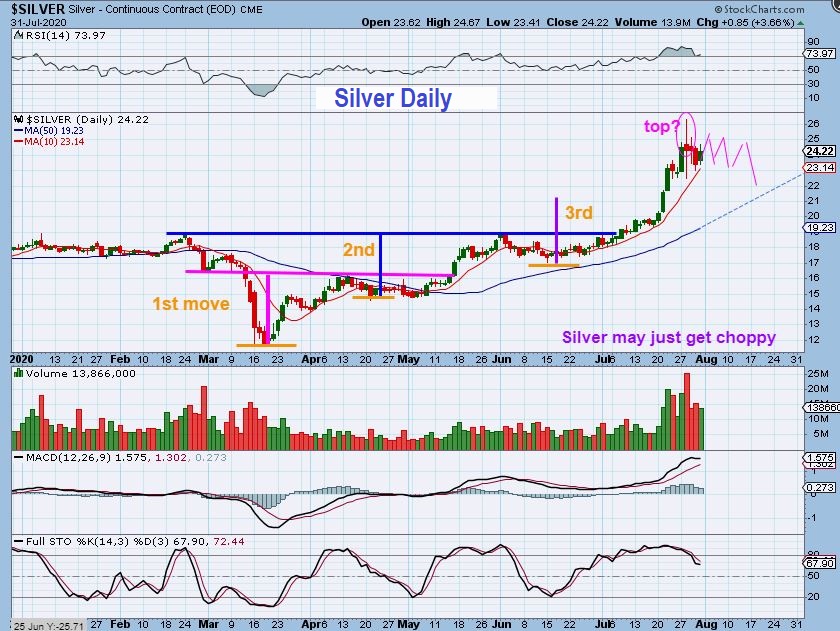
SILVER DAILY – I would say not necessarily. We could see choppiness and difficult trading for a few weeks, but it doesn’t have to be a large sell off.
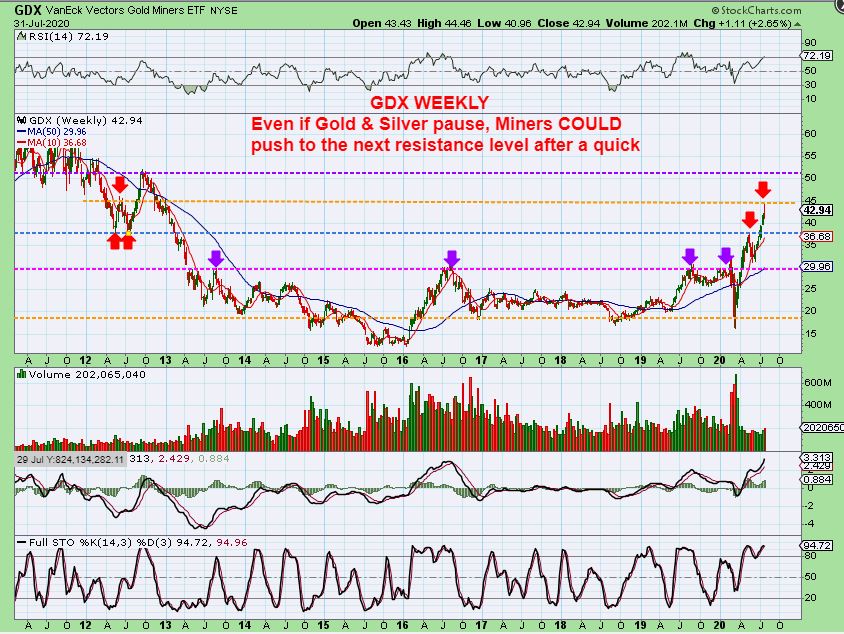
GDX WEEKLY – USING THIS CHART LAST WEEK I DISCUSSED GDX IN THE $45 ish AREA as a target to look for. See the blue line on the purple shading.
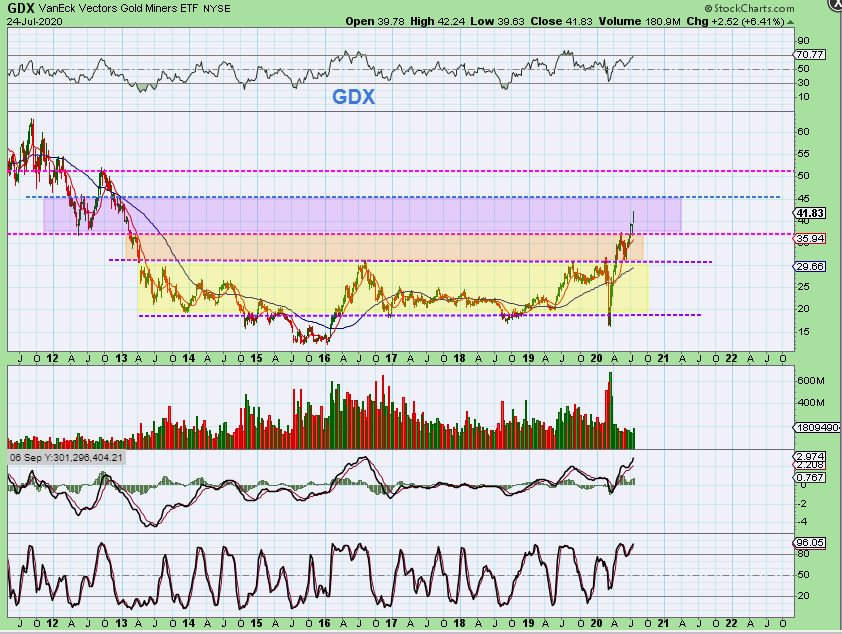
GDX WEEKLY – We hit $44.46 this week and pulled back to $42.94. The Yellow line is where we can start to pull back, but if Miners remained strong during Precious Metals choppiness, then this COULD push higher to $50 ( I do think that this is probably less likely if Silver & Gold topped).
,
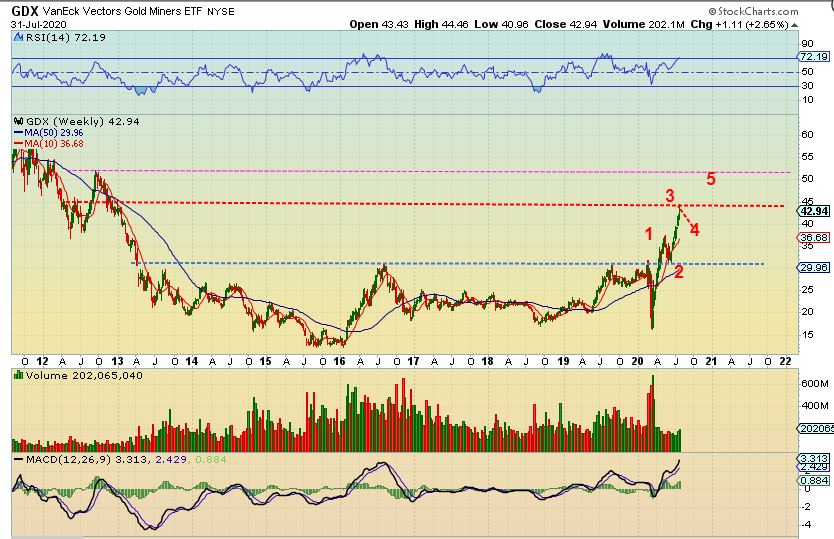
I want to show you how Nicely predictable this move has been, thus making it very reliable for us to trade it with a plan from early on. I had been expecting a break out of this mutliyear base for GDX & GDXJ, so…
.
GDX -Back on MAY 6 as we broke out , I drew this possible 1-2-3-4-5 move. Notice it was the GDX break out from the base (1), and then a back test (2), then a run to $45 ( 3) …
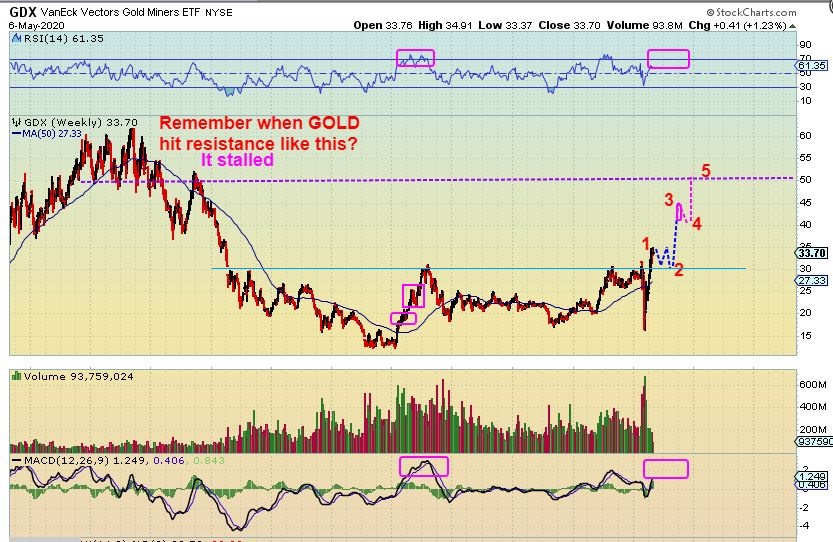
We just completed that 1 – 2 – 3 run to $45, and this is playing out very predictably. That is great.
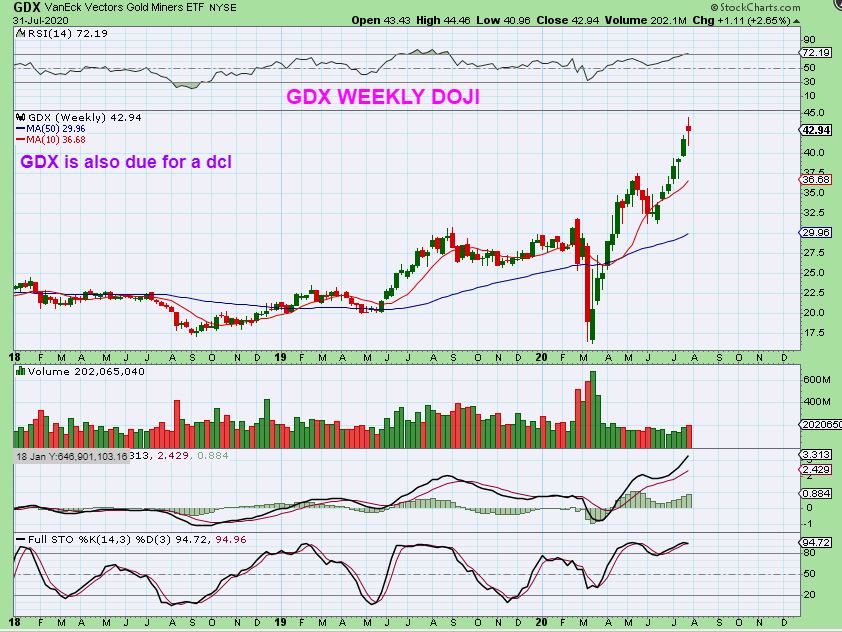
GDX WEEKLY – A close up shows that GDX put in a high doji, a candle of indecision, and that can lead to more indecision if the Metals pull back.
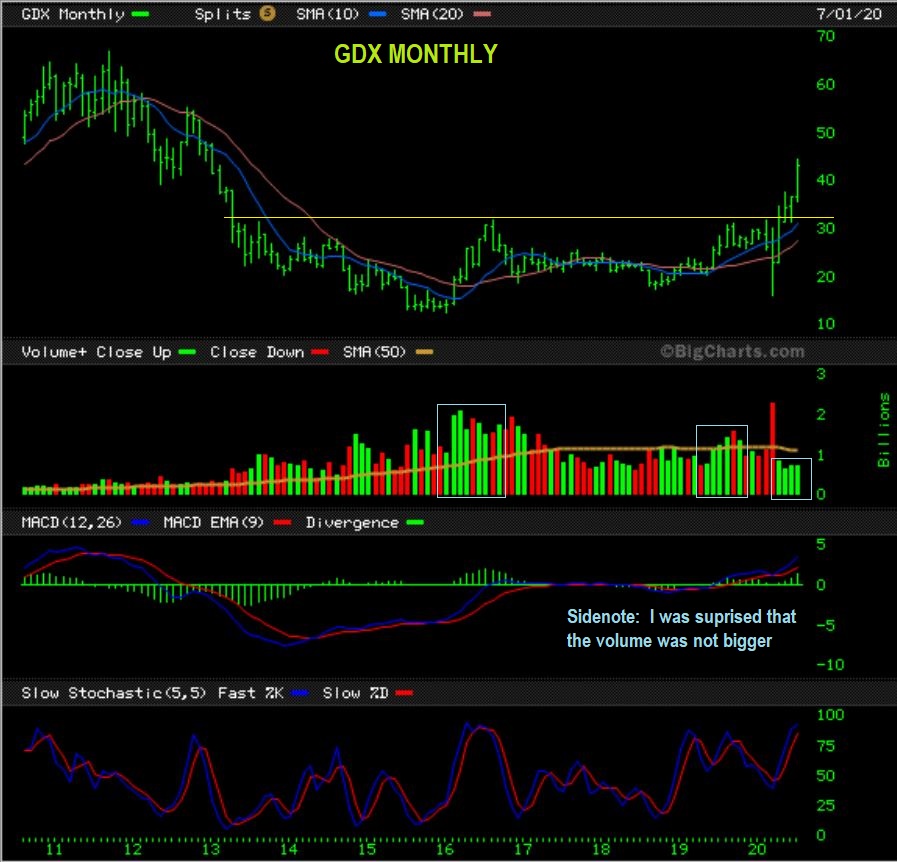
GDX MONTHLY – When I look at the GDX Monthly chart all I want to say is that with a pull back due or not, this is a Bull Chart. We have been waiting to break out from that base for years and this is what we have been waiting for. Bases are more choppy, Move to former highs can be strong. THIS was a strong 1 month move in July.
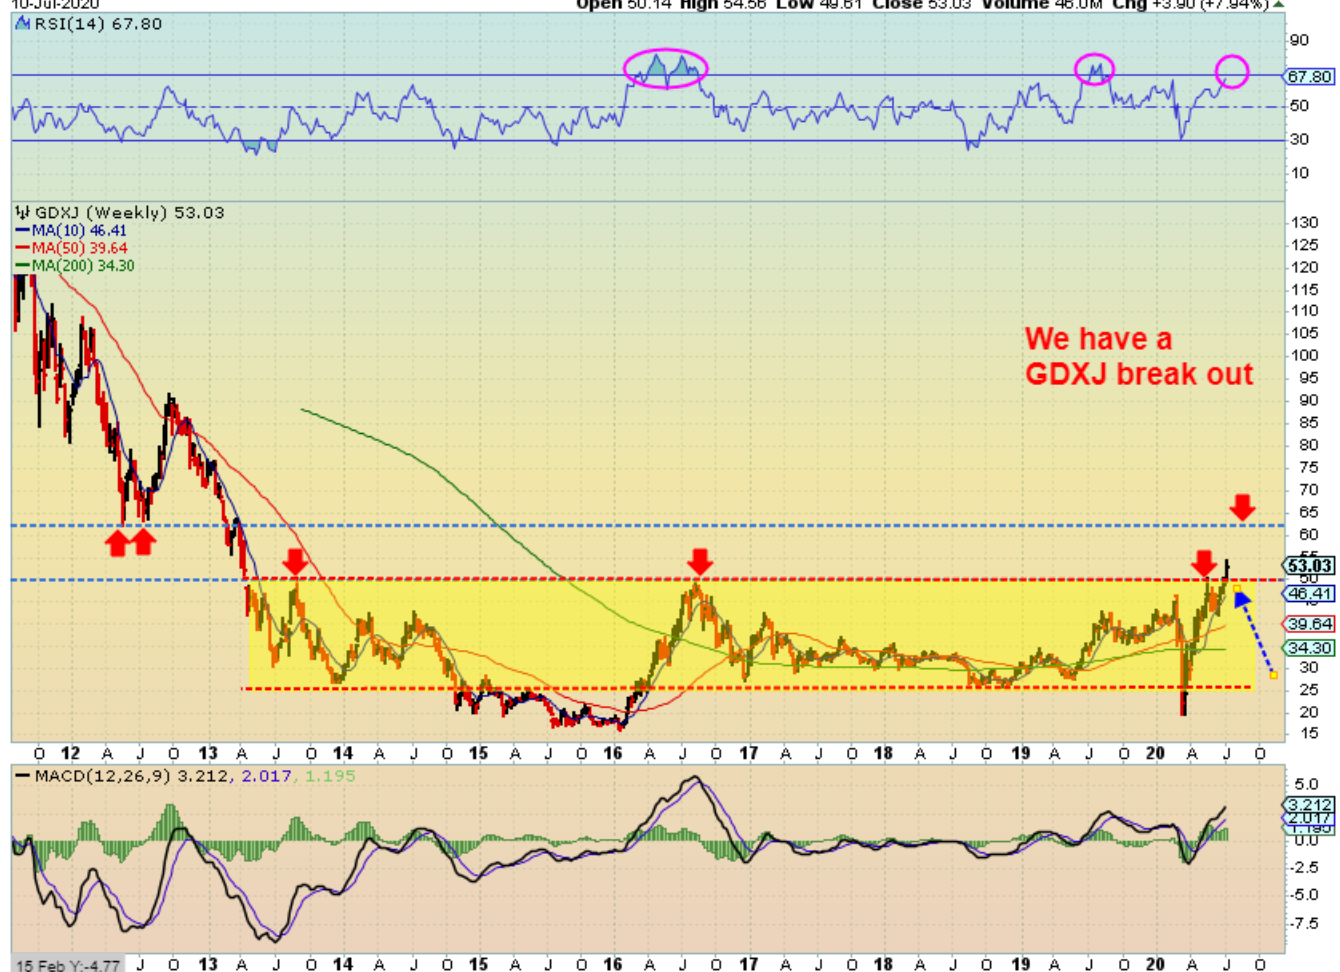
GDXJ MONTHLY – And this is very exciting. This is a BULLISH MONTHLY BREAK OUT from a multiyear base.

.
GDXJ WEEKLY – LAST WEEK I USED THIS CHART and showed the Weekly break out. I also pointed to the RSI under 70 and lack of resistance as a reason that GDXJ could go higher between $60 – $65 .
.
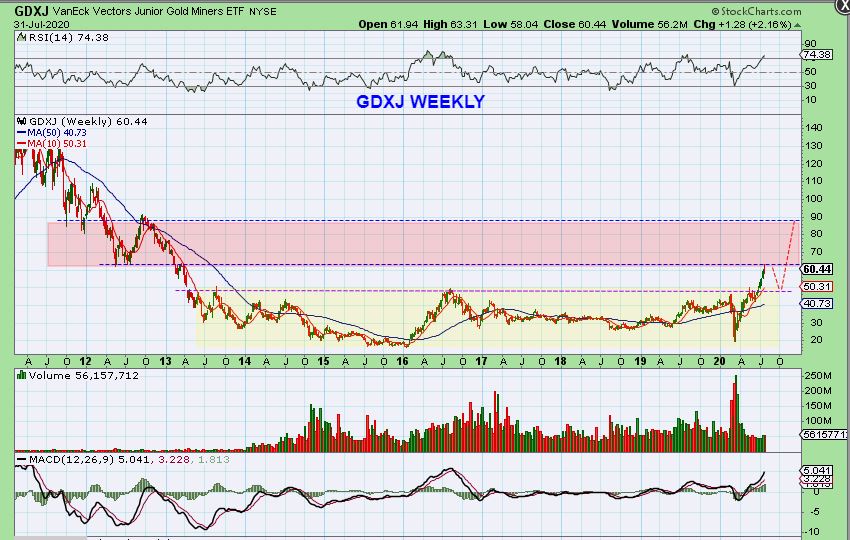
GDXJ WEEKLY – We have reached $63+ , a point of resistance and the WEEKLY RSI did push above 74. It would be reasonable to think that the move could stall here. I have drawn a back test of the break out. Do you remember when I drew GDX as that 1-2-3-4-5 move after a break out. I had a back test as one of the pull backs, so we may see that again in GDXJ this time.
GDX again with that back test shown here, as a visual.
.
We have seen a great move with the miners, but as you can see from our weekend report, it is by no means the end of the move. We can pause and pull back, but those will be buying opportunities. Gold is breaking to all time highs, Silver broke from that massive long term base and so did the Miners ( GDX & GDXJ). THEY STILL HAVE SOME GOOD UPSIDE, and that means that if you have done well and made money with this move off of the lows (base), you will continue to do well as it move up toward prior highs too. Other sectors have also been on fire, and I will continue to trade those set ups for those that wish to play along. Bitcoin/Blockchain has been exceptional in a short period of time and Biotechs are doing excellent too. They can be hard to hold when they are choppy and in a consolidation phase, but the upside moves are very rewarding. Energy / Oil trades were elusive this week. I personally thought that this week would be the start of some nice upside gains, but the chop continued and that sector will continue to be monitored for signs of strength & opportunity too. We have A LOT of trading ahead, rest up this weekend ! 🙂
.
Every now & then I stop and think about the Chartfreak service, and I sincerely do want to thank you all for being here. We have such a nice , friendly, helpful group / community in our live area, sharing ideas and positive comments and I appreciate that very much. I also do appreciate every other subscriber here along for the ride too. You are all making it possible for me to share my analysis. My ultimate goal really is to try to help you all to make some money, and I’m excited about what I see with many great opportunities ahead. This looks to be a very strong Bull Market developing & playing out in the precious metals alone. So thank you all for being here and I hope you all have a great (safe) weekend !
.
~ALEX
.
QUICK REVIEW
.
USD WEEKLY POSSIBLE BOTTOM CANDLE REVERSAL
SILVER WEEKLY Also looks like a topping candle. We could pull back.
SILVER MONTHLY TARGET of $26 at resistance was met. It started to pull back.
.
SILVER Pullbacks lately have been choppy, sideways and rather mild. We could see ‘chop’ instead of a sharper drop.
GDX WEEKLY – I had the $45 area as a target, GDX hit $44.46 this week and pulled back to $42.94.
GDXJ WEEKLY – I had $60-$64 and we hit $63, a point of resistance and it would be reasonable to think that the move could stall here. I have drawn a back test of the break out as a possibility in an ICL type move. We may need another daily cycle before an ICL drop.

