August 15th Weekend Review
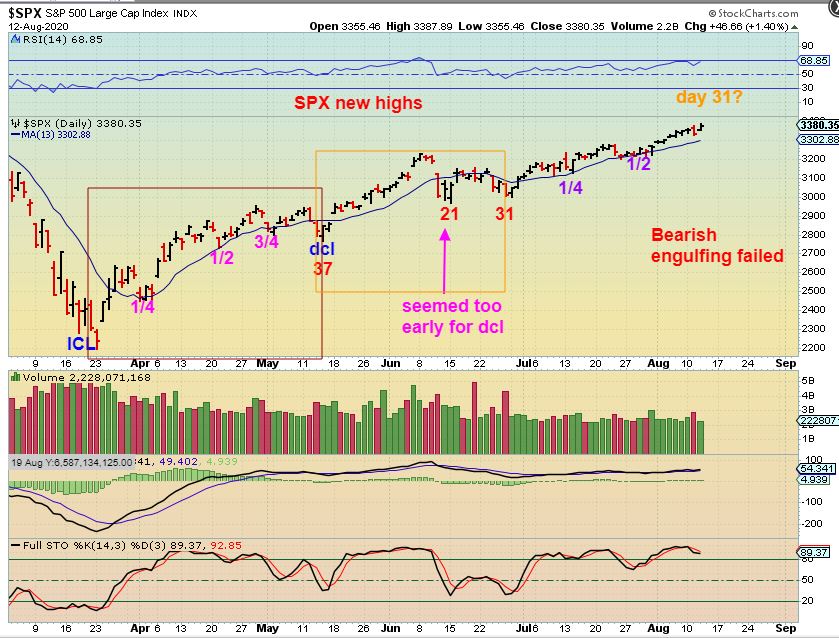
SPX DAILY from last week: Just a reminder that we are getting late in the daily cycle, and that would indicate that we would be due for a dip soon ( into a dcl). Friday was actually day 33, and these Daily Cycles can be 40 days long give or take a few days.
.
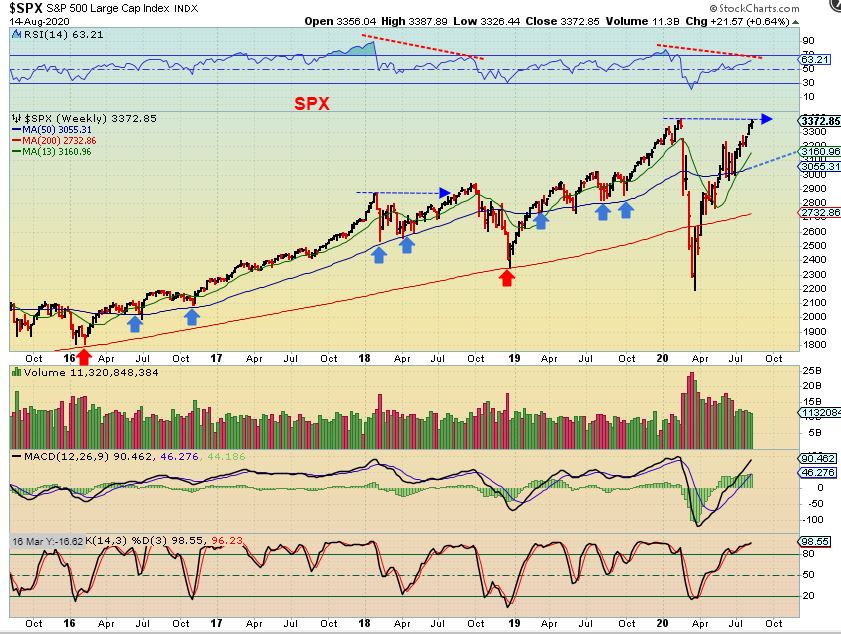
SPX WEEKLY – The Big Picture has us at the highs again, and we do see alittle divergence. That matches that we would be due for a pull back sometime in the near future. Is that it? Do we just double top and that is the end of the run? You would think so due to the economic fundamentals, but…
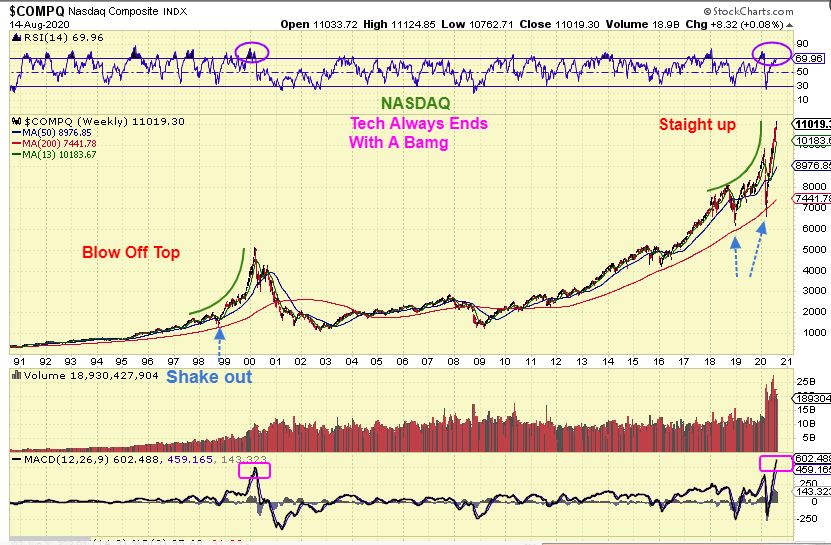
NASDAQ WEEKLY -The NASDAQ is going straight up, and it looks like it wants to do a repeat of that 2000 tech Bubble, with a parabolic blow off top. It is hard to predict when they will end. The RSI is divergent and not even above 70 again (yet). Obviously this looks good now, but this may not end well in the long run. These runs are usually not sustainable. We go step-by – step in the weekday reports.
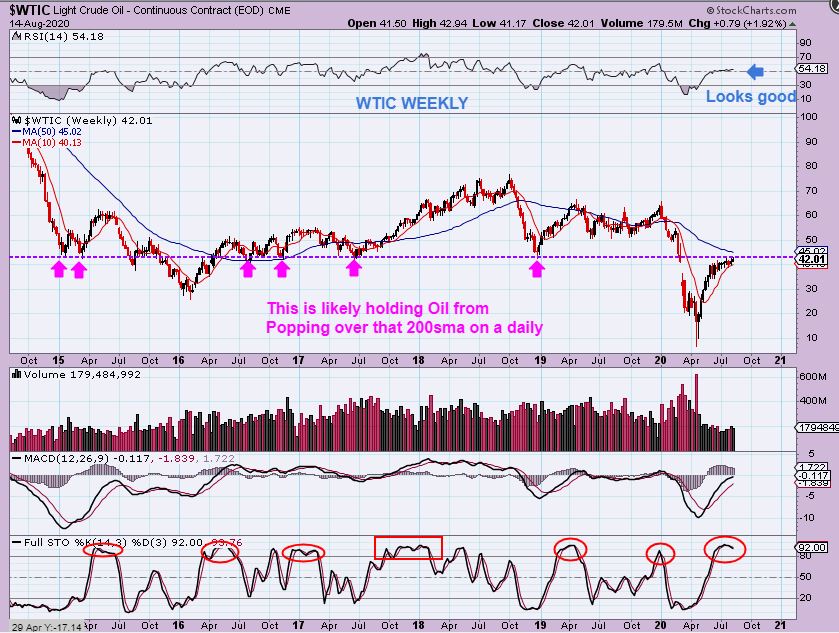
WTIC Oil has been unable to get above that 200sma on the daily chart. What is the problem?
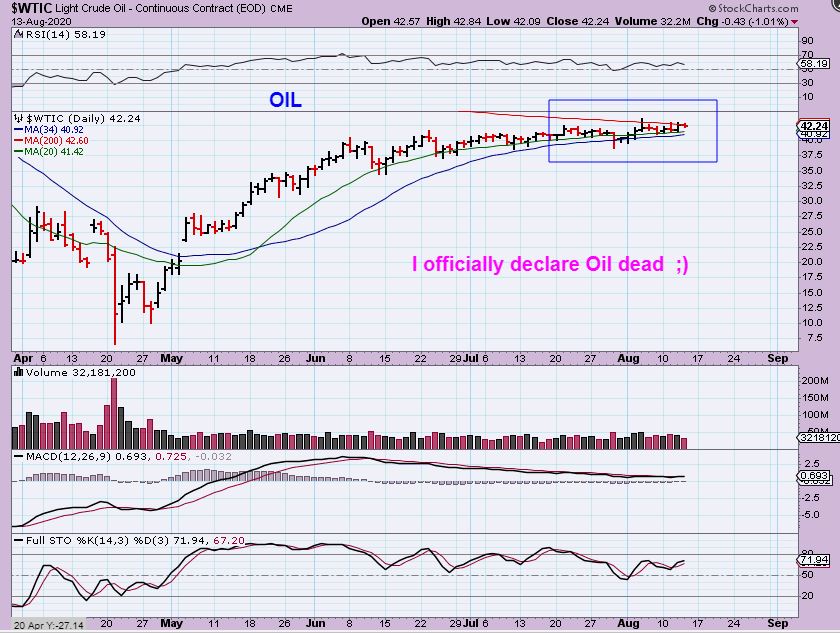
WTIC WEEKLY : On the weekly chart, we see that Oil is at a solid resistance point (Magenta Arrows) . I’ve been expecting a push through it higher, but the longer that that takes, the weaker an intermediate cycle could become, so we want a break out sooner than later.
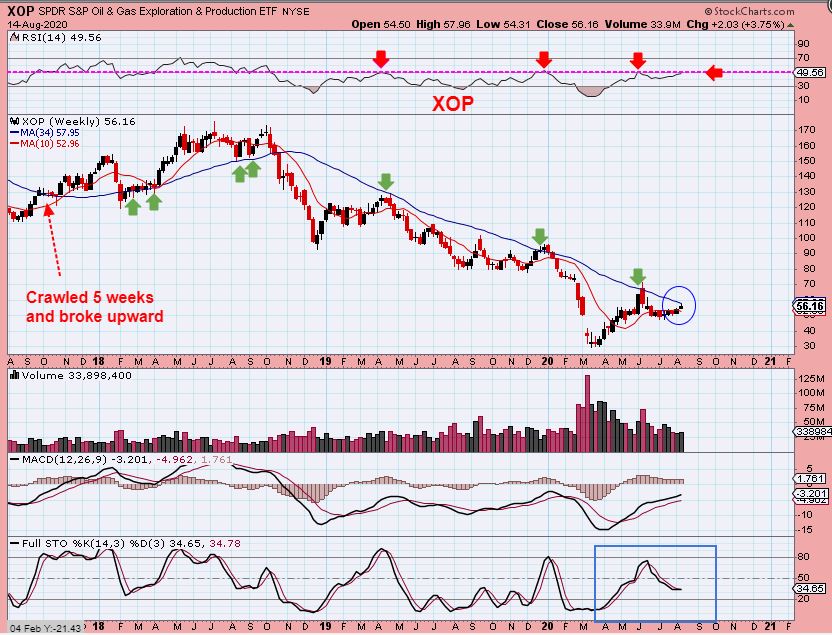
XOP WEEKLY – We have been waiting for the XOP to run higher, but it has stalled with Oil. You can see that it was a good run out of the ICL (we made money on that 1st leg up this spring with OAS, CPE, APA, AROC, PACD, SLCA, PVAC, CLB, etc , but what about the 2nd leg higher? I’ve been waiting for a 2nd leg up…
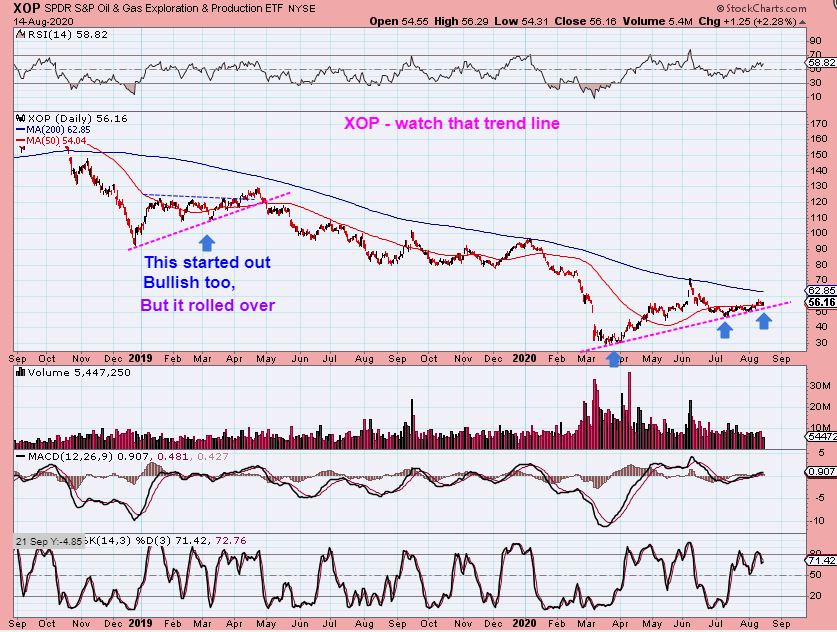
XOP DAILY -The Oil / Energy Stocks have been doing ‘ok’ off of the recent July lows, but they are stalling now too.
.
THEN I noticed that coming out of the Dec 2018 ICL, they looked good too, but had a weaker 2nd leg up also. That 2nd run broke the trend line & sold off in April 2019 , so I am going to keep an eye on that trend line too. We are on the trend line now, so a tight-ish stop will help. We want to see a push higher next week in my onion.
.
PRECIOUS METALS
.
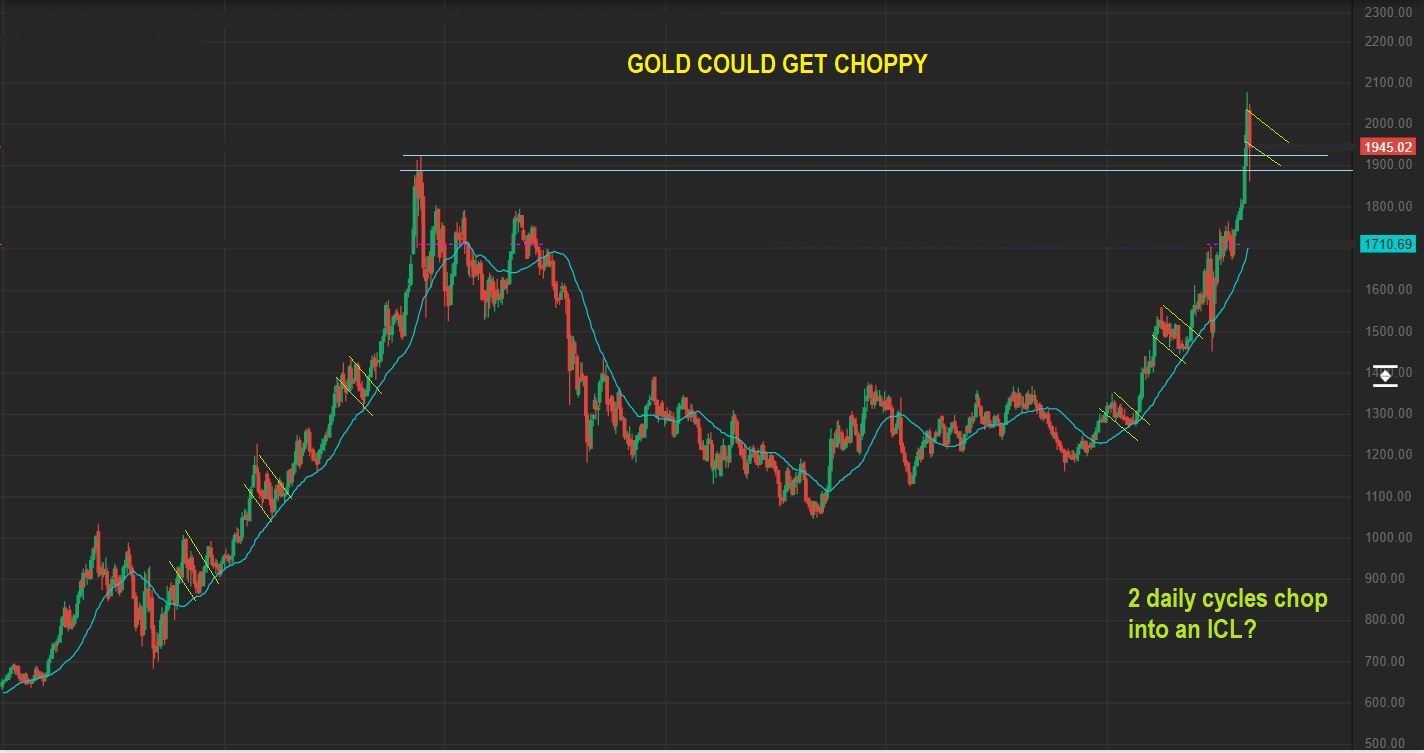
GOLD WEEKLY #1 – The weekly candle can be a form of a topping candle again, and we had one last week too. It’s called lingering at the top if they start piling up.
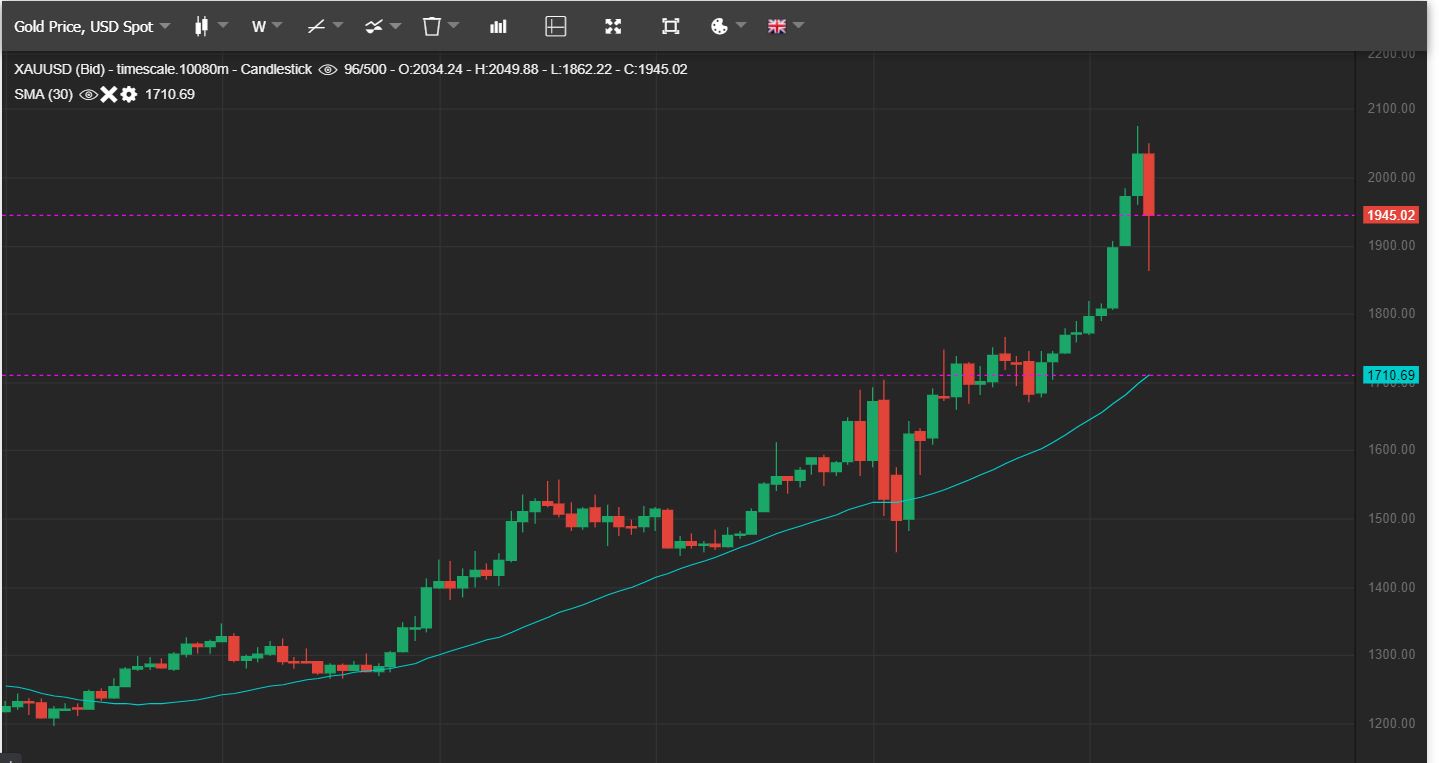
GOLD WEEKLY #2 – You may recall that GDX had 2 weekly topping candles too. That doesn’t mean that we immediately have to sell off, but GDX hasn’t moved higher, and Gold may not from here either, until after a drop into an ICL. On the chart, I have pointed out other Topping candles that led to a gradual drift lower ( ICL). This could chop sideways / lower.
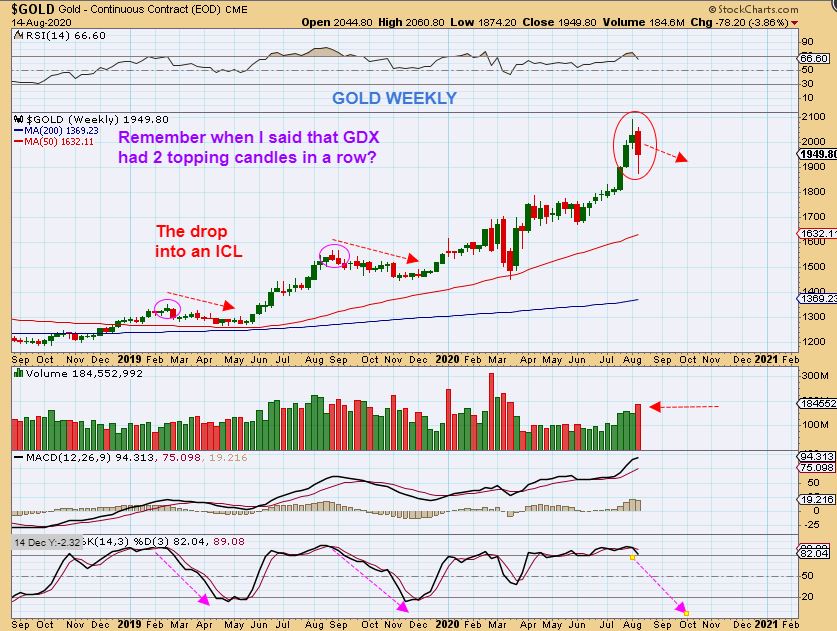
GOLD WEEKLY #3 – And that would be normal, it would look like this .
SILVER WEEKLY – This also have 2 topping type candles in a row. Last week was heavy volume in GOLD & SILVER. This week did not go higher than last week.
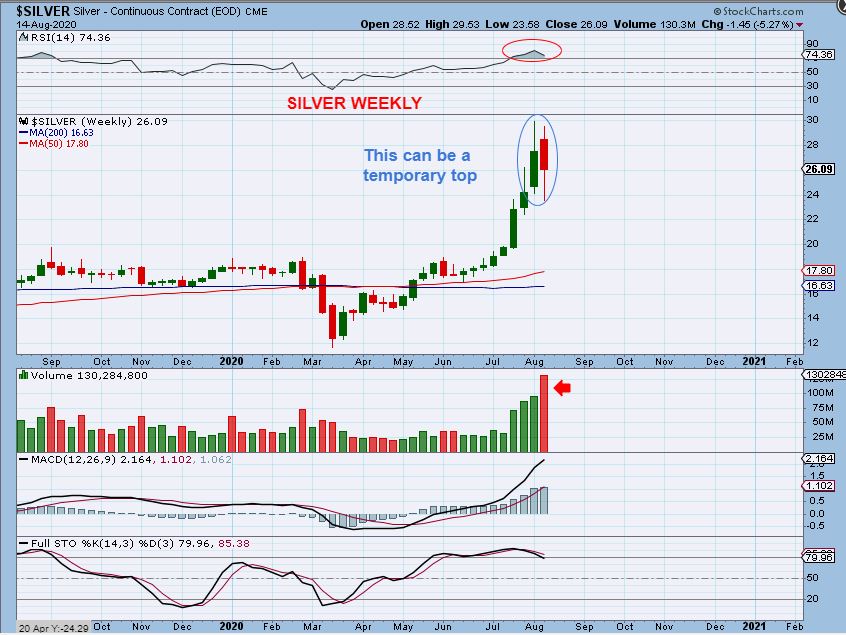
SILVER DAILY – SO if we chop around in this daily cycle, you could get a sideways chop on the daily like this, or…
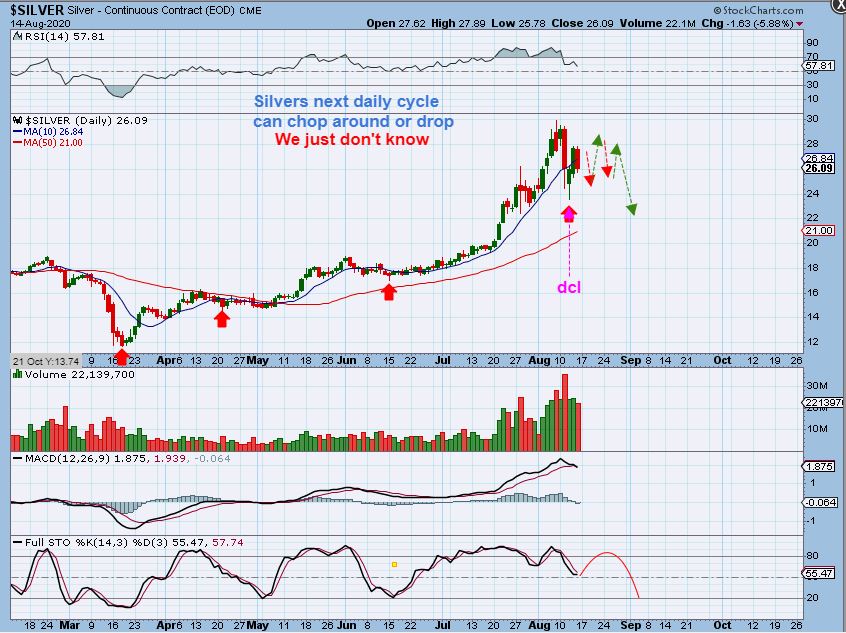
SILVER DAILY – There is nothing that says that Silver can’t break to new highs and then start to drop into the next dcl ( And eventually the ICL). Silver did seem heavy last week though.
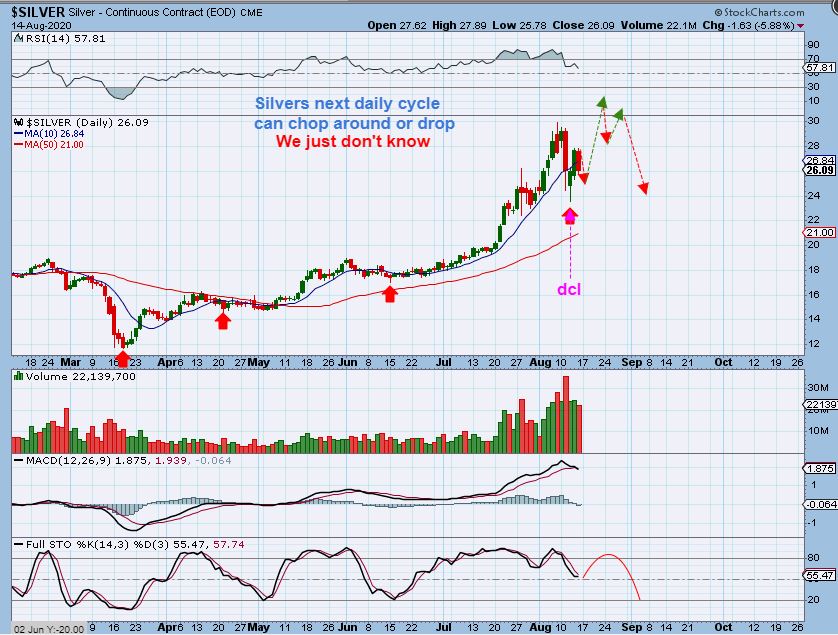
SILVER BIG PICTURE – And you my recall that I pointed out that $26 area as resistance, and Silver chewed right into it. Last week it reversed lower, back to $26, so we could chop around a bit. If we chop & drop from here, it would resemble that 2010-2011 run to the top.
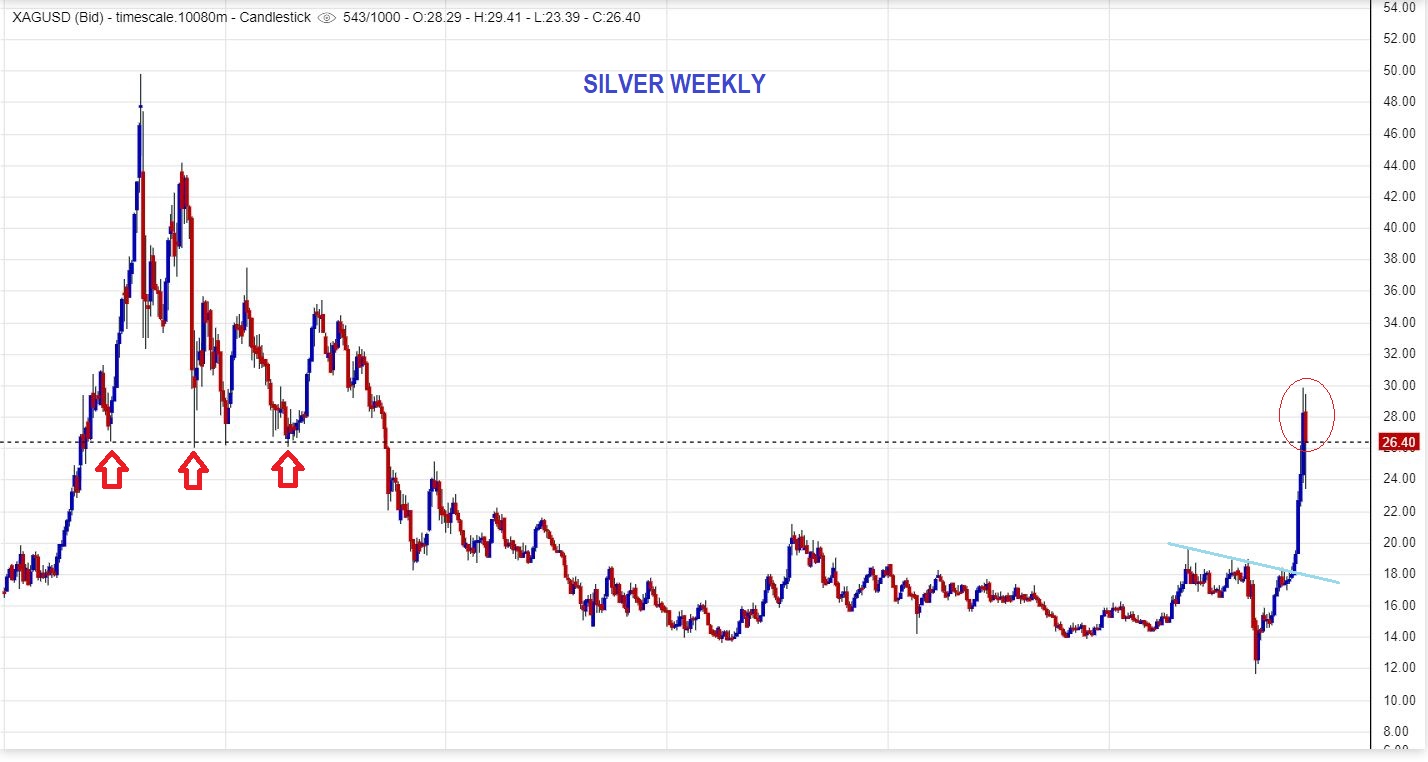
SILVER 2010 – 2011 run to the top : As a weekly chart, if we chop and stall for a few weeks, we could resemble that steep run in 2010-2011. This would be the next ICL. A strong buy.

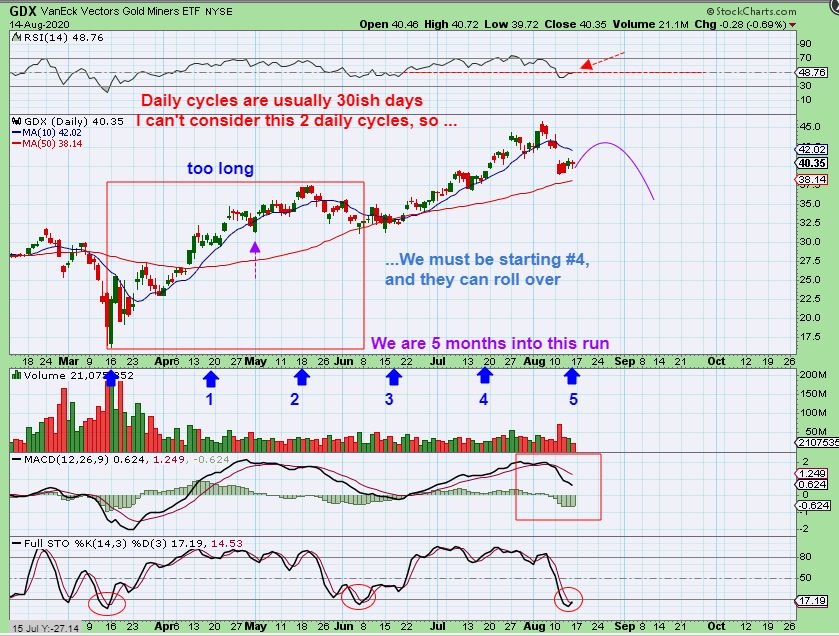
GDX WEEKLY – 2 weeks ago I mentioned pulling back to the break out as a back test similar to that one in 2012. We have now done that. Now do we Pop to new highs like then, and then drop to an ICL, or do we just chop around? It is hard to say, but we had 2 weekly topping candles on GDX, and then a big drop. Let’s look at the daily…
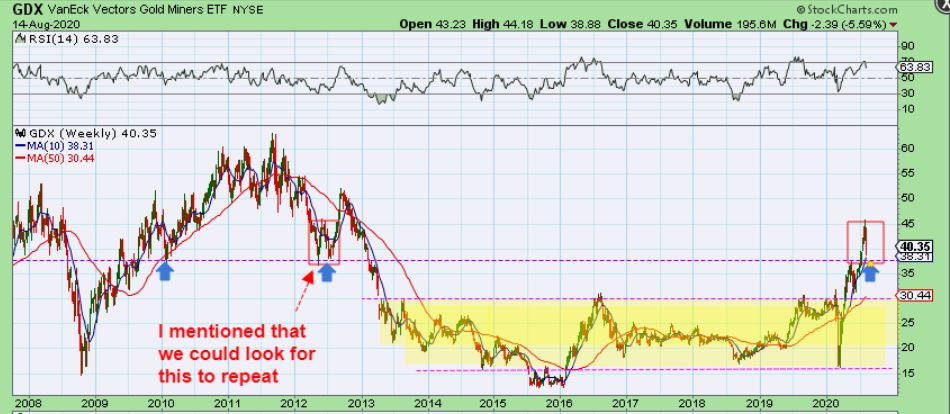
GDX DAILY – That red box is too big for 1 daily cycle, so I think it is important to look at ‘time’. That is the length of 2 daily cycle, that was followed by another daily cycle, so this would be the ‘timing’ for a 4th daily cycle. They often pop up early on, and then start to roll over into a dcl drop. THAT can be an ICL, or you get a 5th daily cycle and chop into that ICL. We could get an ICL in October.
GDX WEEKLY – This run looks as good as or better than the 2016 famous run. Notice the similarities now. That 2016 run
– (Red arrow) A run out of the lows, dipped ( Green Arrow) and had a 2nd leg higher. This one has
– (Red Arrow) A run out of the lows, A dip (Green arrow) , and a 2nd leg higher too…
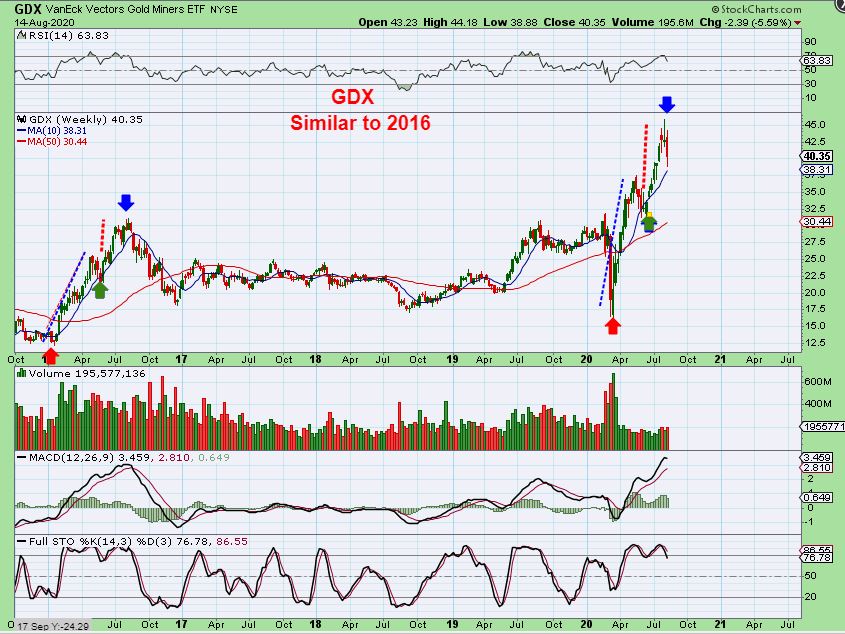
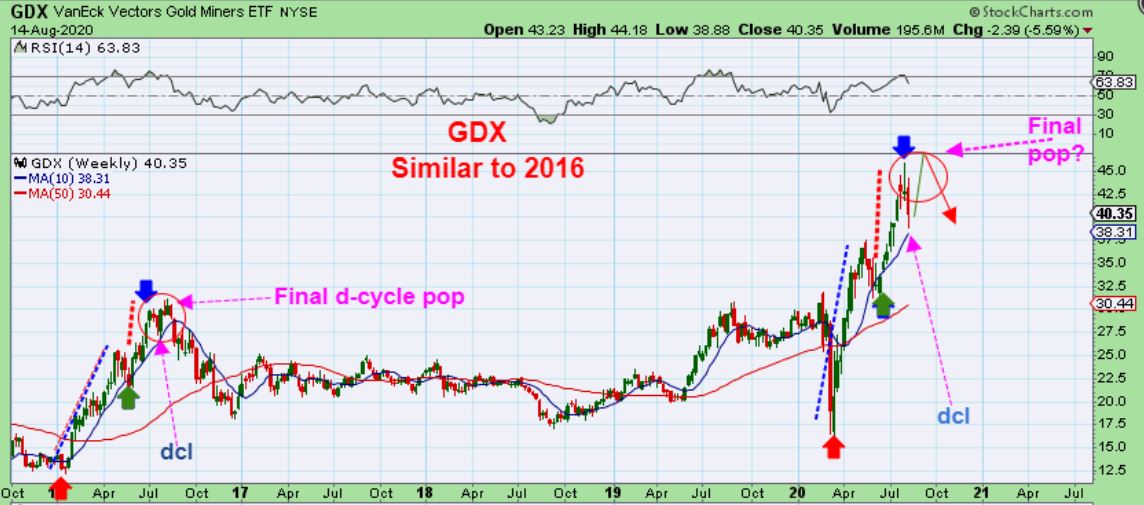
GDX WEEKLY CLOSE UP – At the top of the 2016 run, there was a small double top , with the 2nd pop higher than the first. THAT was the top. Could we do that now with the new daily cycle starting? A new high? It is possible.
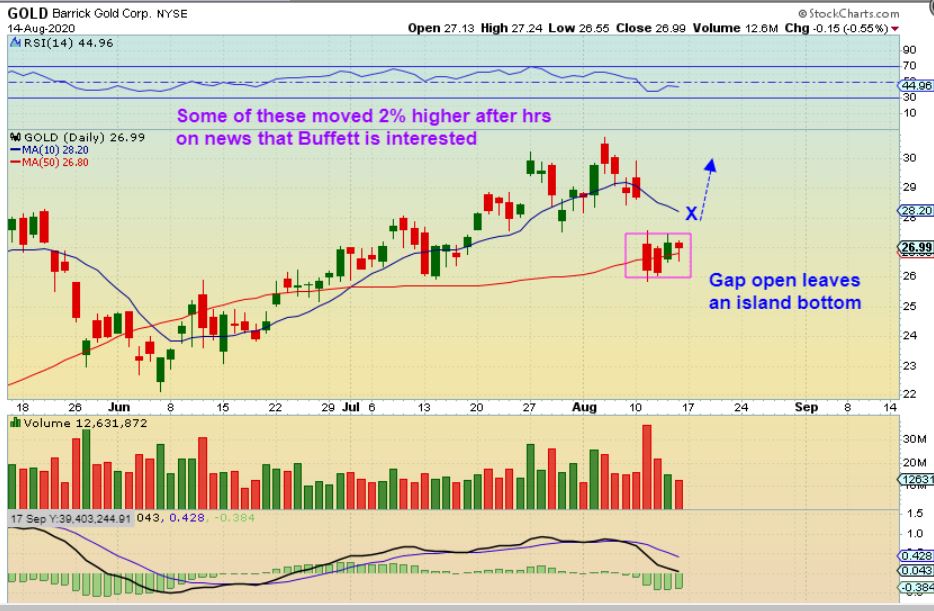
BARRICK GOLD – A few Miners went higher in after hrs on news that Warren Buffet ( a long time outspoken down-player of Gold or Miners investment value) , became a buyer of Barrick. IF they gap open Monday, these could look like Island Bottoms. A bullish low for now. We’ll see what Monday brings.
.
The General Markets have been strong, but they are coming due for a dip into a dcl. That Intermediate Cycle is also aging, but the NASDAQ looks parabolic, so we’ll just keep using trailing stops after buying dips and take it day by day.
.
OIL has been sideways forever, I am still hoping that some good Energy trades develop, similar to what we saw in the first run out of the ICL. I am cautious because of that Dec 2018 low that I pointed out. It had a nice run and then broke that trend line & sold off. Stay Frosty.
.
Precious Metals have had a stellar run higher and seem to be topping. It makes sense, since we are 5 months out of the March ICL, and they often run from ICL to ICL in 6-7 months. We have seen a sharp quick drop, and I think that we should be at a DLC with the recent swing low. If things play out as expected, we are likely in the timing of a 4th daily cycle, and I just have to recommend CAUTION. You can buy the lows, ride the push higher, but just be alert to the idea that often a L.T. Daily cycle can start to top after 2 weeks. It can also be choppy. I will look for signs of strength or weakness along the way in our daily reports.
.
In addition to that review: I just want to say that we have been making a good bank of gains in the Miners and Biotech sector alone, after coming out of that slam down ICL in March. Energy trades were great in March through May, Tech & Blockchain trades have added fast gains too. Several readers here have told me that they have ‘padded their accounts’ quite nicely over the past few months. That is great, and now we just want to make sure that if things start getting more choppy, due to the age of the intermediate cycles, we don’t give too much back. Since March , we rode up & out of an ICL, going forward, we may be chopping down into one. That is a big difference .
Honestly, we always give ‘some’ back , it is part of trading. We let the winners ride, or lock in some gains on Big Pops, but at times we get clipped or chipped here and there too. At the next ICL, we can make good gains again, but for now?? As time goes on in an Intermediate Cycle the ‘easy money’ has usually been made early on as almost everything goes up together. We see Shorts covering out of the lows, Buyers buying dips, etc. Trades play out very bullishly as expected. Now what happens is the Intermediate Cycle is getting along in age. It starts to show weakness and can get choppy. Even some of the good looking set ups weaken & start to break down ( earnings , bad news, etc is not ignored anymore). So now there is a bit more choppiness and under those conditions, it may be better to try to keep position size smaller. It may also be best to even trade less than you normally do, if it gets really choppy.
.
During this time I inevitably find myself in cash more and more, as even some of the good looking set ups begin to fail. I’m being stopped out (mental stops or hard stops) more than early in the cycle. I may start to hold smaller positions, because I don’t want to give the gains back & chip away at the account. I eventually find that I have more cash on hand than I have positions open. The good news? Another ICL will be coming soon enough if we start to see a sell off, so even though I will do some buying & trading, I also want to have cash on hand going forward.
,
Thanks for being here, and Enjoy your weekend!
.
~ALEX
.
ONE EXAMPLE OF A GOOD SET UP GONE BAD:
.
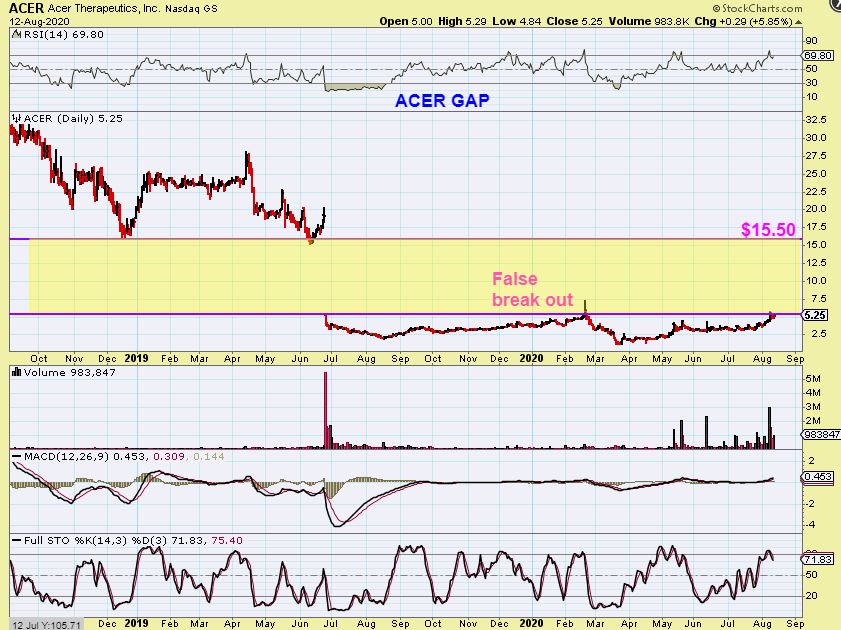
ACER WEEKLY – This is called ‘Easy come, Easy go’. 🙁 I really liked the longer term set up of ACER, so I accumulated at the low of the wedge and added on the move higher. We got a STRONG POP in early August, Gains galore. Friday alone saw ACER selling off, GAINS NO MORE. This week those gains went through an evaporation process, and I got out after hitting 2 stops. This is just an example of winning & losing because I didn’t sell the pop like I usually do. Why didn’t I sell the Pop?
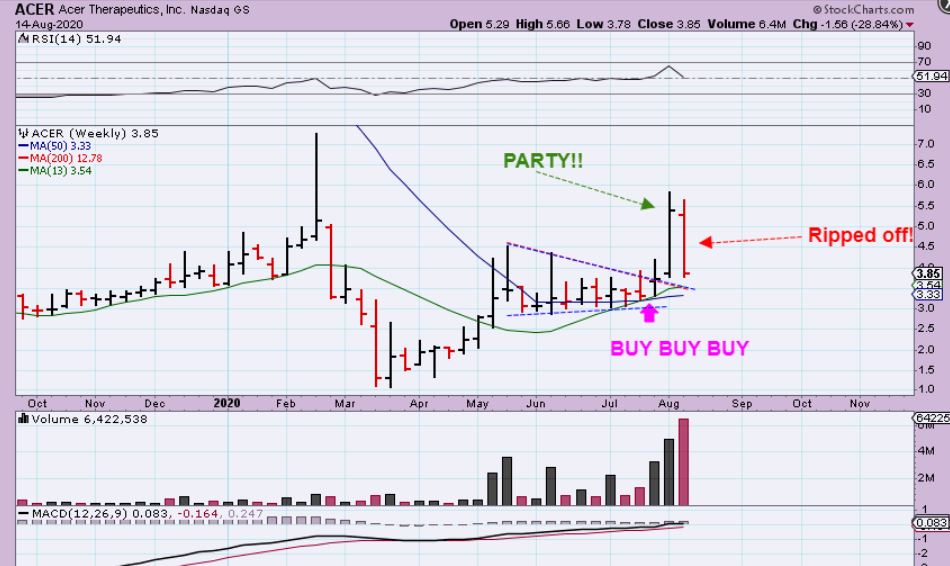
I fell in love with this long base and the possibility of a GAP FILL. Now it is back at $3.80. I will keep it on the radar, but for now it is another lesson learned. It seems to work out better for me when I go a bit heavier in the base, and then at least sell something with the POP. That has worked out the best for me ( us) with HTBX, NAKD, VISL, NOVN, BIOC, MARA, etc etc .