July 15 – Kangaroo Markets
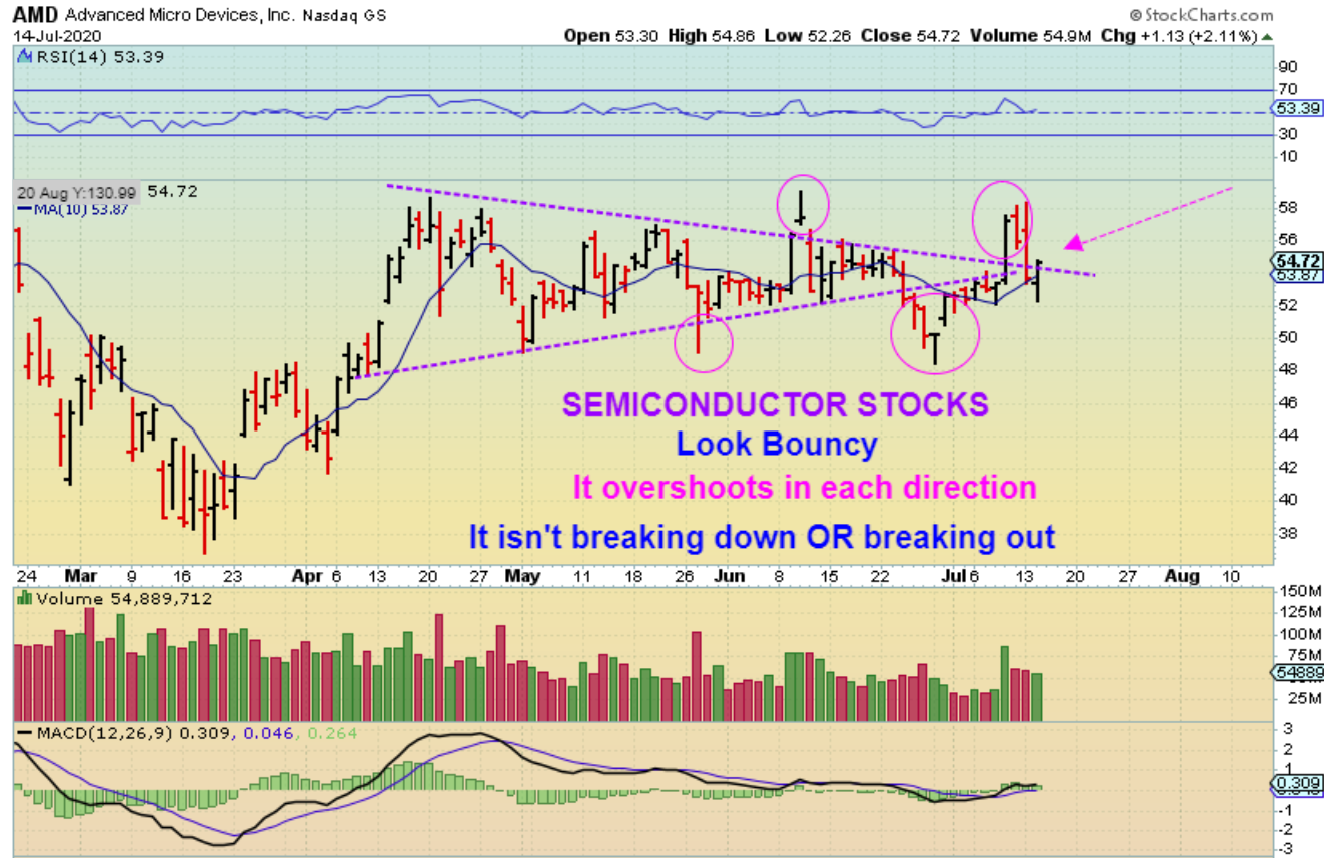
Did you know that the Term ‘Kangaroo Markets’ is a real thing? I first saw it on CNBC, and I drew on this snap shot to help you to see what exactly a”kangaroo Market” is. It is a market that just continues to hop around sideways with almost equal buying and selling. 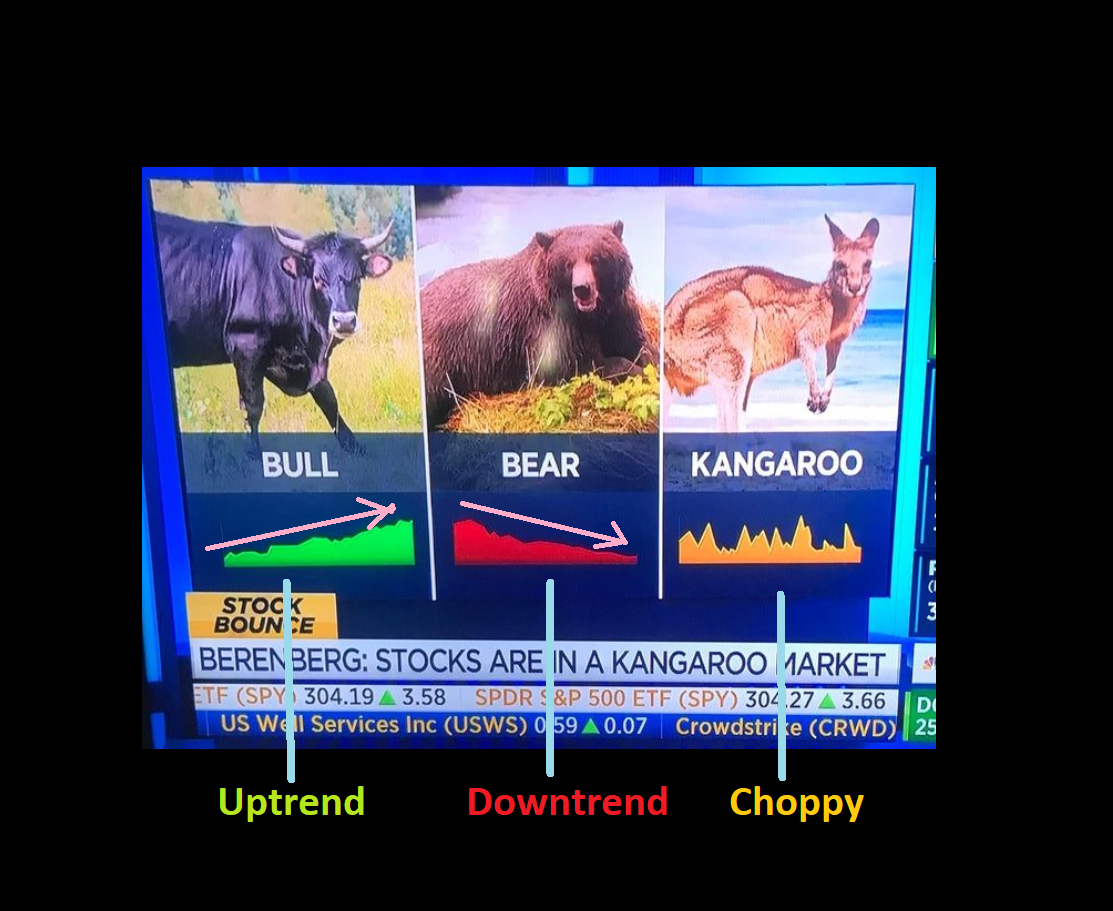
Lately we see loads of buyers hopping into a stock and Popping it out of a base, and then suddenly loads of sellers quickly start taking profits, not allowing it to trend higher (yet).
Unfortunately, under those conditions a trend (Up or Down) doesn’t begin until they get out of the way. Instead we get a sideways topping process, or a sideways base at the lows, with the repetitious POP & DROP action. It may be causing out Markets to chop at the highs and lows too. .
Let’s discuss the markets, which also seem to be a bit choppy at the moment.
.
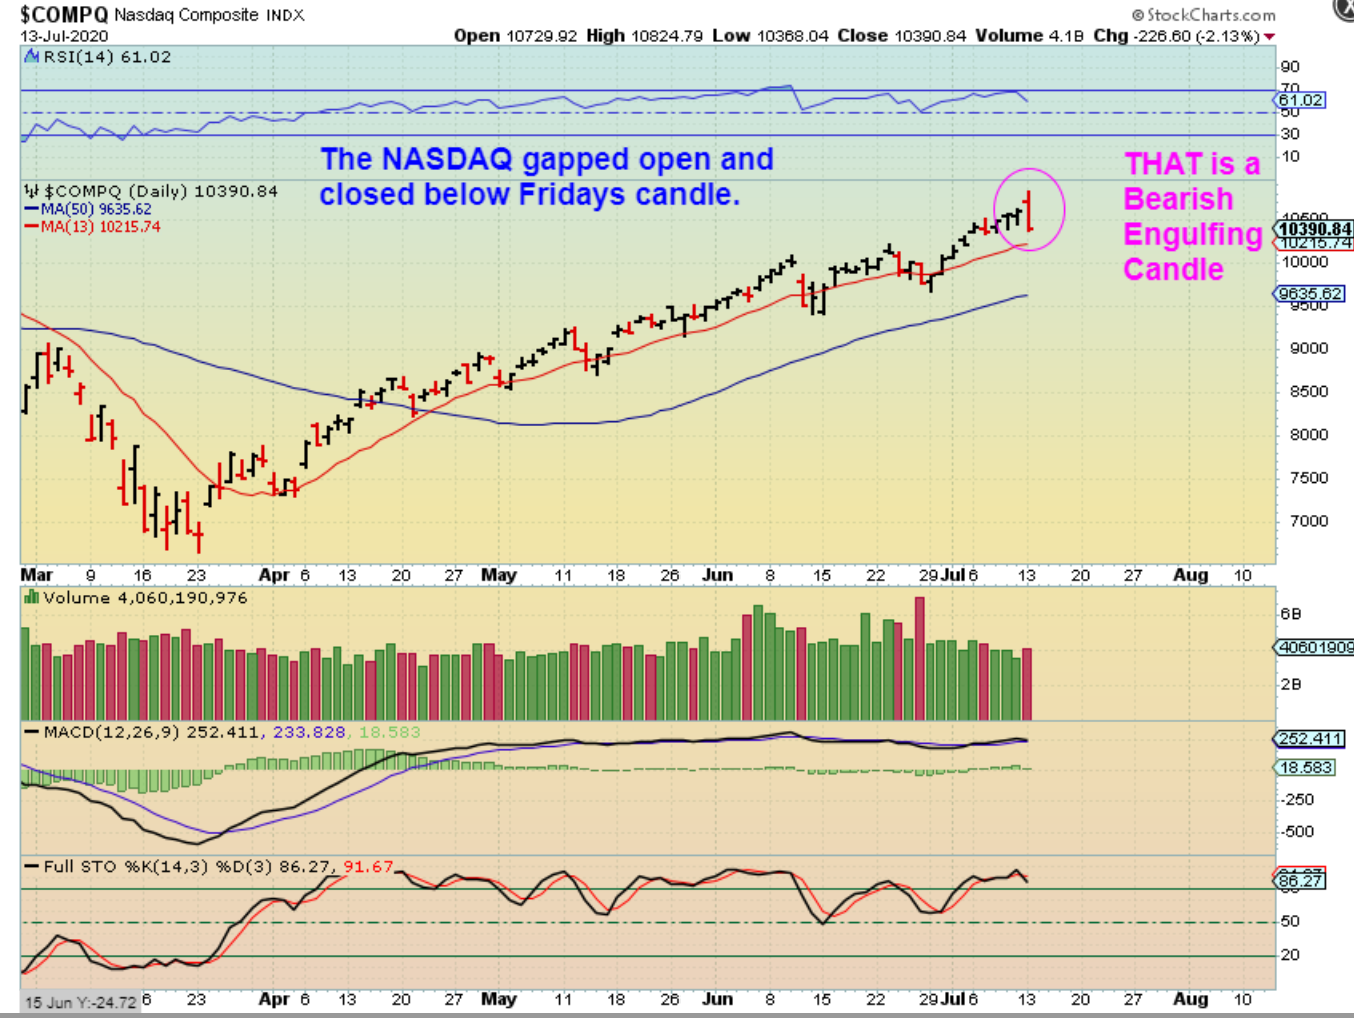
Yesterday I showed how the NASDAQ had a bearish engulfing. I wrote this:
NASDAQ – This is a bearish engulfing. After a rally a Bear Engulfing is a sell signal in technical analysis. It doesn’t always have immediate downside follow through, so this doesn’t mean that we are about to crash on Tuesday, but we certainly may have topped.
.
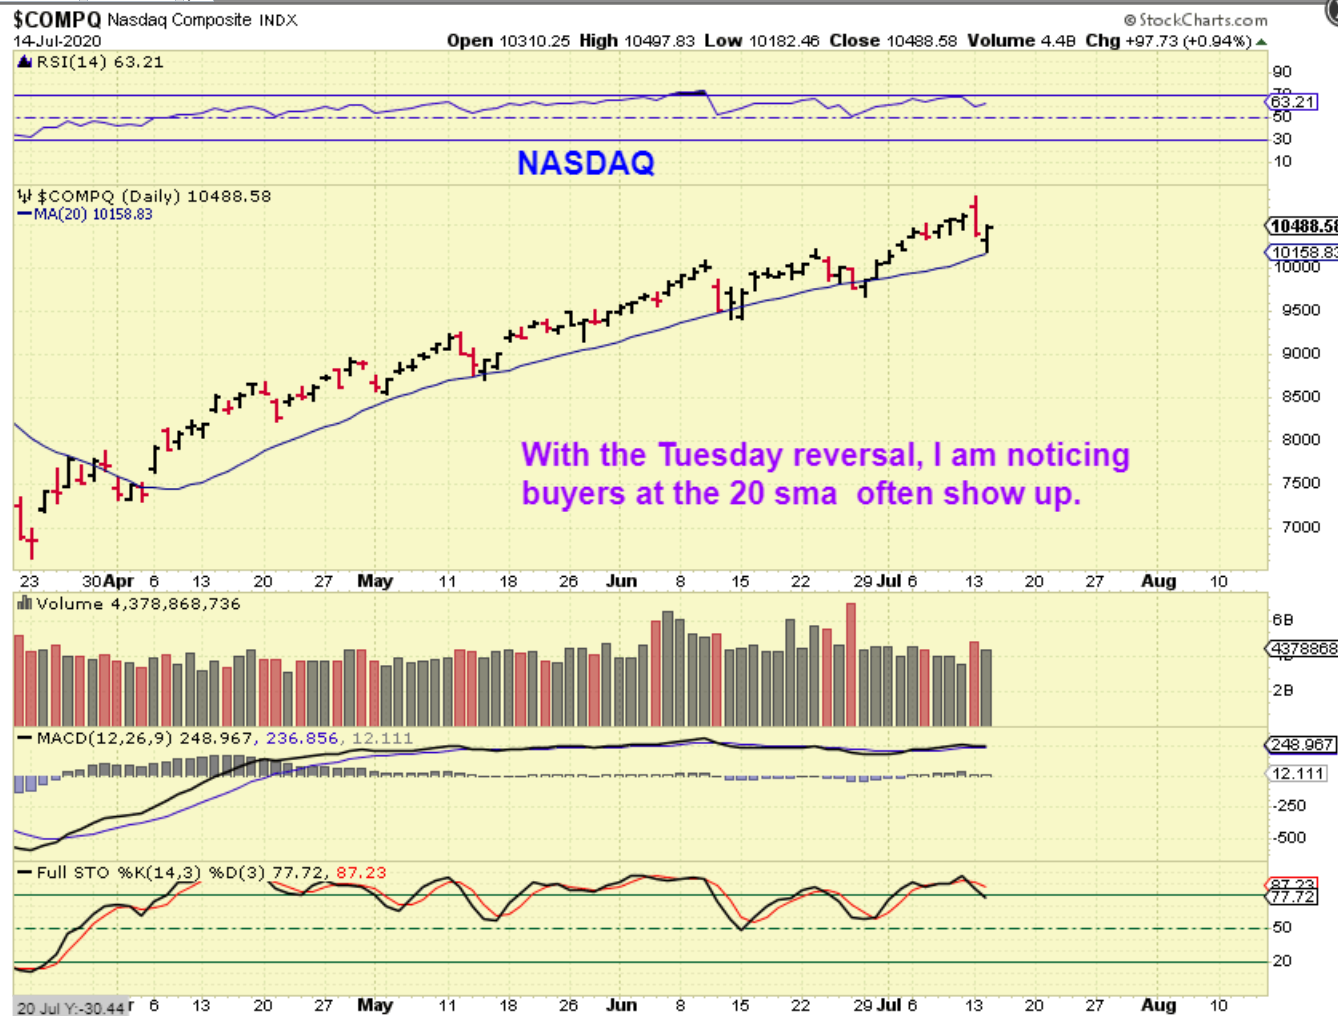
NASDAQ – I was surprised to see such a strong looking reversal, and look at how the 20 sma is affecting price. Anyone that shorted the bear engulfing now needs to be careful. A kangaroo market might have a tricky top. Currently we see lower lows and higher highs off of the 20sma at this point. ( a new stop instead of the 10sma?).
.
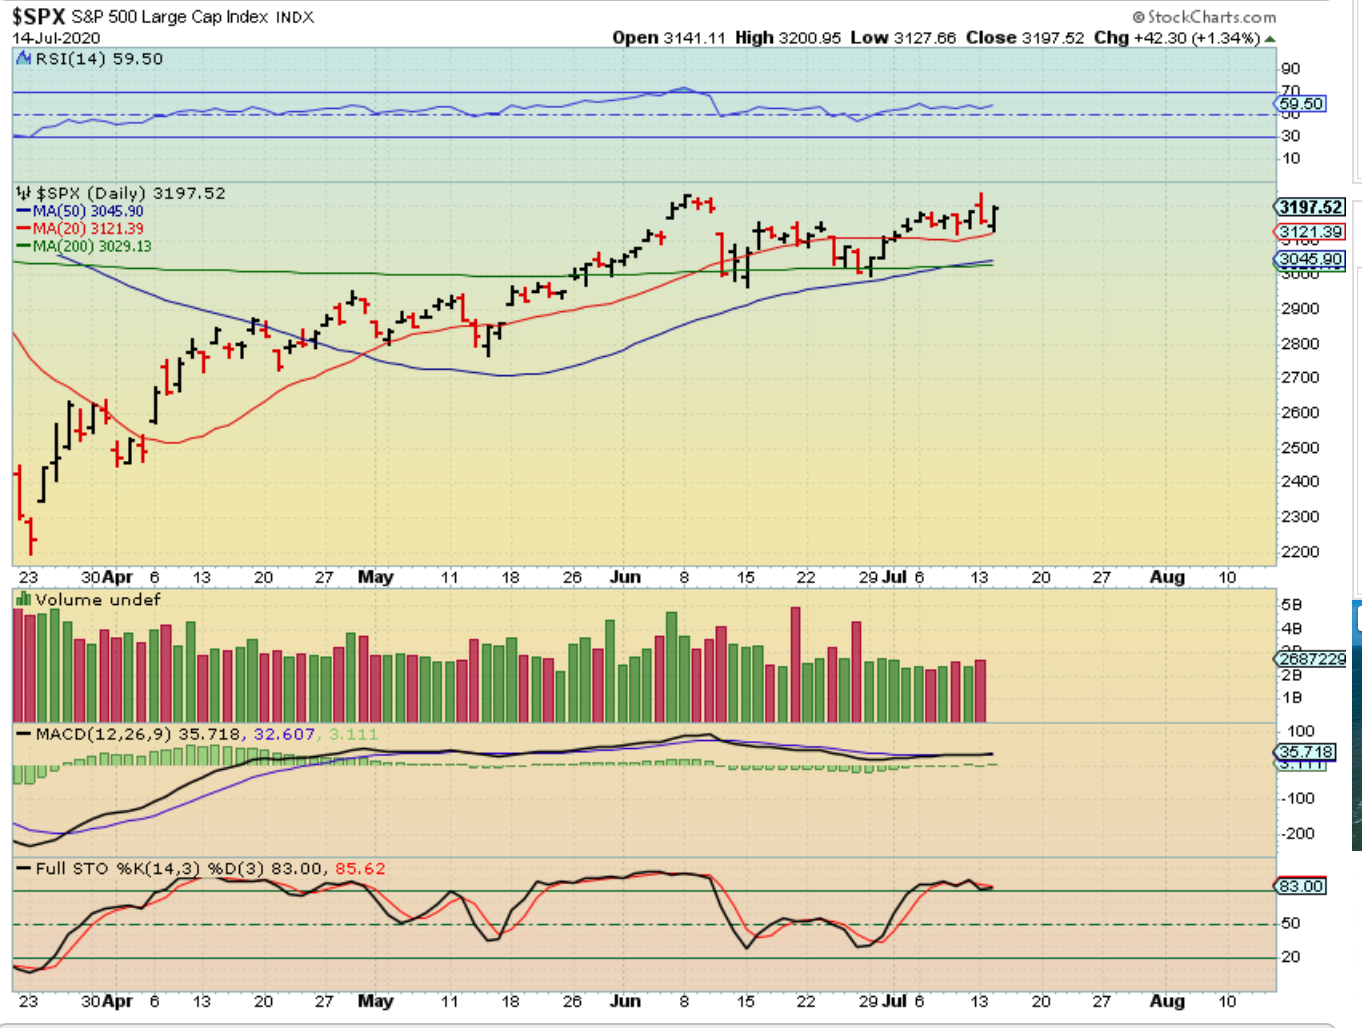
THE SPX did not have a bear engulfing and price reversed off of the 10 sma and took back most of the Monday candle. If the SPX moves higher, it completely wipes out the down day Monday and goes from bullish to bearish to bullish.
.
I want to mention Something Else here : I saw that reversal candle Monday in the NASDAQ & the SOX and I wanted to short the markets using SQQQ & SOXS. SOXS is shorting the semiconductors and they also looked like they’d roll over…
.
1 day later they look bullish again? Kangaroo market? Please read this chart and it applies to AMD, MU, TSEM, etc . Wouldn’t you agree that They look Bullish one day, and bearish the next? Read the chart…
.
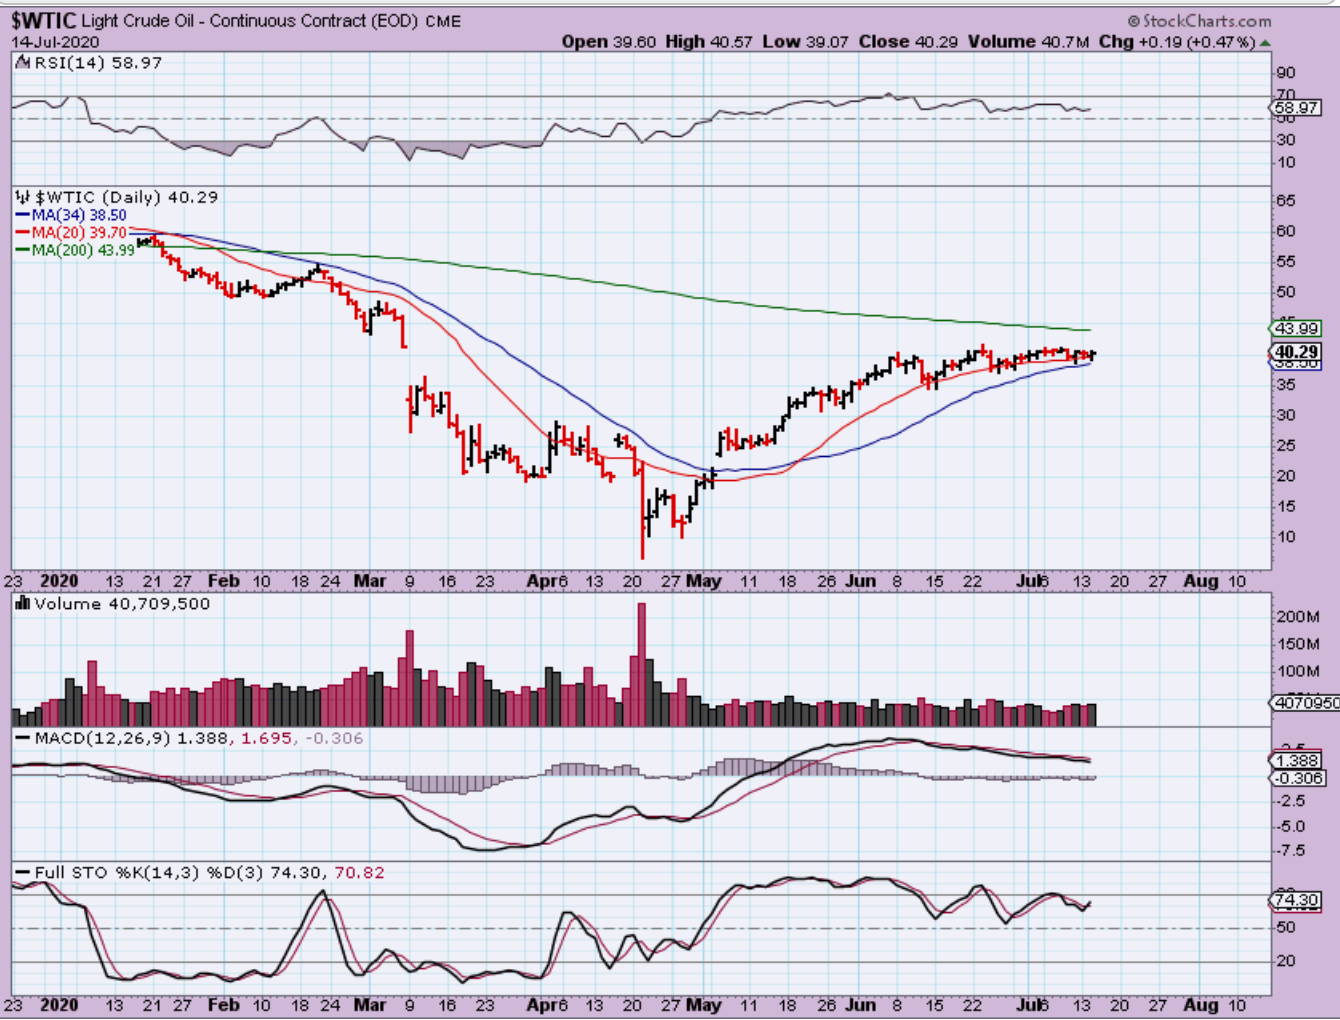
WTIC is just in a tight sideways price movement. I’ve been waiting for a quick drop to give us a visible DCL, but a ‘Visible’ dcl may not present itself. We may have a type of ‘triangle’ formation that hides the low. This is DAY 58—- OR—- A stealth low has already formed.
.
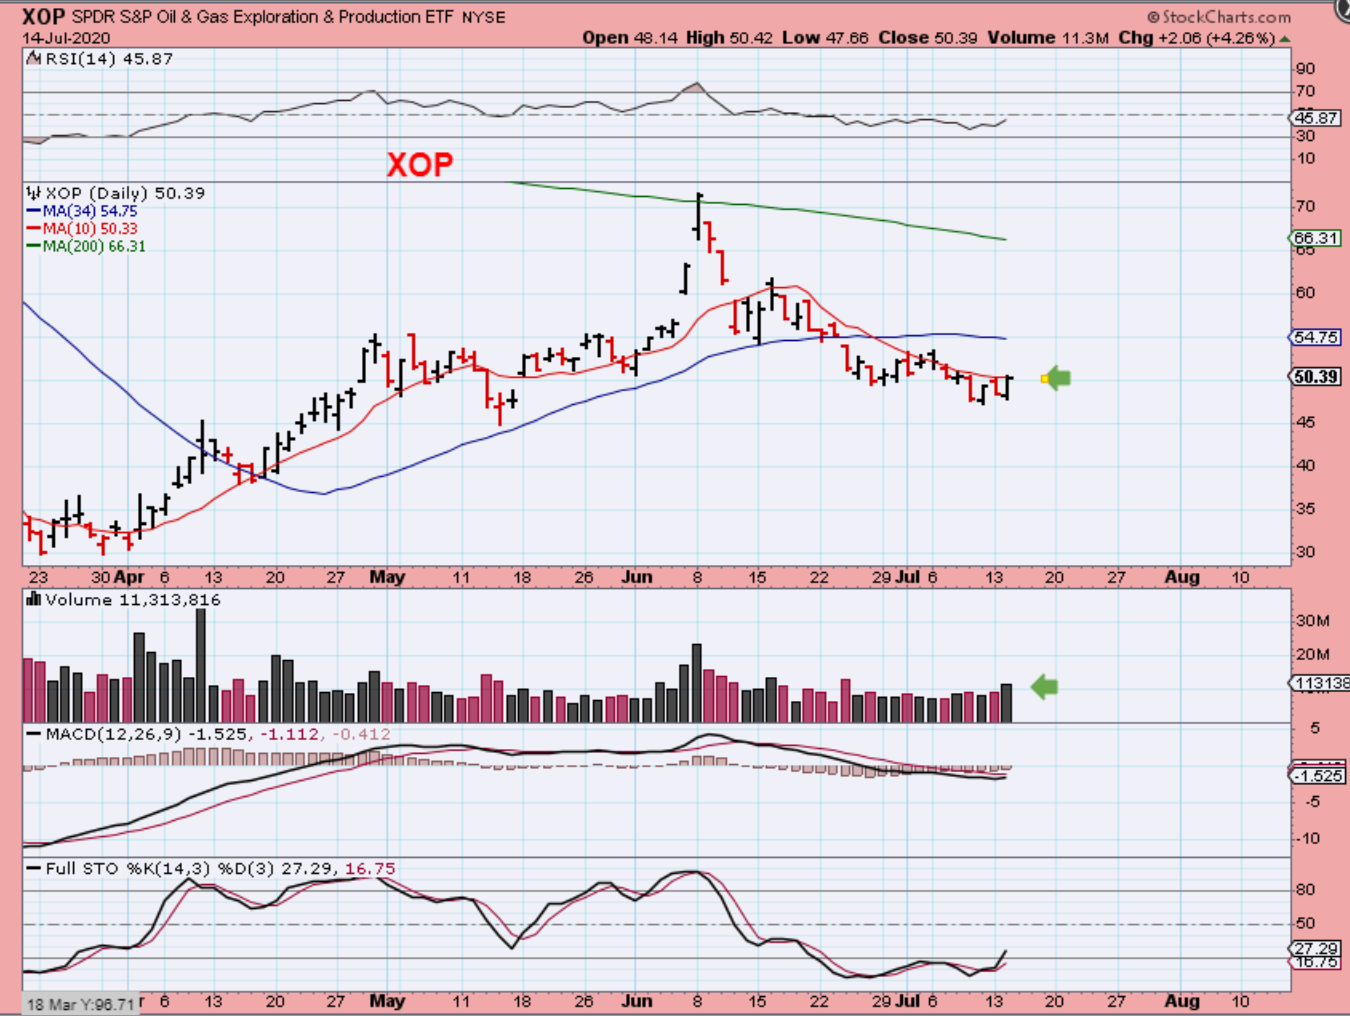
I have mentioned that The XOP looks close to a low (dcl). It has 5 clear waves down and is now trying to regain the 10sma. I see several Energy Stocks that look like a BUY to me, but I’m trying to be patient in this area.
.
SAME CHART: This would actually be a LOW RISK buy, since your stop would be under 3 days ago low. That said, it may be best to wait for price to cross above the 10 sma.
.
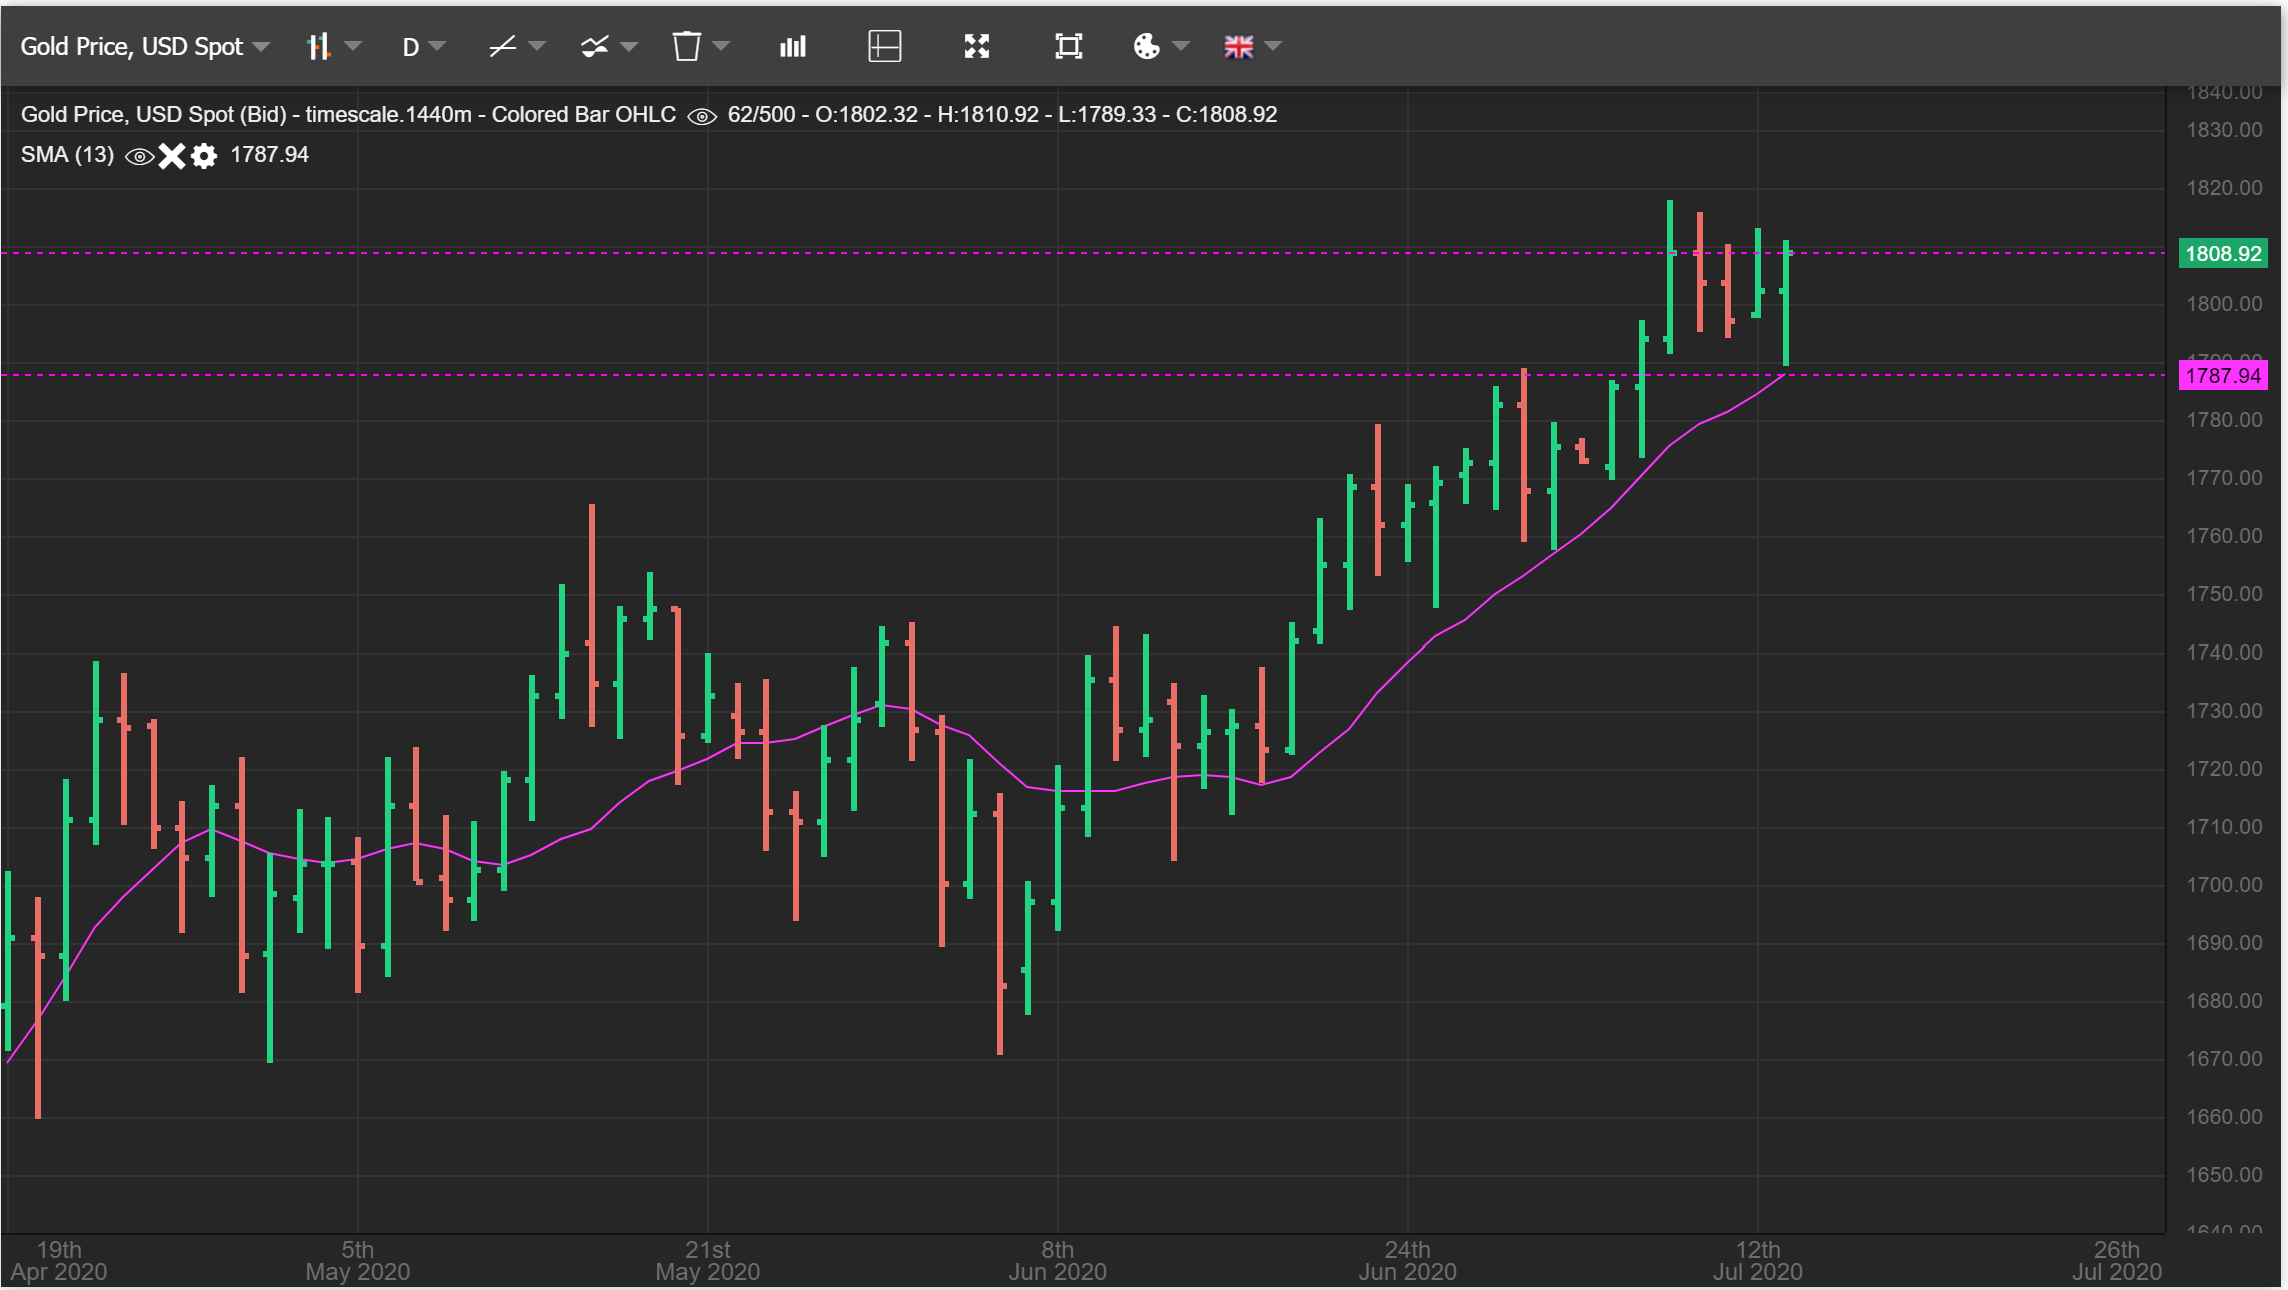
GOLD reversed right off of the 13 sma. This looks like a bullish flag that wants to go higher, but it is also day 27 off of the lowest point. Gold is showing strength at a time that one would expect it to just sell down to a dcl. It should already be very Right Translated, and if it pops from here, it’ll have a day 28 peak.
.
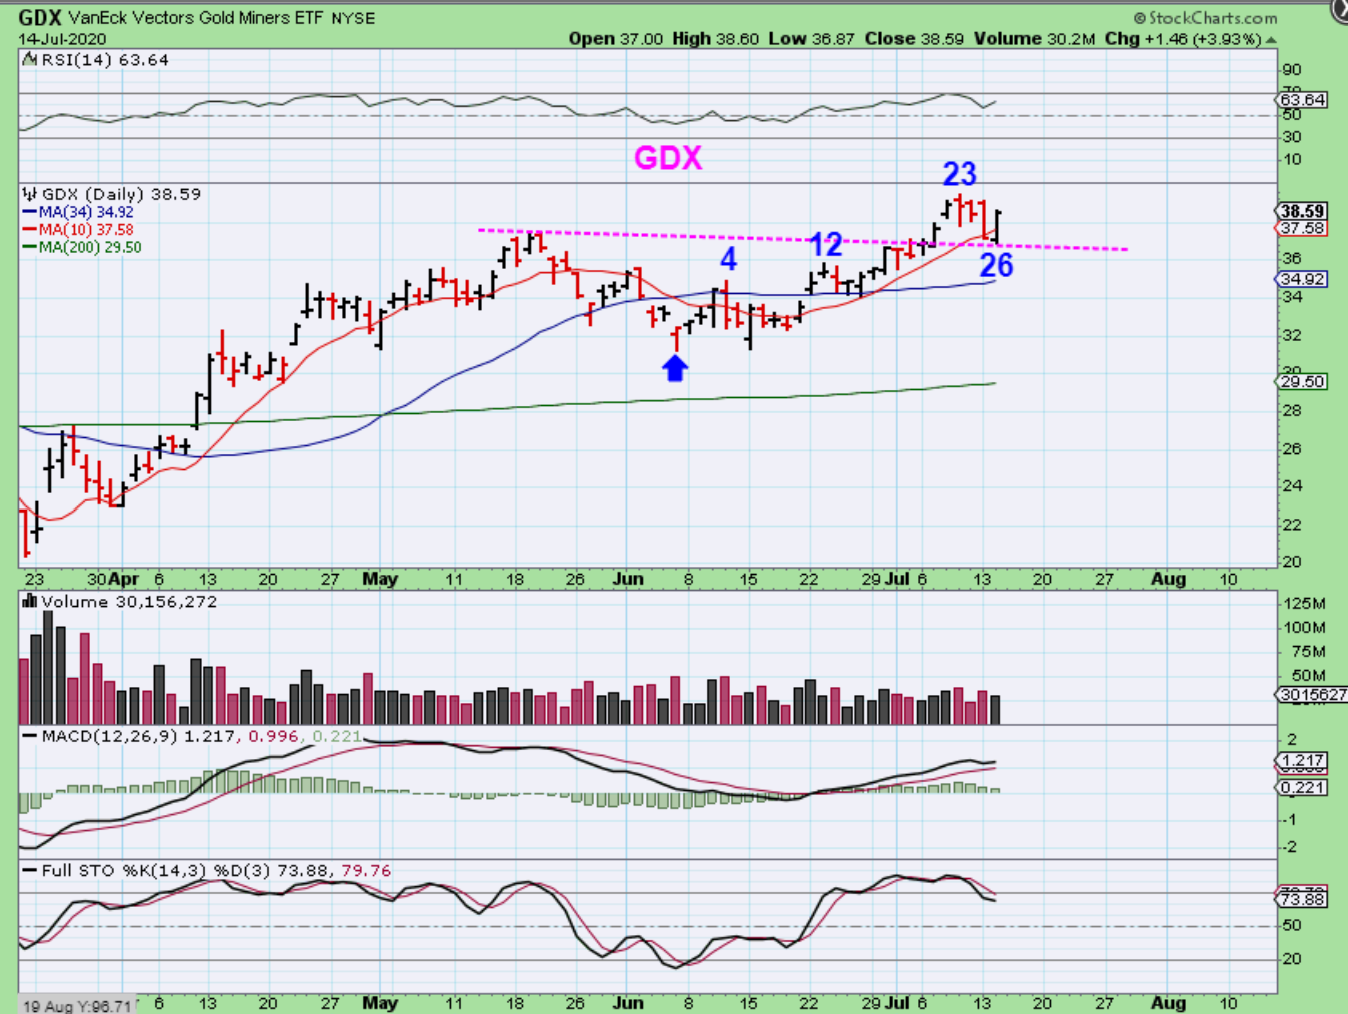
GDX also still looks bullish. This reversal is on day 26 and it almost regained the whole sell off candle from Monday. This CAN continue higher.
.
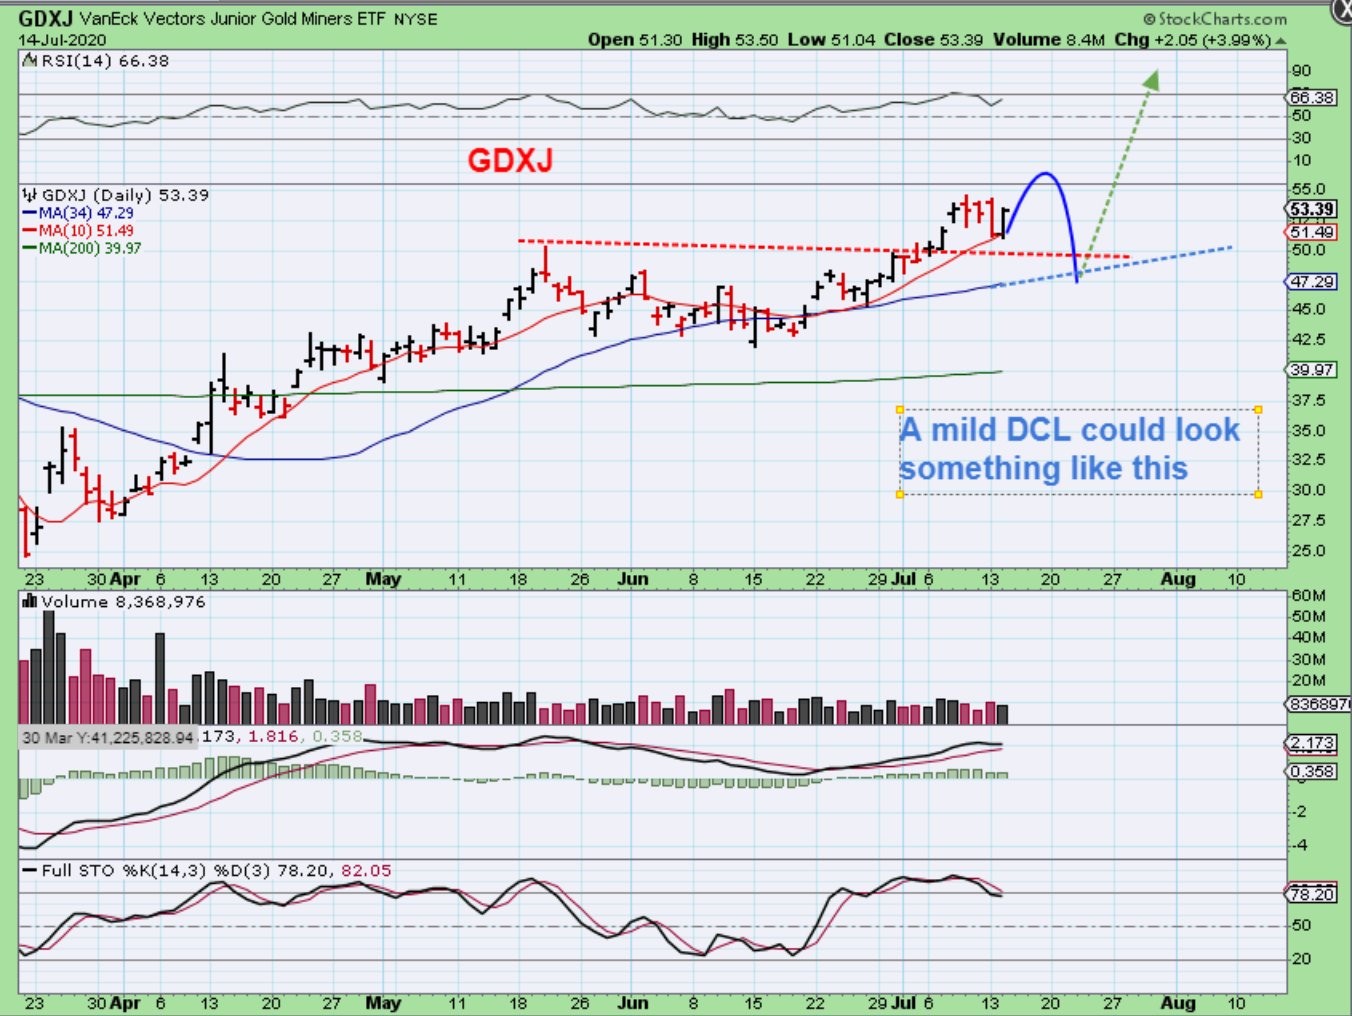
GDXJ – So if it does move higher and yet we still expect a dcl, we could see something like this, where the 34 sma ( or 50 sma) comes into play.
.
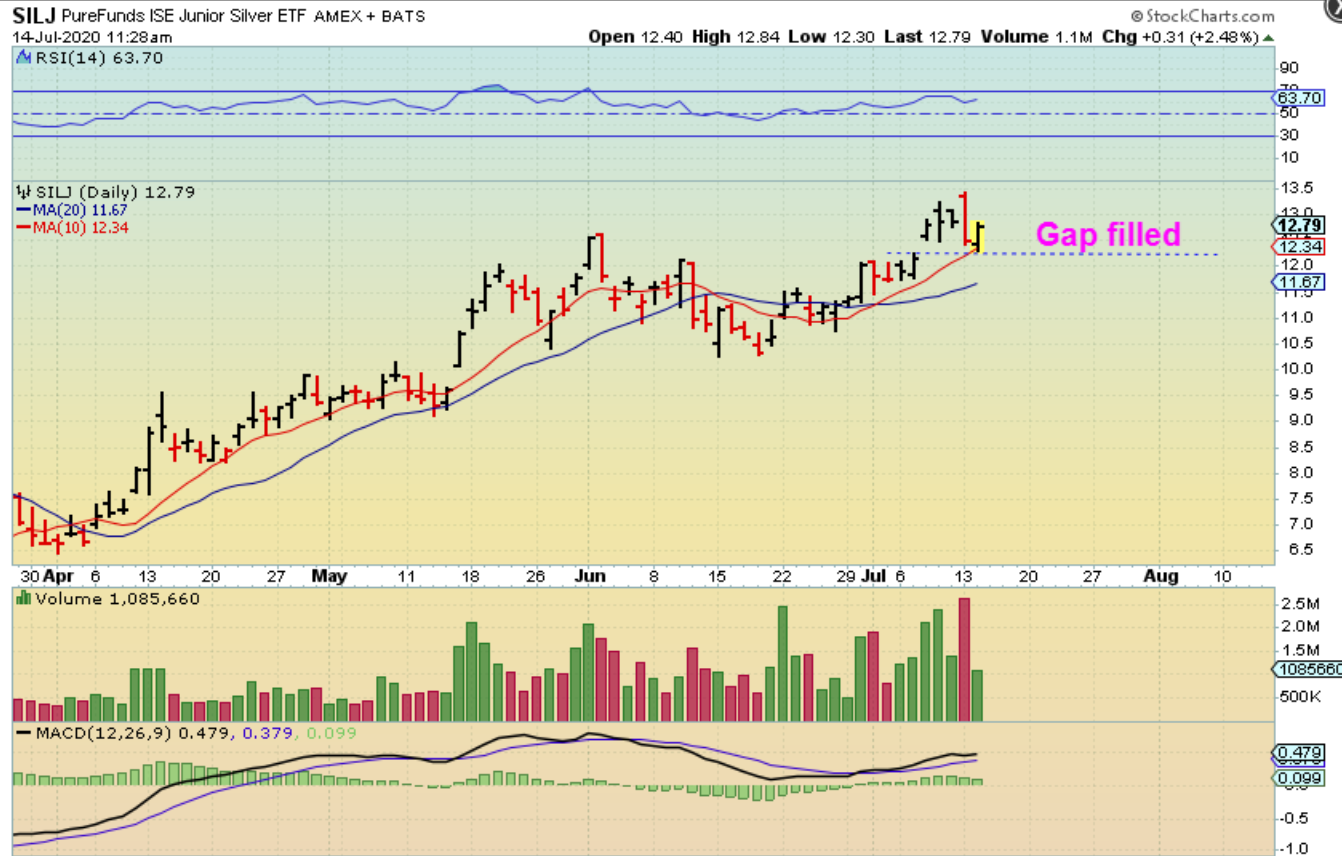
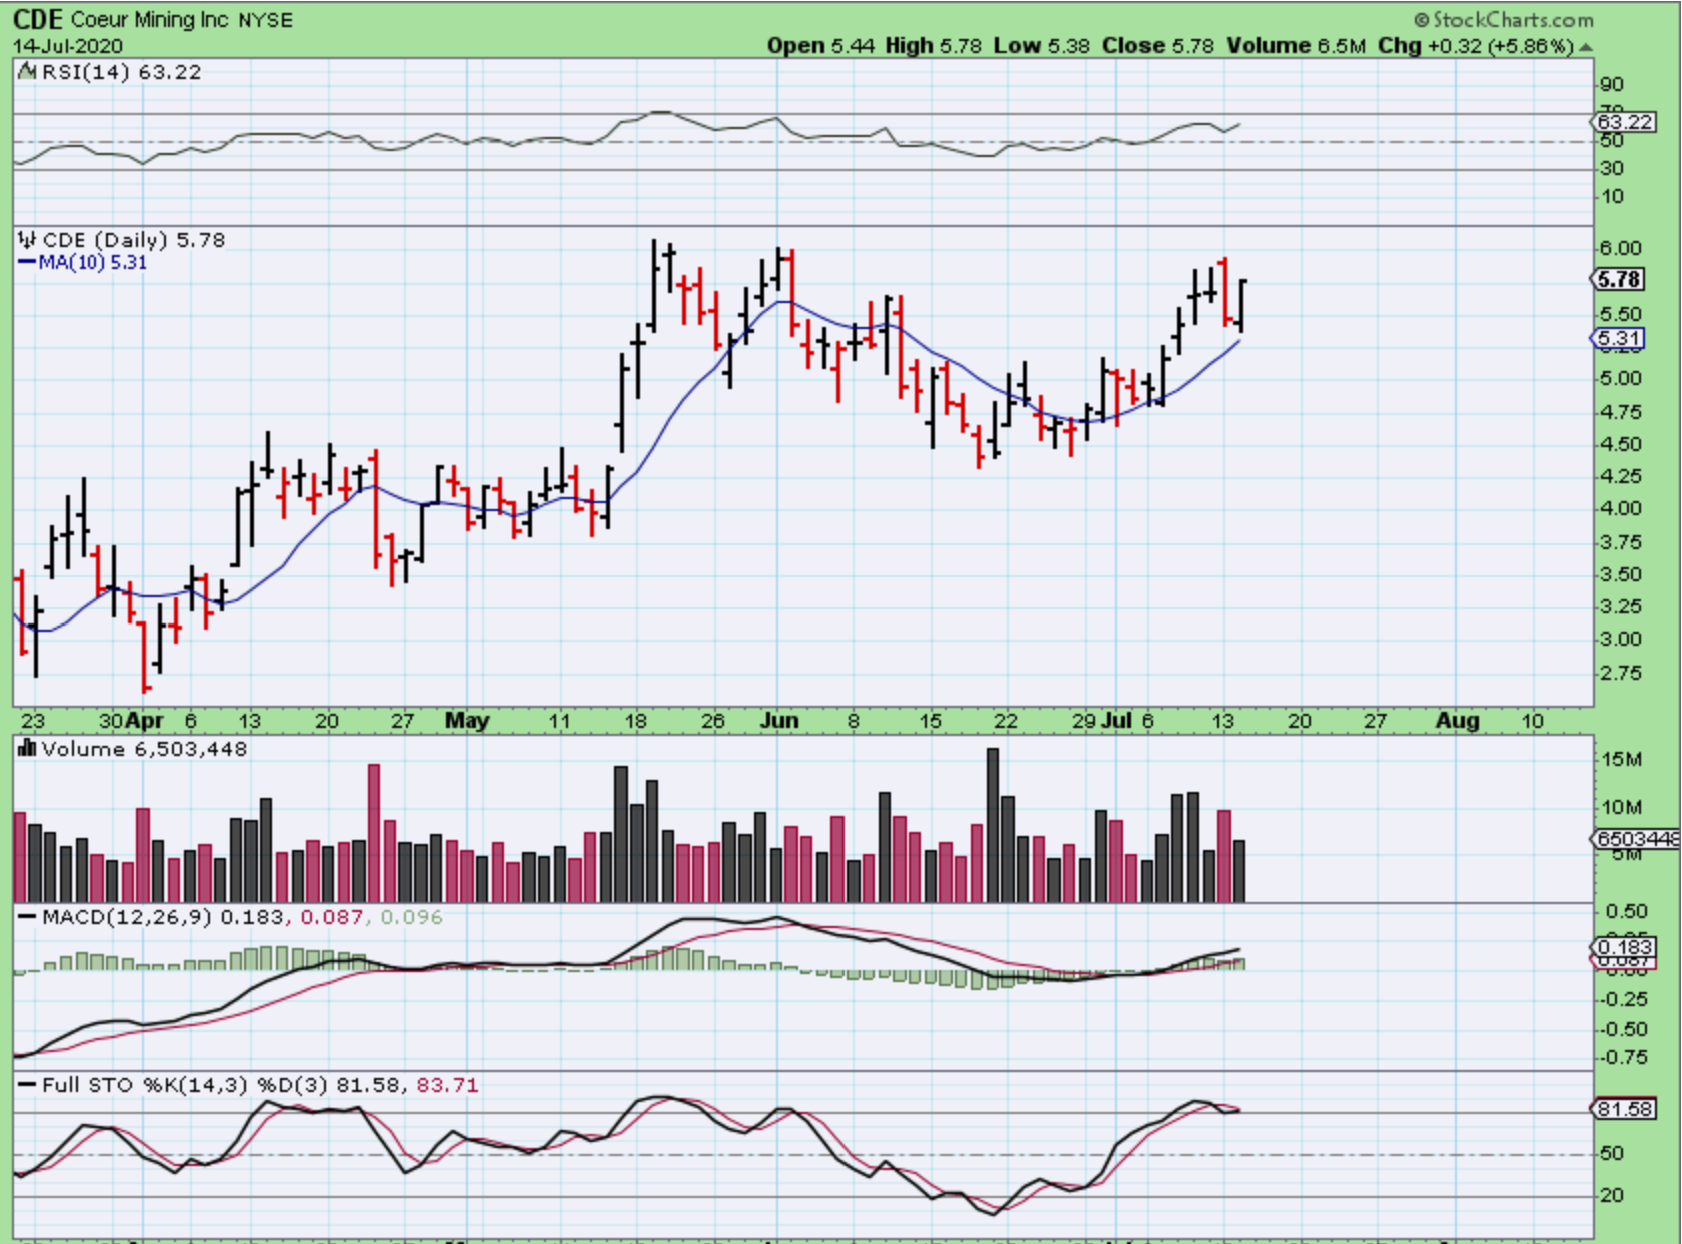
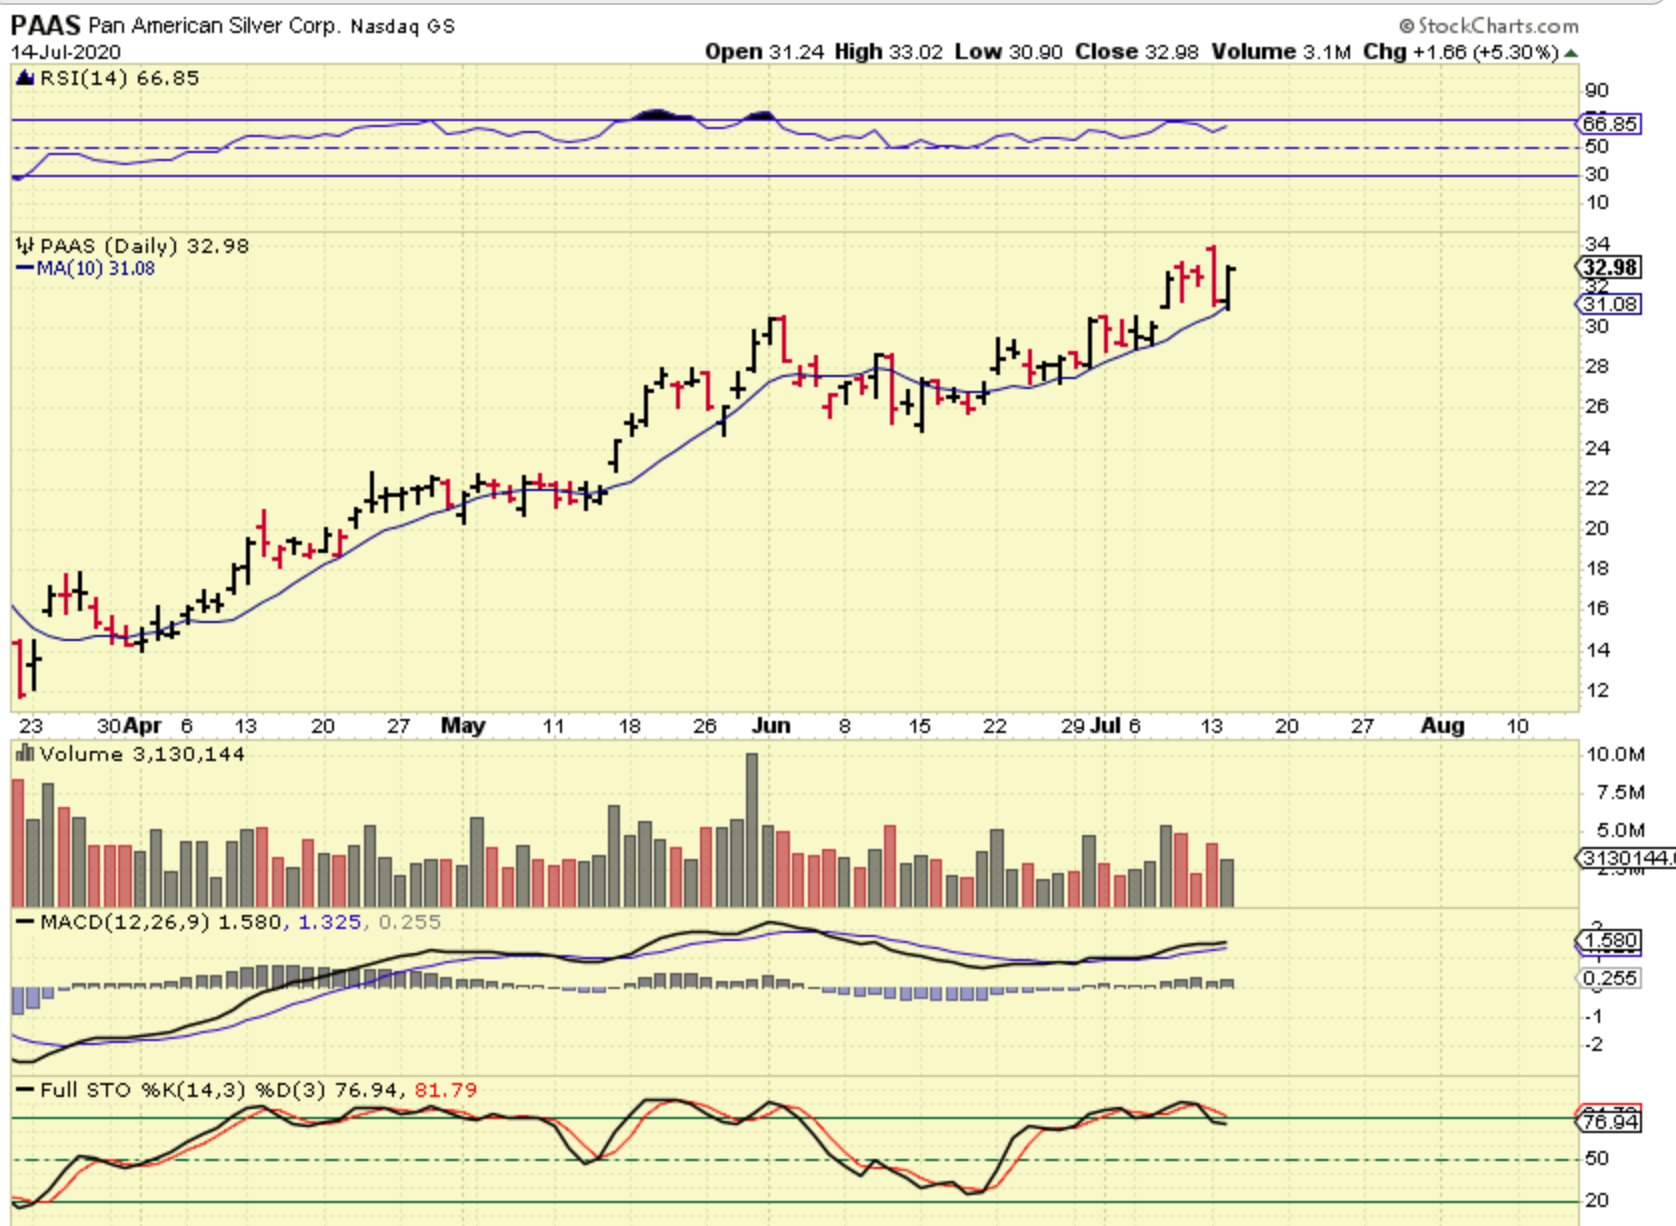
SILJ – I posted this chart as it reversed off of the 10sma on Tuesday morning, and it actually closed even higher at $13.00. Put cycles aside and CDE, HL, PAAS, AG< EXK, etc all look really bullish, so I have been saying that it may be best to use a stop under the 10sma and let the market take you out of the trade. Check this out..
.
You may recall that I said that SILVER & SILVER STOCKS BOTTOMED LATER THAN GOLD, so they may run longer. I have said that it may be best to use a stop under the 10sma and let the market take you out of the trade. So far you would still be in the trade…
.
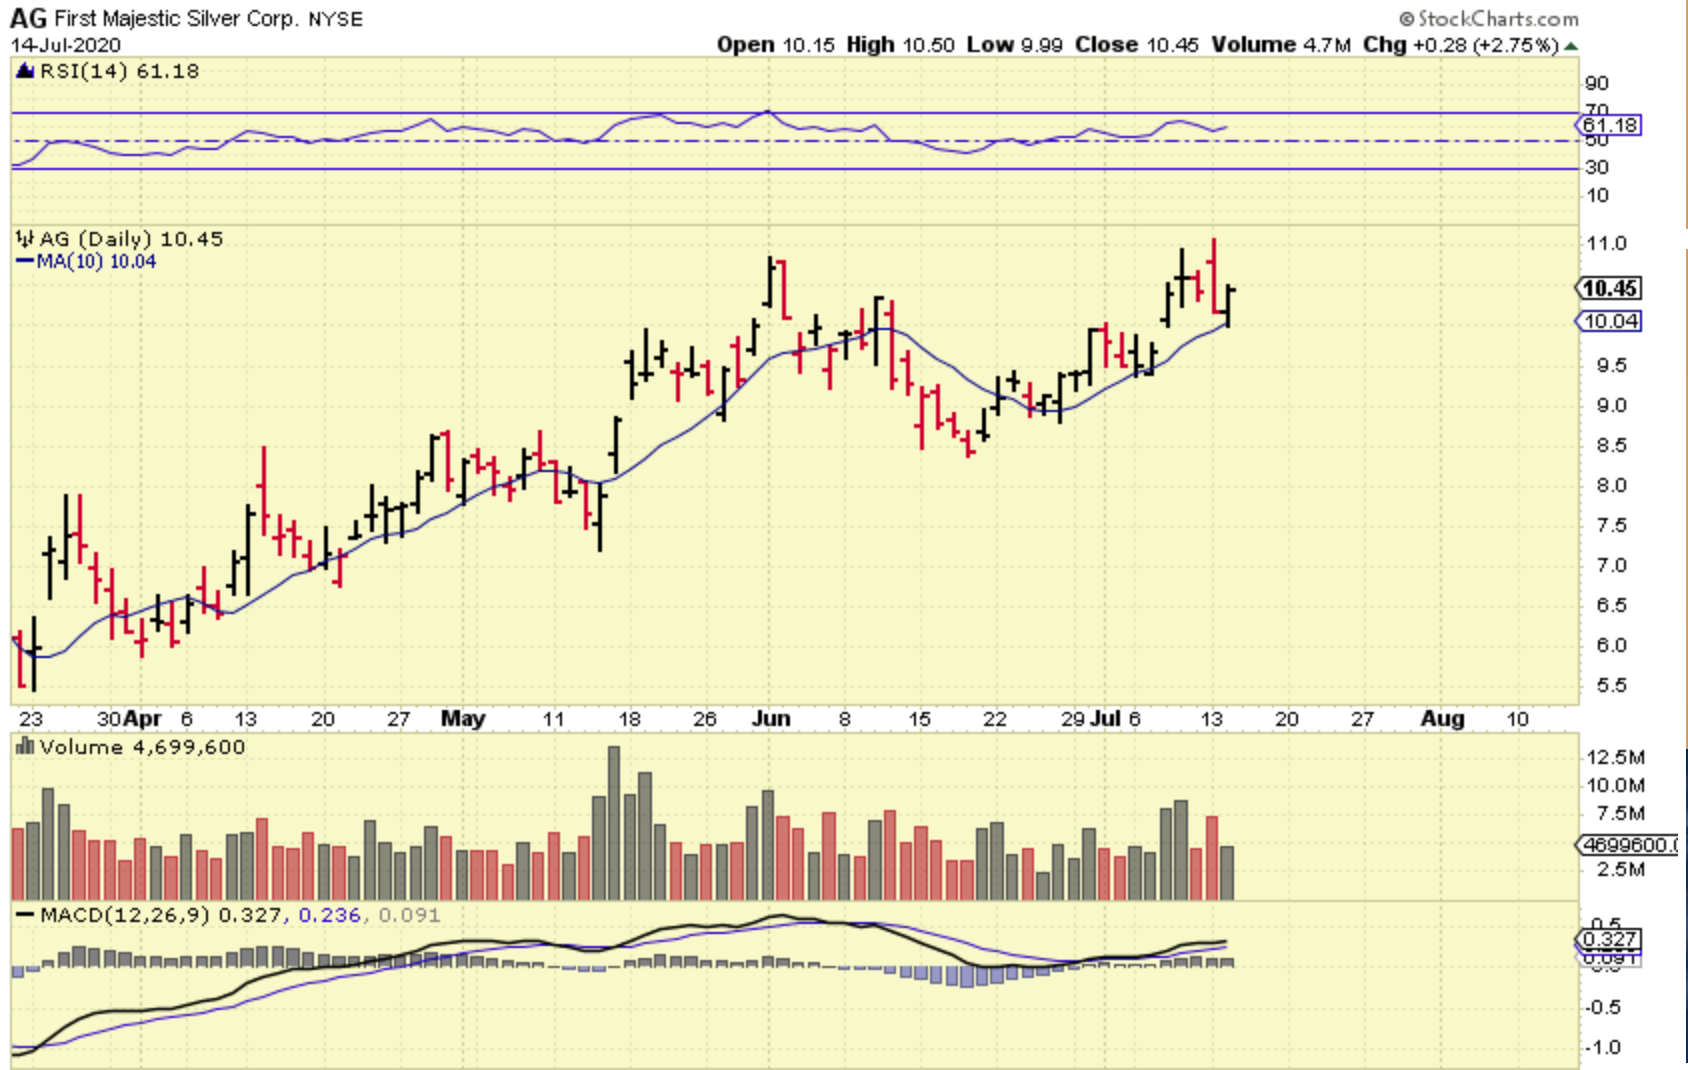
AG : Still be in the trade…
.
CDE : Still be in the trade…
.
PAAS : Still be in the trade…
.
HL – Still be in the trade., and many other silver stocks are still acting bullishly at the 10 sma.
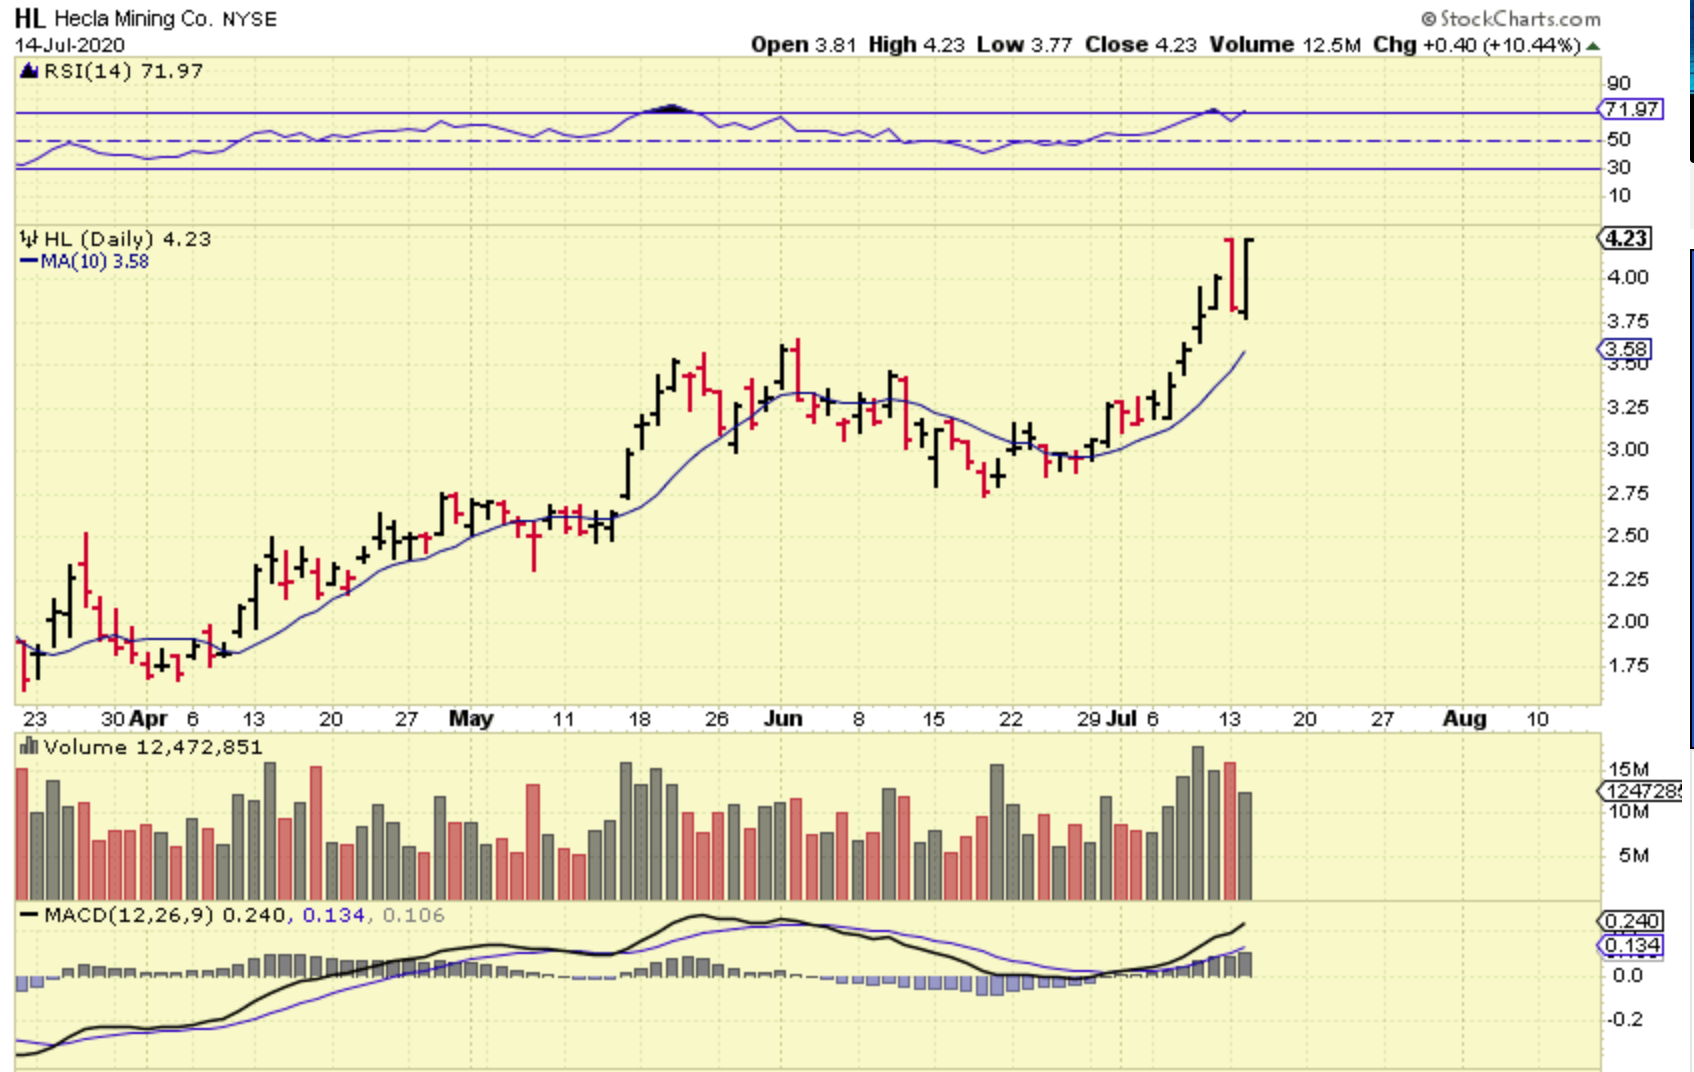
And there are other Silver Stocks that look exactly the same. Using the 10 sma ( or a looser 13 sma) would keep you in a bullish set up. These are tricky markets. They do act bullishly, but it can be difficult to ride a bull at times.
.
So as you can see, we do seem to have a bit of a Kangaroo Market, with a lot off Popping and Dropping that lacks follow through. I’m using stops, I’m making good gains on the pops, and giving it back on the drops, unless I stick to my rule of selling 20-33 % on a Good Pop. I have NOT done that this week, so I am riding this rollercoater – kangaroo – choppy sloppy stuff too. I may start selling the pops and buying the drops agin, until this chop ends.
.
Wednesday is Oil inventory day, so we may finally see a distinct change in Oil & Oil stocks. That would make that sector a low risk buy. Enjoy your Wednesday trading, Mate!
,
~ALEX
.
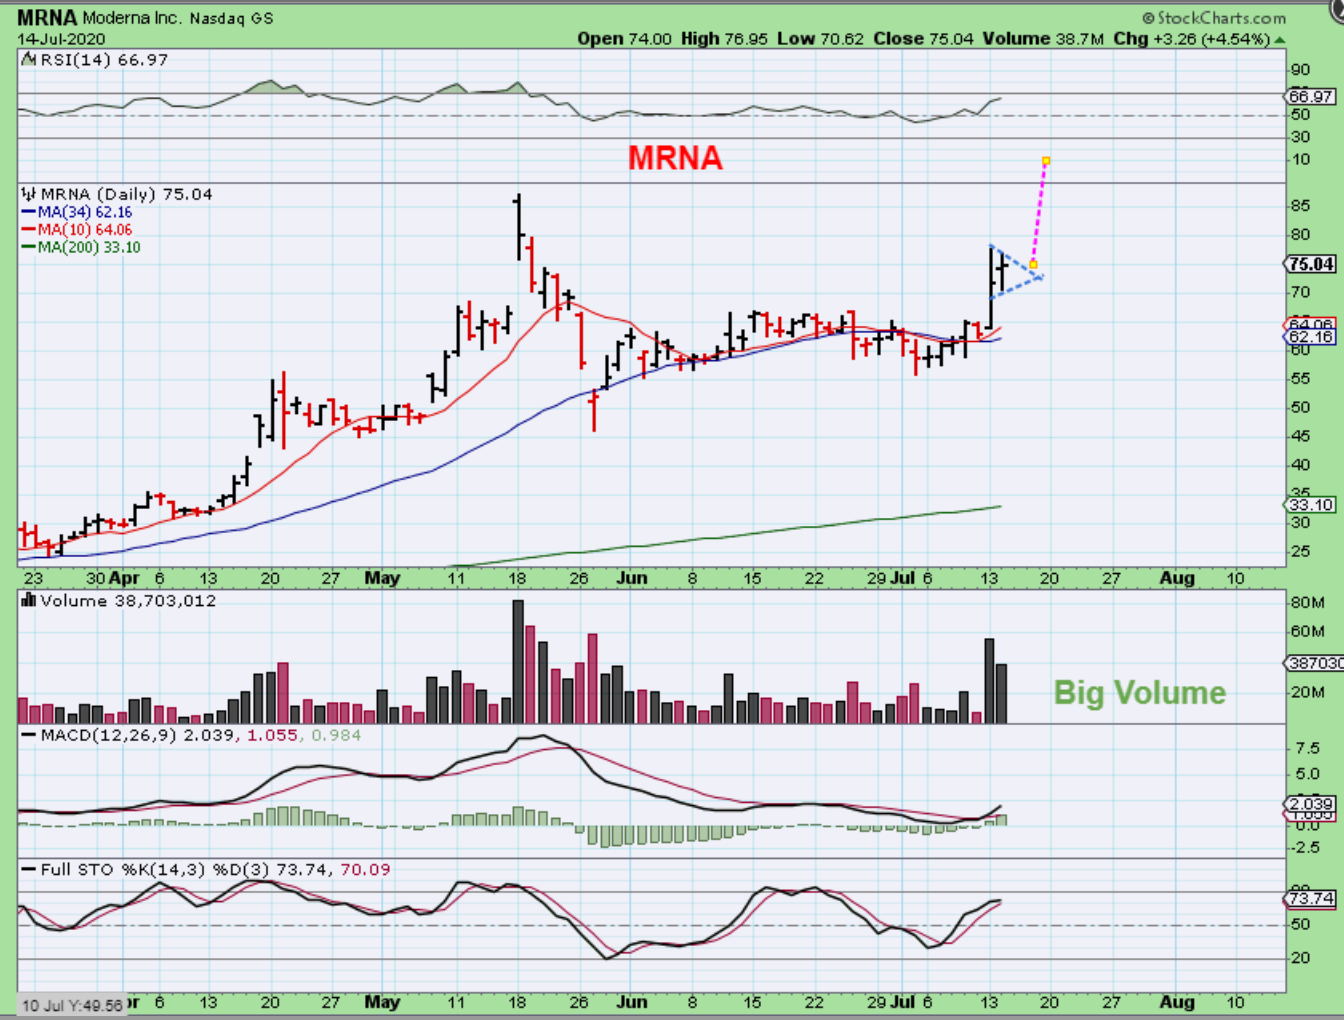
MRNA INTRADAY – On a 10 day chart, I used this in the live area to show that I wanted to add to MRNA and this bullish flag was a good place to enter. A drop to $73 was my buy & it dropped and picked me up. I posted that live…
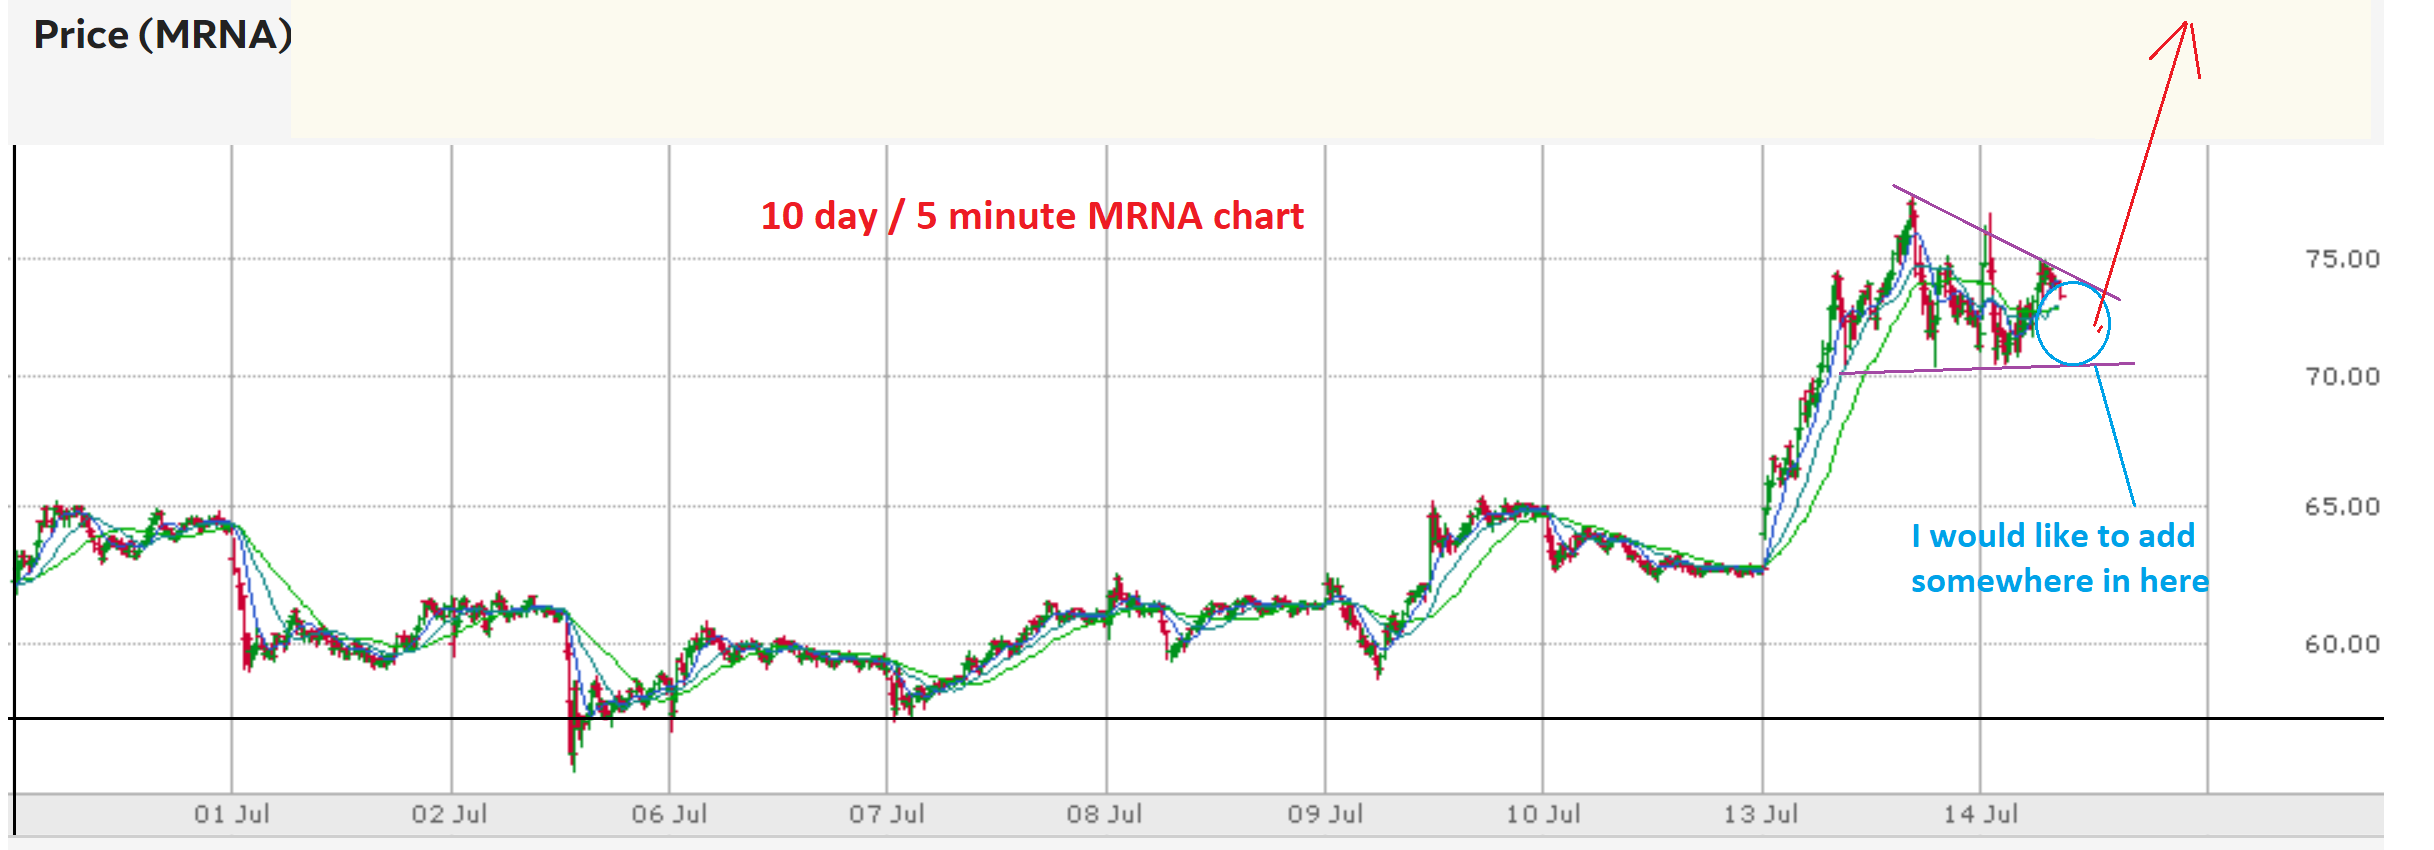
MRNA -SO then I grabbed this chart and wanted to point it out in todays report as a possible small bull flag, also a good place to buy. After hrs, MRNA came out with strong news and it was up 16%, so the buy for MRNA was Tuesday. I really hope some are still holding from the buy at $60 & I hope even more followed me into the buy posted intraday Tuesday.
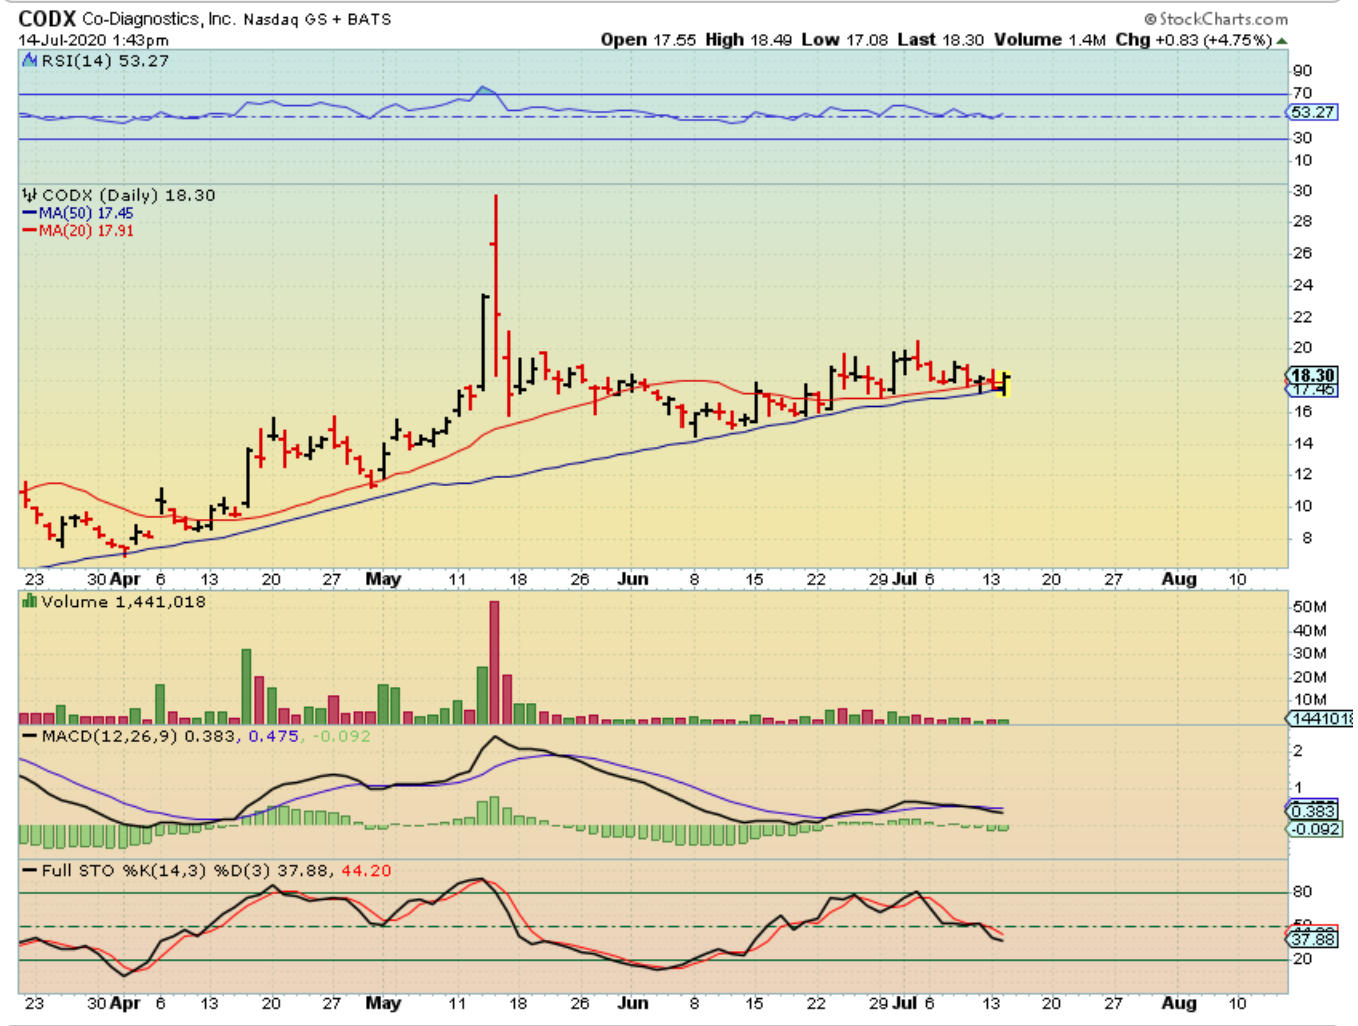
CODX – I feel that this is a low risk buy too, since you can place a stop below Tuesdays lows.
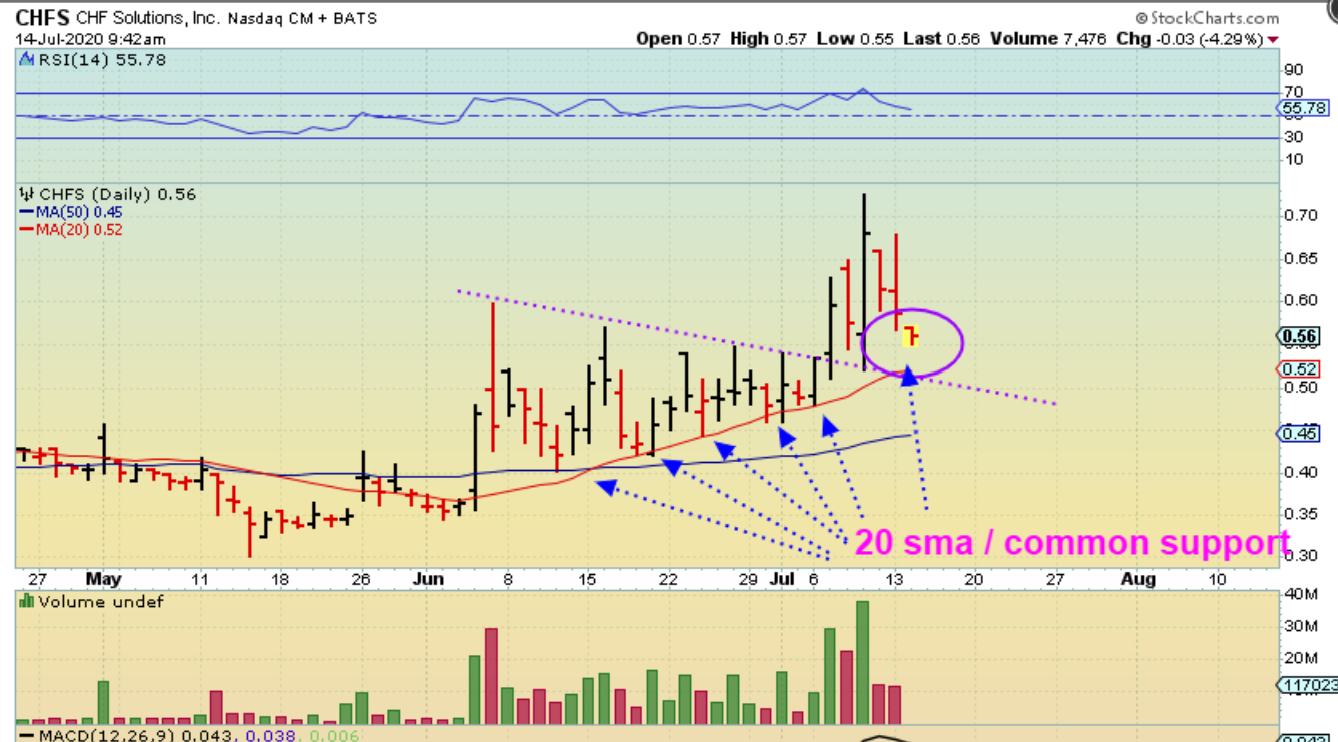
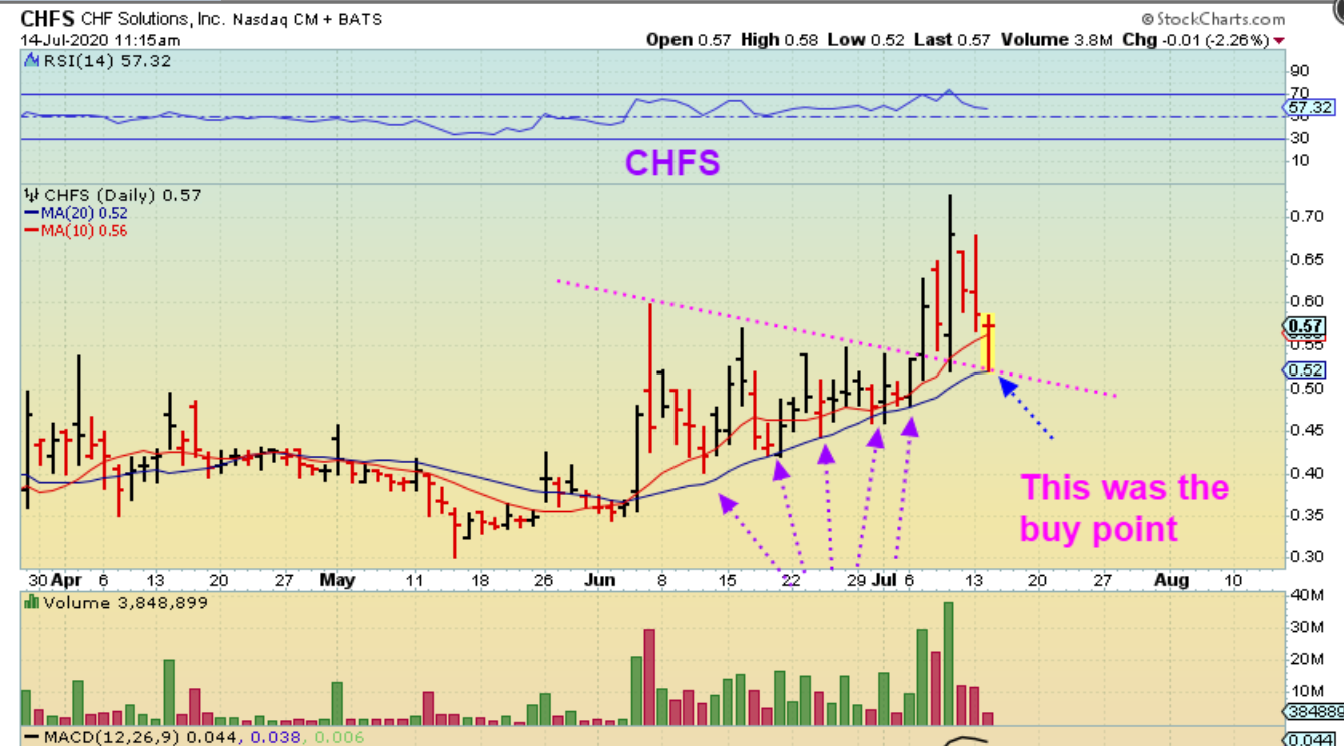
CHFS at 9:42 a.m. – At the open I mentioned that it would be normal for CHFS to drop to the 20sma as a back test. I HATE the drop too, but it would still be normal to me…
.
CHFS dropped to the 20sma as a back test and bounced. Can you believe how clean that was? Buyers showing up at the 20sma again and again and again. So this is actually acting correctly so far.
.
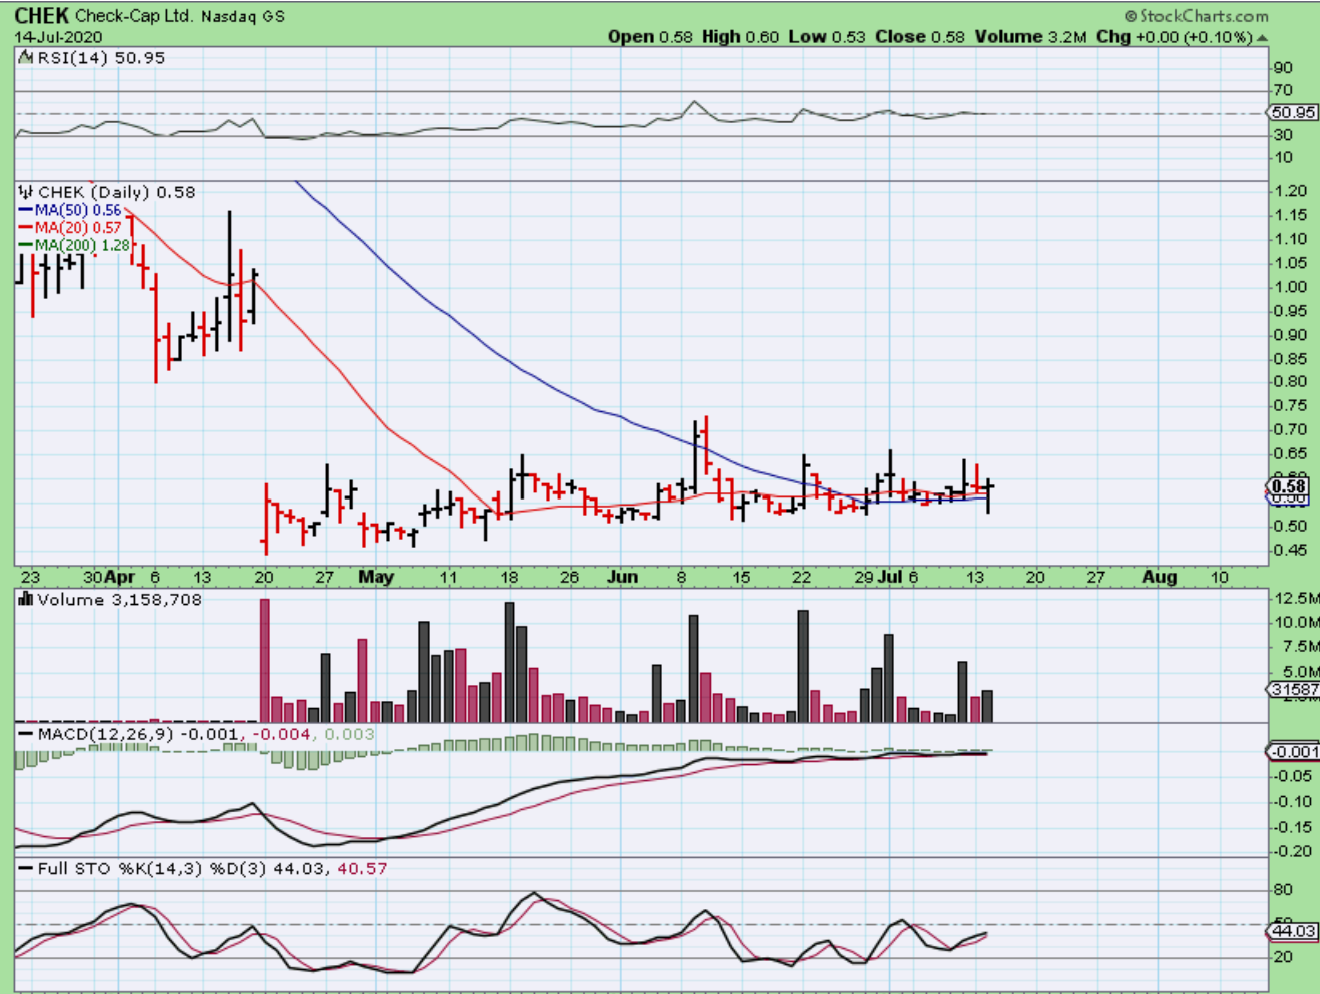
CHEK I was asked about CHEK as it sold off over 5%. ‘Is it still Ok?’, so I drew this chart and showed that a lower trend line existed, so even though it was under the 50sma, it may be ok in this channel. Well…
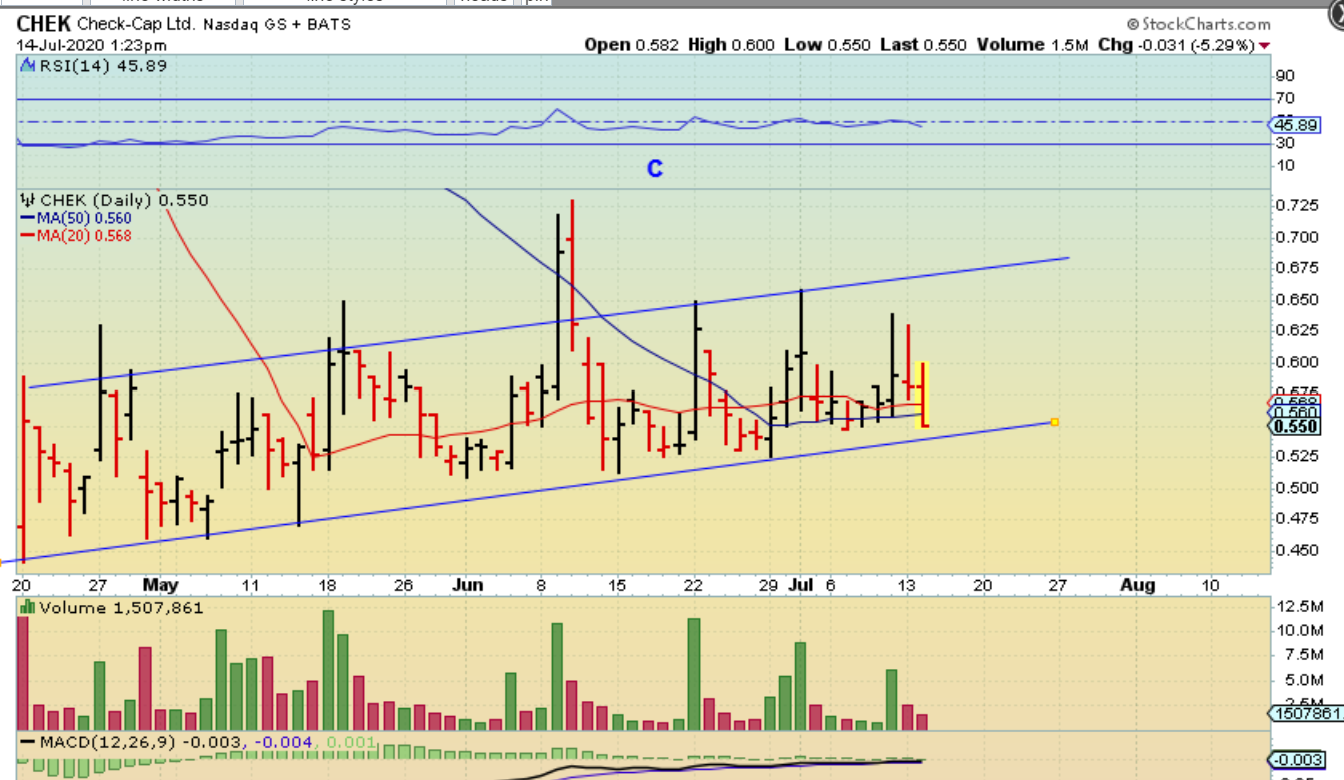
CHEK dropped well below the 50 sma to that trend line and yet bounced back by the close. That is not an easy ride as it drops 8%, but did recover and hopefully can just push higher from here.
.
ENERGY STOCKS
.
I like the set up on many Energy Stocks, but I’m waiting for follow through. Let’s take a look at a few stocks. The watch list was APA, MRO, CLB, CVI, WTI, OAS, PVAC, VLO, etc.etc.
.
APA – APA regained the 34 sma and the 10sma. That alone is a low risk buy for me, since I can put a stop under recent lows, but I am waiting a bit longer. APA has moved from $4 to $18! THios can MOVE when it gets going. BUY & HOLD above that blue line(or here).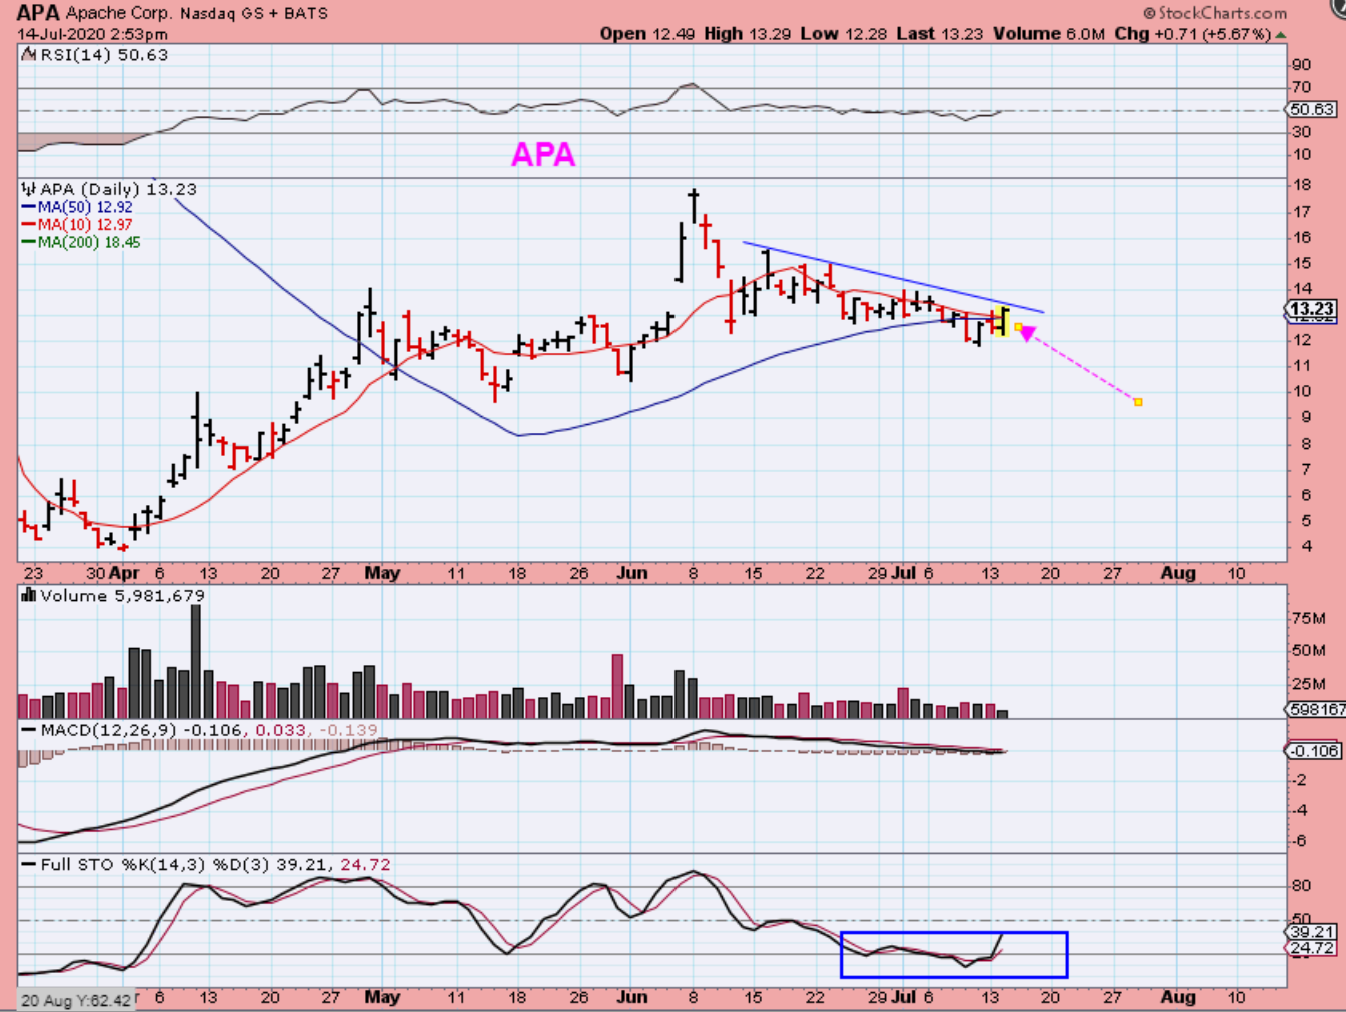
.
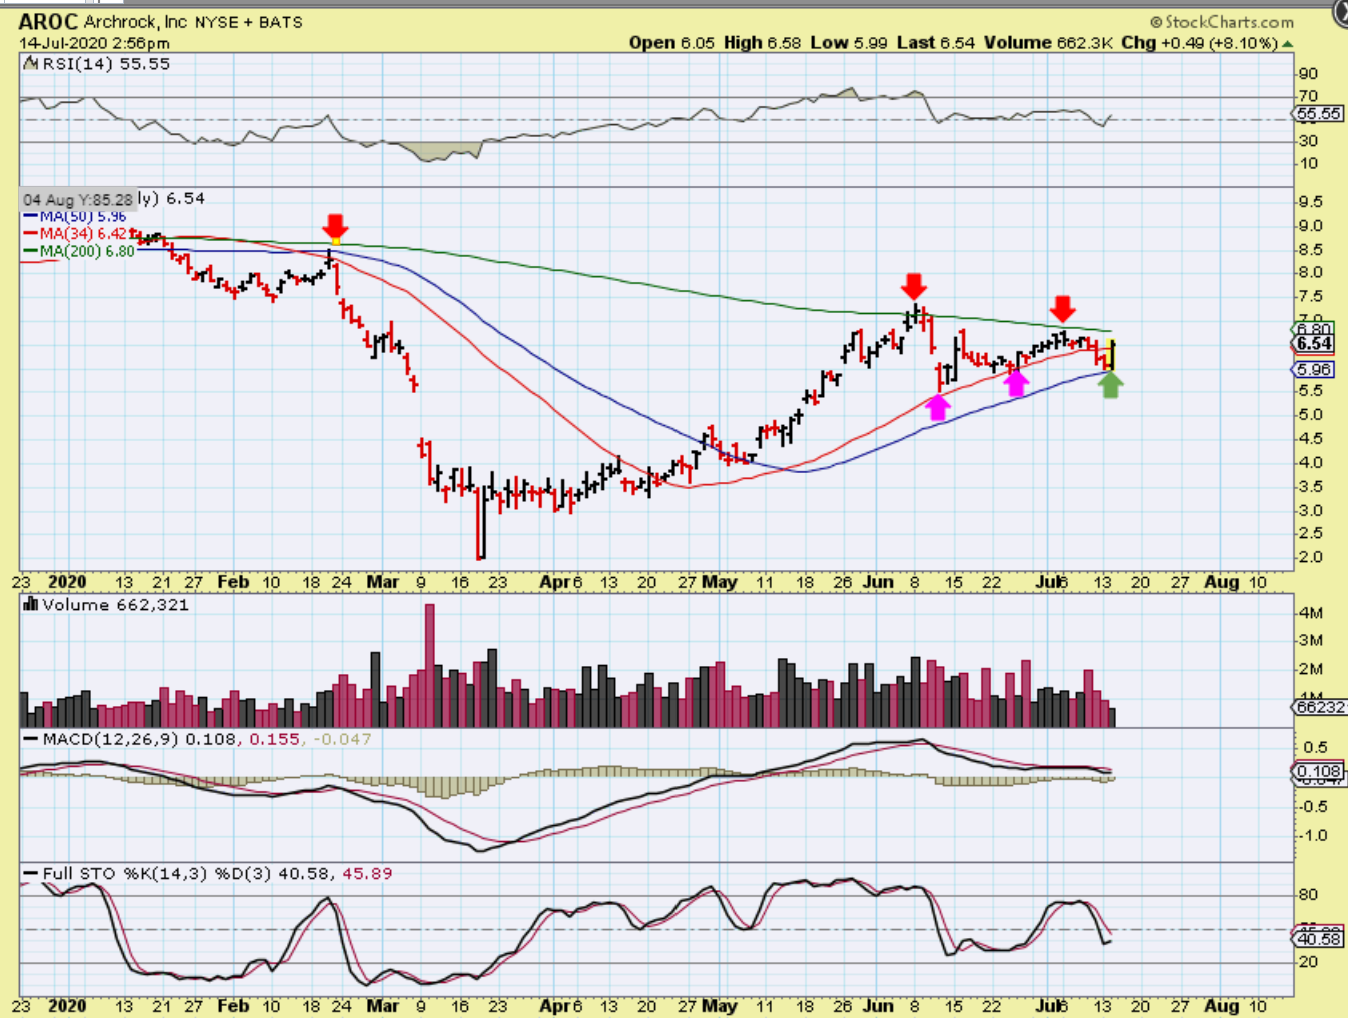
I mentioned AROC in the live area, it was up 6% when I did and had reversed off of the 50sma. When I grabbed this chart, it was up 8% and looks excellent, as it approaches that 200 sma. It finally closed up 10% and is pushing on that 200sma. This ran from $2 to $7.50. I like the upside potential of these as they recover.
.
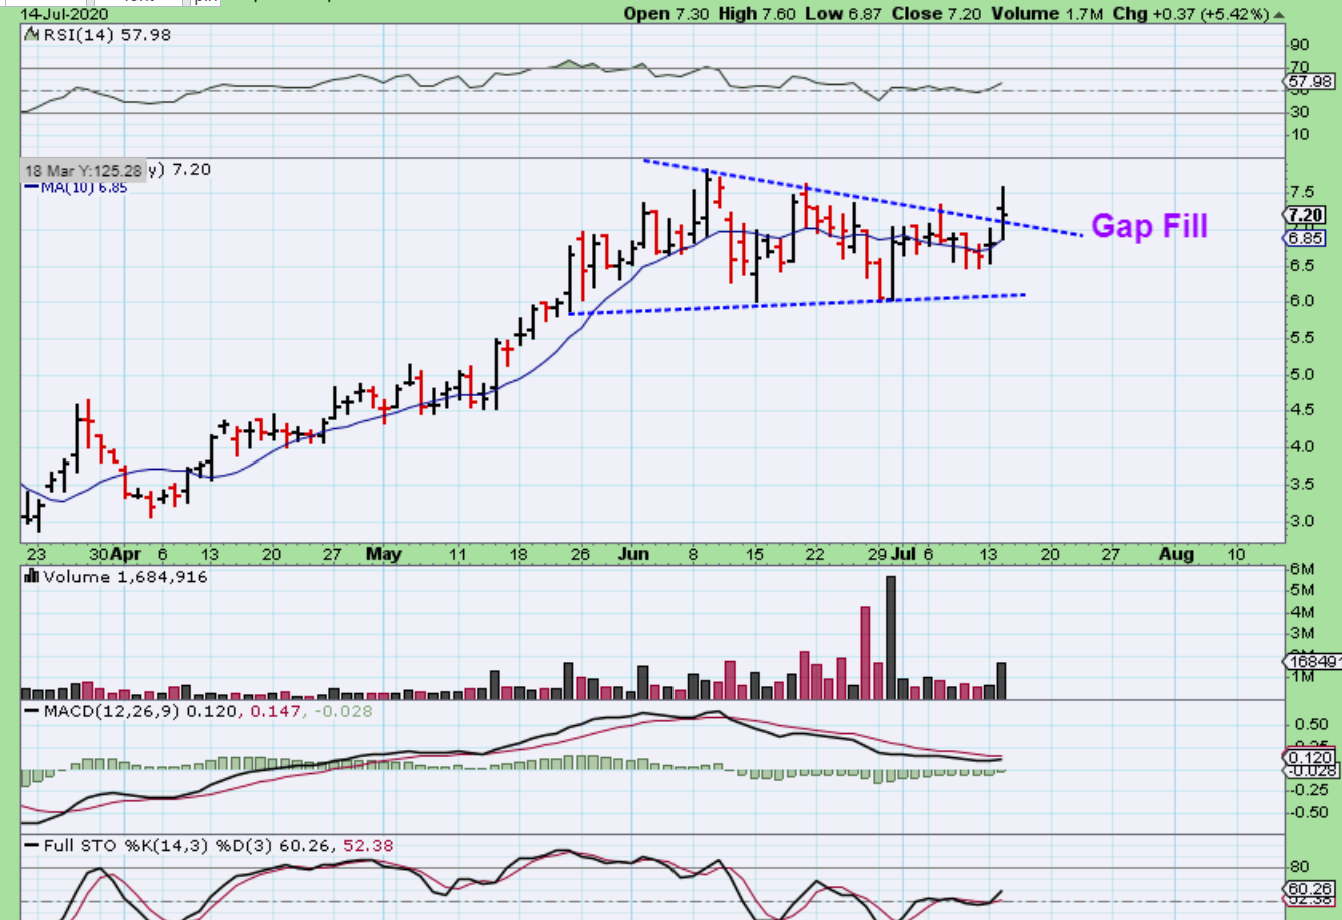
GRWG BY REQUEST IN THE A.M.: had a bullish consolidation, but it was set up to GAP OPEN a lot higher. I mentioned that I hate the gap, because they often get filled later, however…
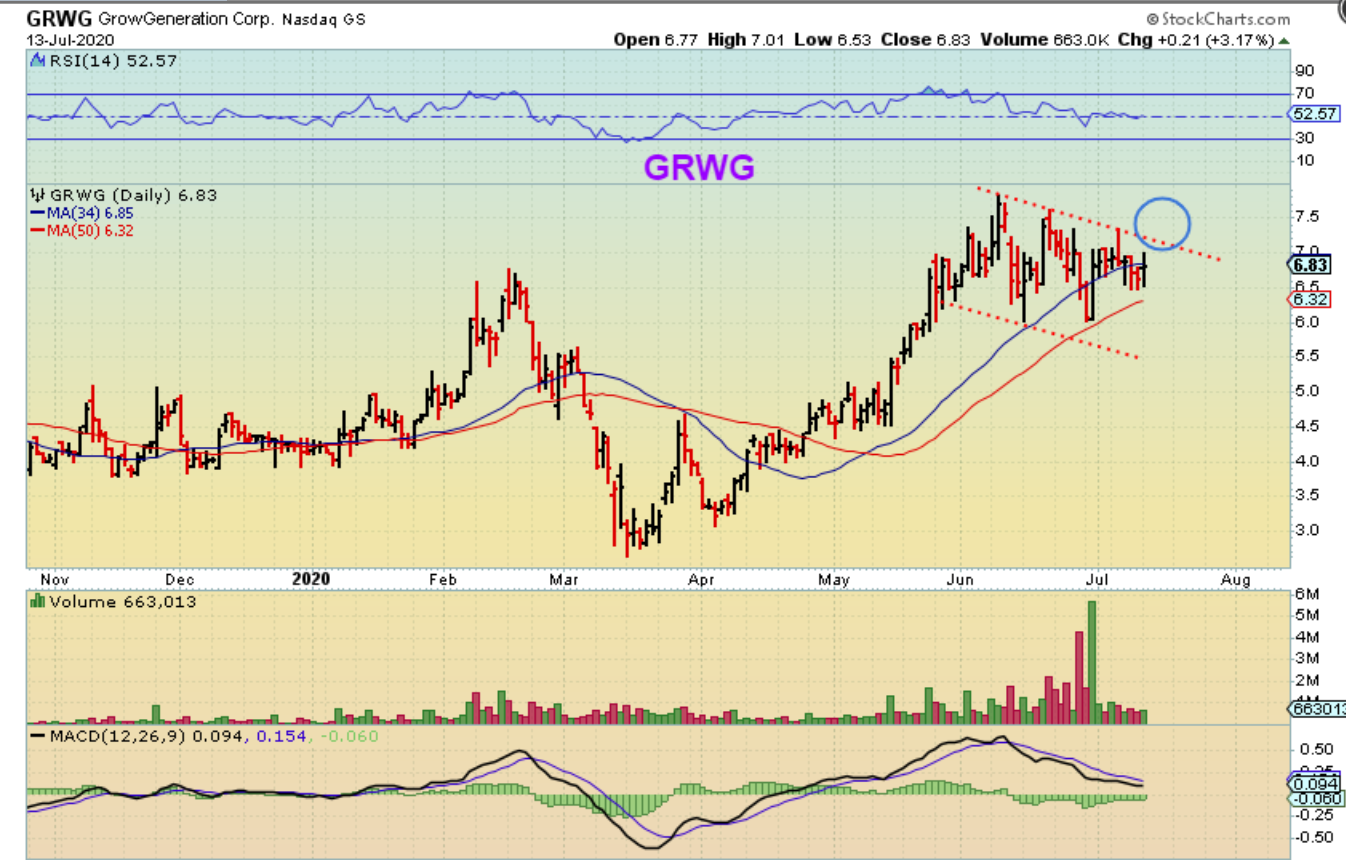
GRWG DID gap open and filled it all in the same day. That is bullish and I think that GRWG is an MJ stock that is a buy ( Buy & Hold longer term too, since it is trending higher).
.
CCJ – Uranium Stocks mentioned in yesterdays report have remained healthy
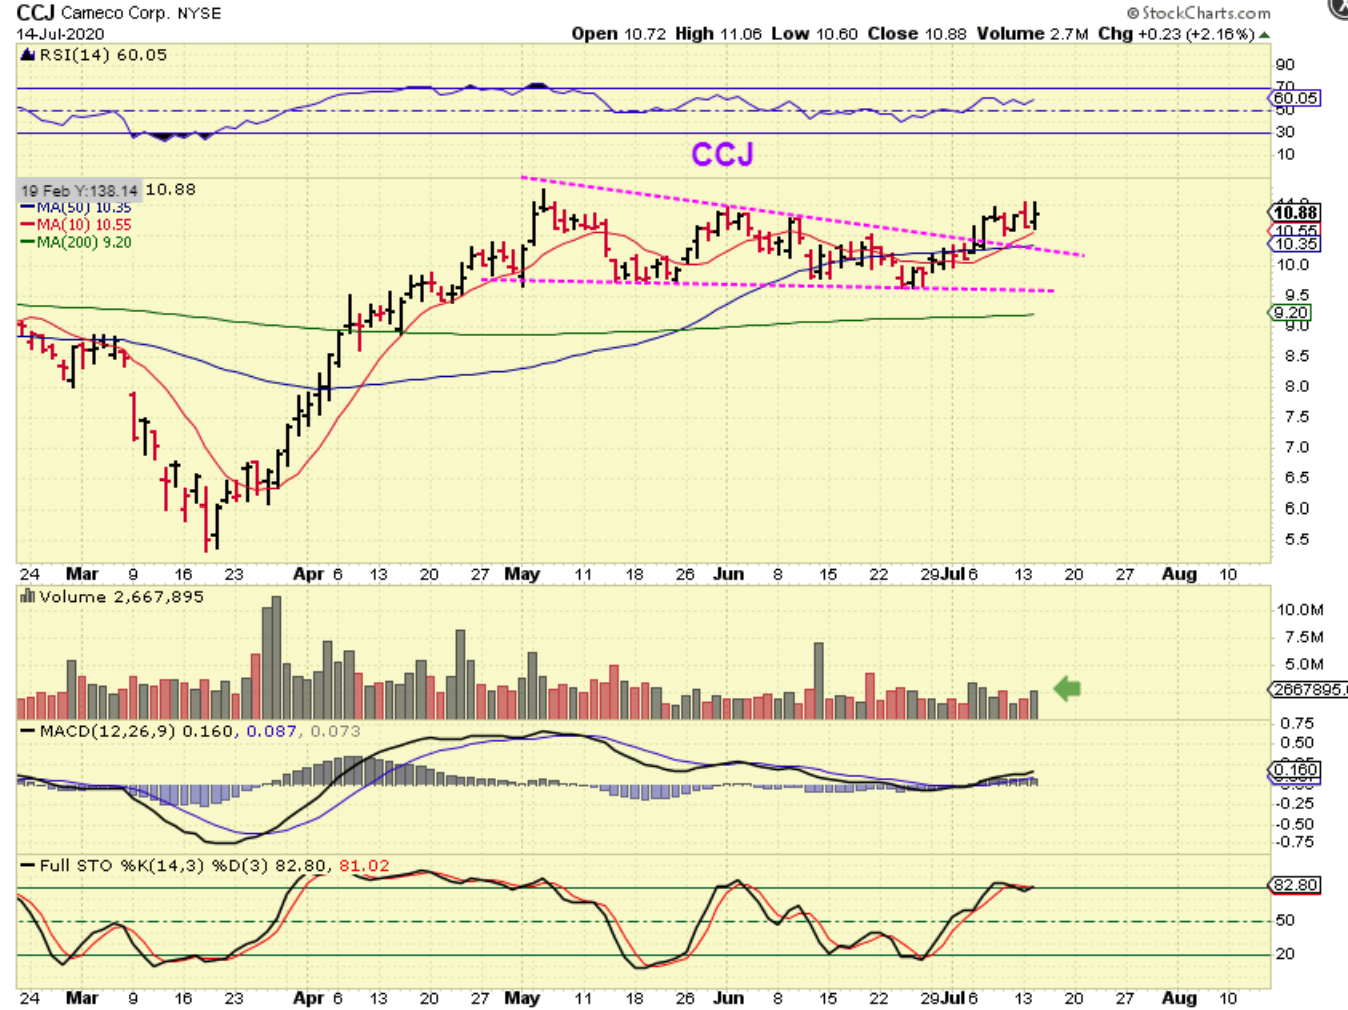
FINAL REMINDER: THE KANGAROO MARKET AGAIN- Stay Frosty my friends, these are tricky markets. This chart also applies to AMD, MU, TSEM, etc . They look Bullish one day, and bearish the next.

