Tuesday July 7
SPX – The General Markets continued higher after a dcl was put in place. If you bought the markets on the reversal at the 50sma, I think that it is safe to raise stops to the 10 sma.
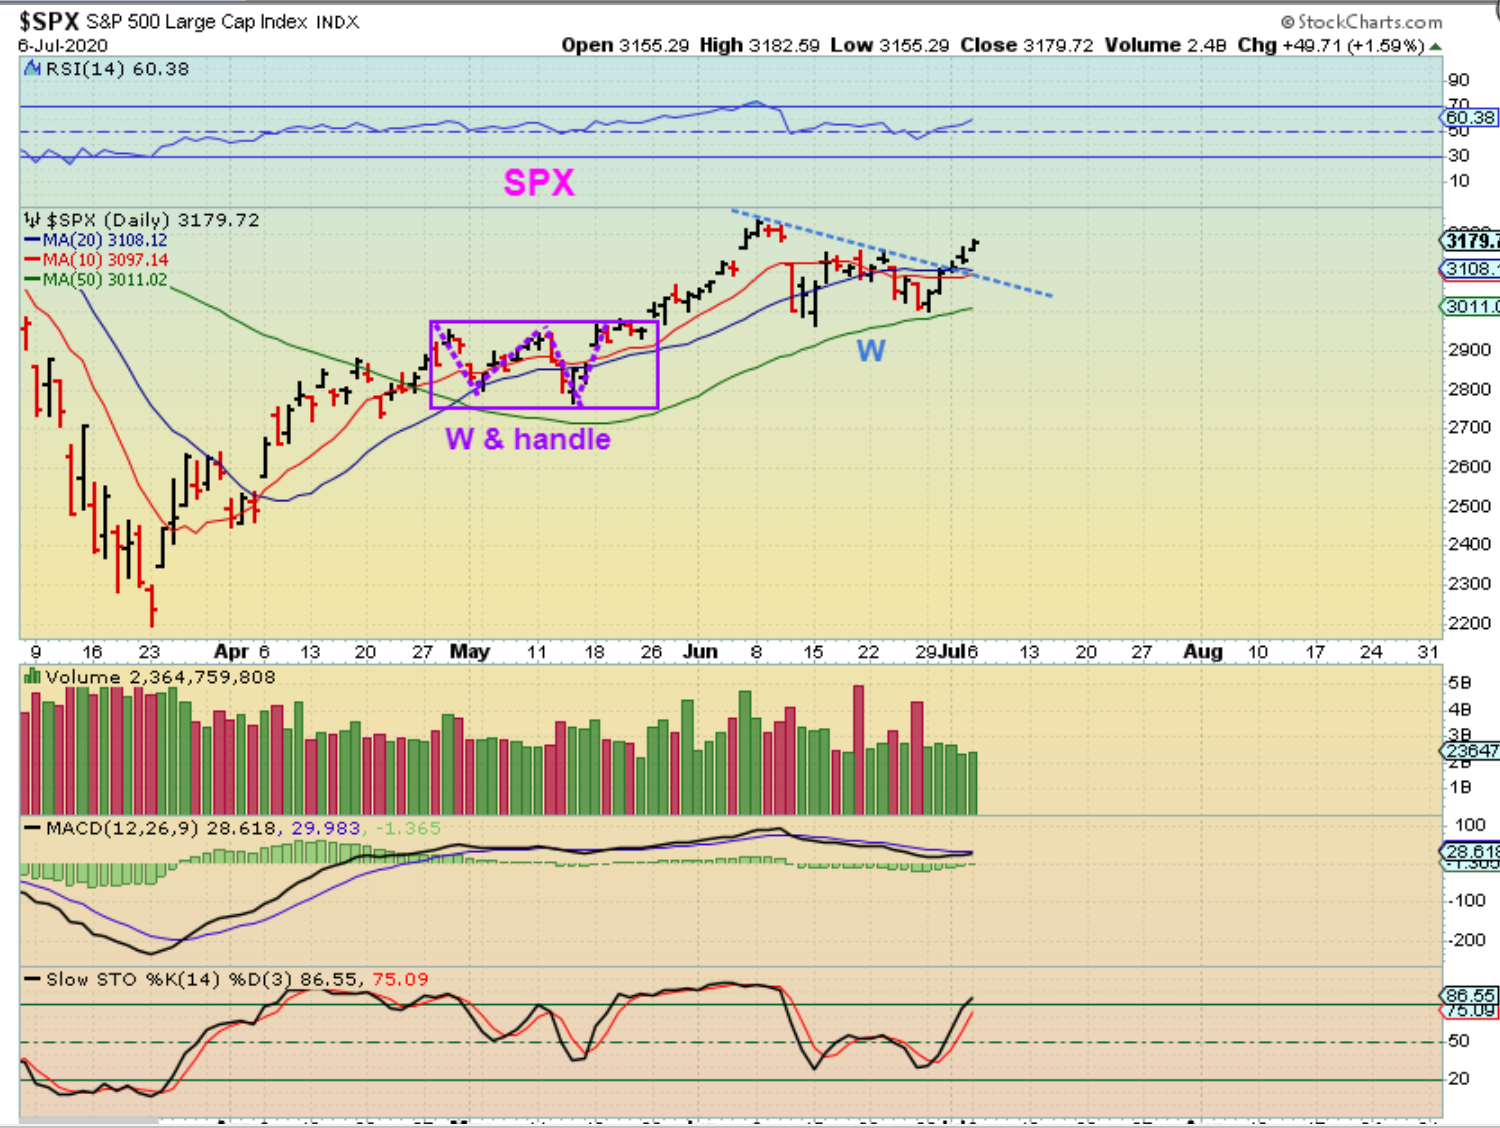
NOTE: Since this is the 3rd daily cycle, it can become Left Translated & top anywhere between now and day 15, so we need to be aware of that. That could still 2-3 weeks of trading though.
.
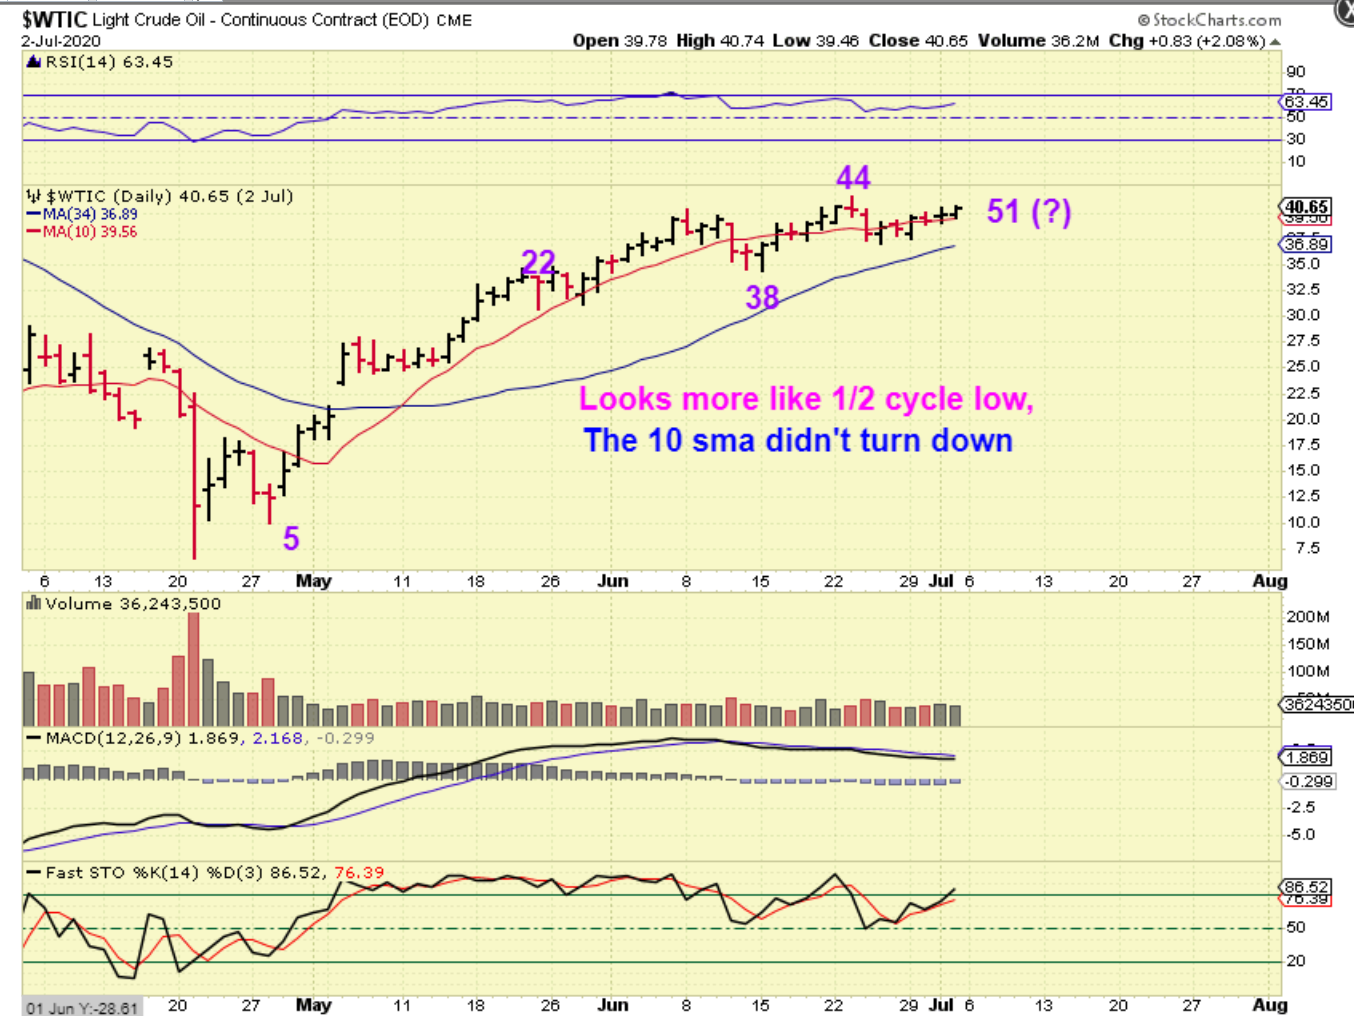
WTIC – I drew this as of Friday and Oil was down 2 cents Monday. So we should be on day 52 and still in need of a dip that LOOKS like a dcl.
.
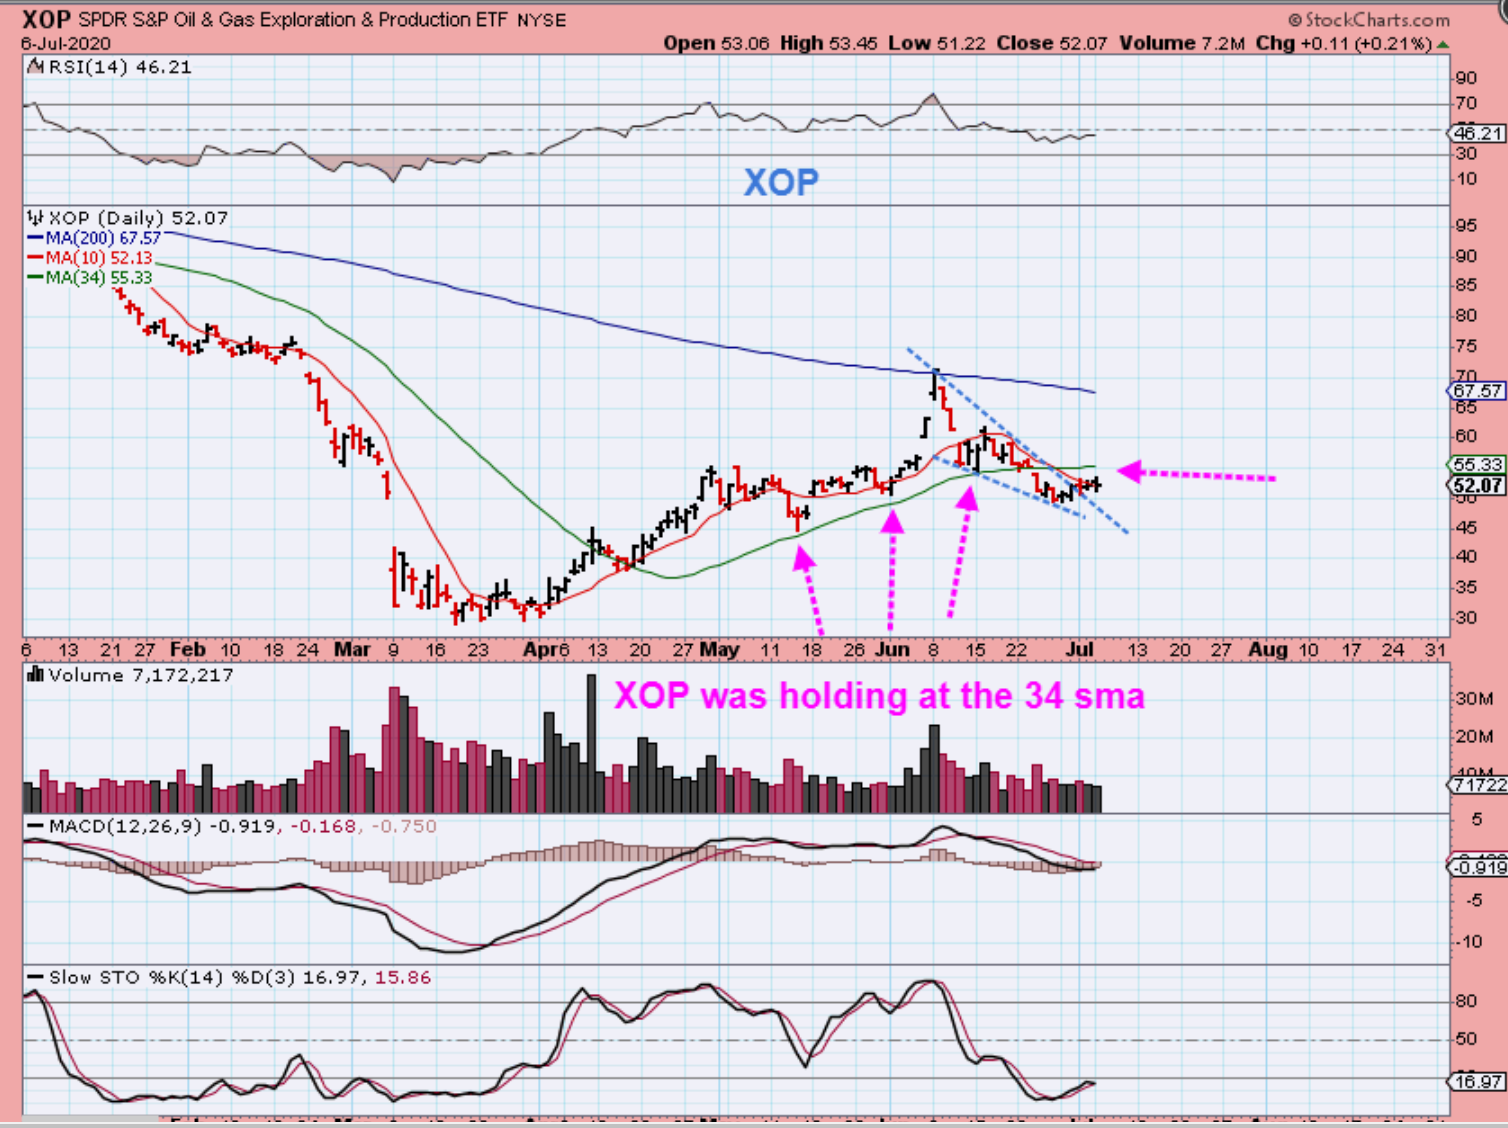
The XOP was oversold & broke from a descending wedge, but remains fairly week so far. It held the 34 as support in May & June, and now it has been unable to recover the 34 sma so far.
,
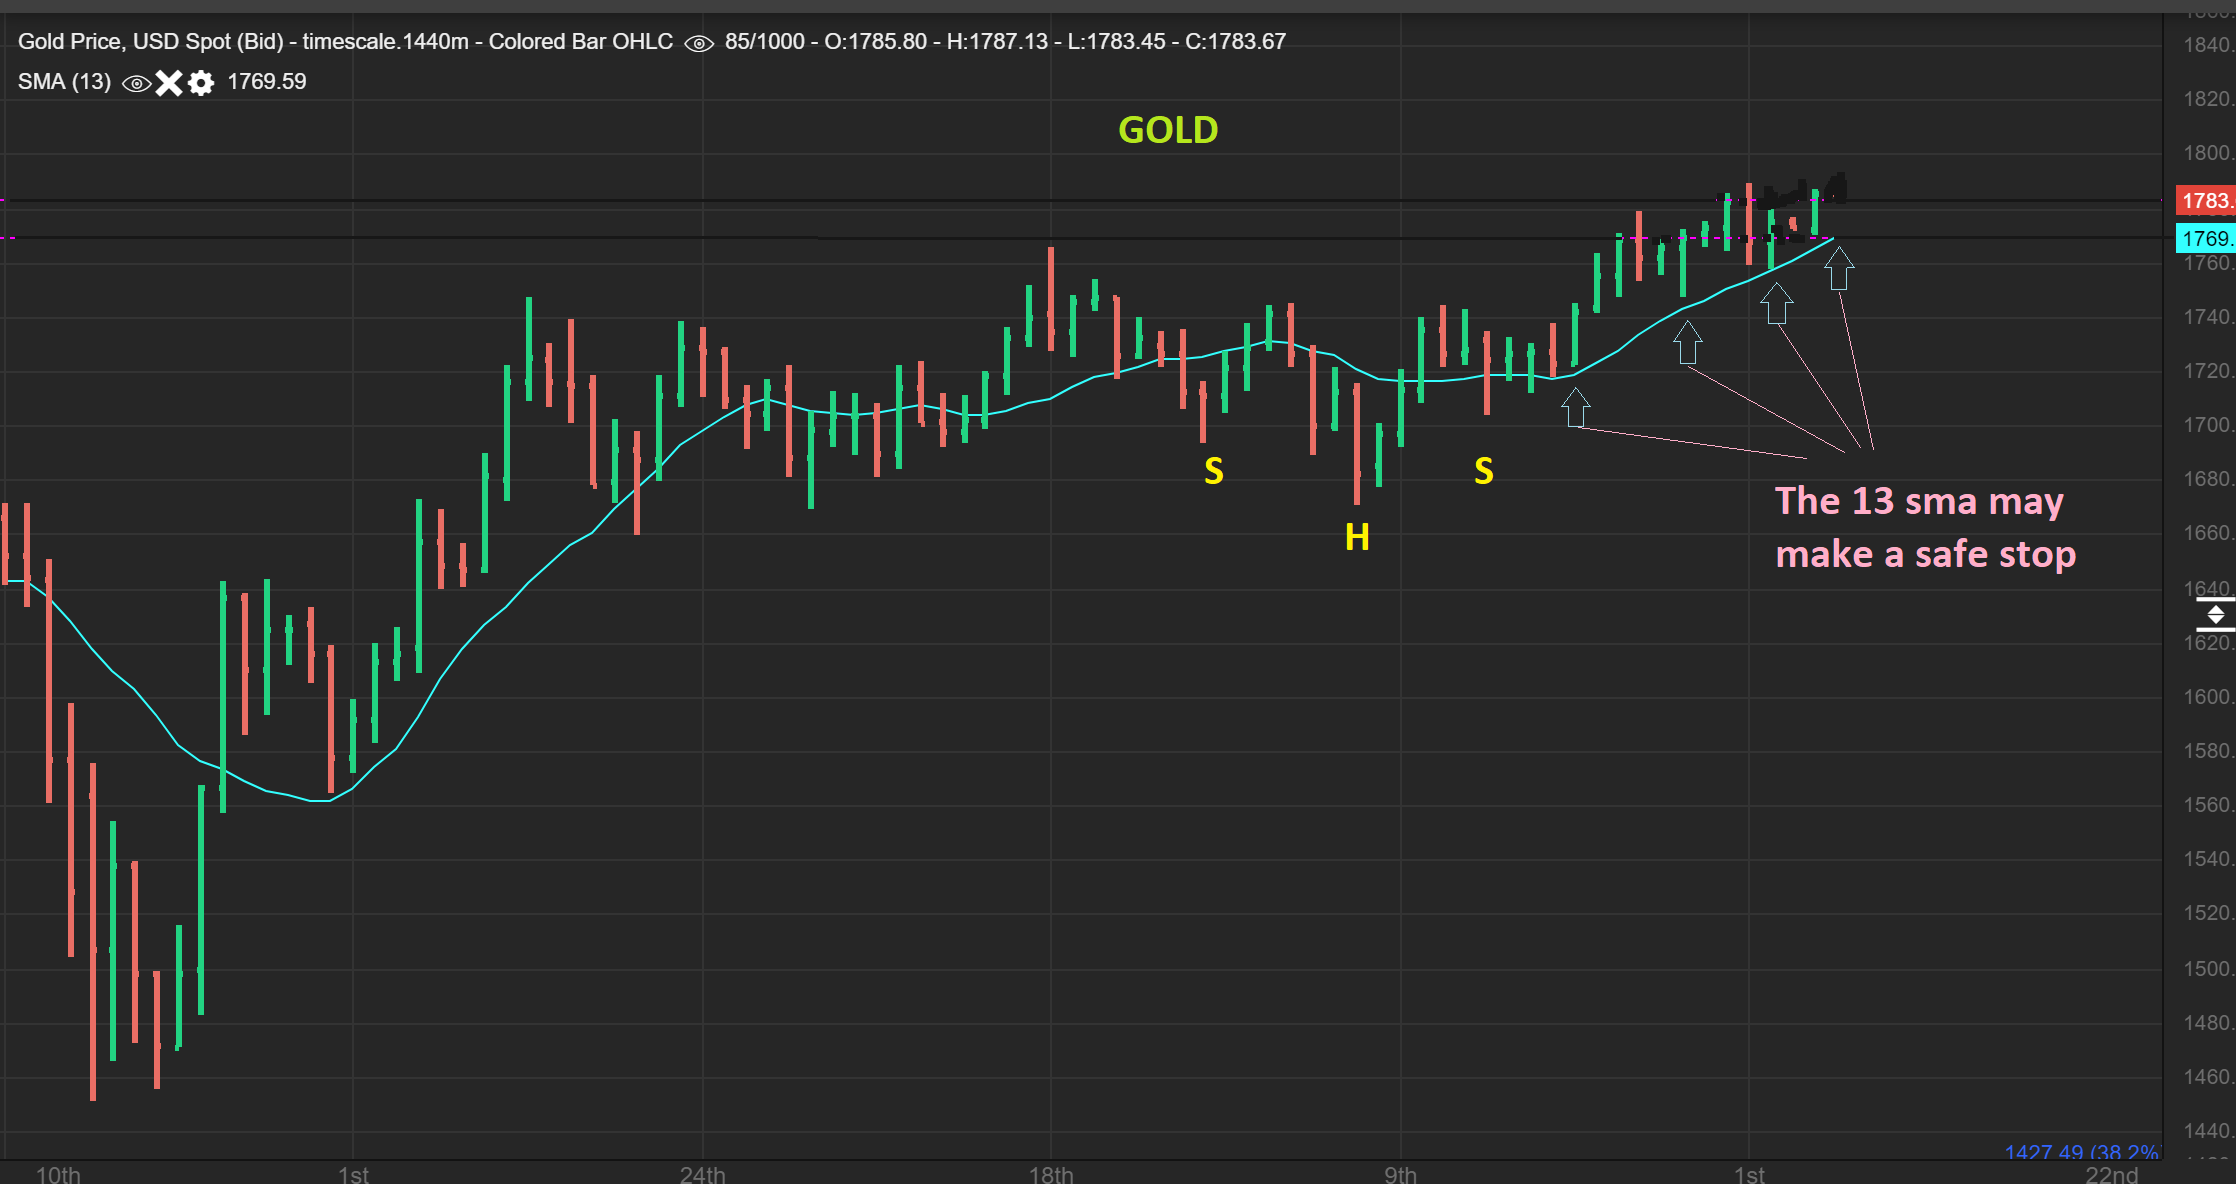
GOLD is climbing up the 13 sma. Please read the chart.
,
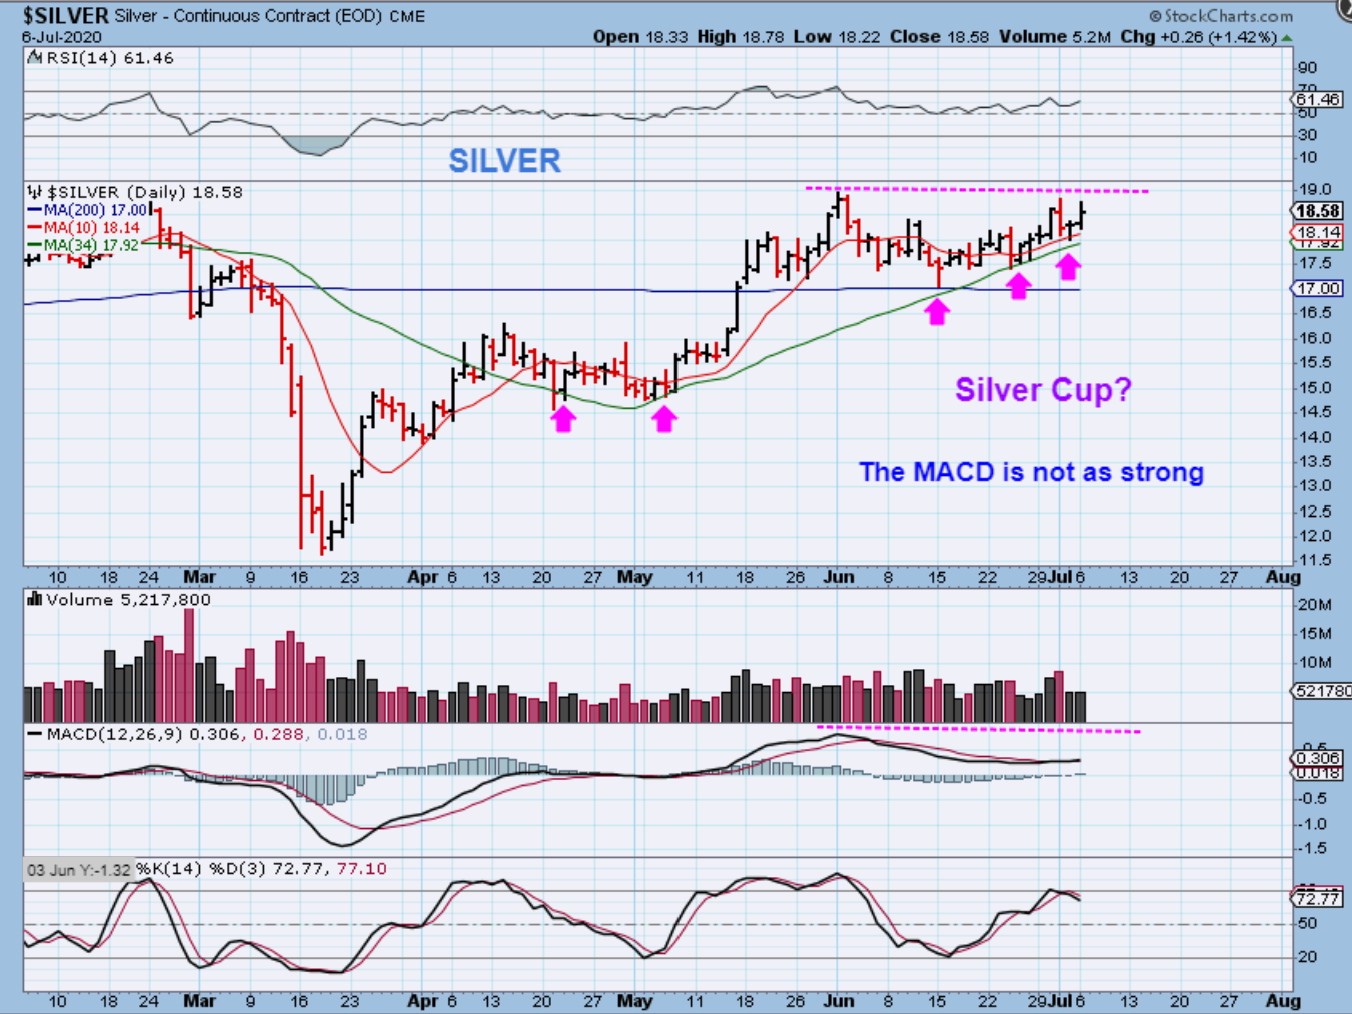
SILVER looks to have formed a cup, and has nicely been riding that 34 sma ( use as a stop?). The MACD seems to be a bit weak.
,
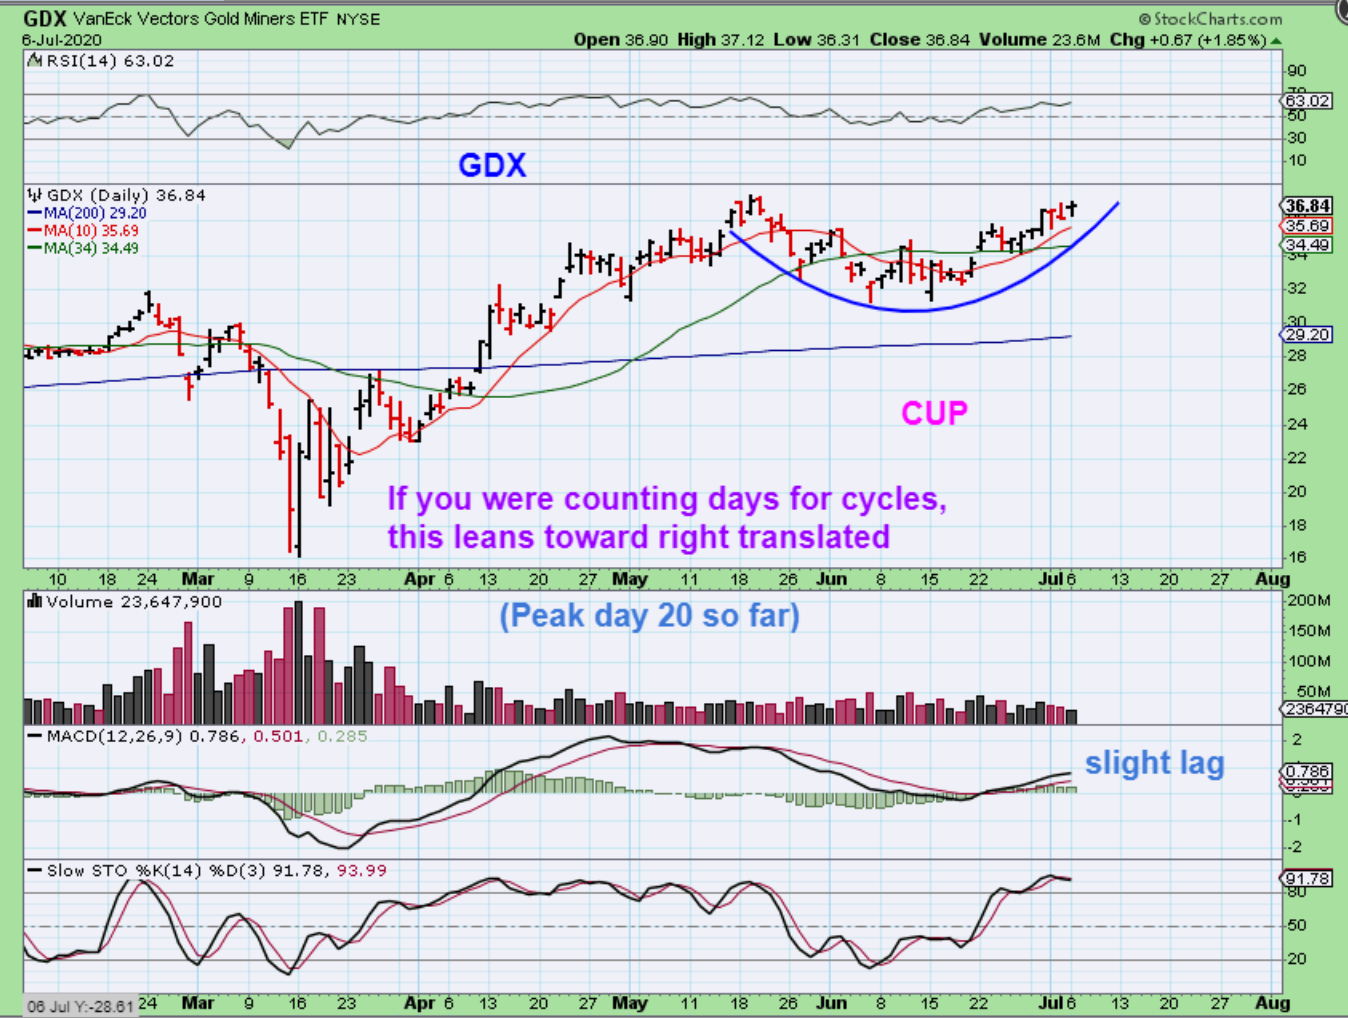
GDX has formed a cup too . This is a new peak and we are 20 days from the lowest low in that cup. That makes Miners look Right Translated.
,
MIXED MINERS: Some look weaker than others.
.
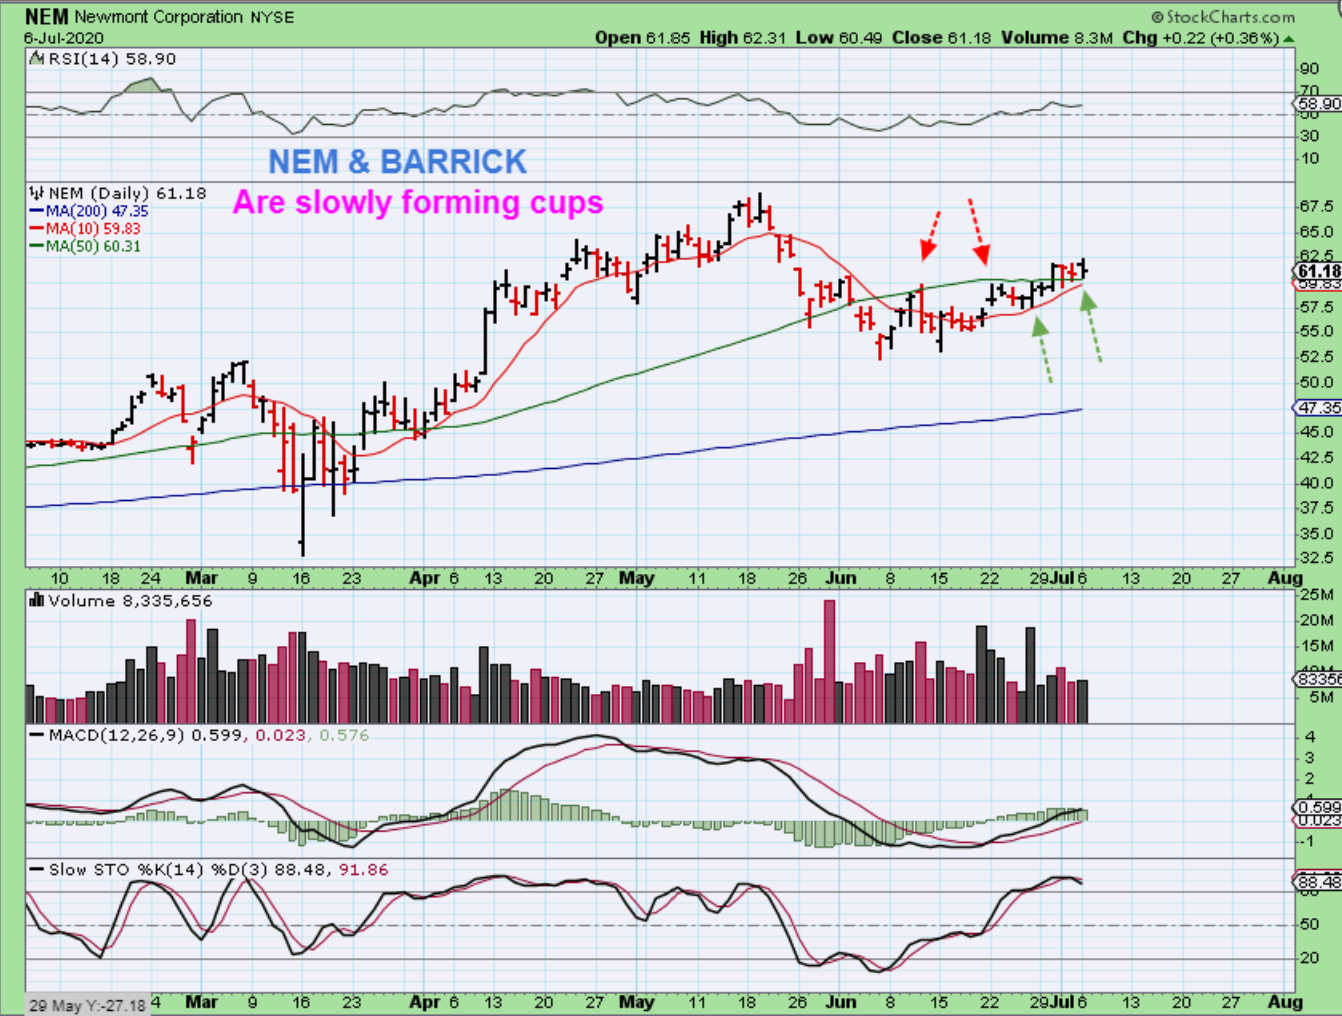
NEM – I wanted to take a look at NEM & Barrick and they are slowly progressing , not not really showing a great sign of strength. NEM pushed above the 50sma on the 3rd try, and notice how it rides the red 10 sma. That may make a reliable ‘stop’ for those concerned about giving gains back on a pull back.
.
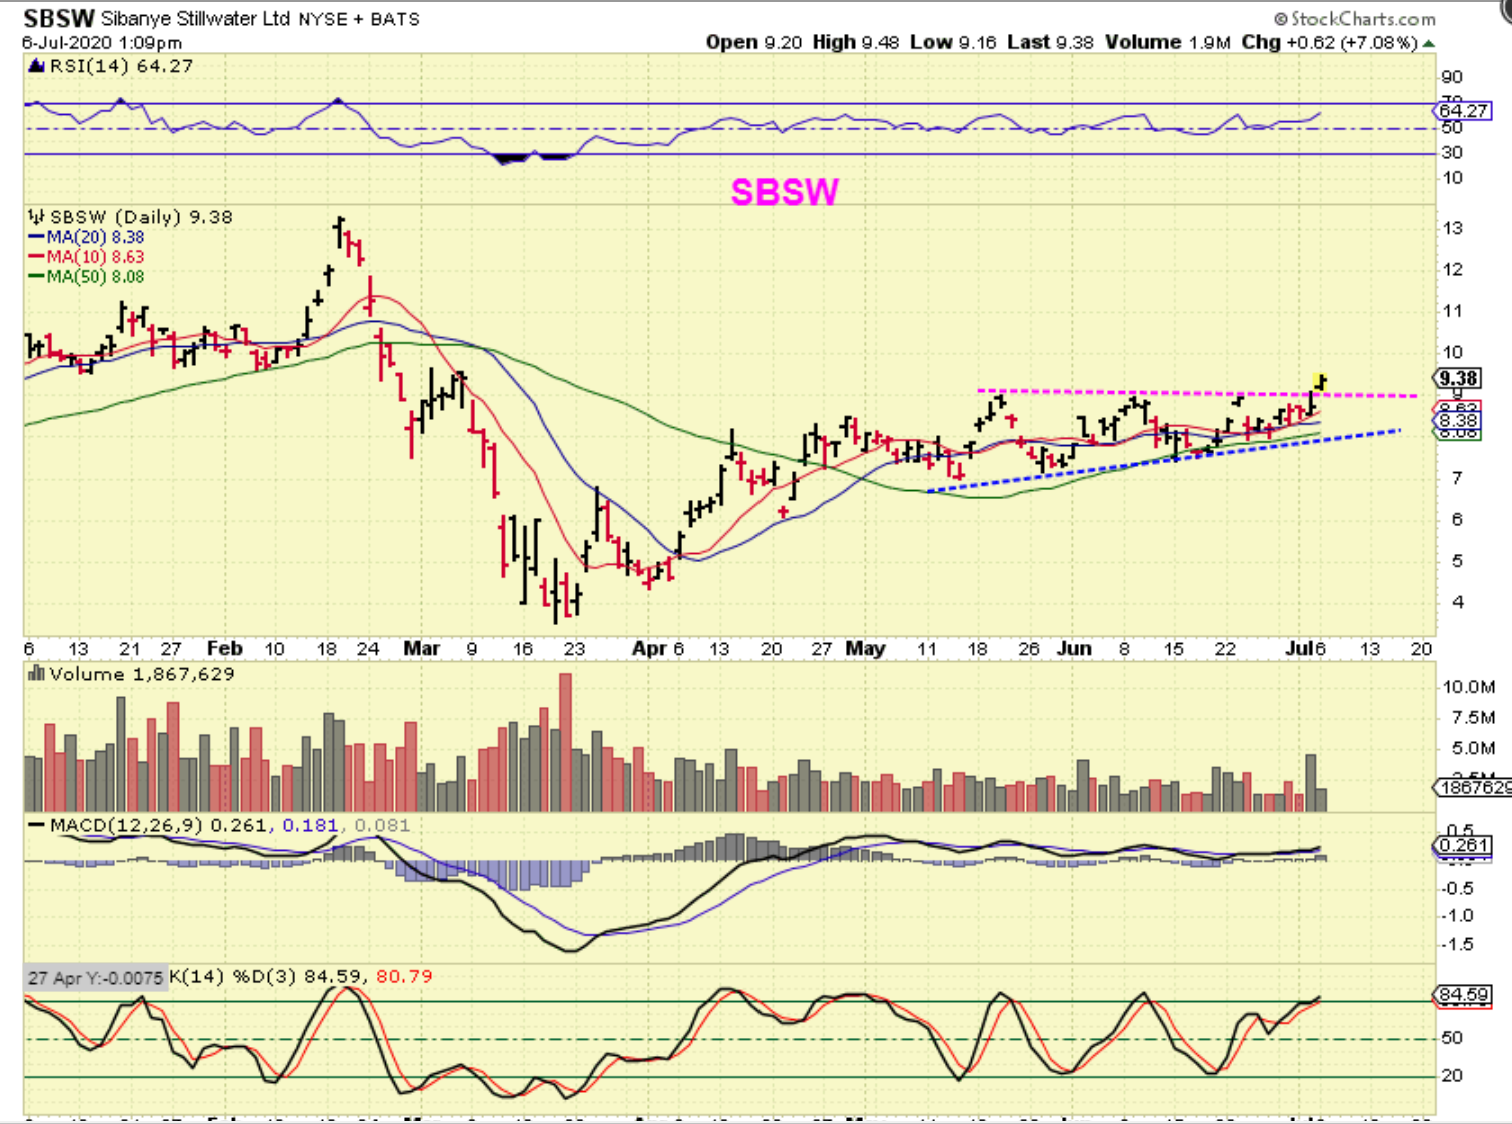
SBSW broke out and I captured this chart midday. It went on to close up over 9% and looks like a good break out for a run to the February highs. You could buy this or see if it back tests the break out too.
I am being asked, ” How will I know when to sell my miners?”. I did mention using trailing stops or maybe locking in some gains as price rises if things do not look strong. Other than that, you could also watch and see if NEM or Barrick or other individual Miners start to break down. If so, it may be a sign of weakness coming in to play and alert you to take some profit (or all of it). So far MANY areas have been taking turns running green, consolidation or basing out, then green again. It has been good for traders. I will review a little of that below.
.
Enjoy your Tuesday Trading!
.
~ALEX
.
I am reviewing many past picks below, and you’ll see that several are still valid . Don’t become overwhelmed at the amount of charts here, instead use them as learning lessons , some can go on a watch list for a pull back, and others are still Valid Buys Now. If today is a down day in the markets, you can look for pull backs to support, etc. Enjoy!
.
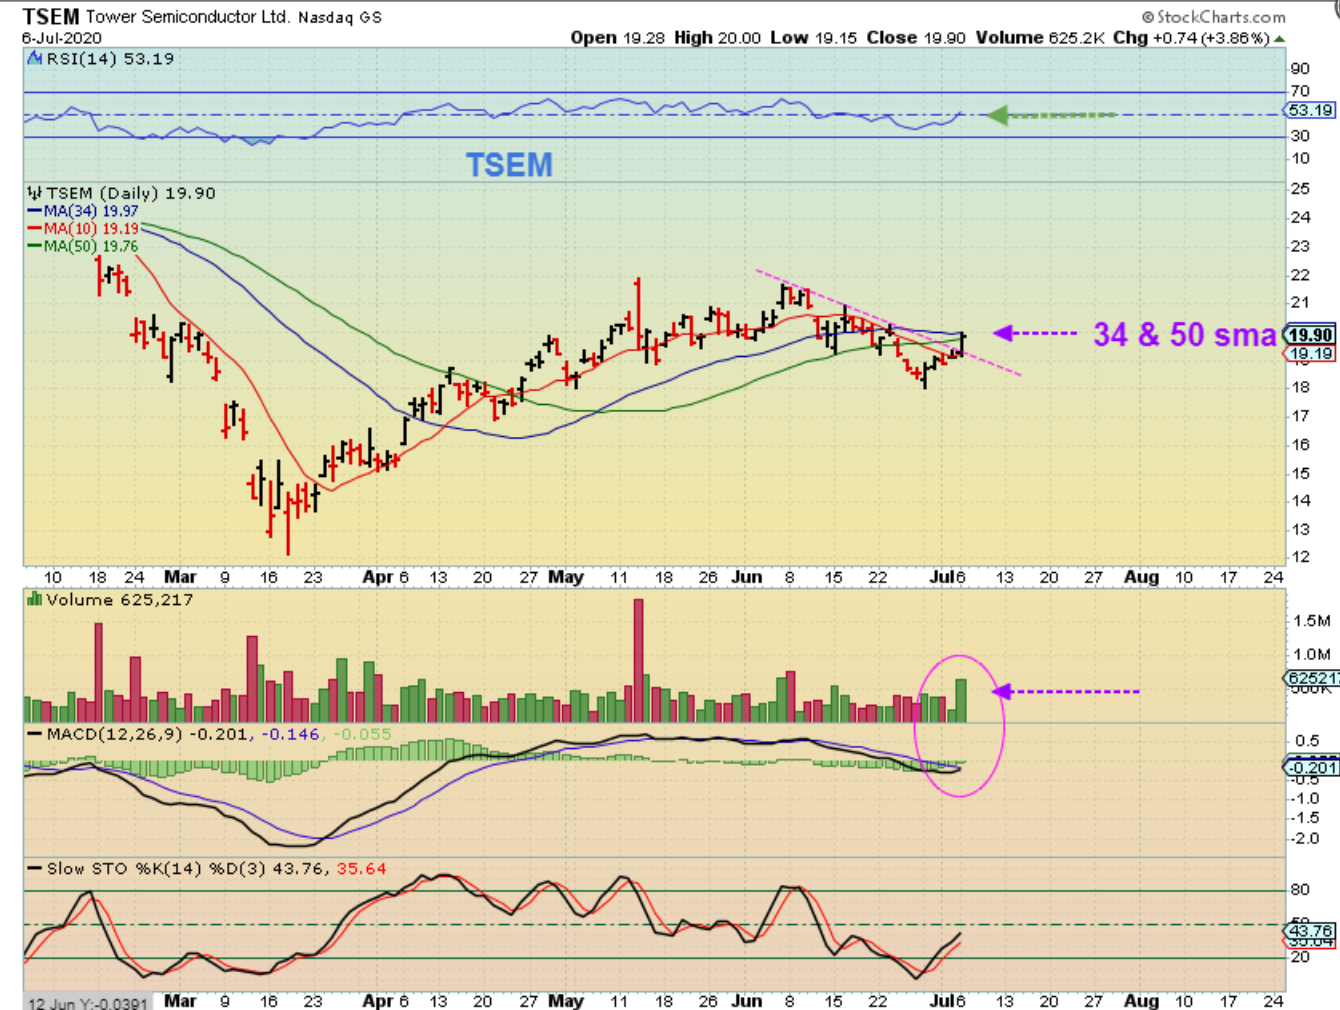
TSEM – Has broken above a down trend line and is pushing on the 34 sma ( & 200sma) with volume. This should break out and is a Buy with a stop if it breaks out ( or buy early with a tighter stop)…
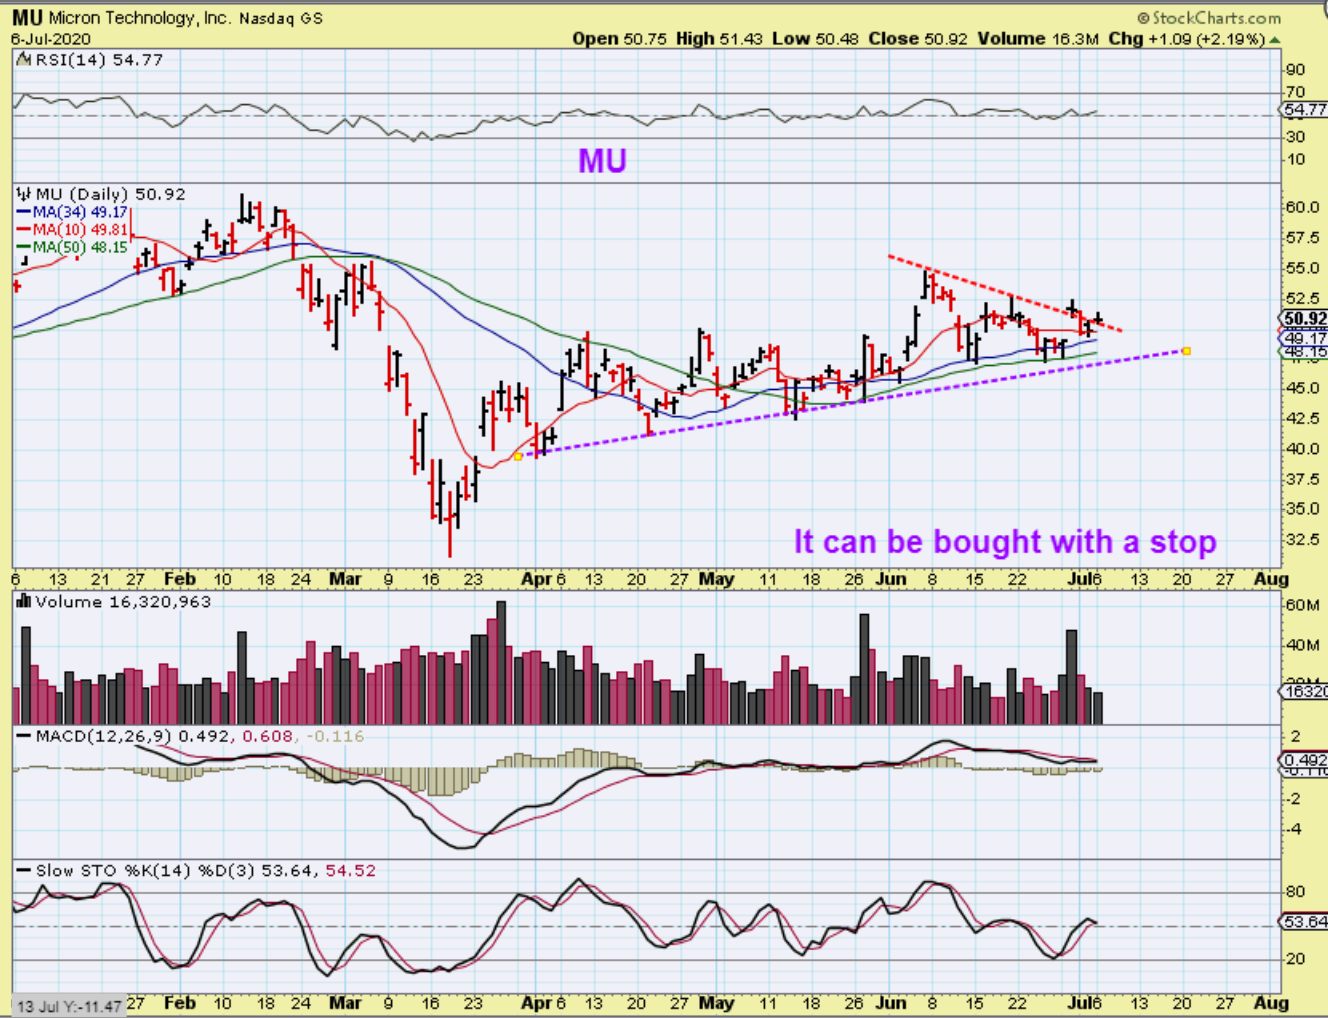
MU could break out and run with TSEM too ( Semi-conductors). So keep an eye on semiconductors.
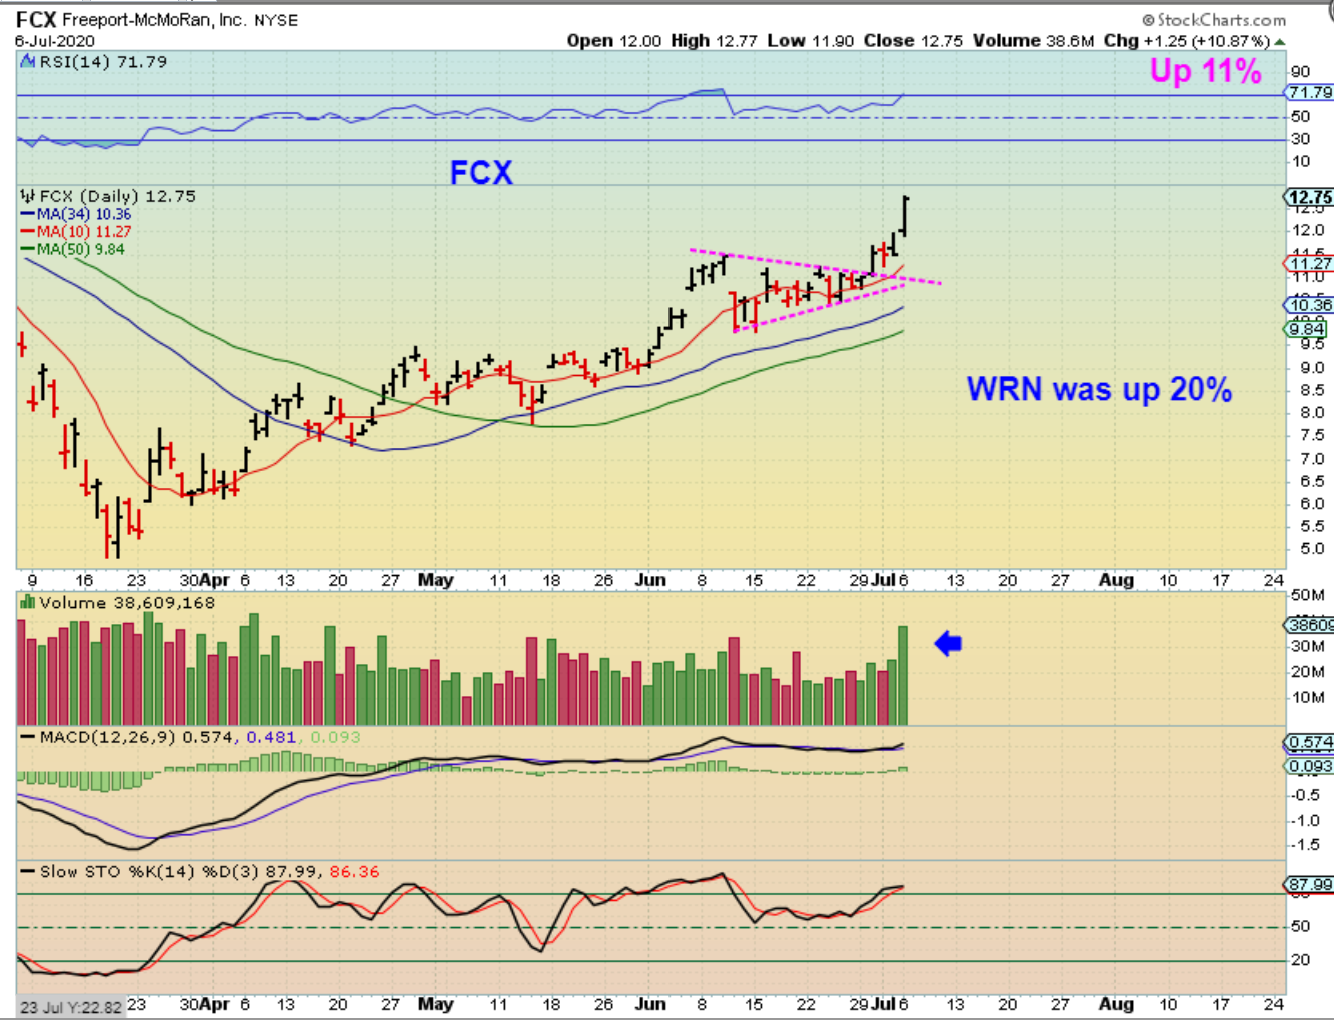
Recently I discussed that I thought the COPPER STOCKS were consolidating & Looked Bullish. Well they have done well, so some may play catch up. Lets review a few Copper Stocks…
.
FCX – broke out since then and was up another 11% Monday.
.
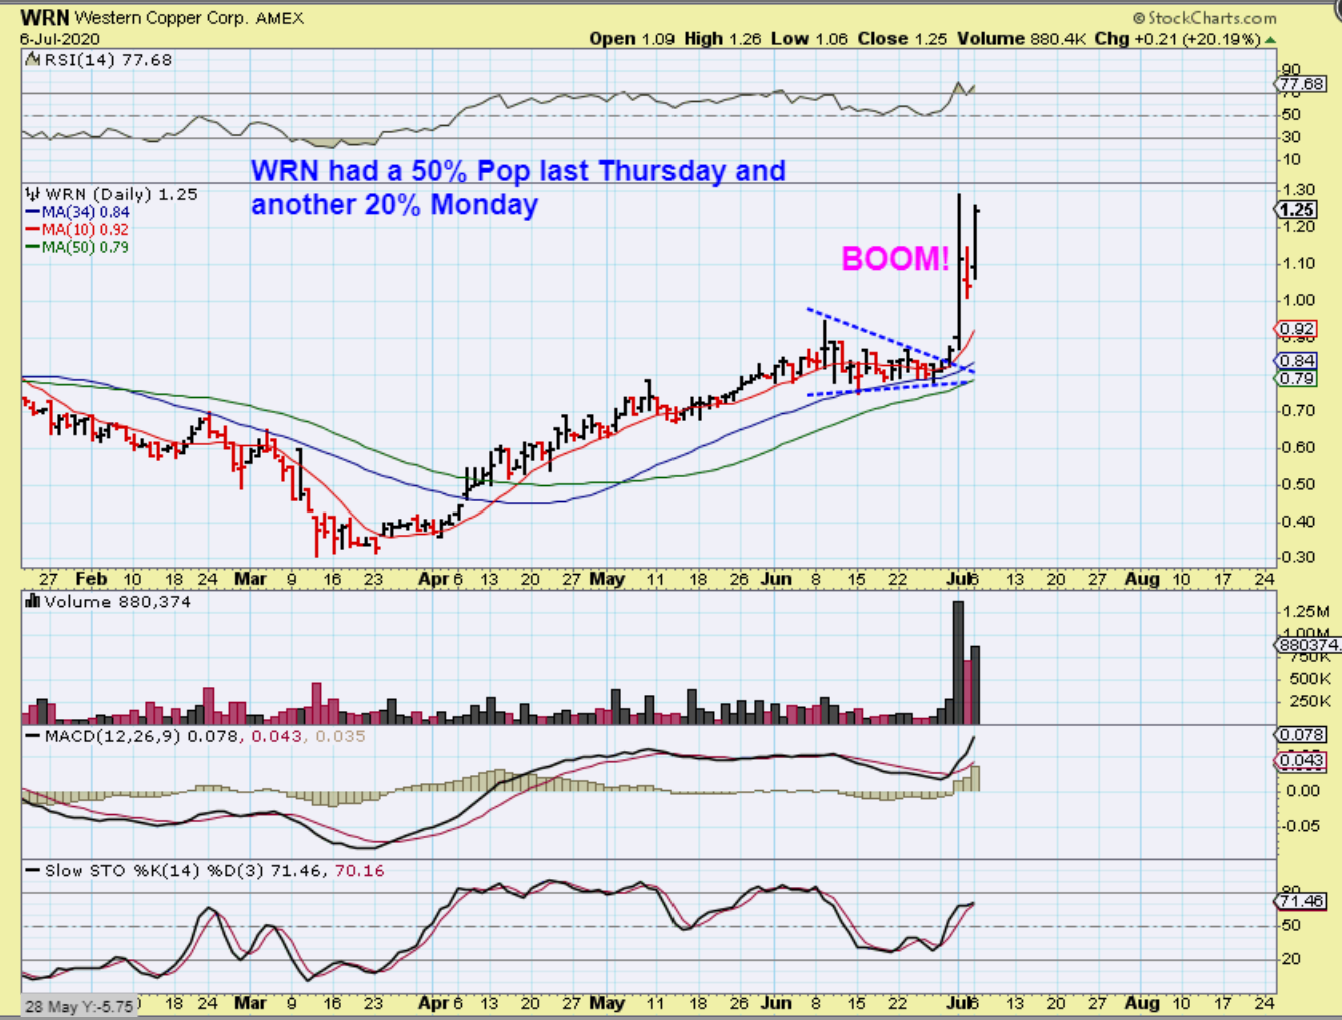
WRN was up 20% today, and actually popped 50% last week after I featured copper stocks, so….
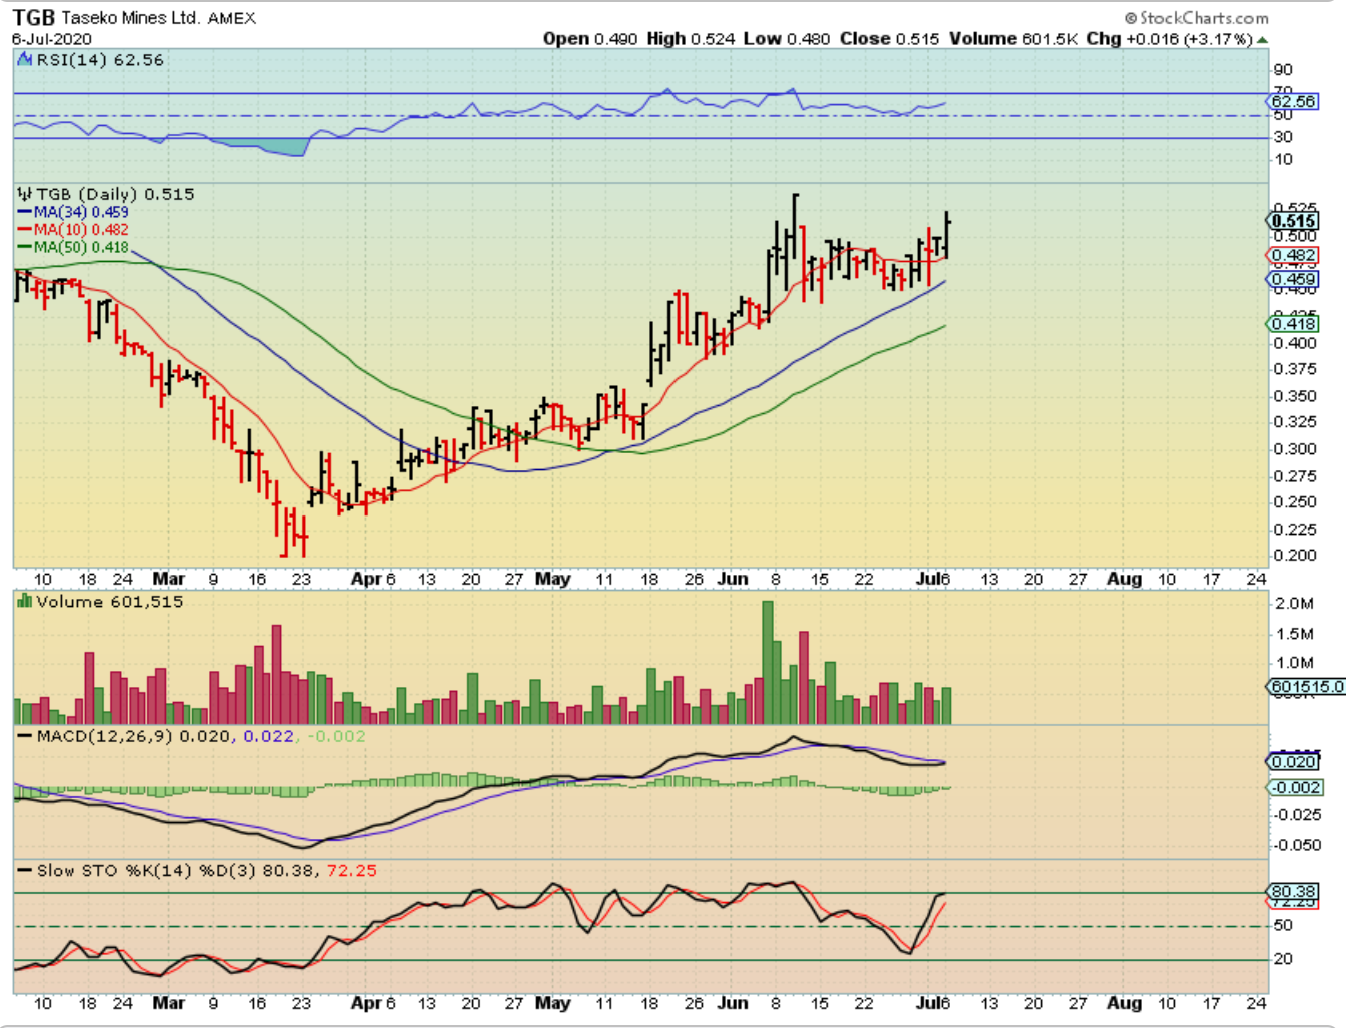
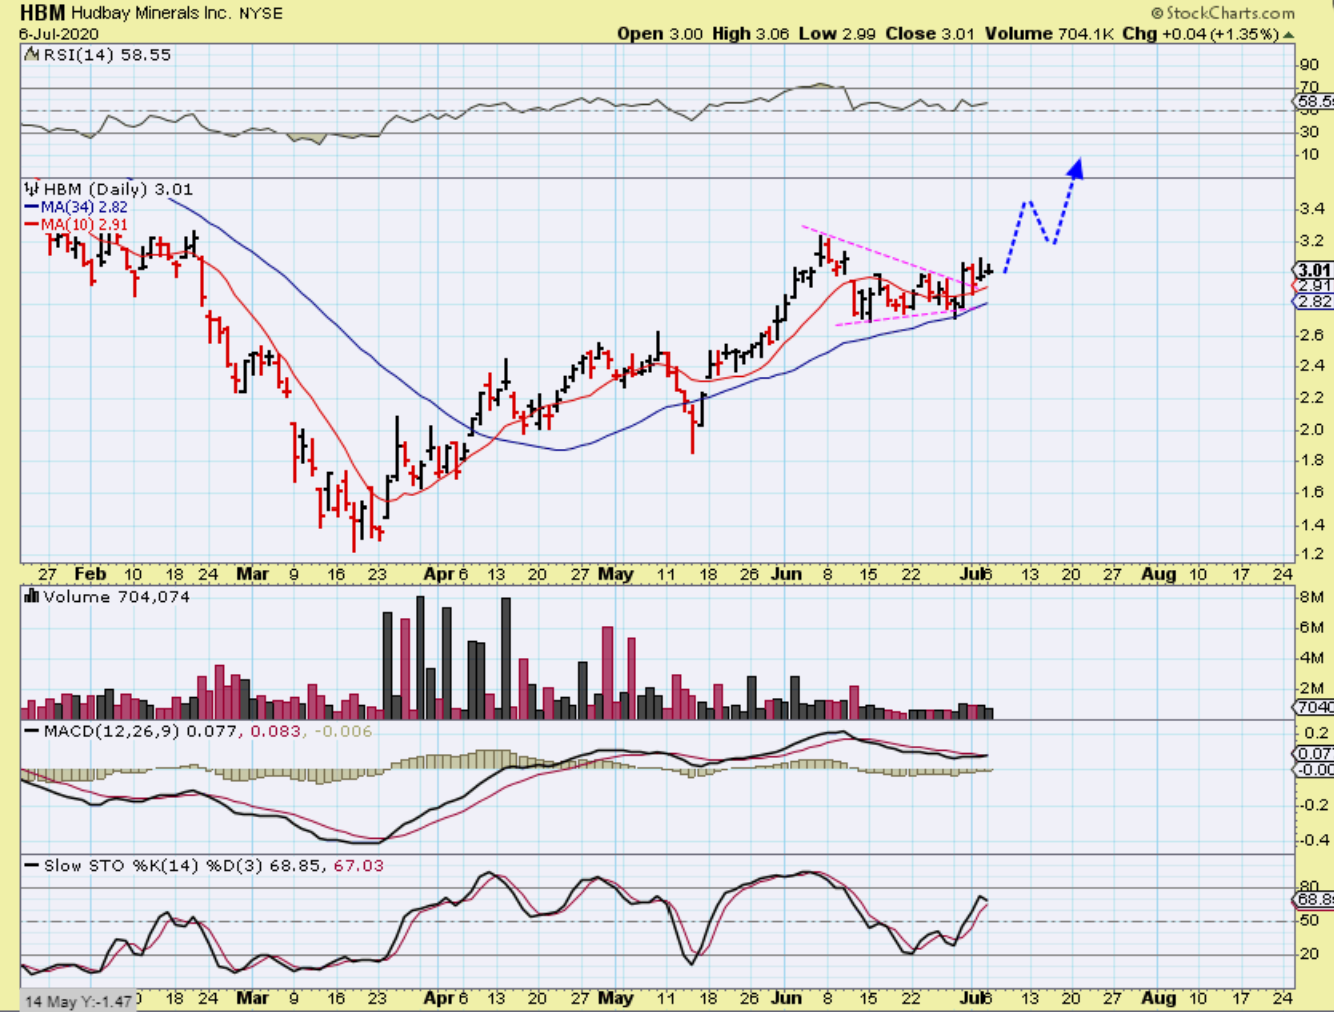
TGB & HBM may be ready to go next. TGB bounced off of the 34 sma Thursday and looks ready to break higher, and…
HBM is a break out from a triangle too. This can be bought for a short trade or even a longer term trade. They are a bit of a rough ride at times, they’ve been choppy, but are in an uptrend since March.
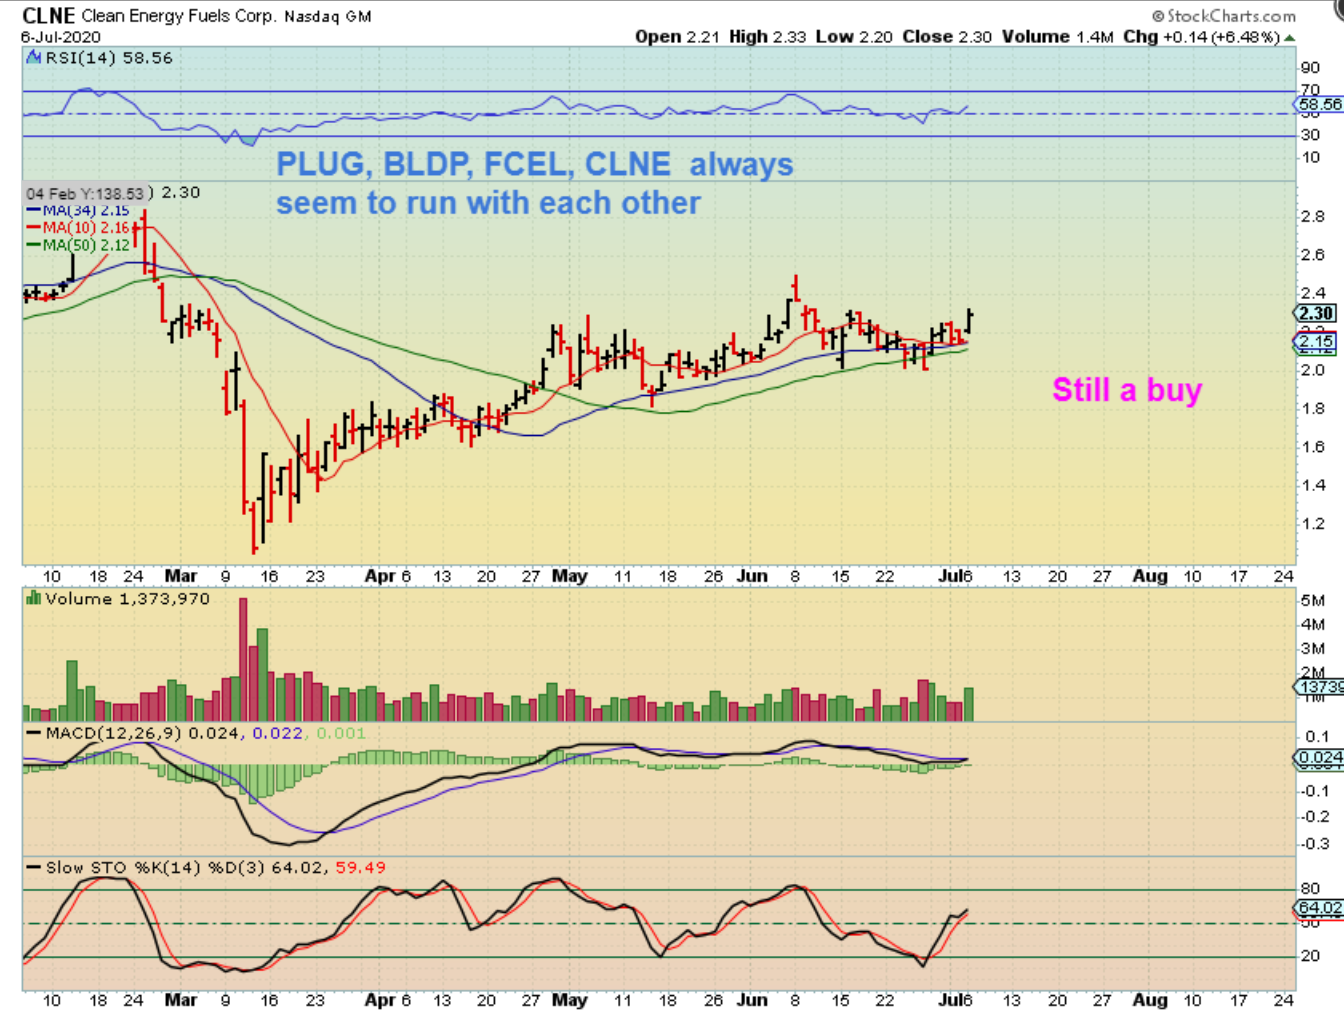
I pointed out FCELs reversal as a BUY on this chart . I said that I bought it, because when PLUG and BLDP run (and they are running!) FCEL and CLNE often run too. PLUS…
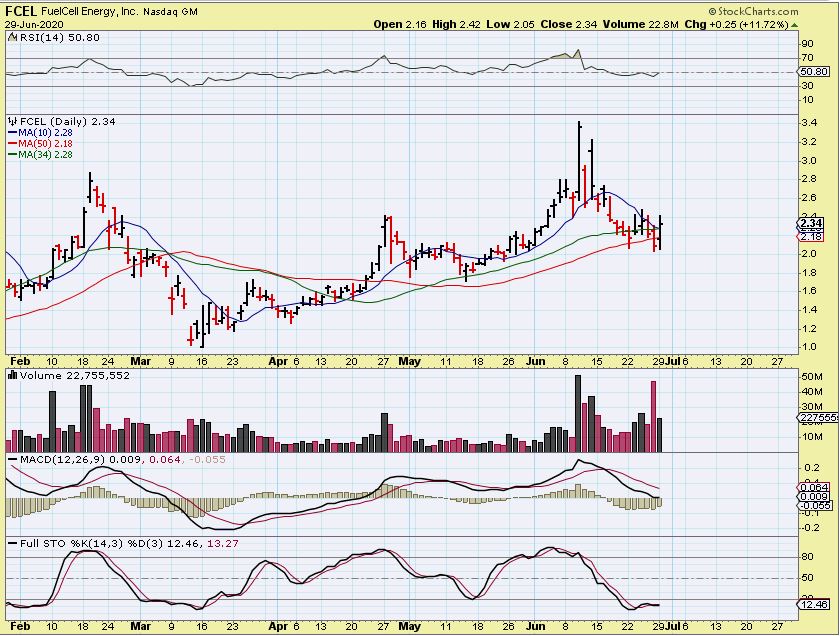
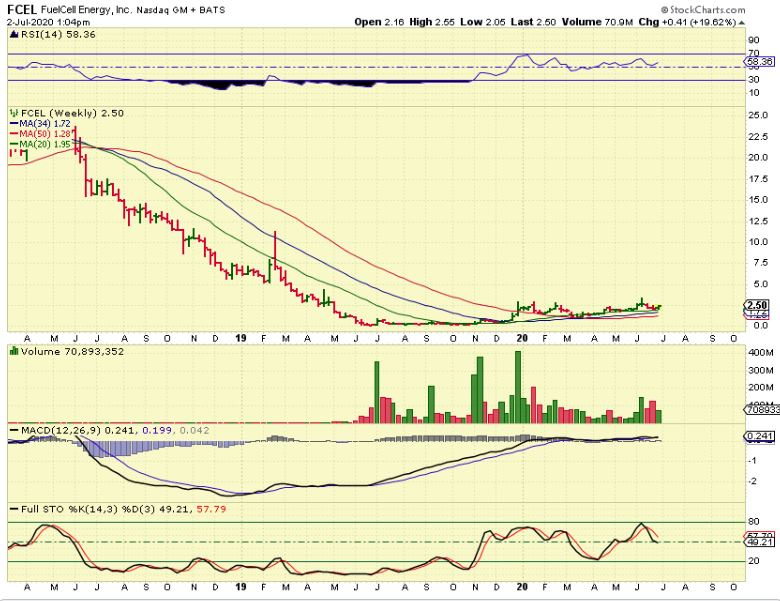
FCEL – I of course pointed out on this chart that I like the uptrend of this BASE 🙂
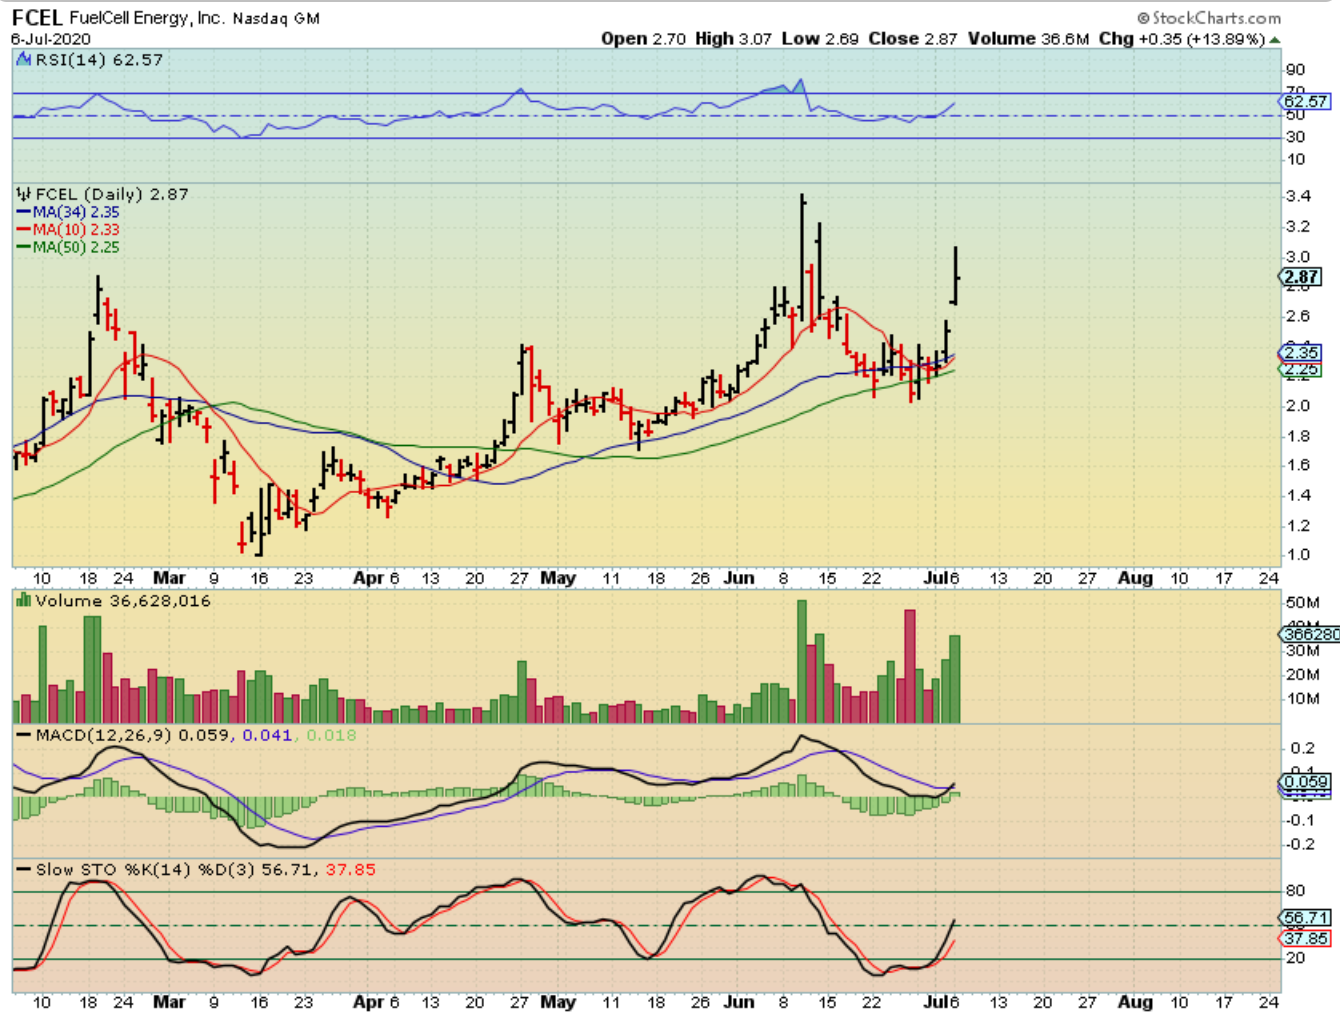
FCEL has moved from in 3 days $2.30 to $3.07 Monday, but it pulled back into the close. IF THIS FILLS THAT GAP, you may be able to add or start a position. This is a nice st up. And of course…
CLNE was mentioned too, and it is just getting started really. This could still be bought right here. Volume popped a little and this may be ready to go right now.
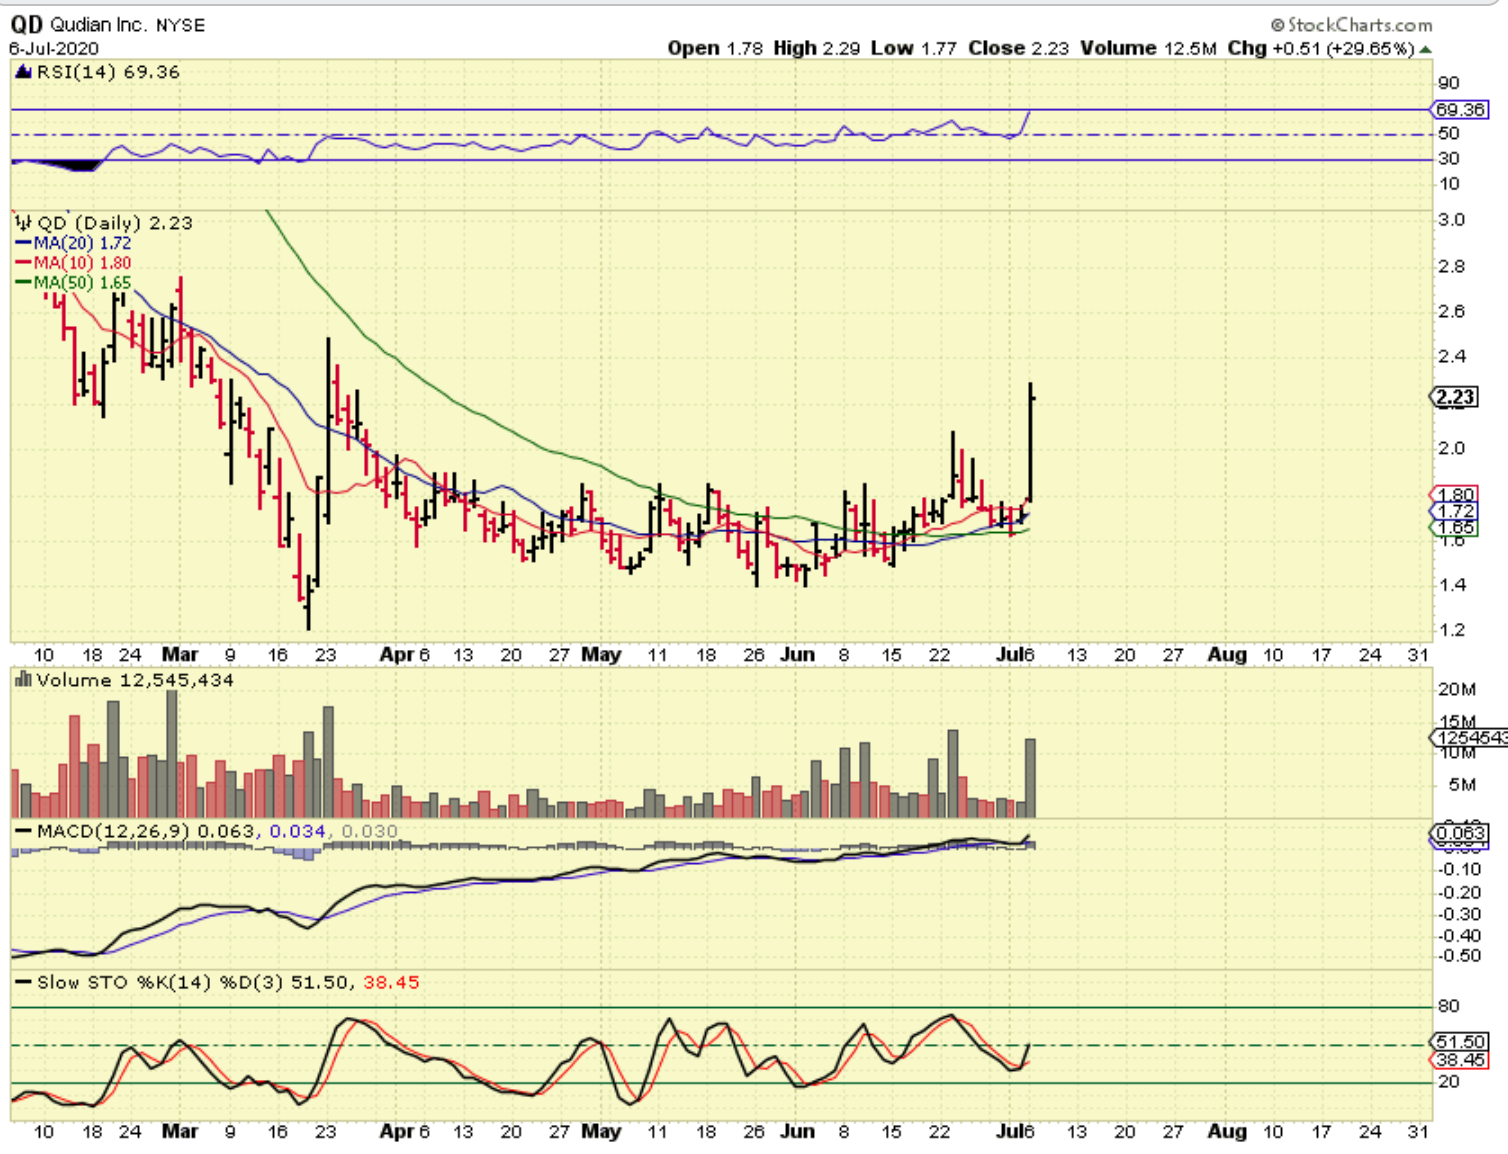
QD from June 11 – this was in a base and I mentioned that I Bought it. I know that others did too. It Popped after that , but then it dropped back to the 50 sma after I posted this chart, but remained bullish and …
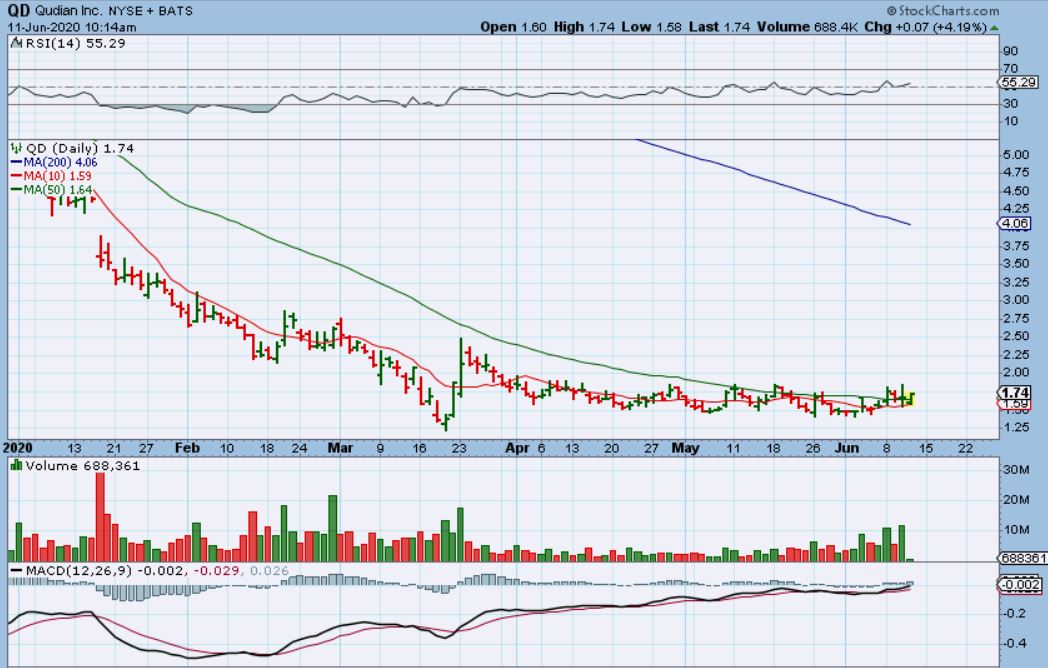
QD after retesting that 50 sma, QD popped 30 % Monday. Volume has been strong on the pops and QD will probably continue trending higher out of this base. It is oversold.
SOLAR STOCKS WERE POINTED OUT AS BULLISH WHEN WNDW & SUNW Took off higher.
.
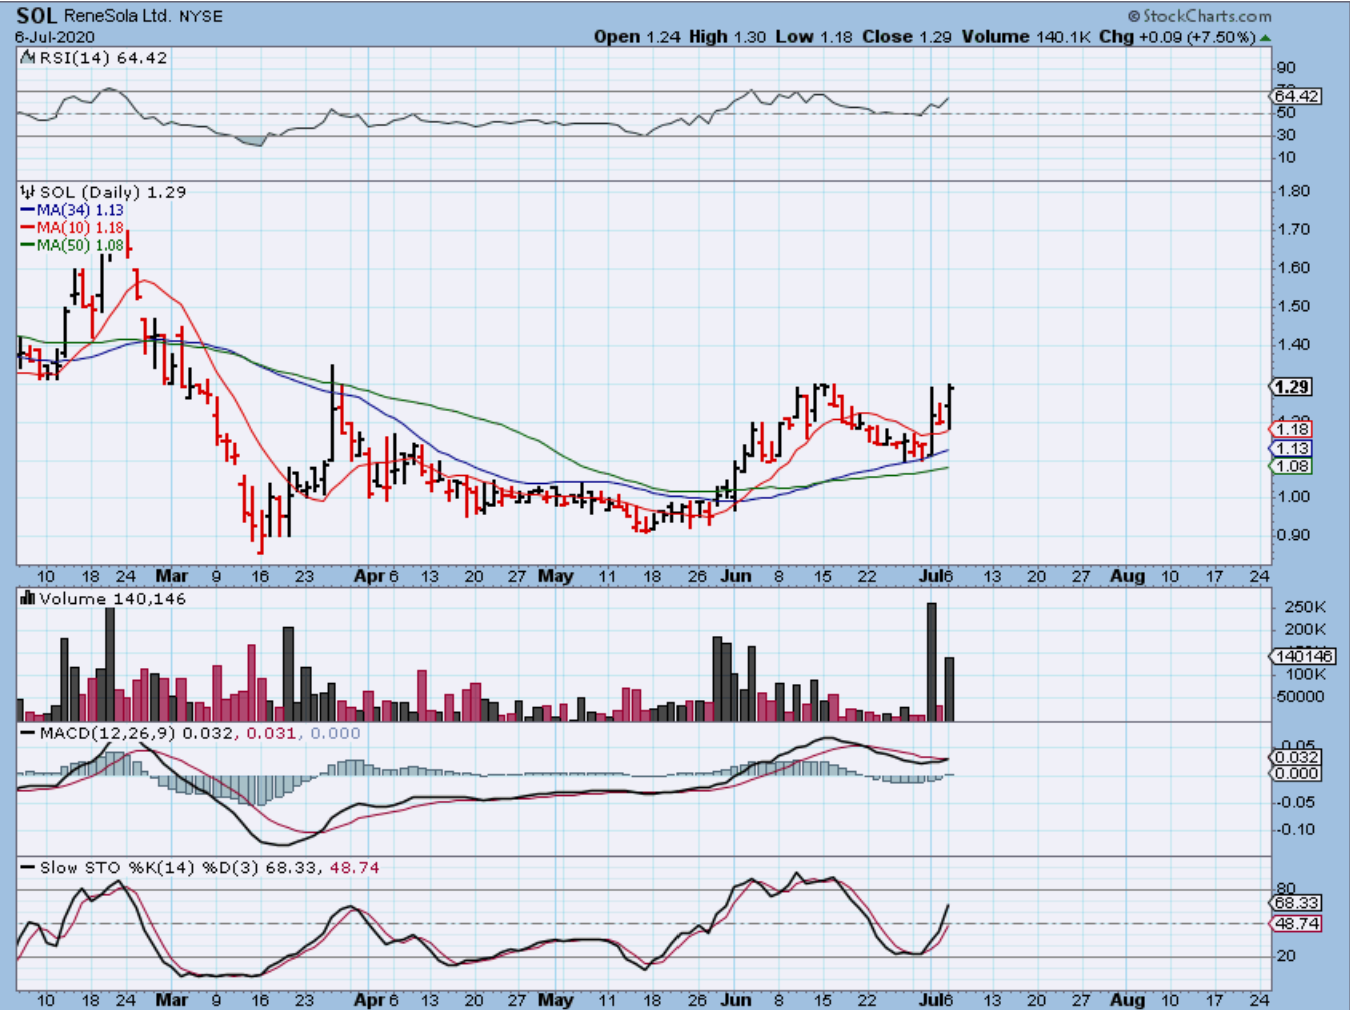
SOL had a possible target of around $1.50 or more (red arrow). I really liked the set up of JKS, SPWR, and CSIQ too. I bought SOL for this trade off of the 34 sma.
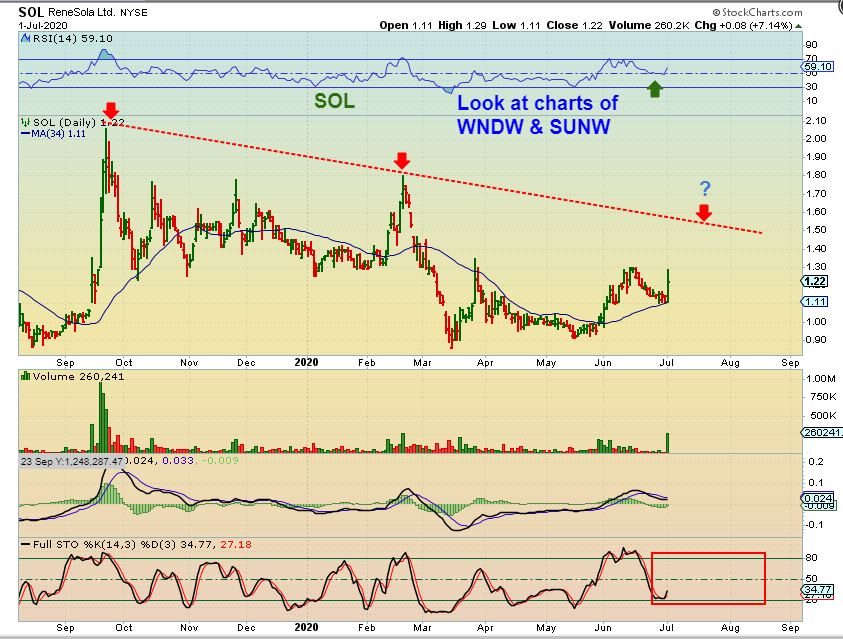
SOL Popped Monday, but being still near the support levels, I would say that SOL & SPWR are still a buy. JKS, CSIQ, and SPWR broke out Monday and look great. Let me show you that…
.
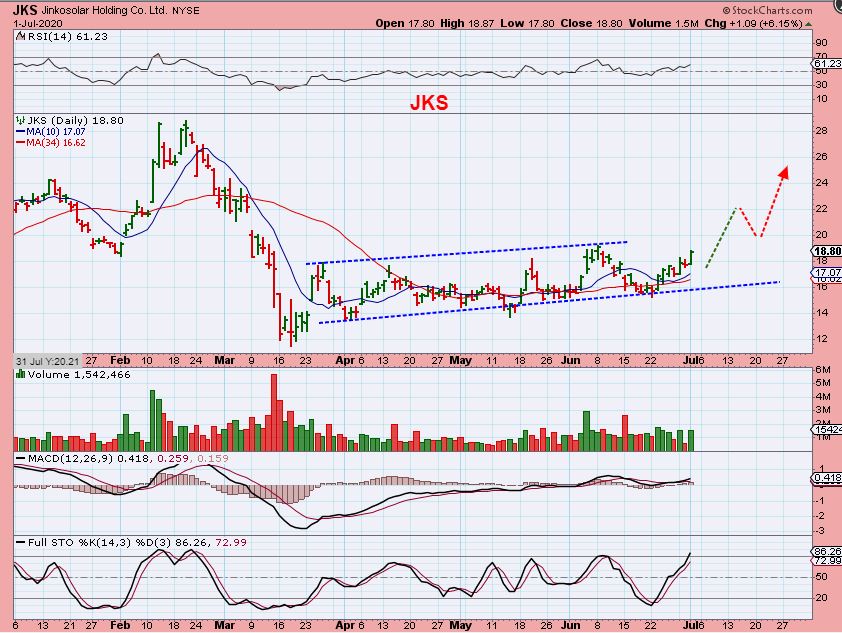
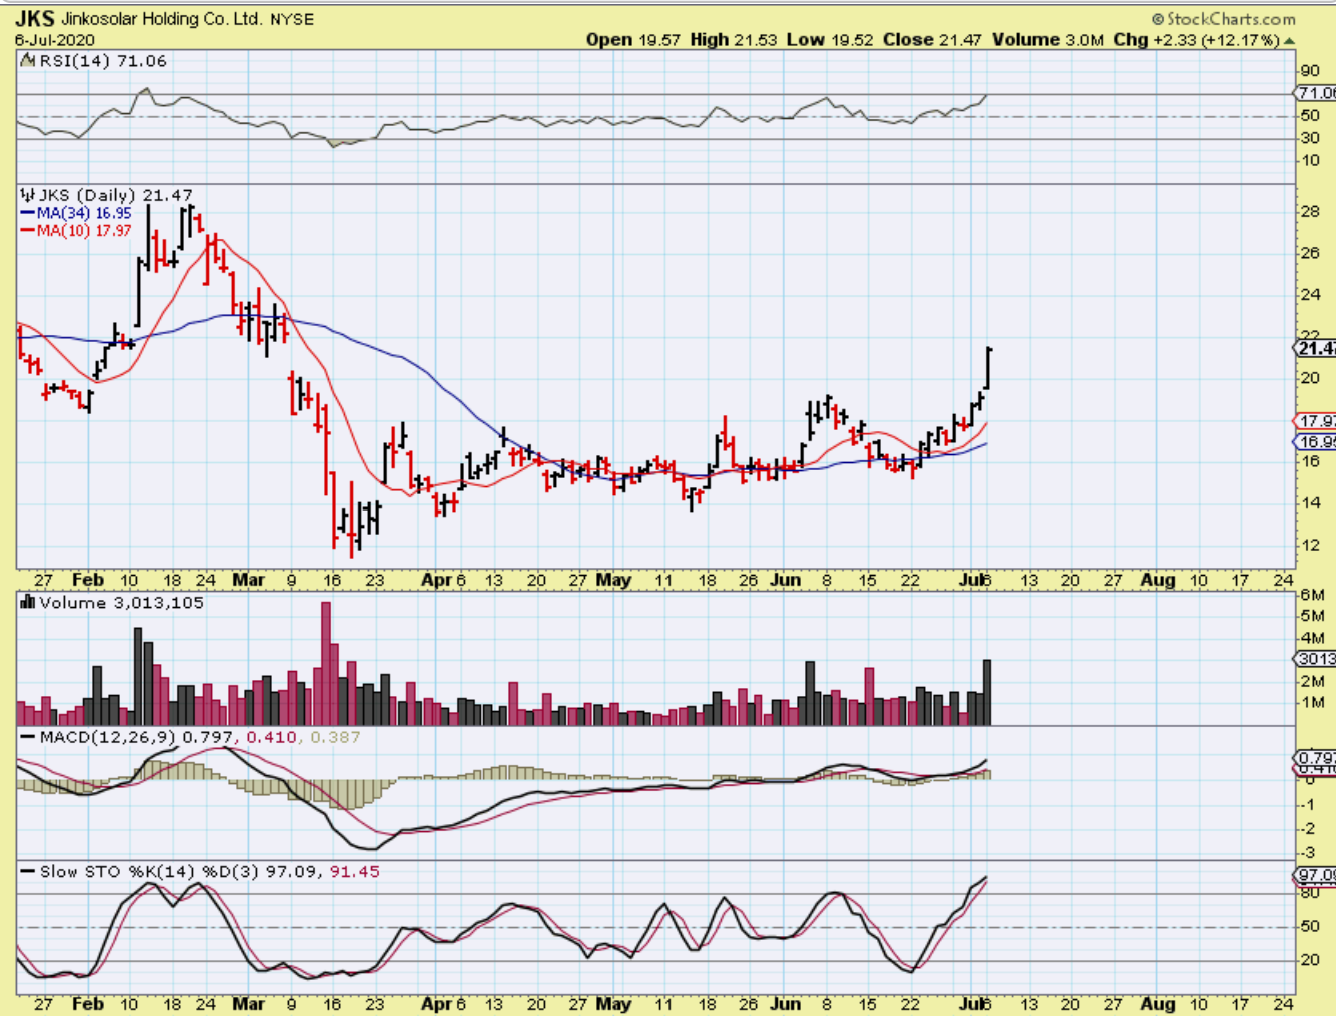
This was the JKS chart that I posted July 1. Volume was good and it looked set up to break out and run…
.
JKS is running and volume came in on these Monday. JKS was up another 12% and these want to run to prior highs.
.
FOLLOW UP ON THE BASES : These started out with me labelling them ‘Not for everyone’. This is because they would POP and drop, and it was best to sell that Pop after a day or 2 to lock in great gains. THAT MAY BE CHANGING. Some of these are now trending higher and others may folow since they are COVID related and the problem persists. Let’s review a few charts…
.
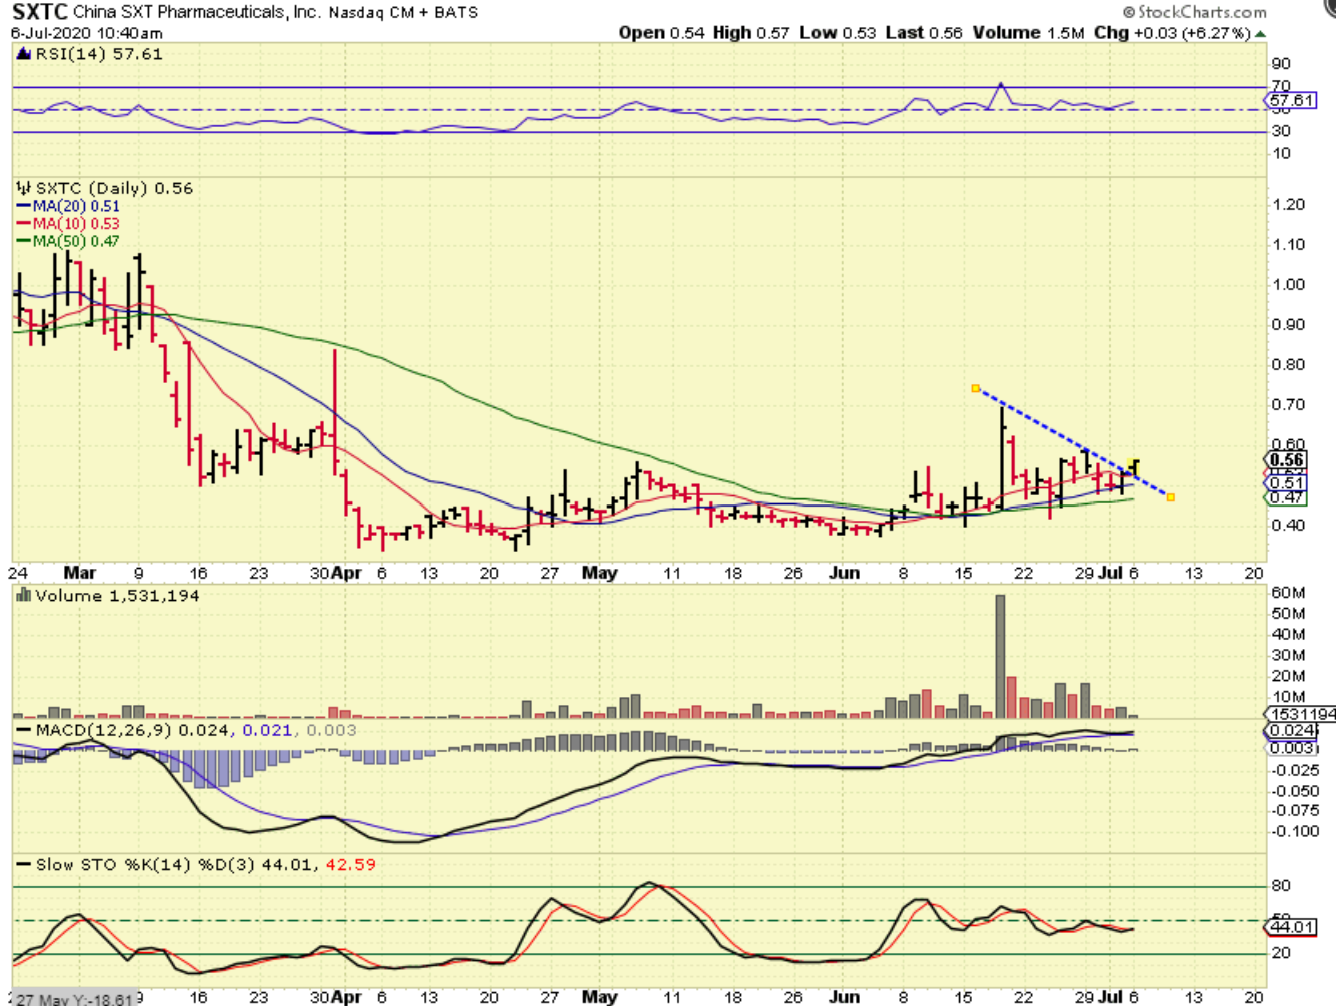
SXTC looked to be breaking out Monday, so I posted this in the first hr of trading. It closed a bit higher on 10 million, so this could find follow through & break out Tuesday too. For those that like to trade these, a break out can be bought with a stop under the 50sma (but if it chops, you may also be stuck in this base for a bit longer).
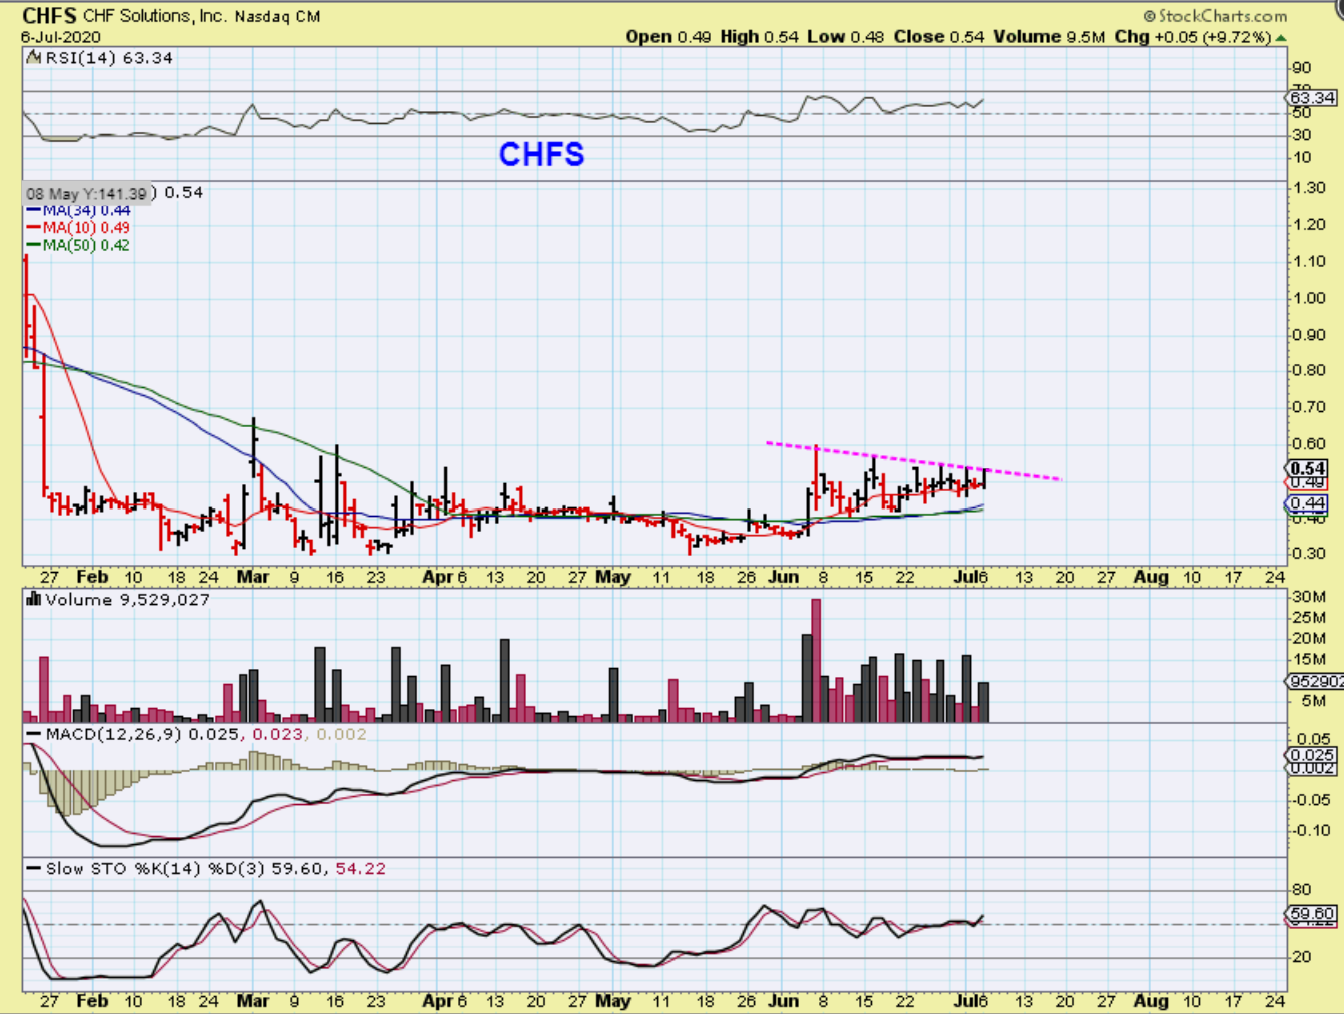
Have I mentioned CHFS? Oh I love this set up, and it almost looks too good to be true honestly. So good and orderly that I keep wondering, “Are they going to do a quick ‘ shake out’ first & then buy this breaking out running?” It is almost too nice set up as time goes on.
.
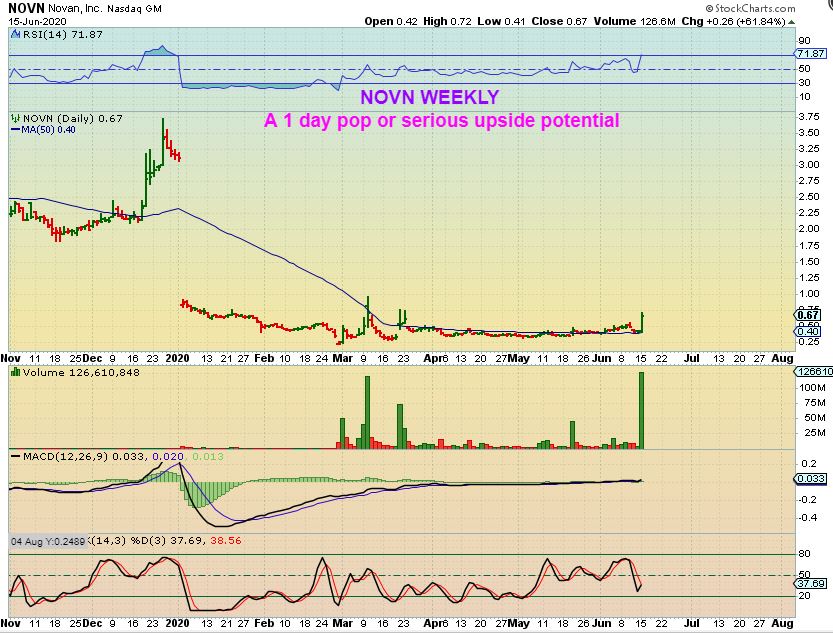
NOVN from June 15, I just wanted to re-show this chart because it highlights the base for NOVN before we zoom in.
.
NOVN has been popping and dropping and also Popped roughly 20% Monday. It then sold off by the close but this is still up 10% . It is still a buy since it is near the moving averages and it has been riding the 34 & 50sma really nicely so far.
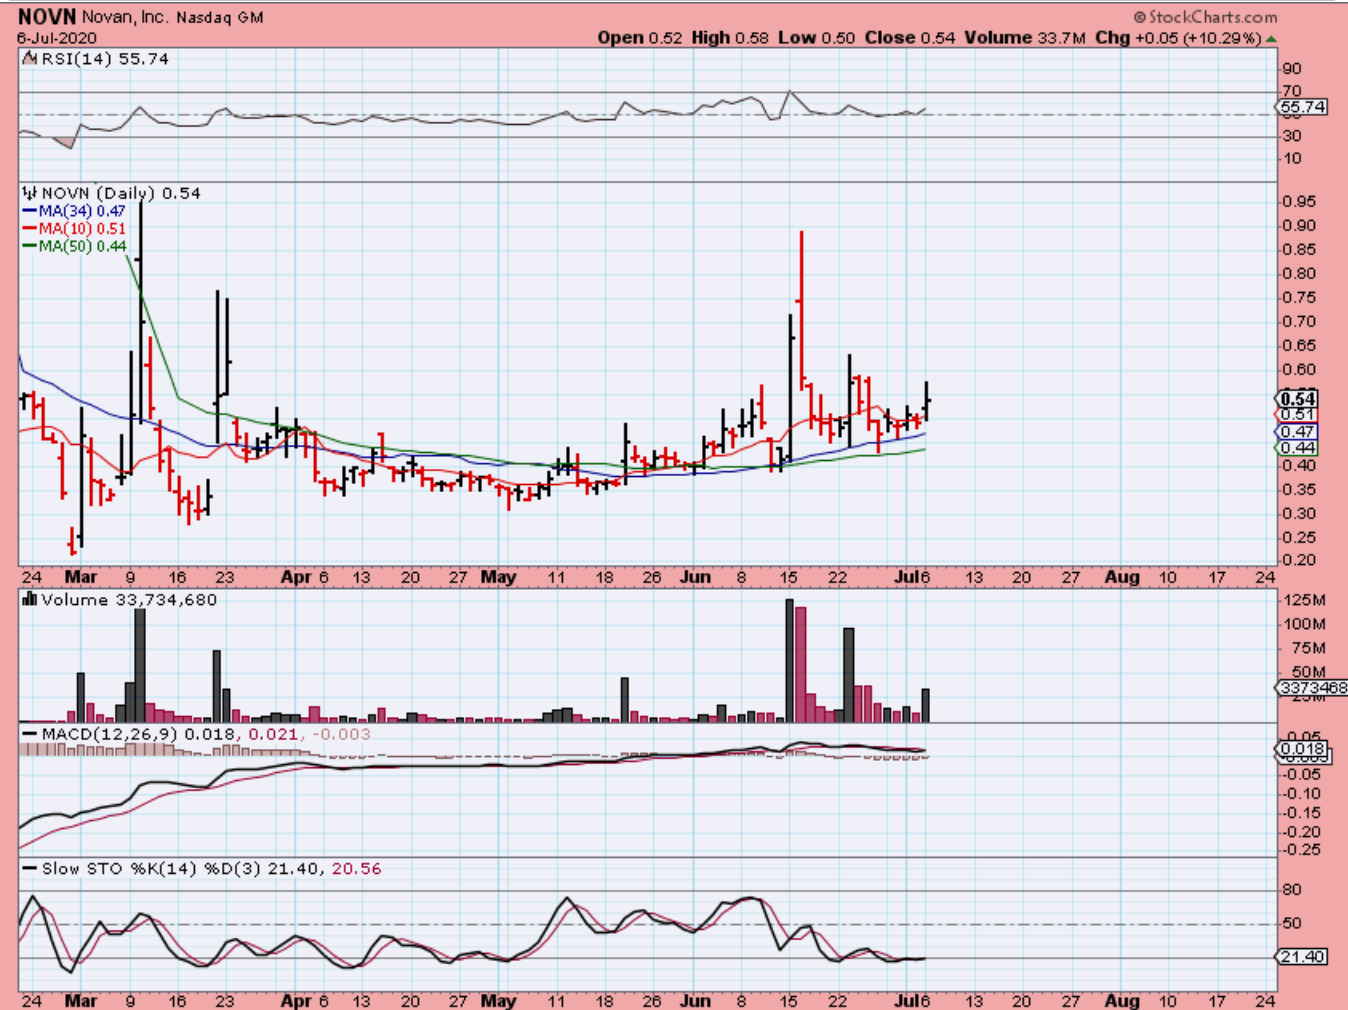
ONE WARNING about these Nasdaq stocks. Some have been warned that if they don’t get back above $1, they could be de-lidsted over time. You can find things like that under their News Feed. They often file for and get a 3-6 month extension, but it is worth knowing where they stand if you buy & hold them.
.
The Chinese stocks that POPPED are POPPING and some are running again. Look at charts of previously mentioned China stocks HUYA, BIDU, SOHU, KNDI, LEJU, etc and you’ll see them as choppy, but now trending higher. It looks like QD and QTT have entered that recovery phase. Others are still in that POP and Drop to support phase, and had a good day Monday.
.
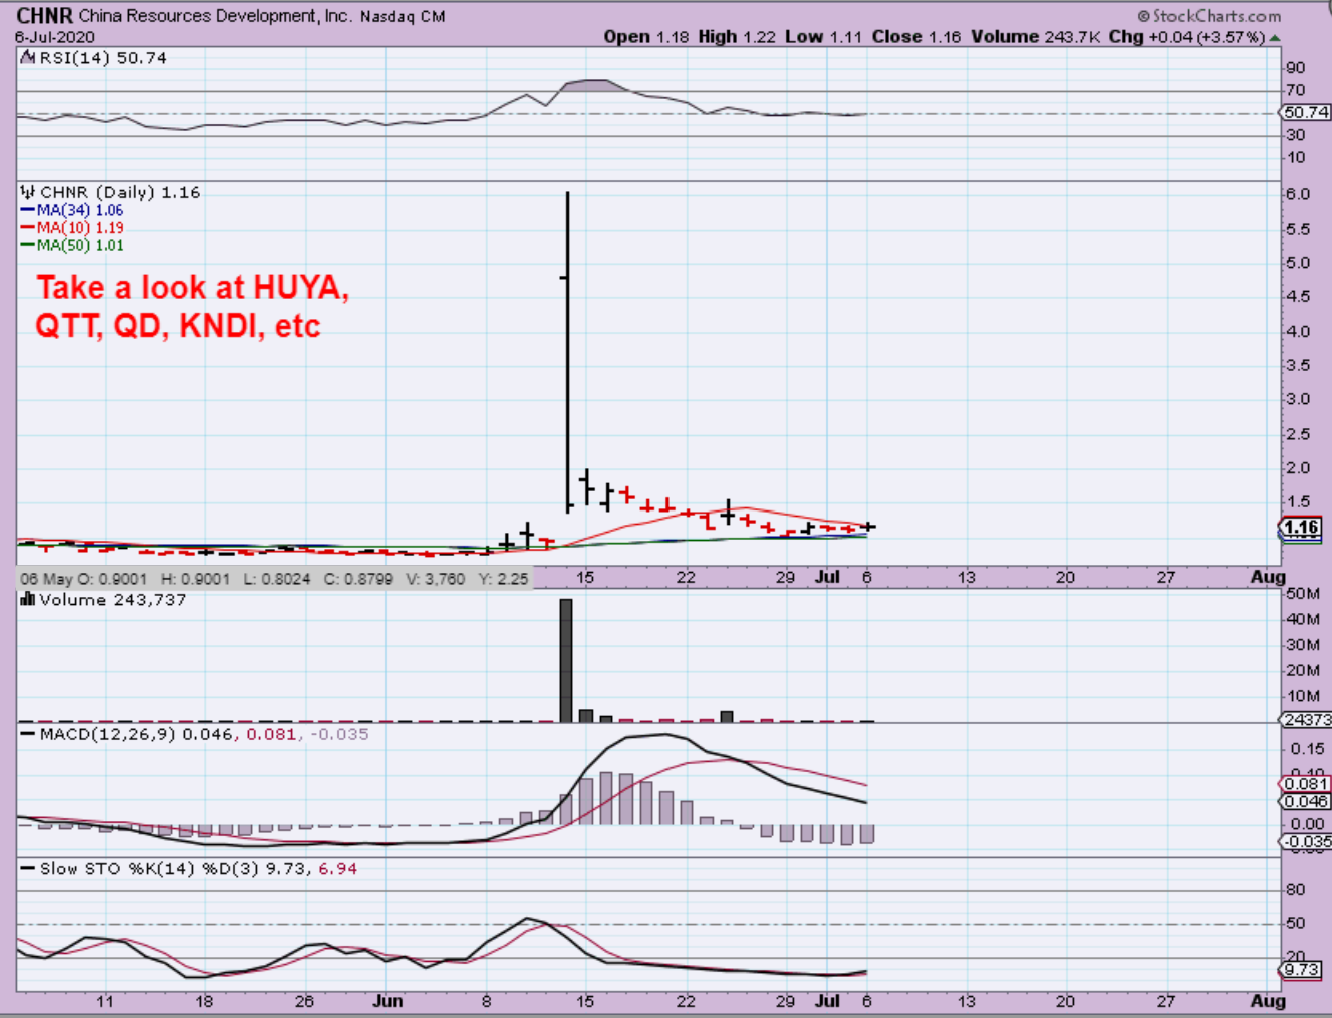
CHNR Popped Big in June, and now it is riding the 50sma. If you now take a look at the charts of the ones mentioned on this chart, you’ll see the progress that some bases are making as they move to recovery. As for CHNR? These can move big for the day trader or short term trader.
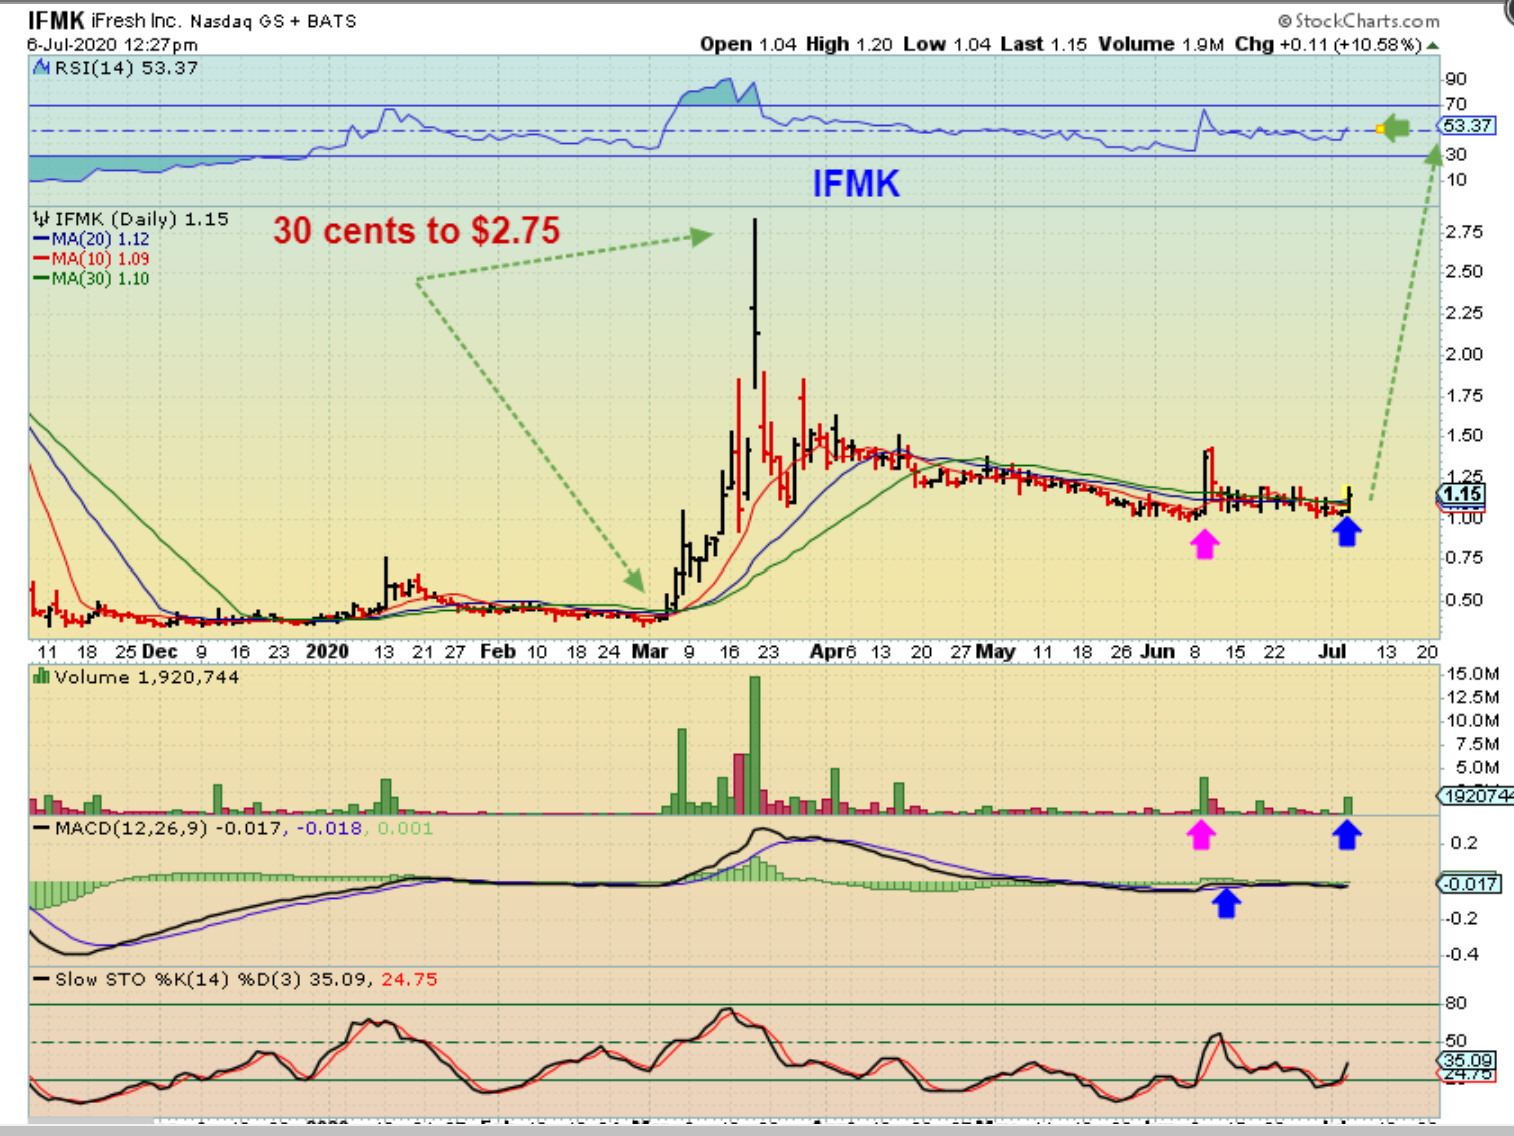
IFMK – They deliver groceries and are benefiting from the Covid Virus, since the elderly and others may prefer to just stay home. This has big upside potential, and I bought it around $1.10-$1.13 & Grabbed this chart. Unfortunately it moved up a lot higher as I drew this up and into the close ( Its at $1.28 as of the close). If it pulls back, It could be a good buy. The last POP pulled back, so this goes on a watch list for many trades. I own it, so I’ll keep an eye on it.
.
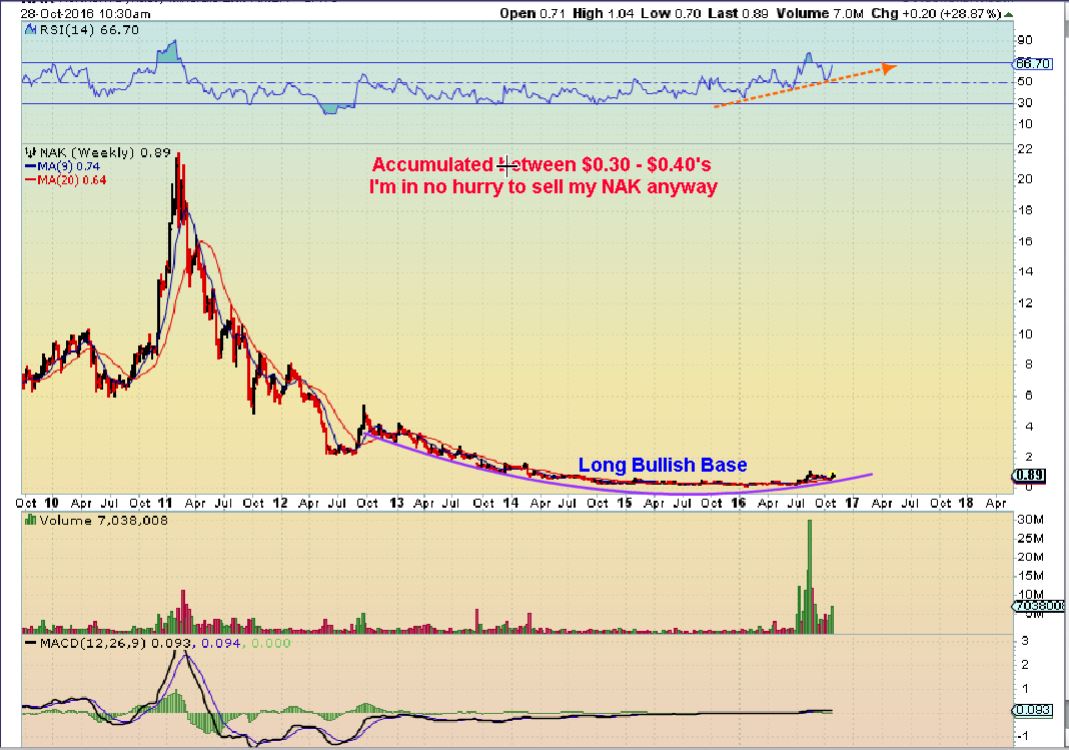
2016 NAK – I have always loved these Bases for the huge potential. I Remember when we bought NAK again and again when it was basing 🙂 It ran to $3+.