Thursday July 9th – Still Climbing
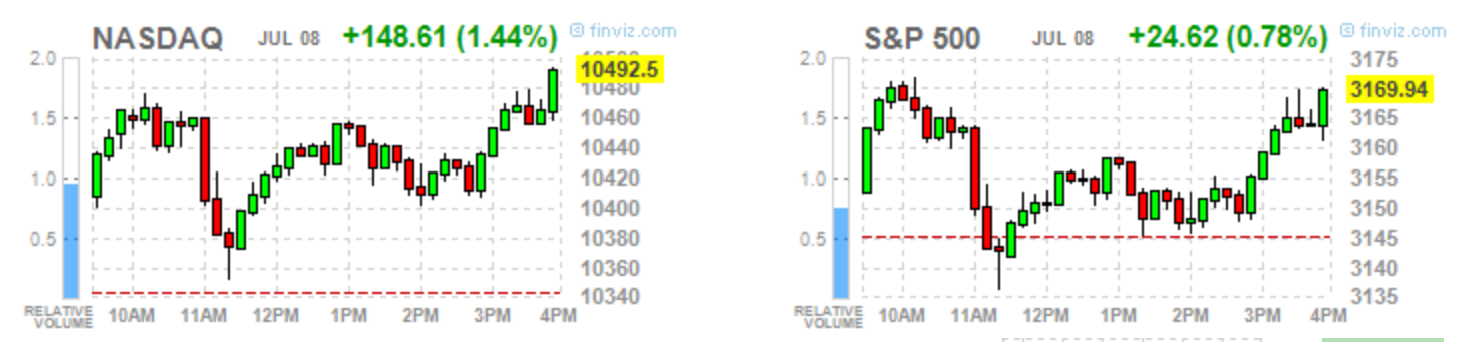
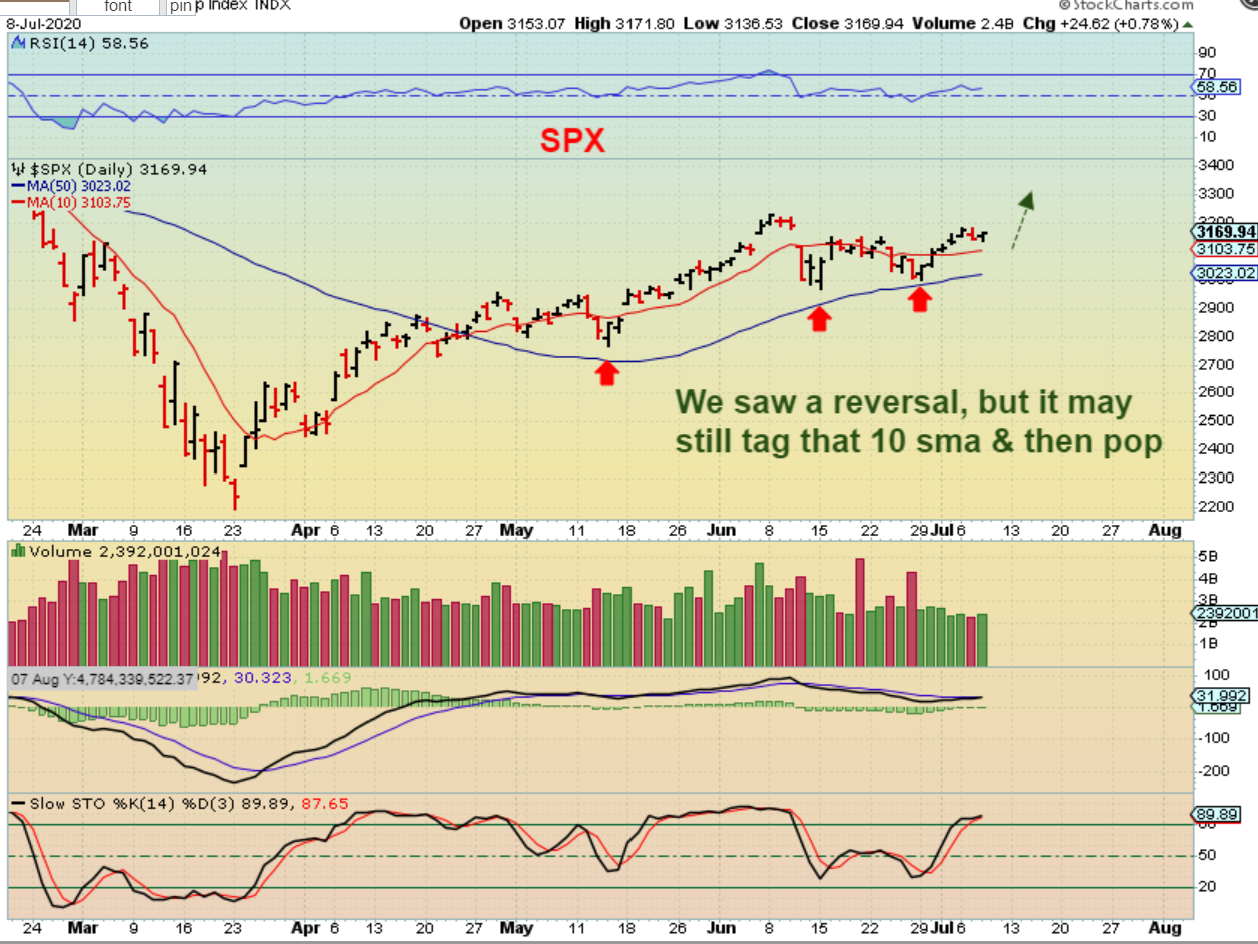
INTRADAY CHART – The SPX AND NASDAQ Dropped sharply in the morning on Wednesday, but reversed higher into the close. It looked like this intraday, so…
SPX -So we had a reversal above the 10sma ( I was expecting a tag of the 10sma, but certainly didnt recommend selling for such a small dip). So we could drop a bit more or we may just Keep On Climbing. Note: As a 3rd daily cycle, even a L.T. cycle could climb for 8-15 days before peaking and that is 3 weeks.
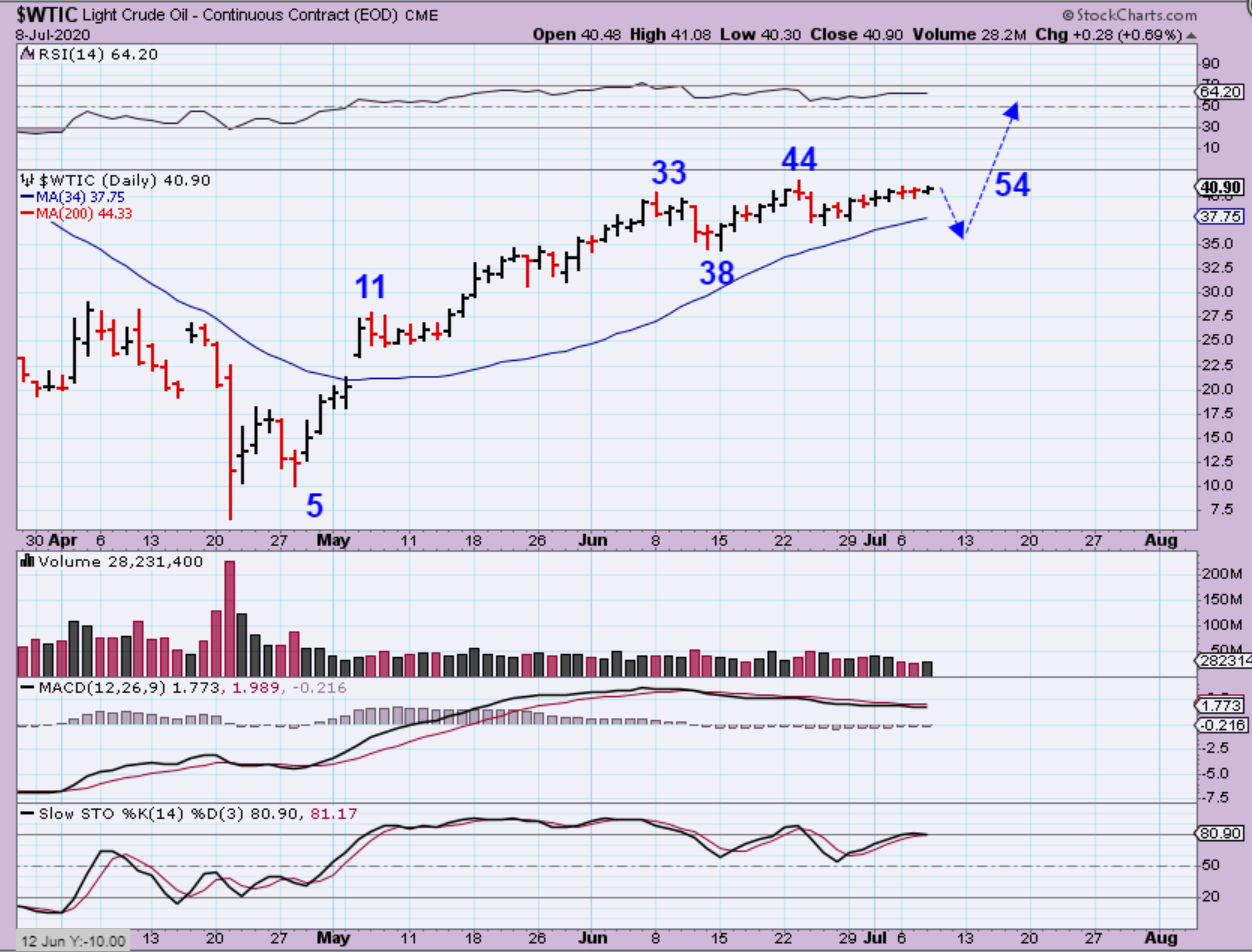
WTIC – I still feel that we did not see a dcl in Oil yet, and Oil stocks seem to be confirming that. If that is true, we would get a quick drop toward that 34 sma, however, the chart remains bullish so this is not short-able i.m.o.
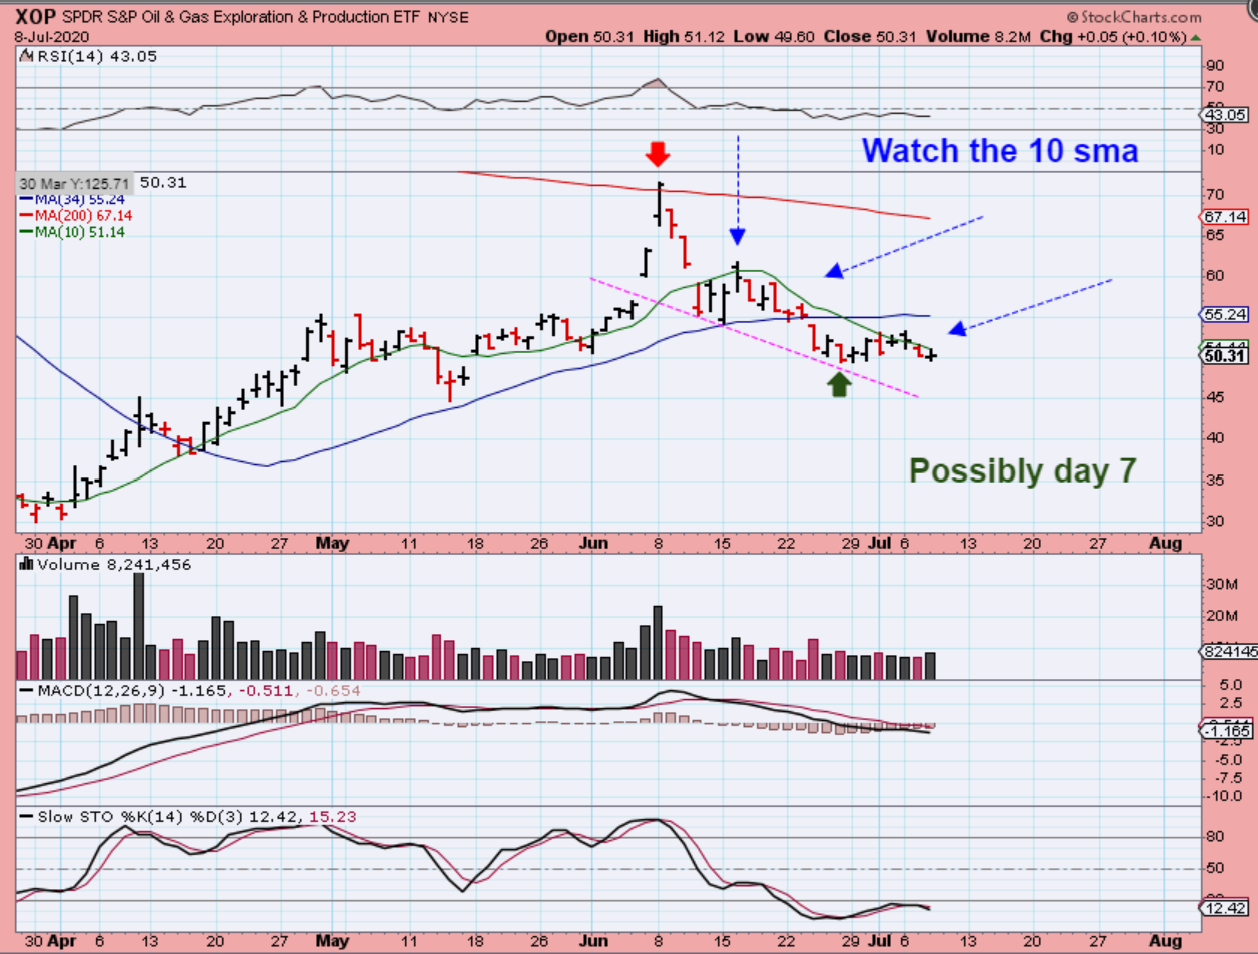
XOP – Did the XOP Bottom with a dcl? Maybe, but it is not confirmed. A break above the 10sma would be bullish, and that 10sma has held down price for the past 4 weeks.
NOTE: For some of my more active traders(Swing traders that like to buy & hold for more than a week ) Oil stocks ( APA, DNR, CPE, OAS, CLB, BE, CVI, etc may become a nice buy to switch to when Miners finish running their bullish course).
.
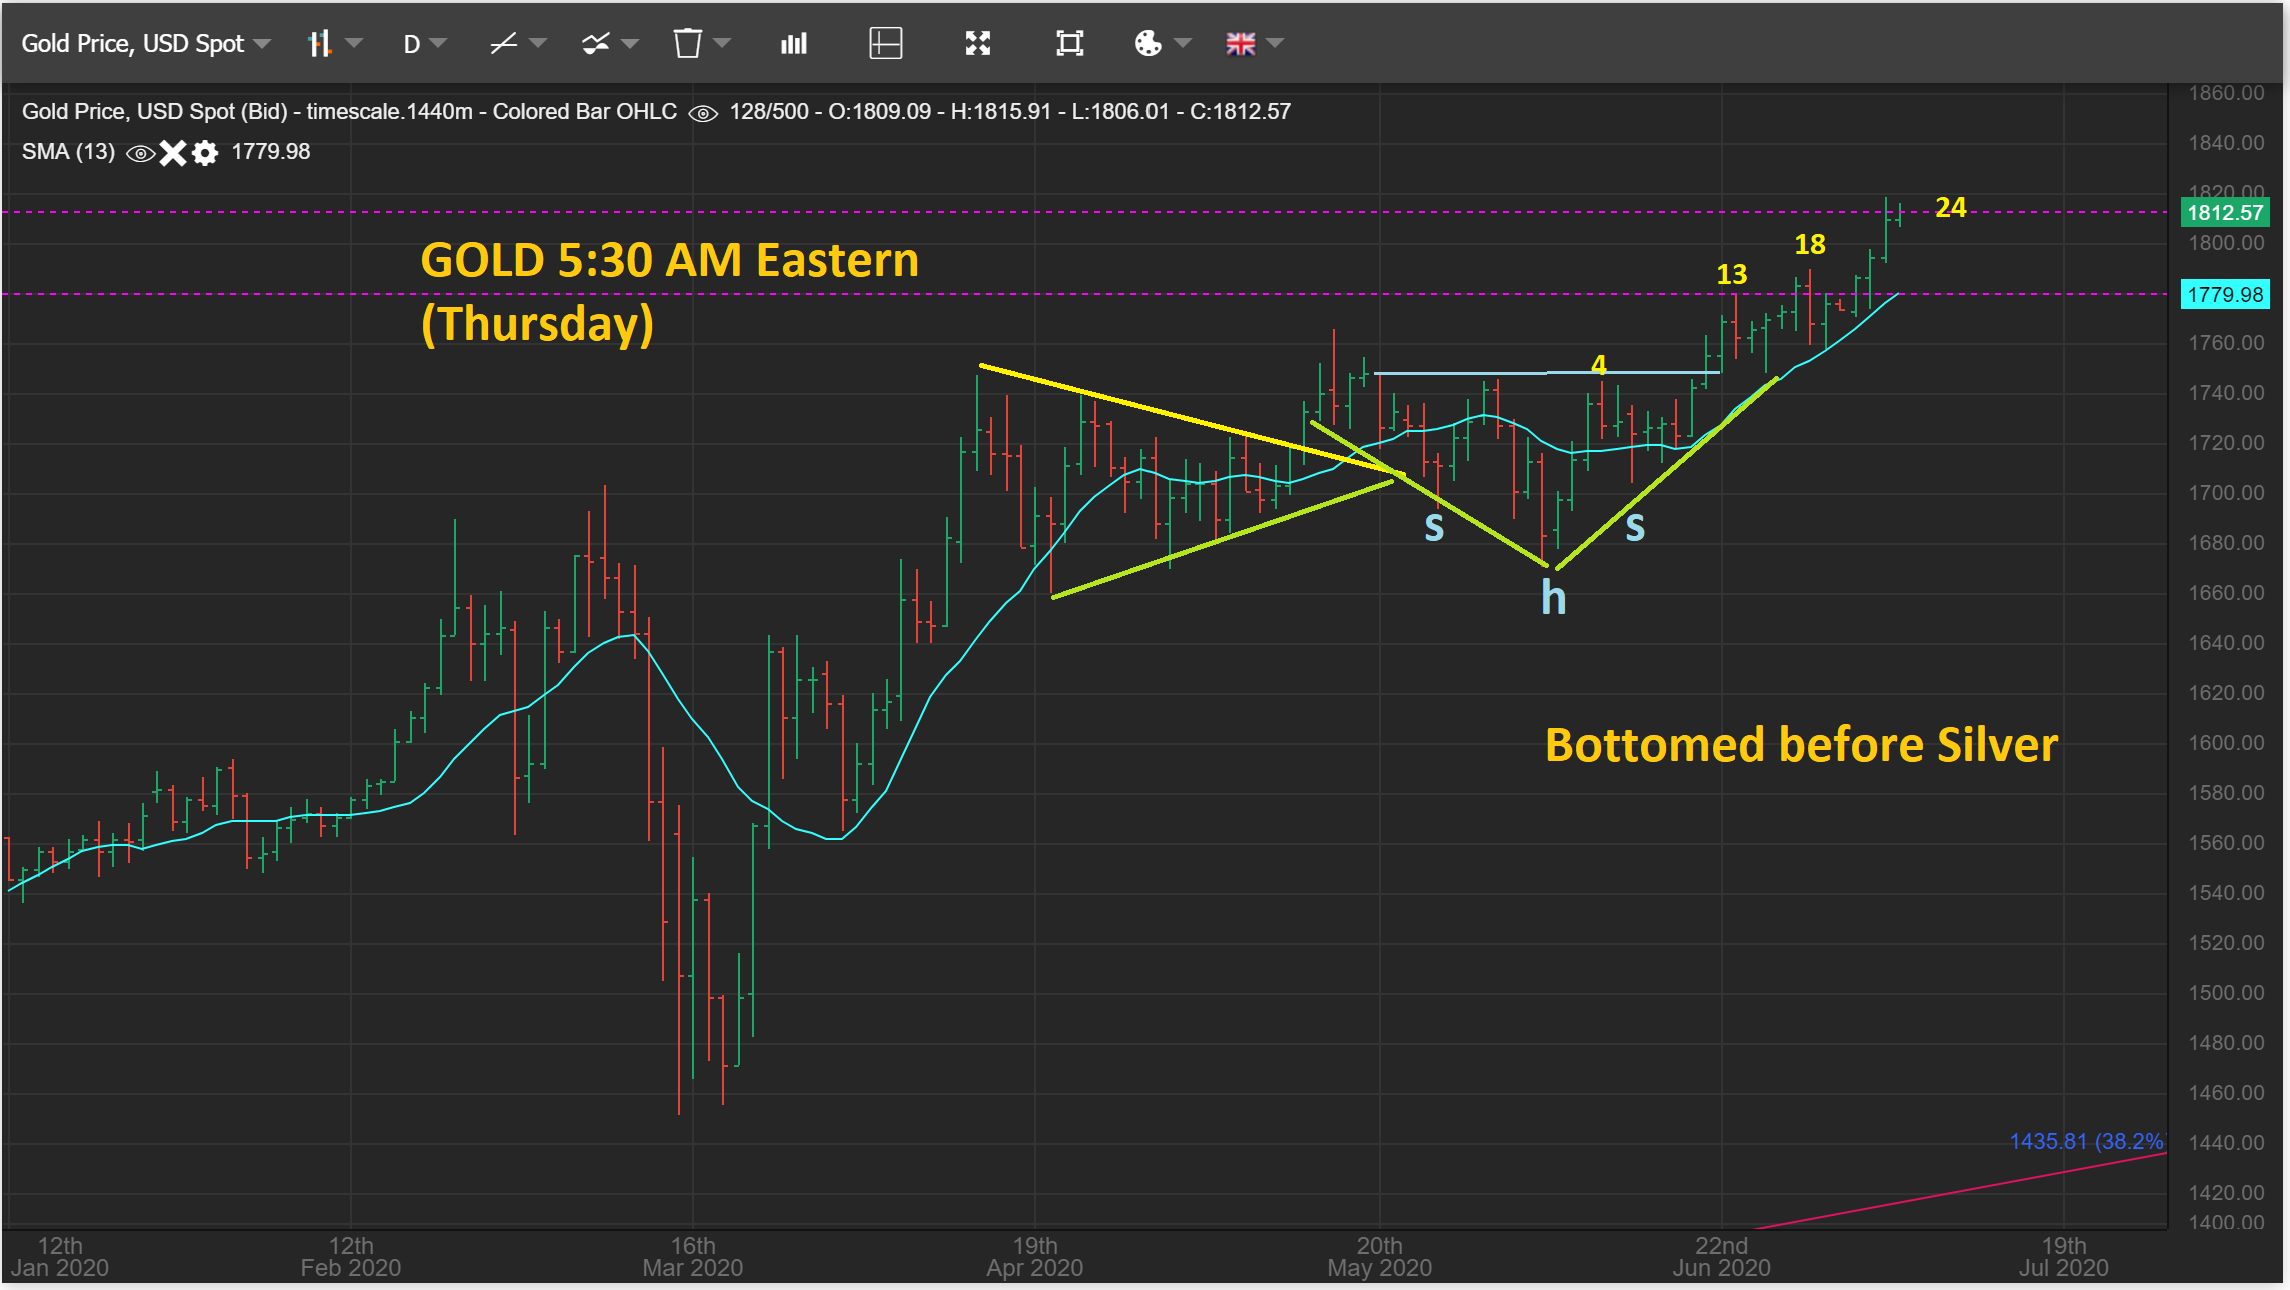
GOLD this morning still looks great . I see us as being at day 24 above the recent lowest low, so this may begin to slow down next week. please read the chart.
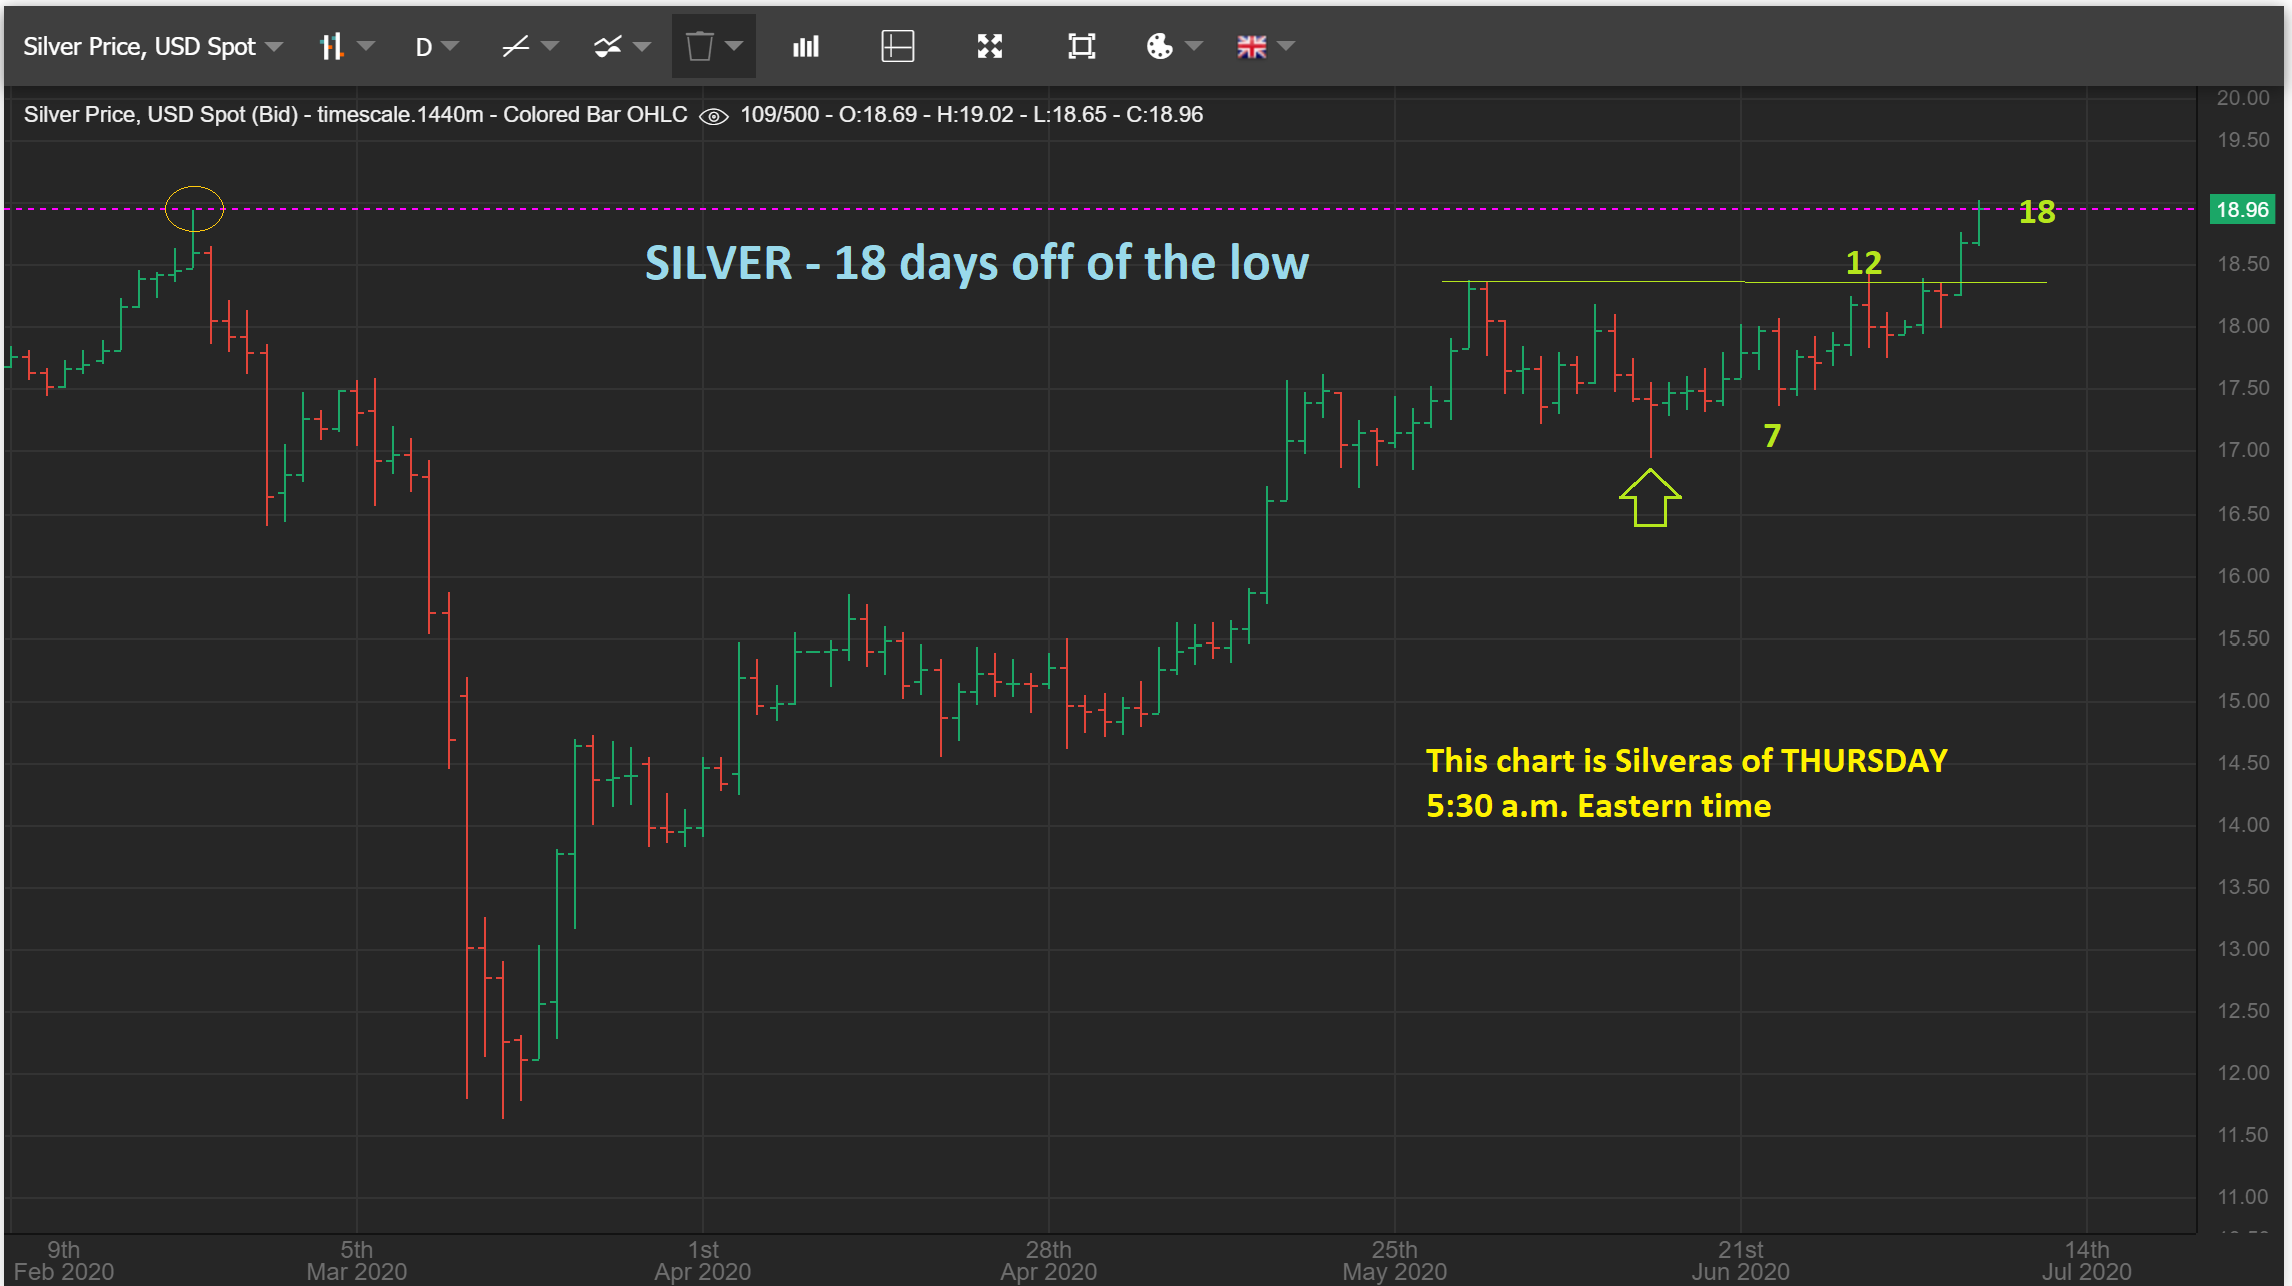
SILVER also looking bullish this morning, and notice that Silver bottomed 1 week AFTER Gold. Please read the chart.
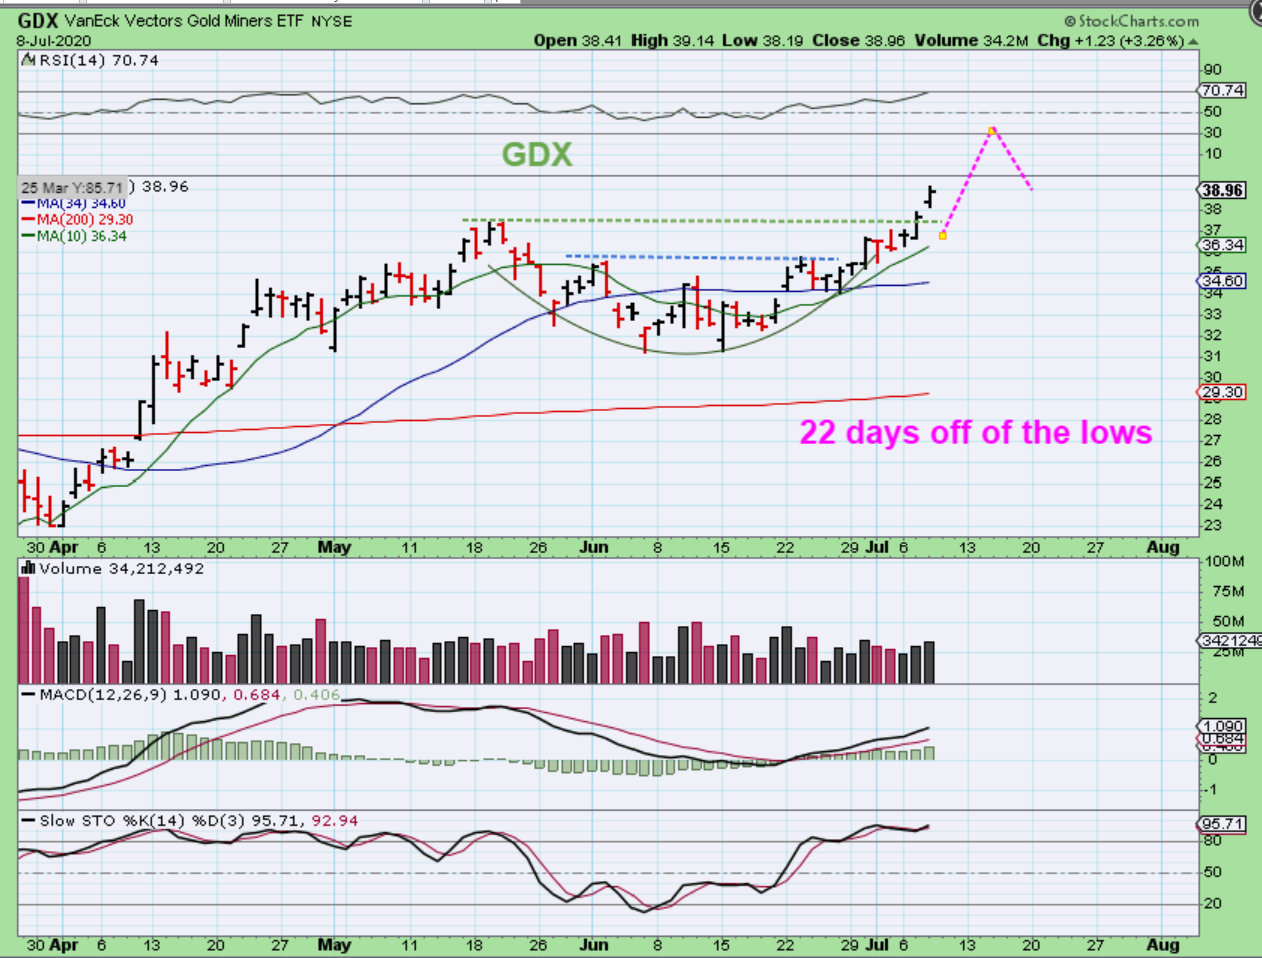
GDX added another 3.26% on Thursday. It is 22 days off of the lows, and in the past I have seen 28 days and even more in hot times when they broke from a consolidation and had a melt up, but …
.
Note: Unfortunately 2 people have written to me and said that they sold last Wednesday ( at the blue line) and wondered if I could get them back in now. 🙁 THAT IS A TOUGH ONE FOR ME NOW, at this point on day 23, especially if this gaps open on day 23 today. I’m going to try to help you at the end of the report, but my analysis consists of trying to offer a low risk entry with minimal downside so that you can use a stop, so this gets tricky now. You may need to be willing to buy individual Miners mentioned at the end of the report. Also an added risk.
Also : This was forming a cup, and has now broken out. On day 23 we can run to day 28-30, or we can back test at anytime too, so the risk has increased. That said, Yes: You CAN buy this as a break out & take your chances for a few days of gains, maybe you’ll even get 5 more days higher, but you also may only see 1 or 2 days up and then 3 days down to a back test too. This late in a cycle, we just don’t know for sure. Buy and Stay Frosty? 🙂
.
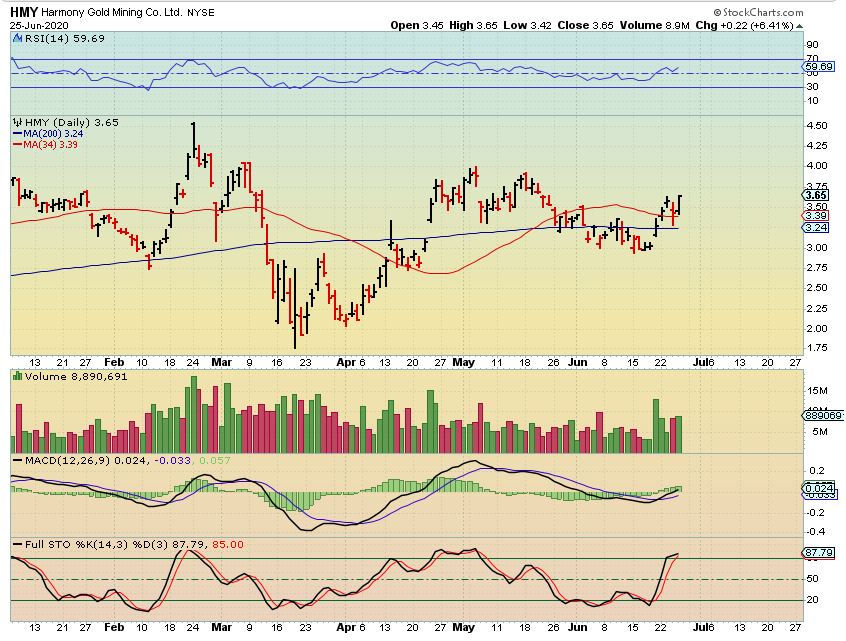
HMY WAS MENTIONED AS A BUY 2 weeks ago, SINCE IT WAS LAGGING AFRICAN MINERS ( See DRD, AU, GFI, etc)…
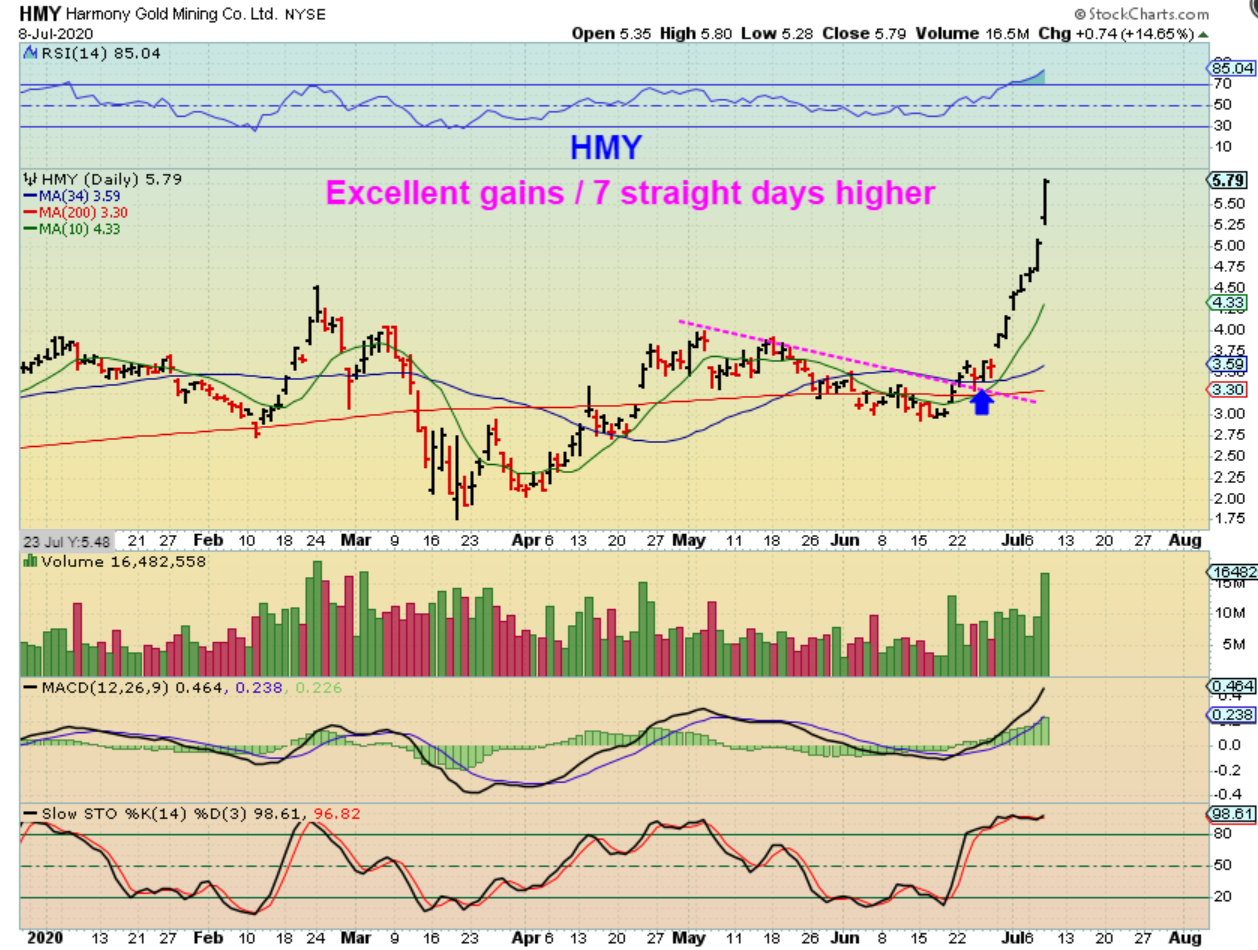
HMY – WE ARE UP ALMOST 70%!! Congrats if you took this trade. 7 days in a row higher. I’d look for a lagger with a proper set up and you may do well if it plays catch up.
.
Things really have been trading up very well in many areas of the markets. I’m trying to raise stops on miners ( I use mental stops) and allow the markets to take me out rather than guess when this melt up will end. I will address Miners below too. Stay Frosty my friends, and have a great Thursday !
.
~ALEX
.
CDE – Like HMY, you could say that CDE is lagging. It just broke the 200sma again & is still not overly extended, so that’s good, you can buy with a stop. Also remember, SILVER BOTTOMED 1 WEEK AFTER GOLD. Maybe Gold tops for 3-5 days as Silver extends, we don’t know.
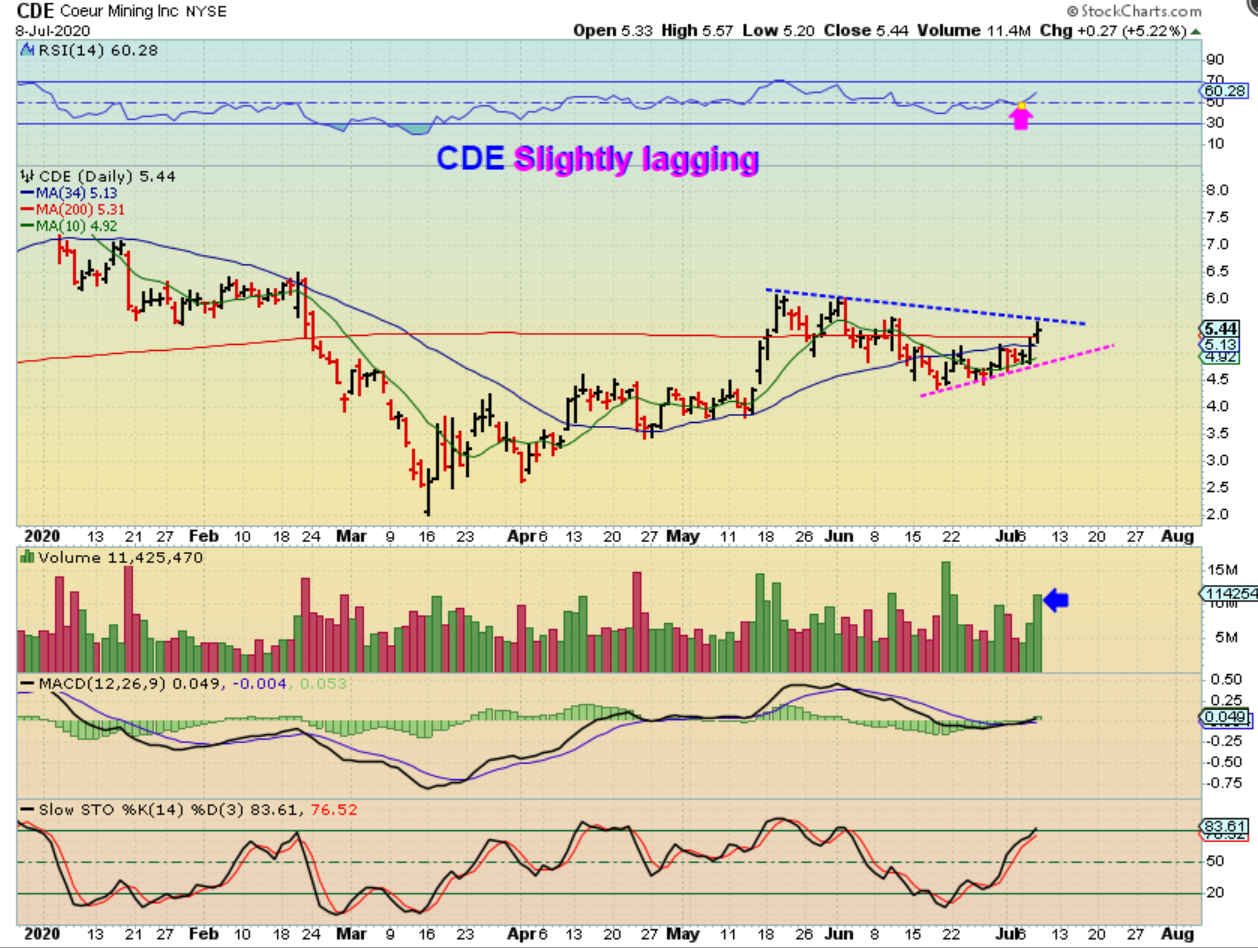
Again, SILVER BOTTOMED 1 WEEK AFTER GOLD. Maybe Gold tops for 3-5 days as Silver extends for an extra week? We don’t know.
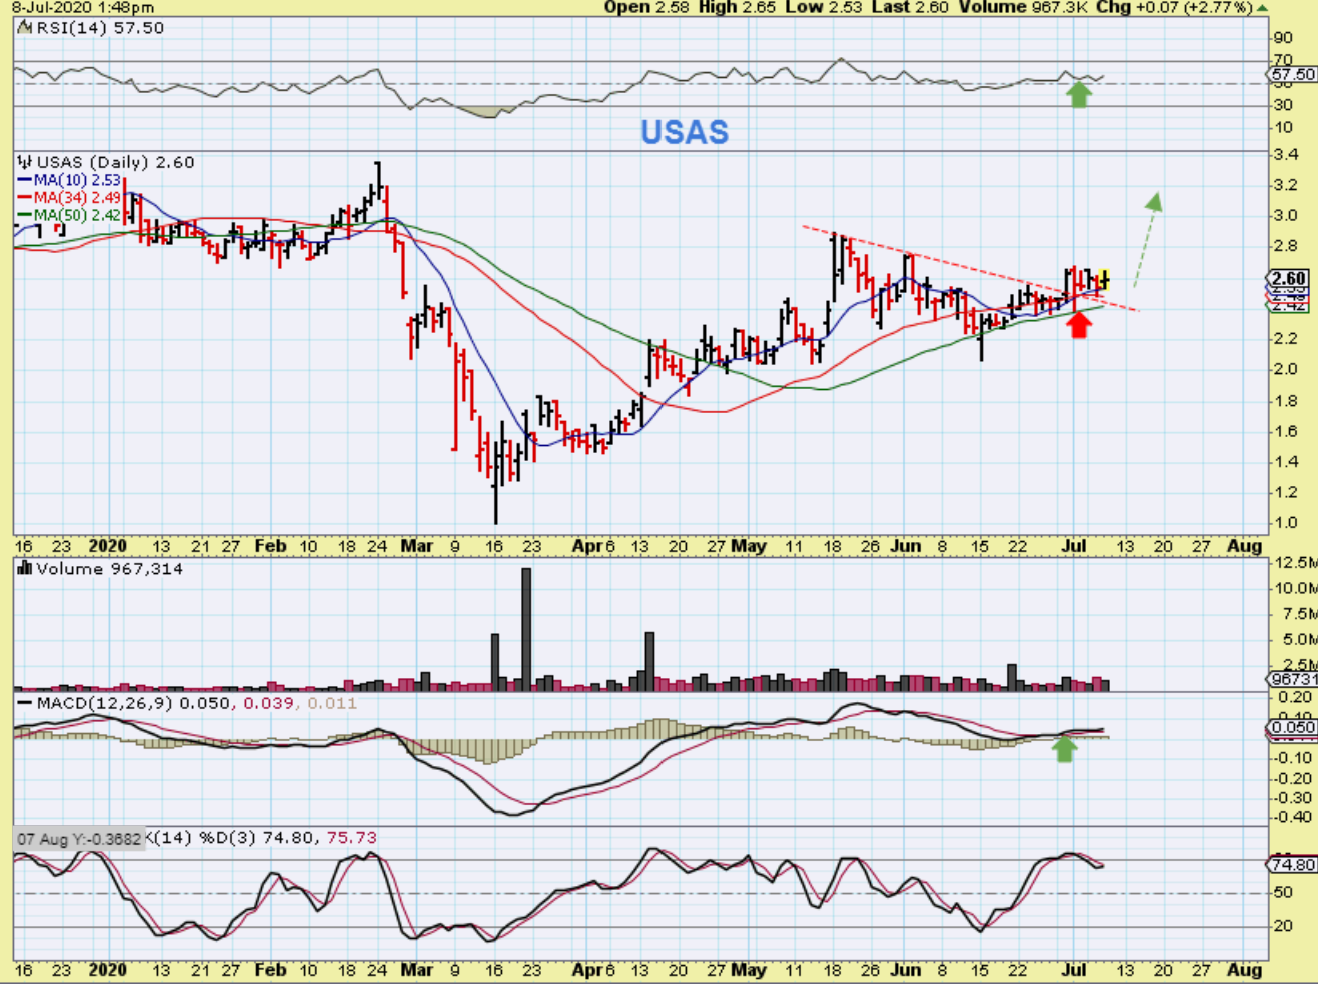
USAS is another lagger with great potential. As a trader, I would even consider selling all or some of my HMY and putting it in CDE, AG, or USAS if I see these start to break higher. Please note …
.
A quick pop to $3.40 is 30% Gains!! THAT IS A GREAT TRADE!
.
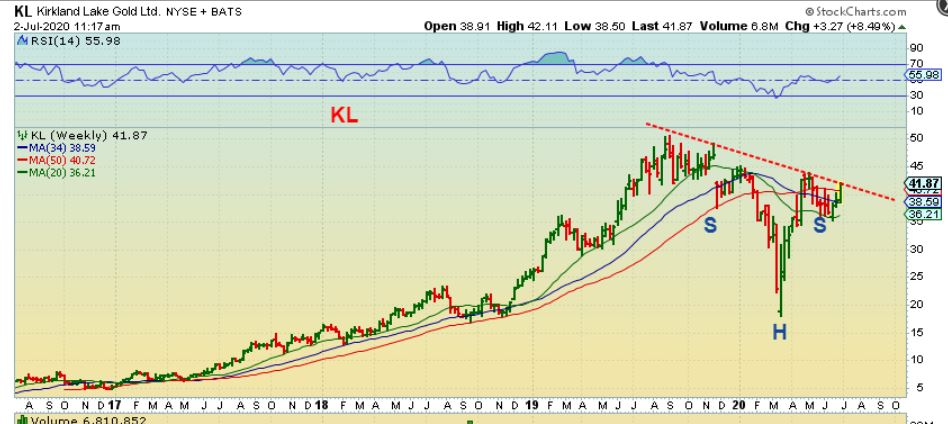
KL – On July 2 I posted this chart of KL near $40. A break out would be a buy because this is a break of a 1 year consolidation / downtrend. A resumption of KLs uptrend.
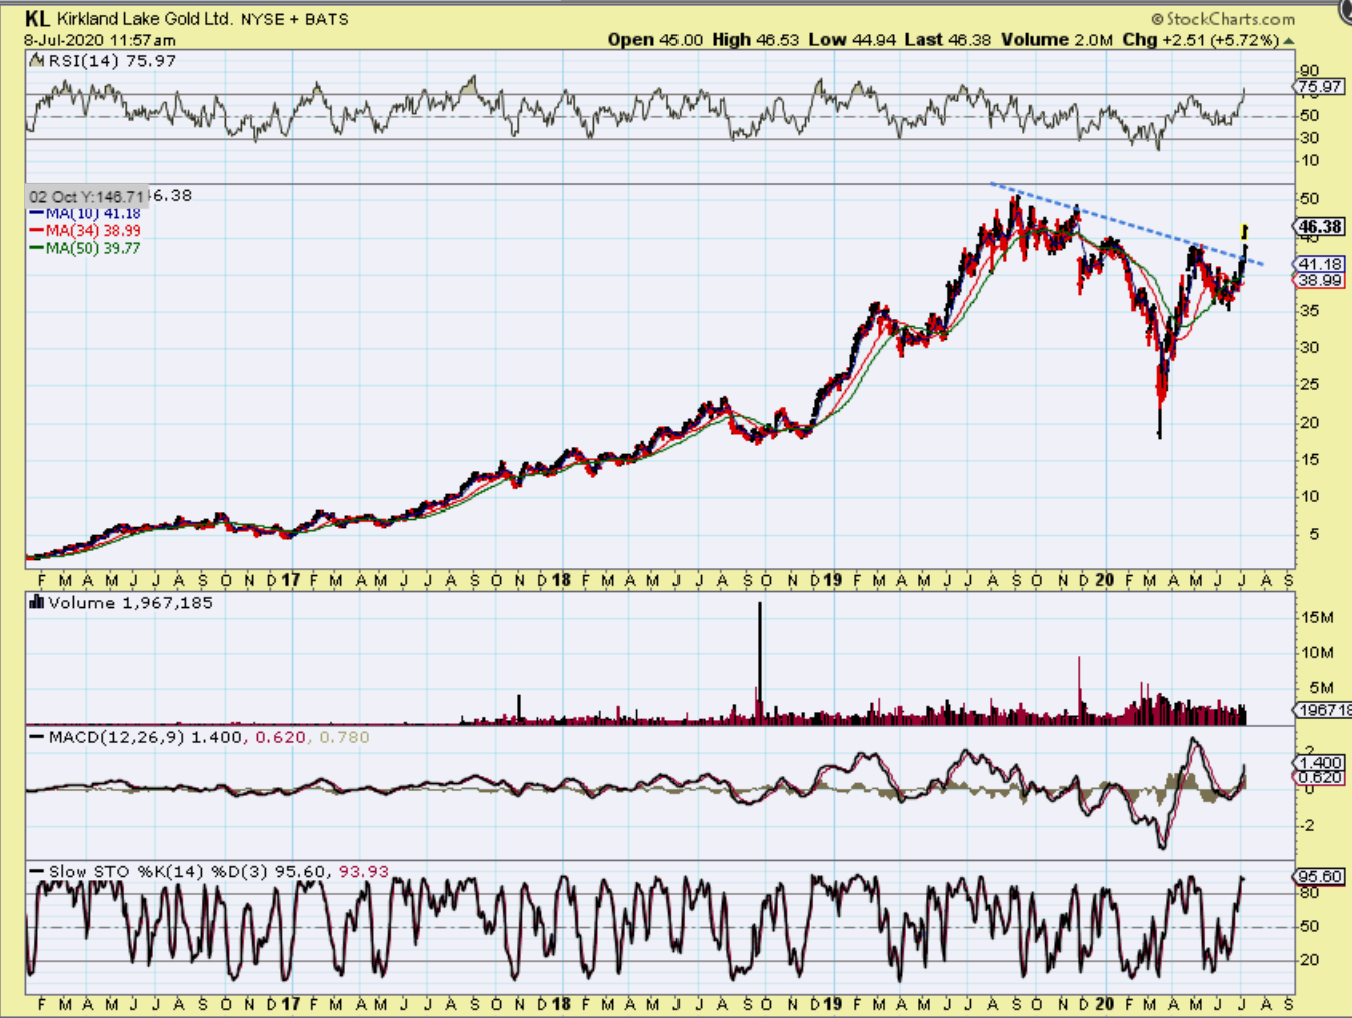
KL – This was KL Wednesday morning and it Closed even higher at $47 .53. Look at the BULL RUN that KL put in place. It could run to $100 over time. If this is a giant inverse H&S, it wants to run to $60+ right now. Another nice trade.
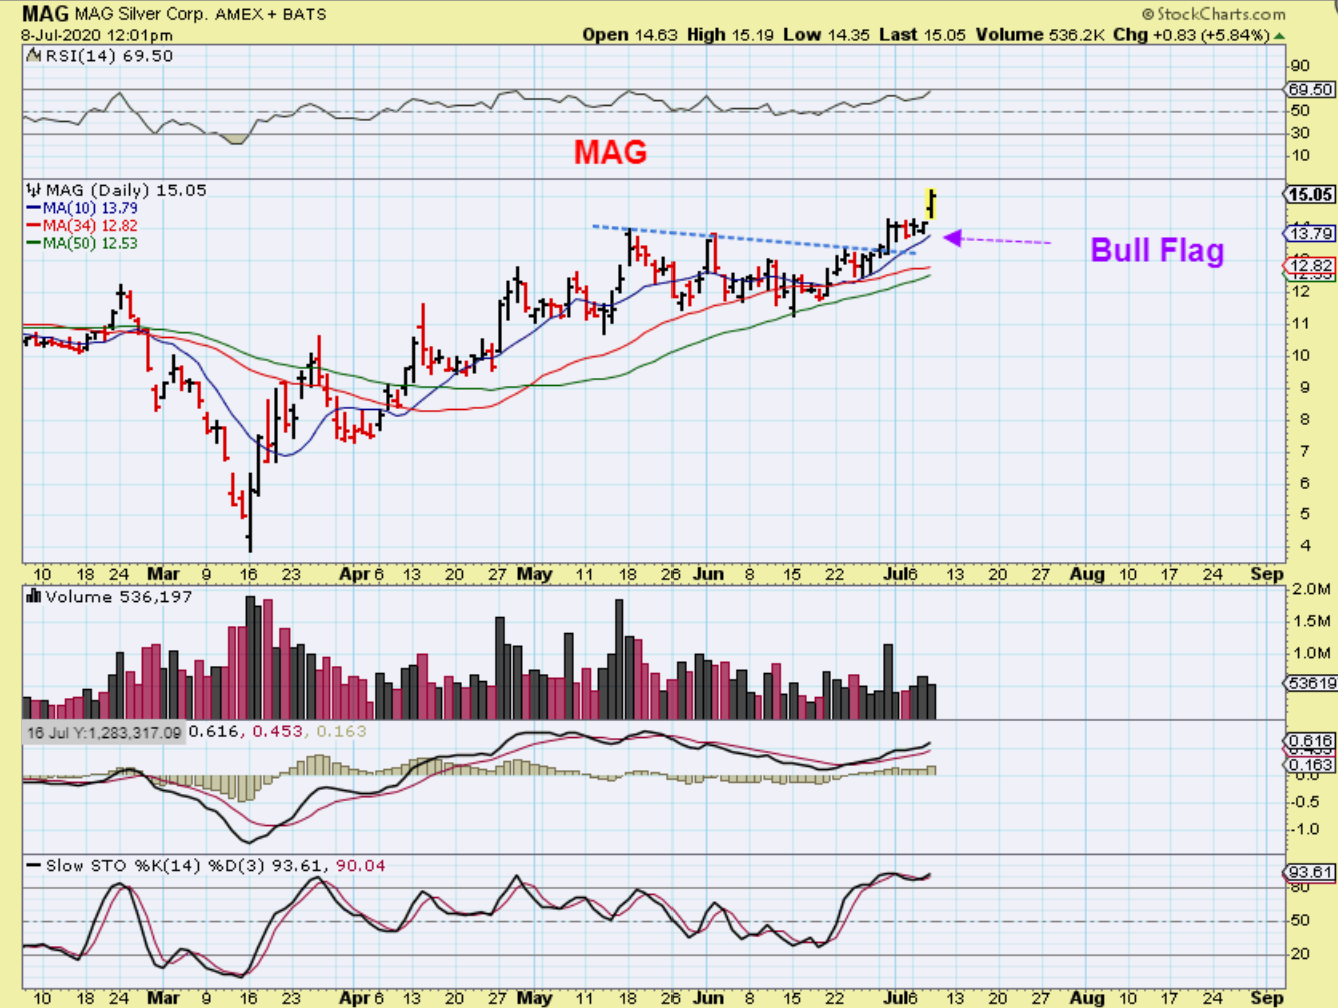
MAG lagged a little bit, but it broke from a small Bull Flag yesterday. MAG is also a former WINNER that has recharged and looks great . By the way , $4 to $15 since March? WOW.
Look for a lagger, especially Silver, and you can buy with a fairly tight stop.
.
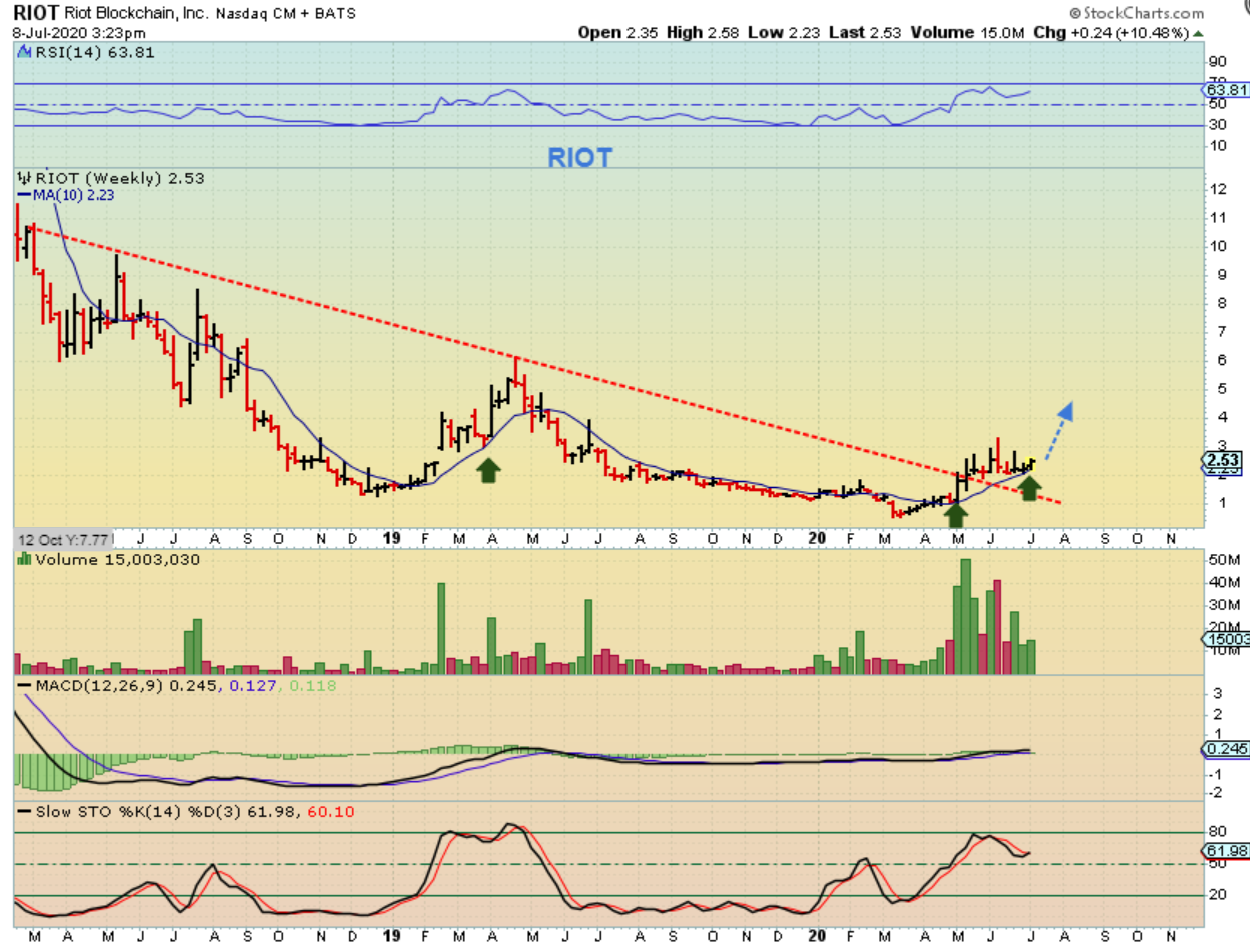
RIOT DAILY– Riot ran from 50 cents to $3.30, and then pulled back and consolidated those massive gains. It looks ready to run again, so I bought it yesterday. It looks to be breaking a down trend, it is oversold, and…
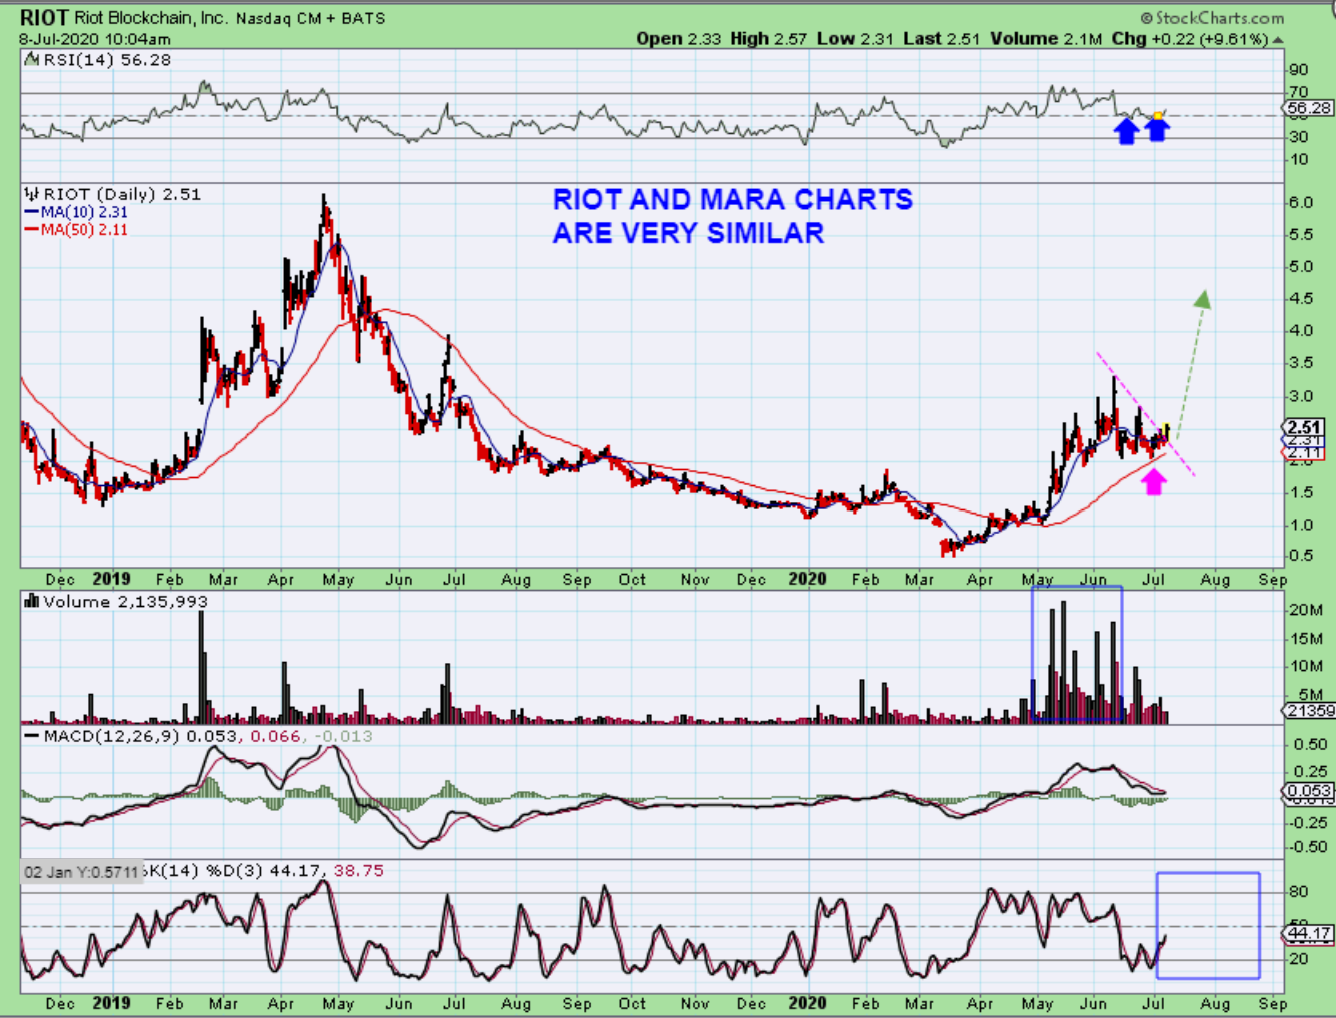
RIOT WKLY – It reversed right off of the weekly 10ma. THAT is often a very bullish sign. Volume has been strong.
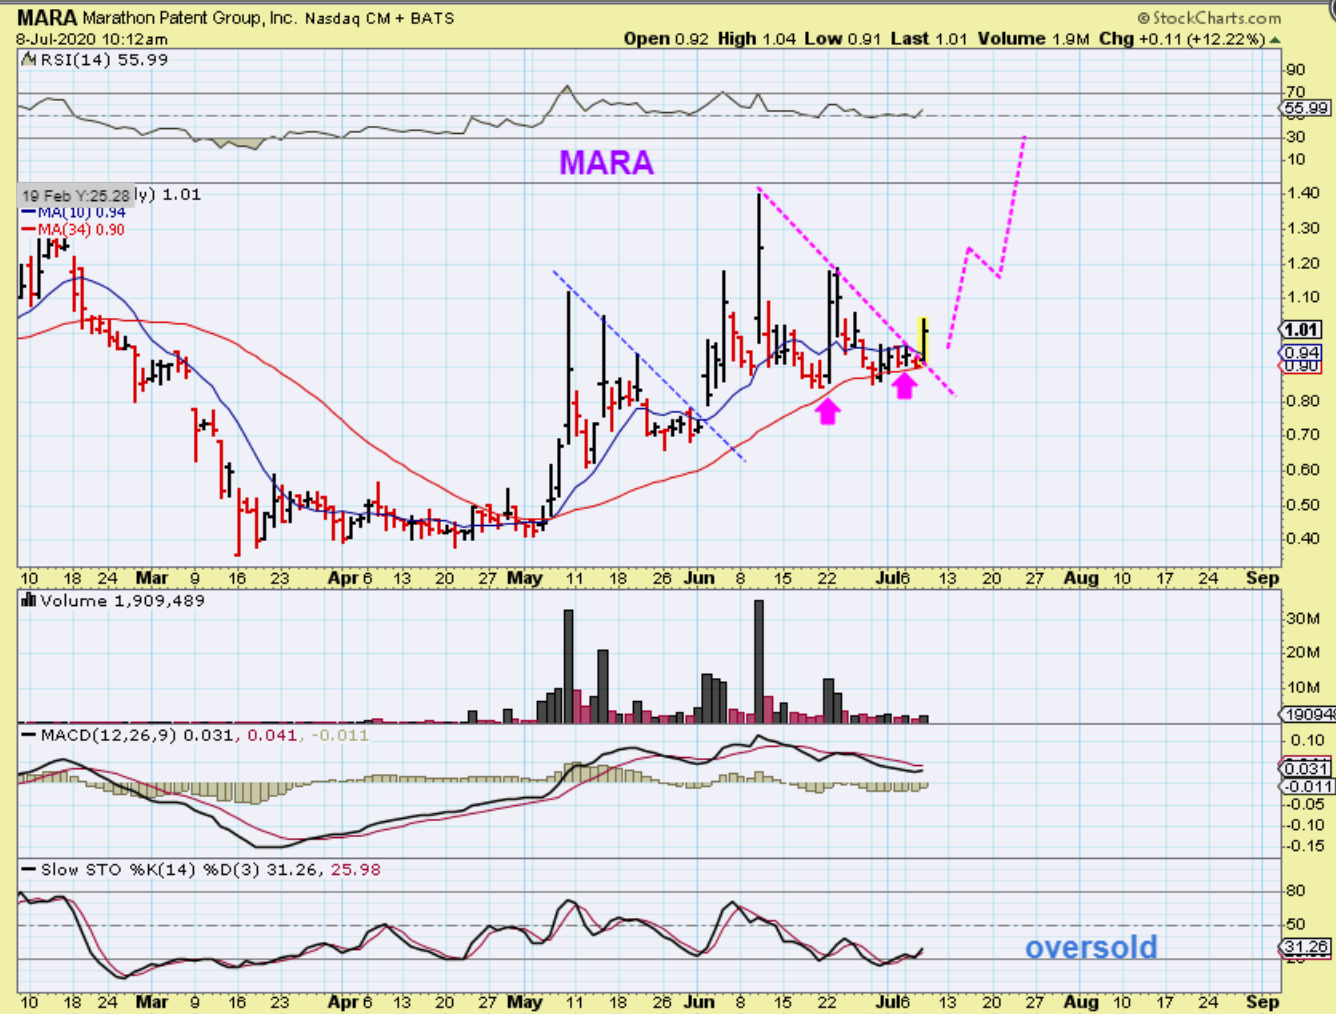
MARA looks very much like RIOT. It also broke out from a down trend and may be ready to push higher too. It is oversold.
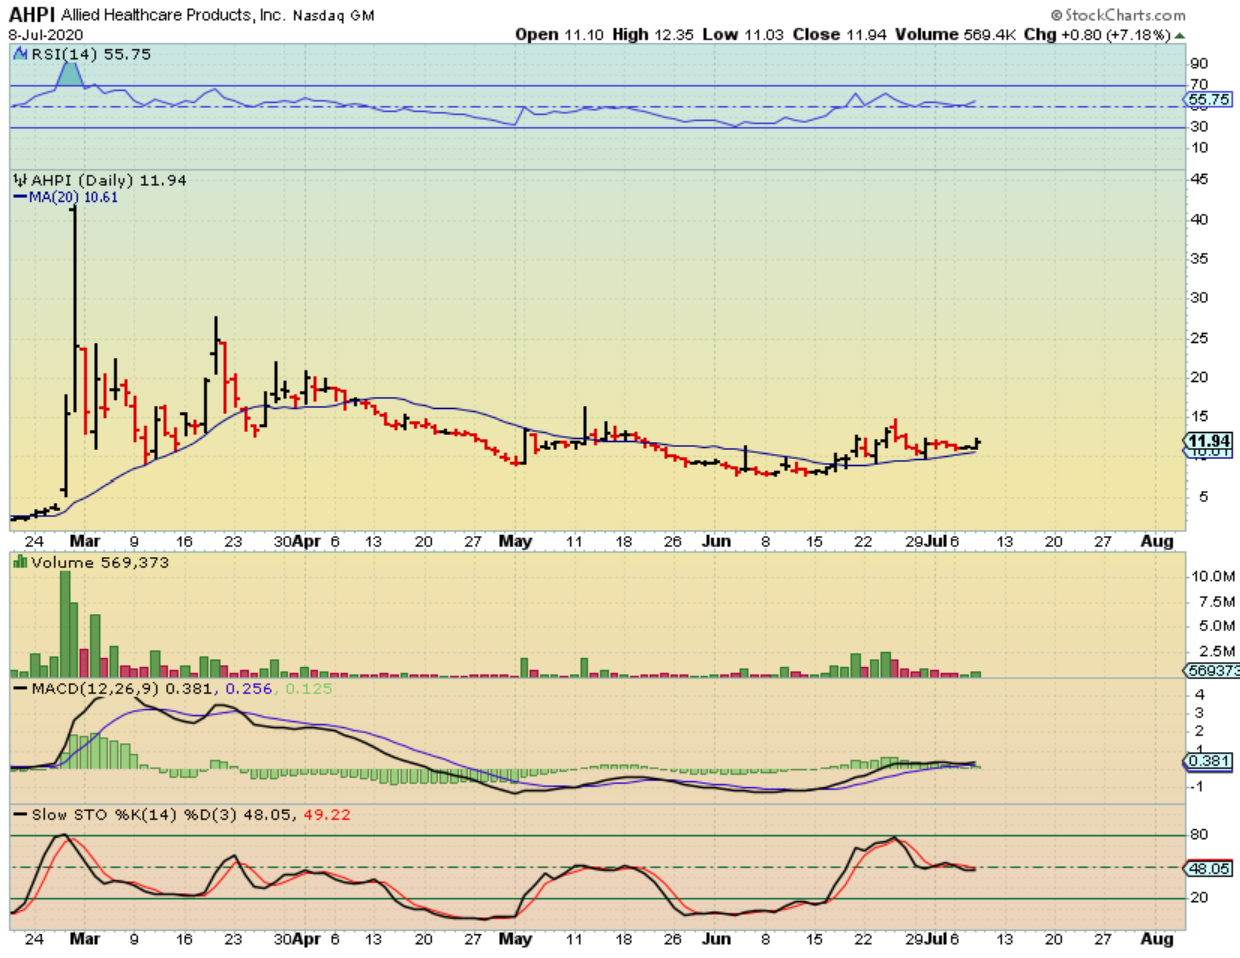
AHPI – This is the one that I have warned moves VERY QUICKLY. I bought in near $7.50-$8 and sold 1/2 at the $15 reversal area. I re-bought that yesterday at $11.50 as this reverses near the 20sma support. Again, this is best for traders with a lot of experience, it moves swiftly both UP & DOWN, but they design, manufacture, and sell ‘respirators’ and it leaped to $40 when Covid started to really spread. I feel that it can at least run to $20 or $30. Look at how it bounces at the 20sma. A quick run to $20 is not out of the question.
“What happened to CHFS? Are you dissapointed?”. “Not at all” 🙂 …
.
CHFS gapped open and dropped. That does NOT mean that it finished its move higher. Look at the 20 sma on CHFS. This CAN even drop lower to shake out holders & then run higher. There are 2 things on my mind here:
#1. CHF Solutions is doing a live presentation midday Thursday (Today) , and if they say anything exciting about their ‘fluid management’ procedures with the treatment of Covid patients, that could spark a rally. and #2 …
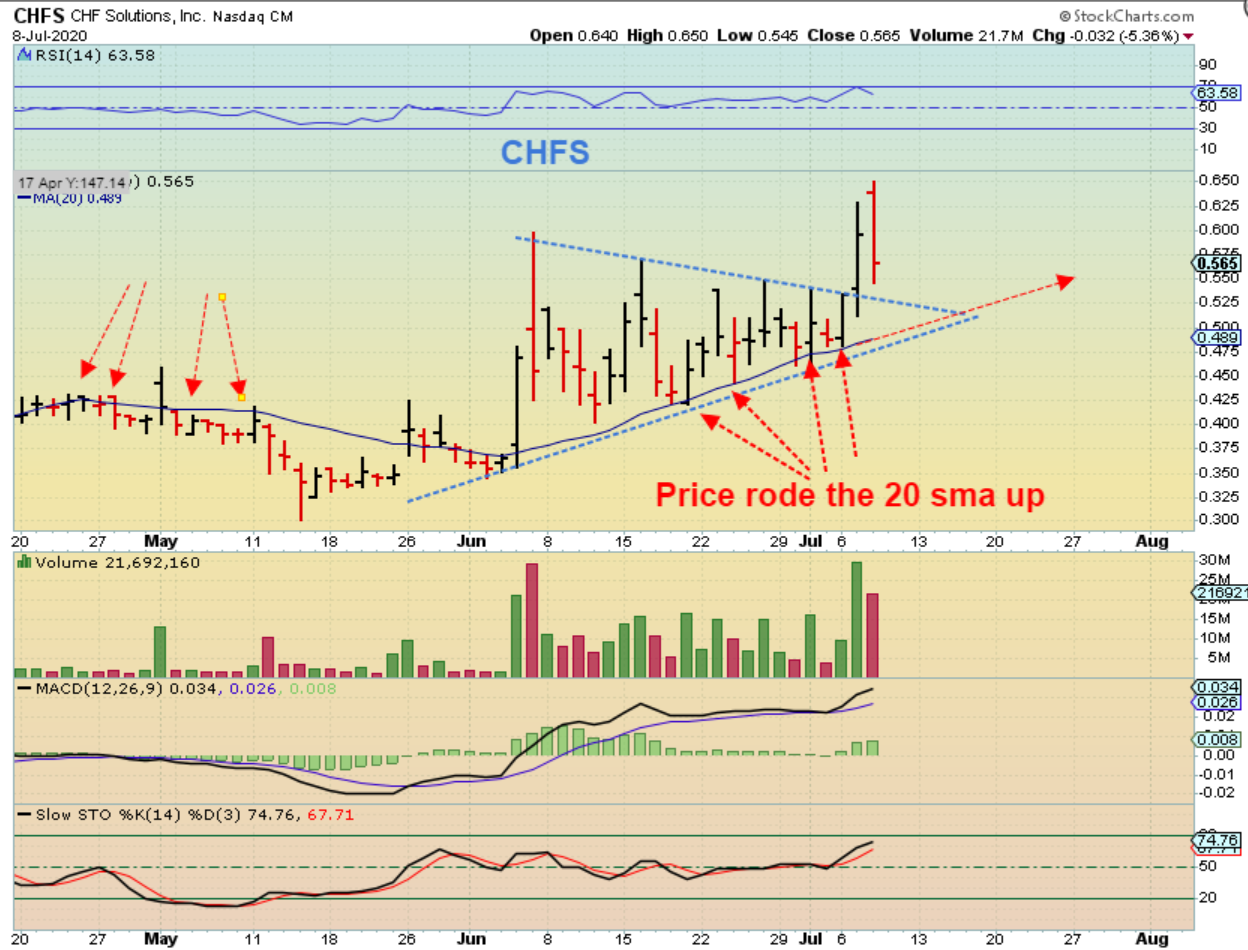
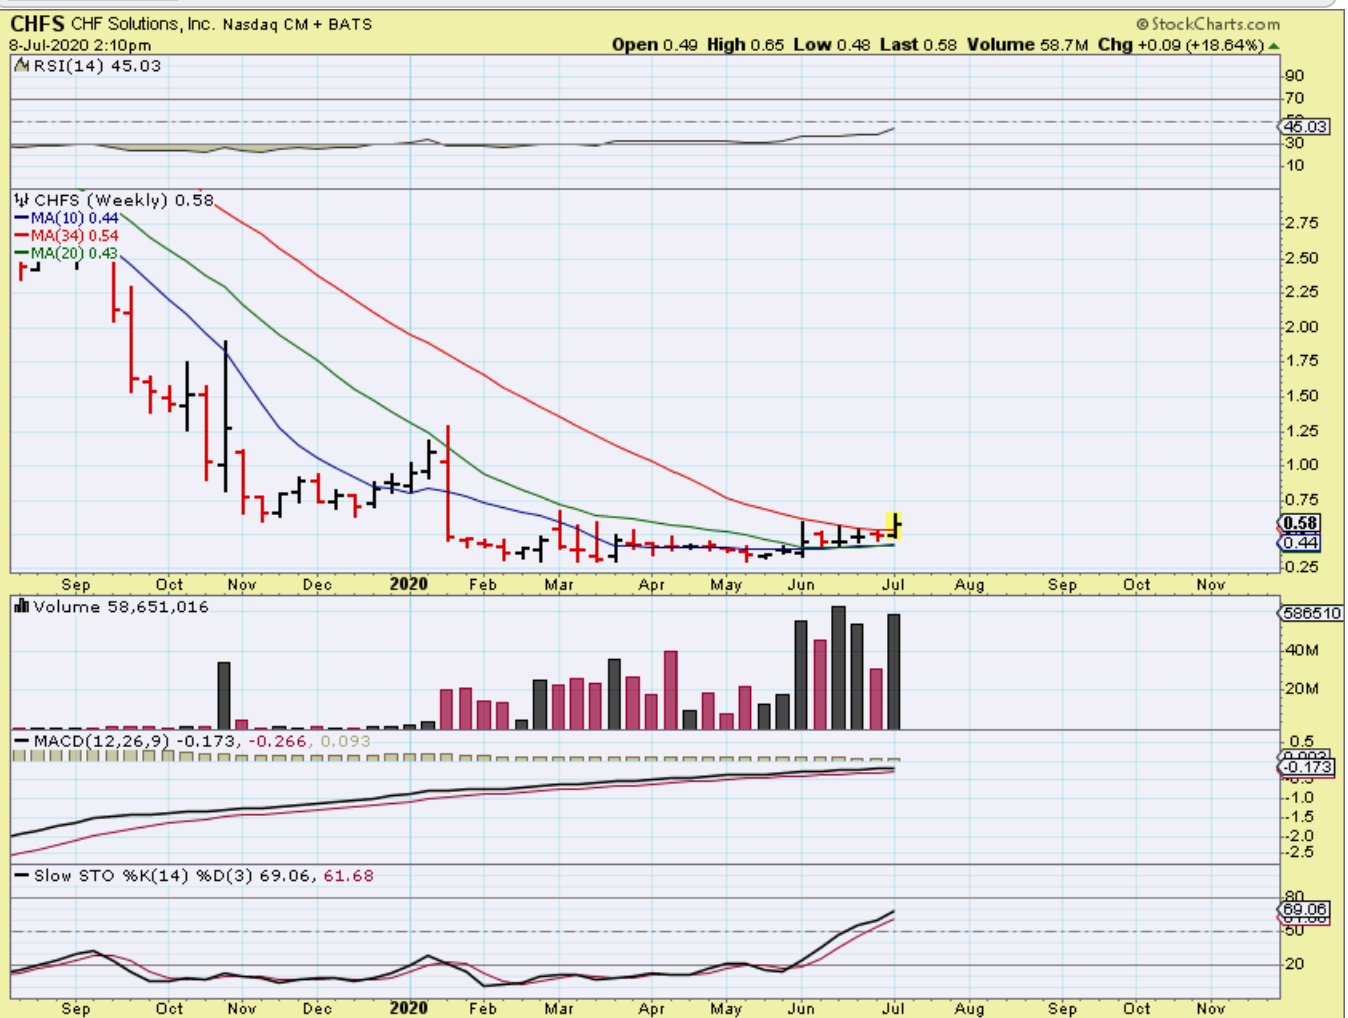
#2 CHFS -We now have a weekly break out from the area that I have been pointing out. If we close here or higher on Friday, this is a weekly break out with massive volume ( only 3 days volume is shown so far) . That can also draw in more buying. I still like CHFS.
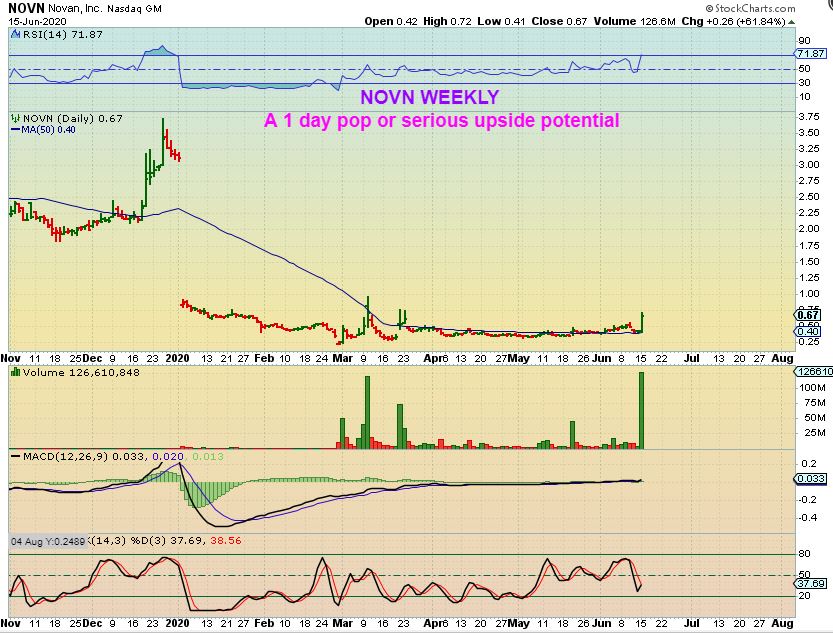
BY REQUEST: NOVN– Yes, I still own it. It is acting similar to the CHFS triangle. Can it drop to the green 50 sma? Yes, but let me also show you what I else I liked about NOVN…
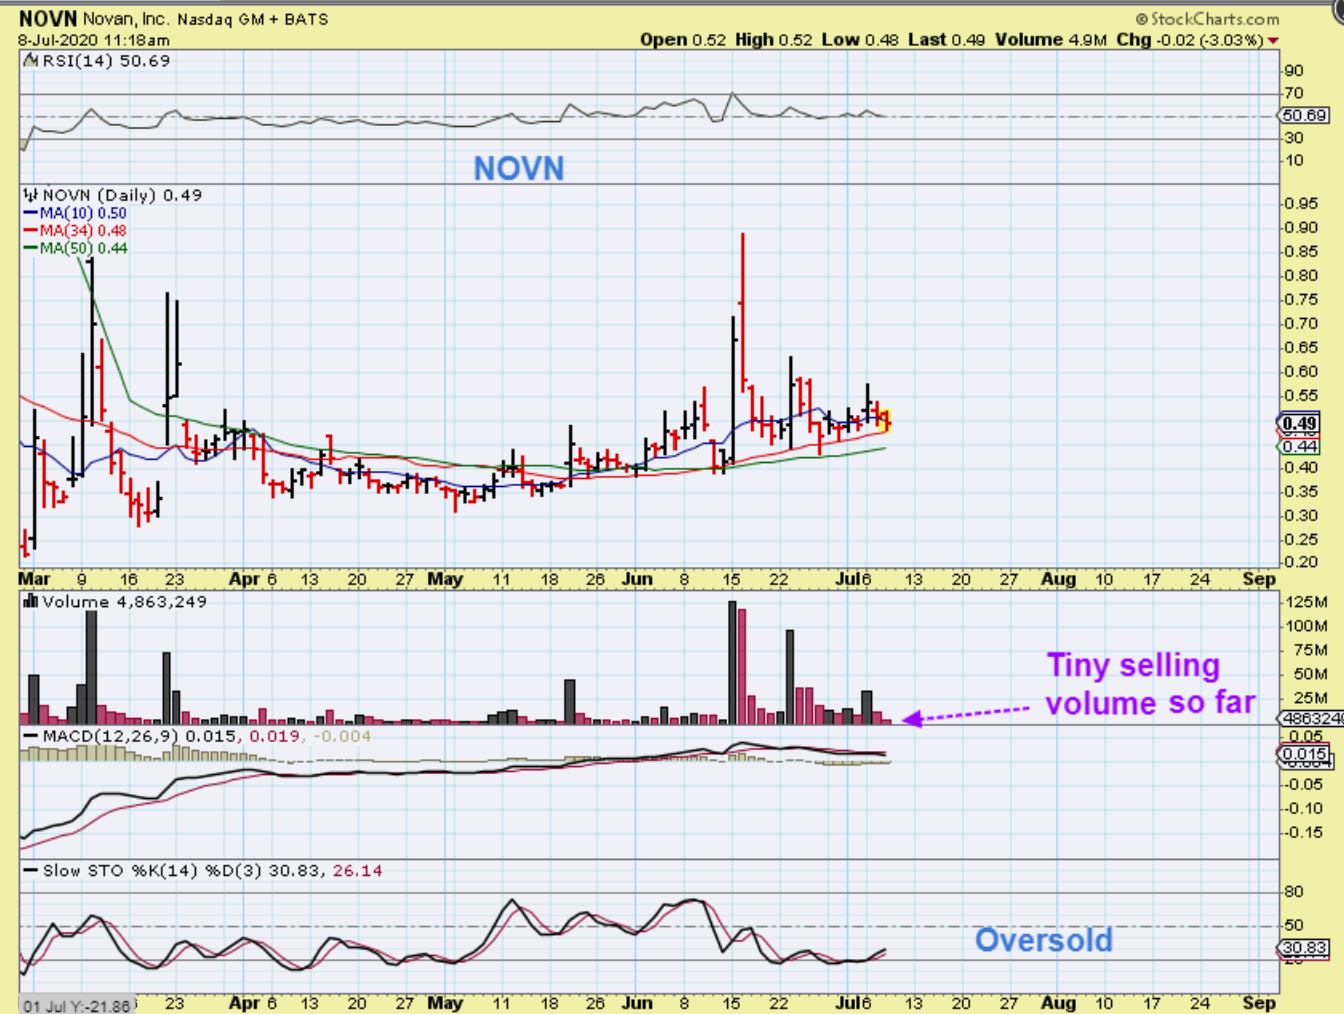
NOVN– THIS IS WHAT I WROTE WHEN I BOUGHT NOVN
NOVN– This was the first big POP on June 15th and the base is a beauty, so I think NOVN could do very well over time. I am not buying this for gains today, these are SWING TRADES. I buy them near the lows of a basing pattern that looks bullish, and look for gains in a week, 2 weeks, maybe a month from now.
Conclusion: When I am in a SWING TRADE like these Covid related companies, I have to keep checking the 1 year weekly chart vs the daily to be sure that all is well. I read the news and press releases to see if they are still on track. So far I still like CHFS, SXTC, NOVN, SGBX, BNGO, etc , so I may have 5% of my account in these, I may add on dips, I may sell on POPS, etc- but overall, there is a chance that these companies will out perform over time.
.
Remember that large Bases can lead to large gains IF the company is doing things right and is in a hot sector.