Thursday July 23rd – All Things Bullish
It has been a Bullish time in the markets, many sectors are on the run! Unfortunately, we all know that these things do not last forever, there will be pull backs and deeper dips over time, but for now? The old saying is, “Make hay while the sun is shining. ” Let’s see what the charts are saying today…
.
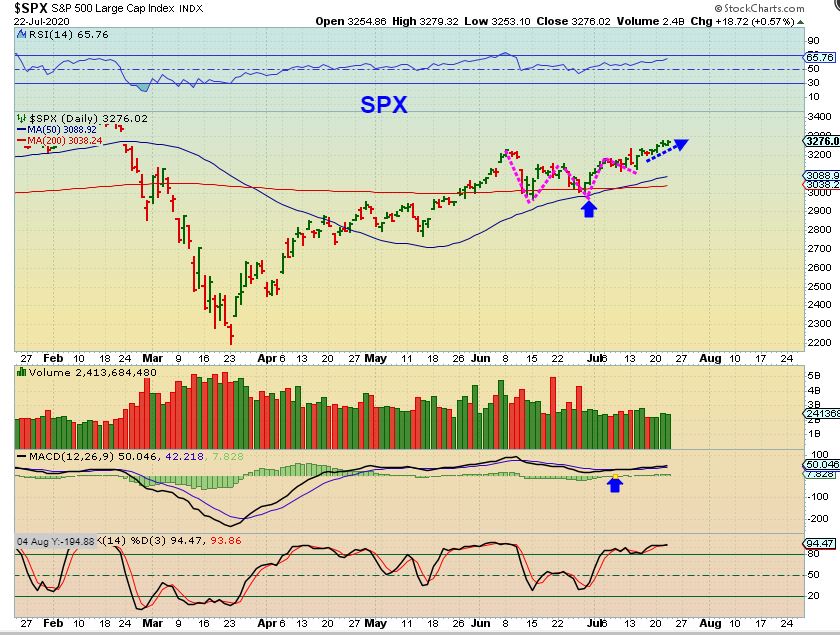
SPX – We recently had a consolidation after a strong run out of the panic sell off lows (ICL). I pointed out what looked like a “W”-Pattern recently , and that is a set of lows that often resumes upward. Raise stops under the 13 sma if you are long out of the dcl.
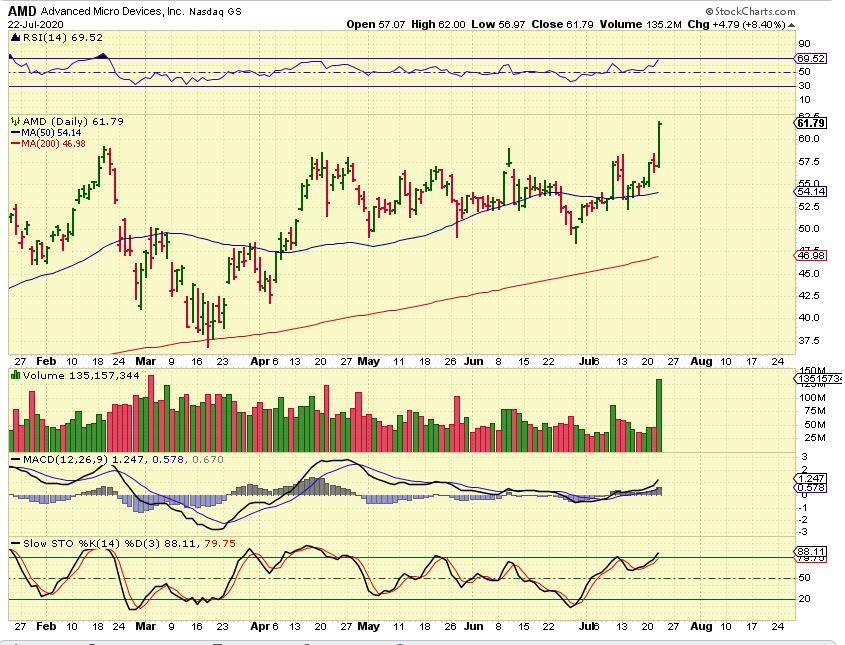
AMD was pointed out in my reports as a Bullish set up, along with MU. AMD popped out of that long consolidation yesterday, congrats if you own it, it may run higher from here. Now let’s look at MU again …
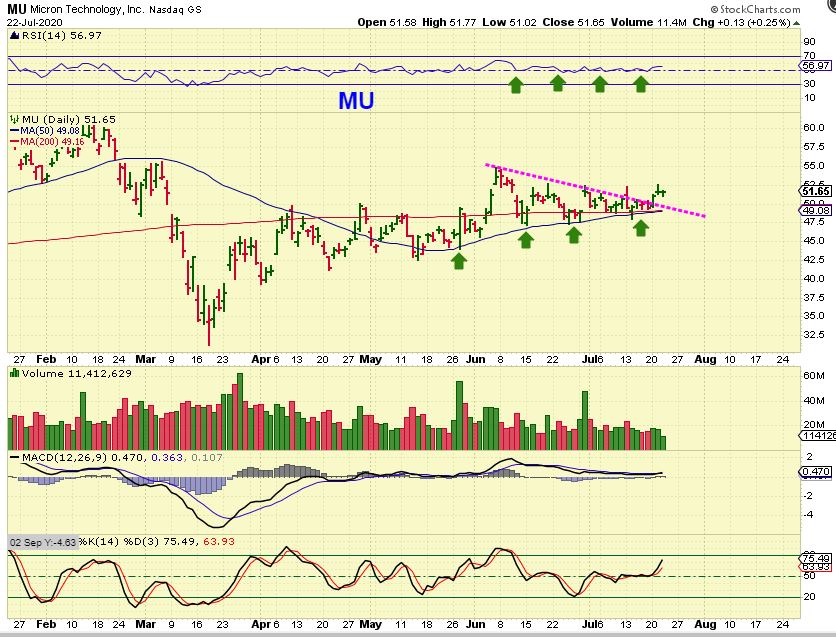
MU – I posted this from July 21
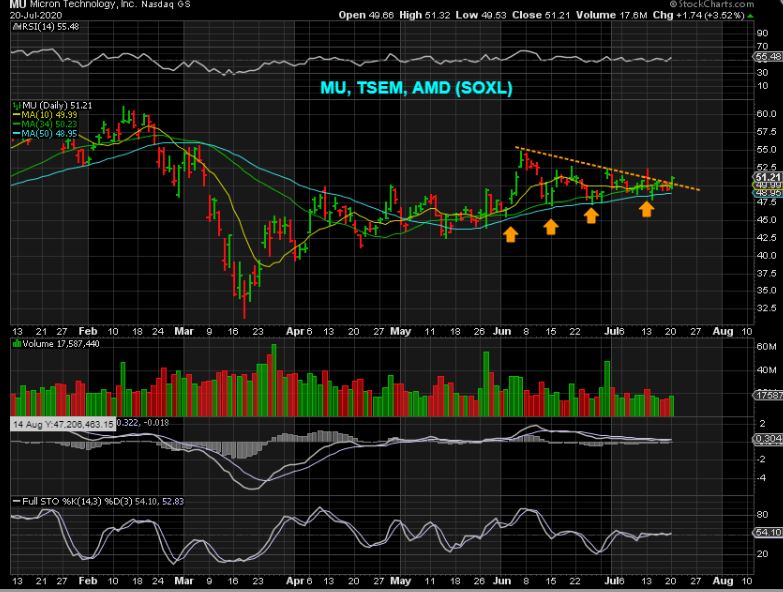
MU broke out and stalled, so it can still be bought , anticipating that it could do what AMD did. The only caution ? Check and see when earnings are to be released.
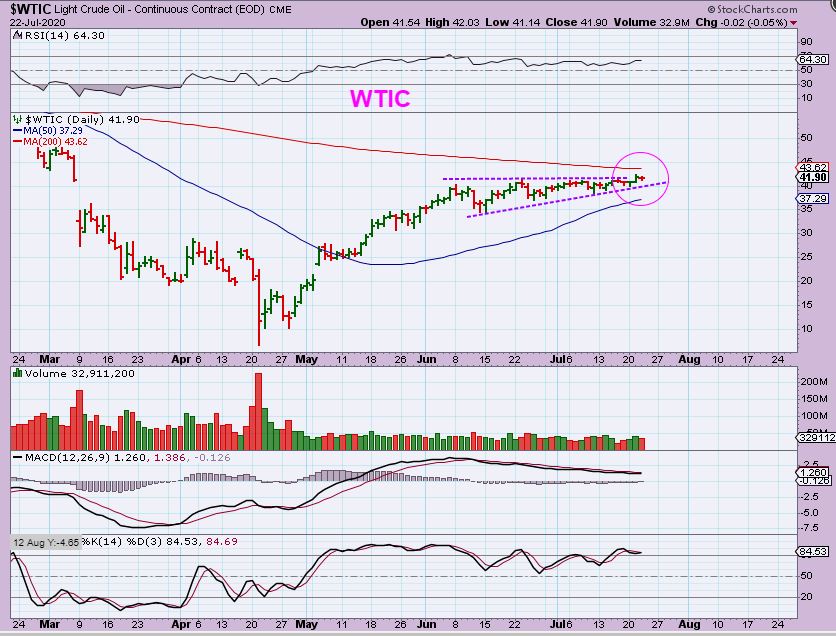
WTIC dropped 2 cents yesterday, and I have been pointing to Oil/Energy Stocks as setting up for the next run…
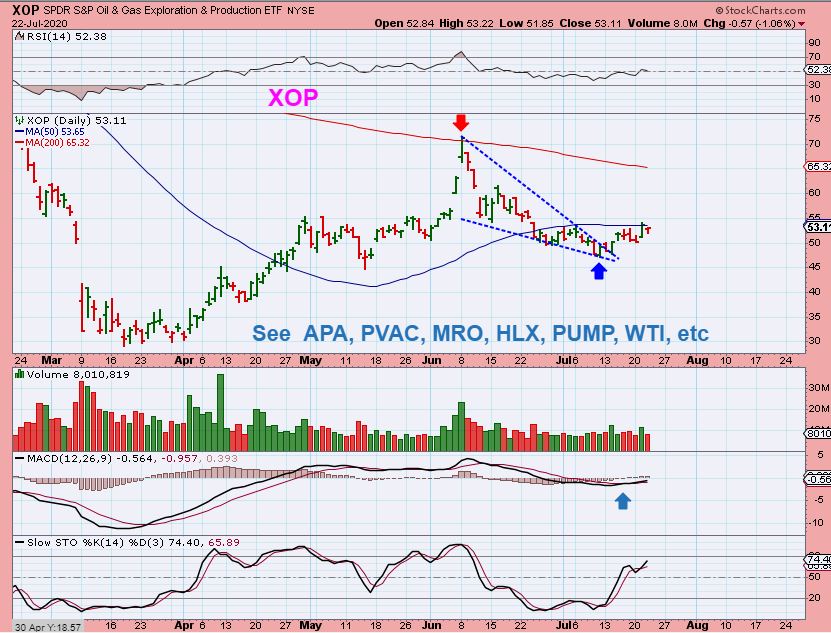
XOP stalled at the 50sma, but I expect it to break through. This is only day 8 of the daily cycle and OIL itself is due to push higher. I have entered a few Energy stocks as a swing trade, which means that I plan on holding for more than a week or so. Read the chart, I have discussed these companies in the past ( even yesterdays report).
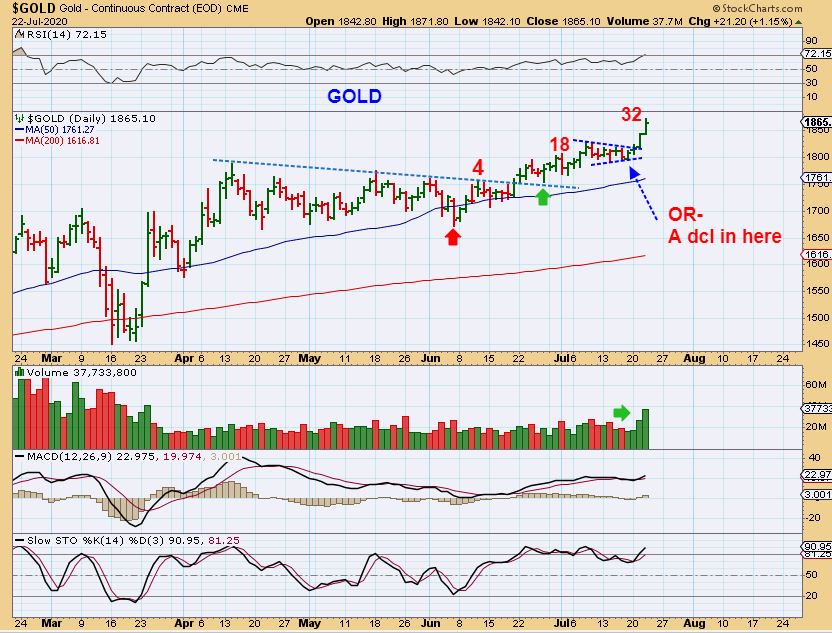
GOLD pushed higher and that is to be expected after breaking from the Bull Flag. Silver has been in a strong push higher and Gold has joined in.
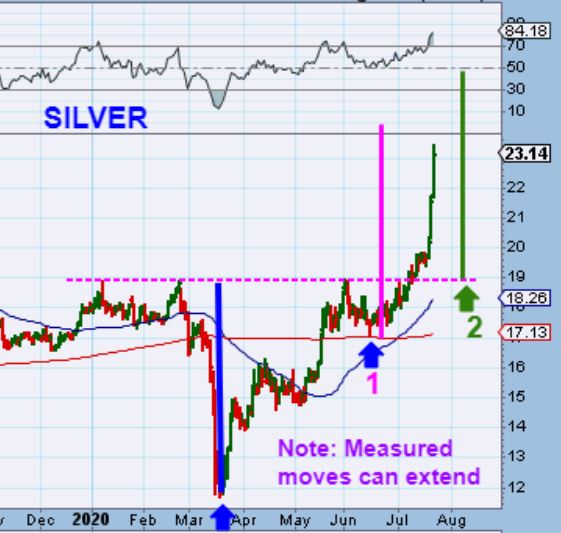
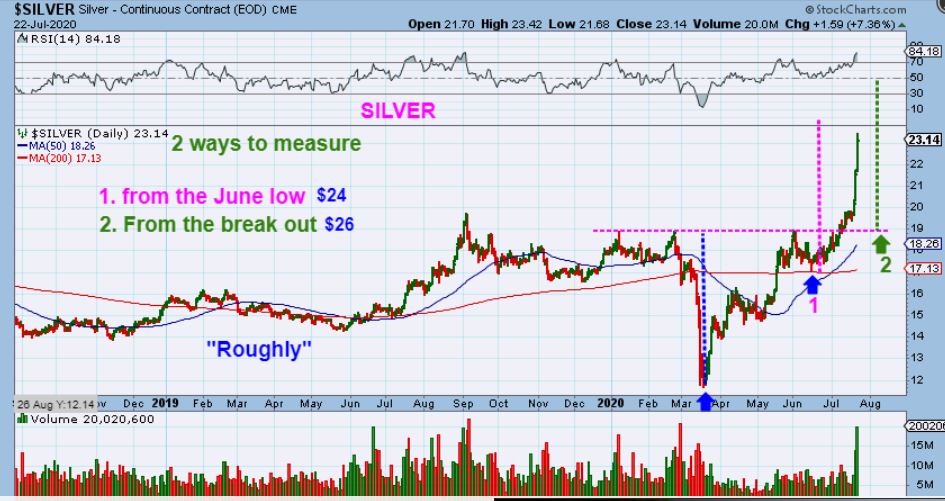
SILVER s measured move – I want to discuss possibilities with Silver, using Technical Analysis. I use 2 ways to measure a move. One is conservative ( see #1), and the other is also often used ( see #2). Let’s now discuss this…
.
SILVER -If I use this method, I get these targets for Silver, but we all know that Silver can extend when it heats up. As a guide though, I roughly get ( #1) $24 conservative, and (#2) $26 Actual. Note: $21+ was my original first target and that has been left behind.
.
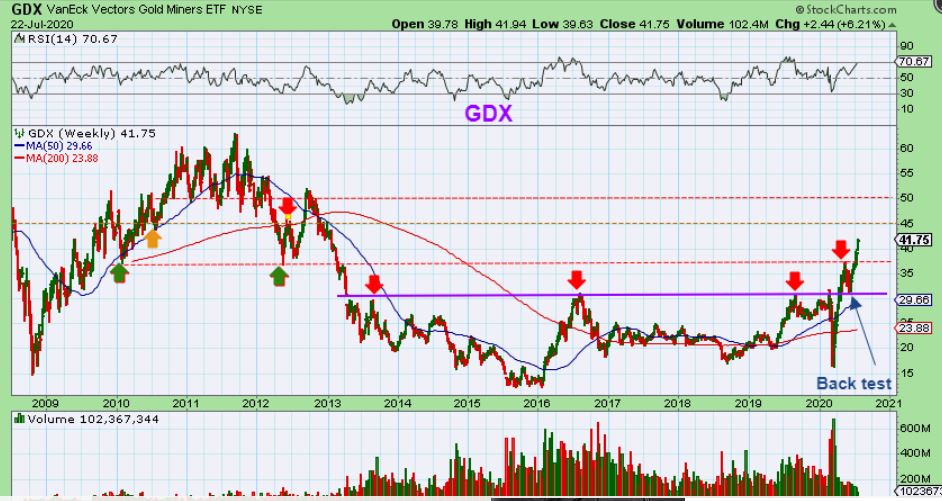
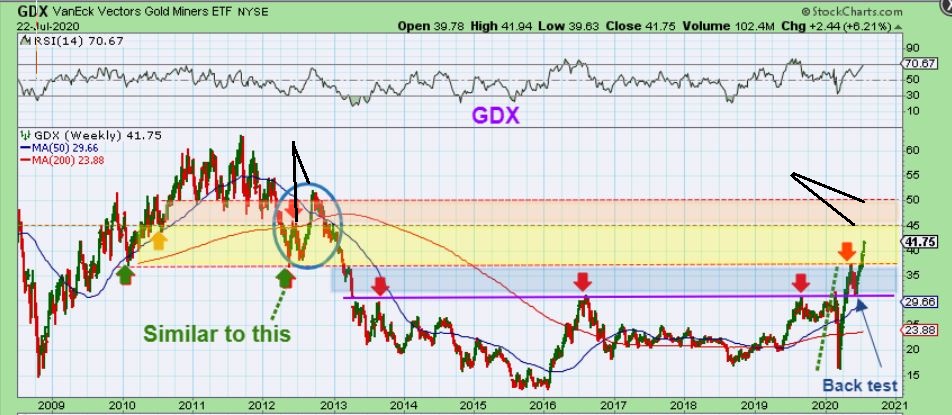
GDX – I have to go to the bigger picture here, to help us to see what is happening. I have mentioned this in the weekend reports often. GDX has been respecting support and resistance pretty well.
1. You should recall the break out and back test that was called for and happened recently (see purple line back test on the chart).
2. That was when GDX ran to that Orange dotted resistance line and dropped to back test.
3. Now GDX broke out again above that orange dotted line. What next? (The next line is at $45).
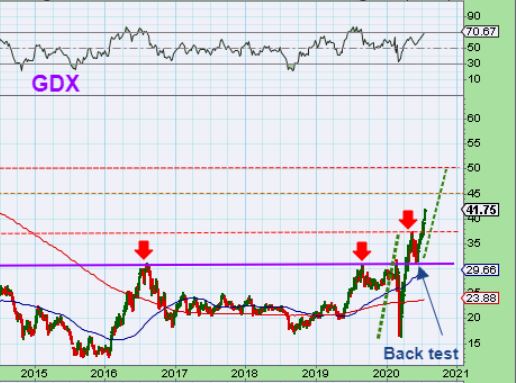
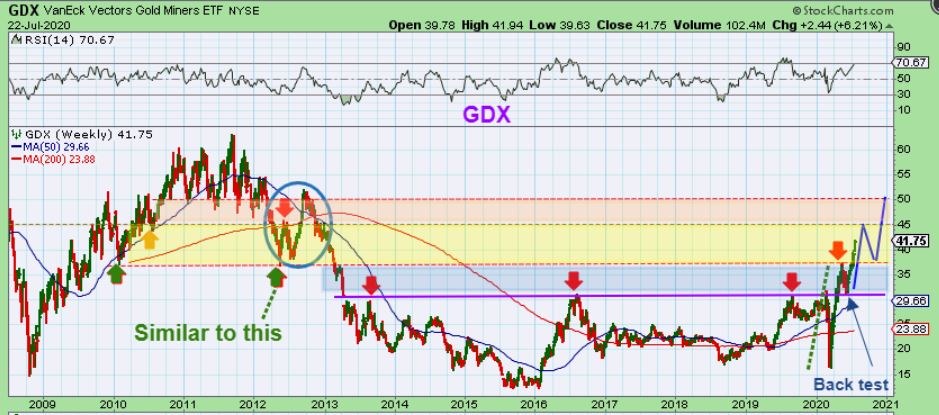
GDX zoomed in – we see that if this move runs the same length as the first move out of the ICL as drawn in Green, we actually would make it to the $50 line. GDX is at $41.75 , so that is calling for more upside.
.
When I look at GDX here, it looks like targets are $45 and then $50 to get to stronger resistance. How might this play out? I will take a guess, THE NEXT CHART IS JUST A PLAUSIBLE VISUAL IDEA AS A GUIDE, NOT AN ETCHED IN STONE PREDICTION.
.
If GDX runs to $45 and then drops to a dcl as a ‘back test’ again, another run could take it to that $50 line . Look at the circle where I wrote ‘Similar to this’. A repeat of that is possible.
For now I have simply been saying that the run is strong, so using a trailing stop will keep you in the trade. Several people started writing to me and saying that they were selling silver stocks almost 3 weeks ago and I felt that that needed to be addressed. Many like CDE, AG, etc were forming cups and handles. These can run beyond overbought when these get going. A 13 sma stop has worked well to keep you in the trade. IN FACT…
.
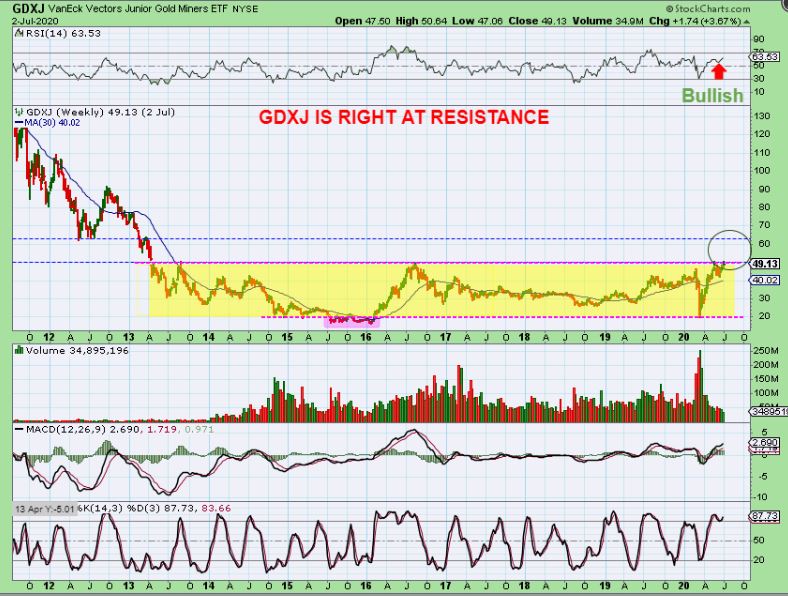
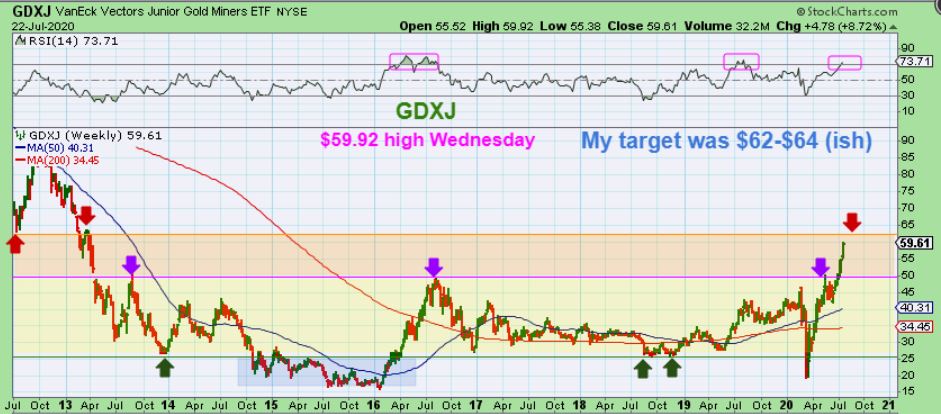
For many weeks I have been saying that GDXJ should run to $60+ . This was my GDXJ chart from that weekend of JULY 2. The next resistance line was roughly $60-$64
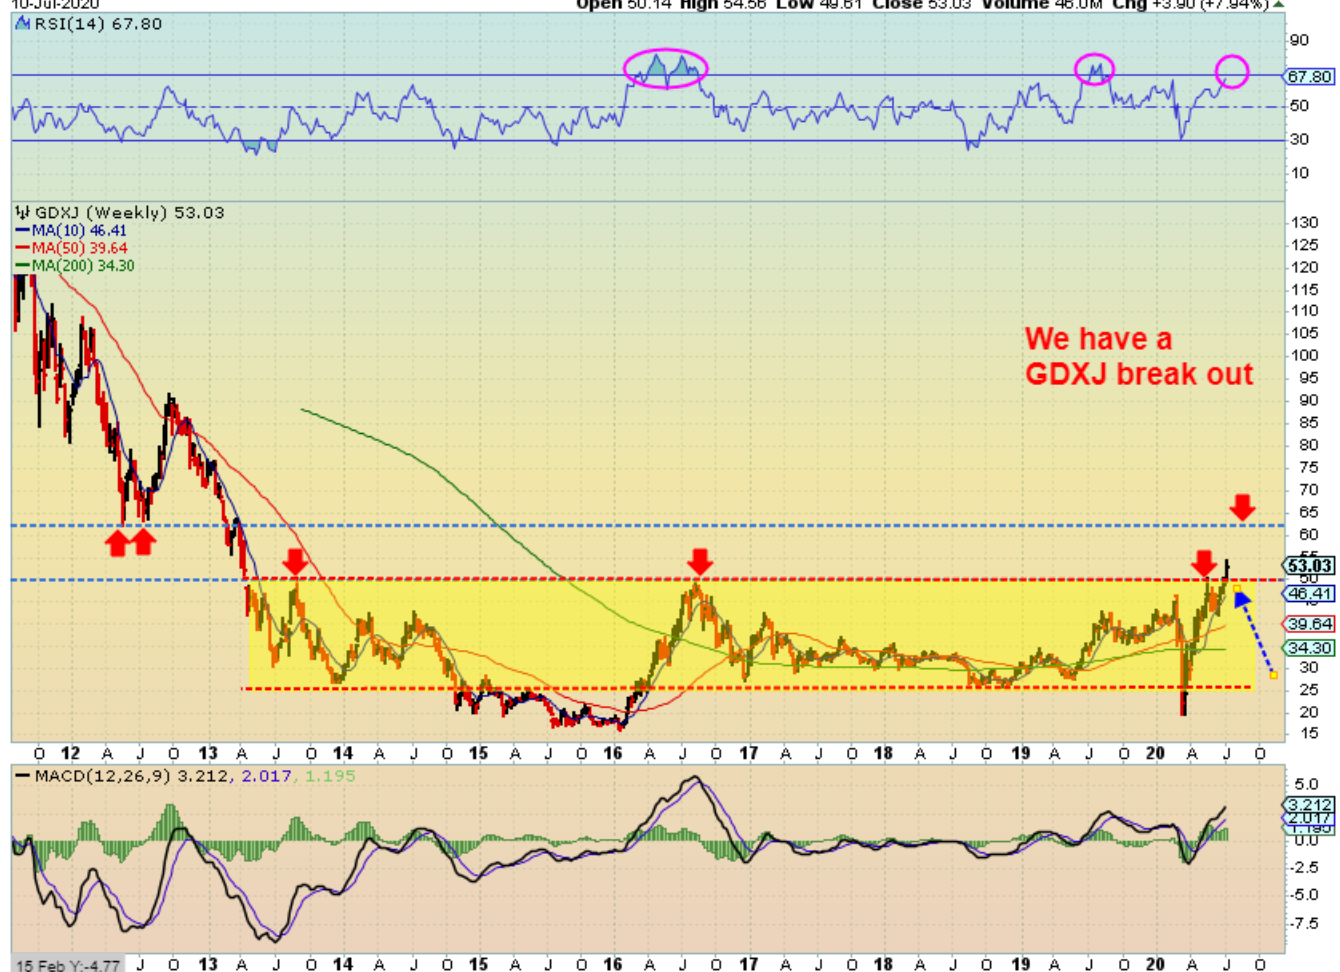
GDXJ – This JULY 10 chart pointed to the same area , between $60 & $65.
.
GDXJ -And here we are, with GDXJ hitting $59.92 Wednesday. What a ride the junior Miners have been giving us, especially the BUY & HOLD Silver stocks. They are now looking like they are going parabolic. Let’s briefly talk about that…
.
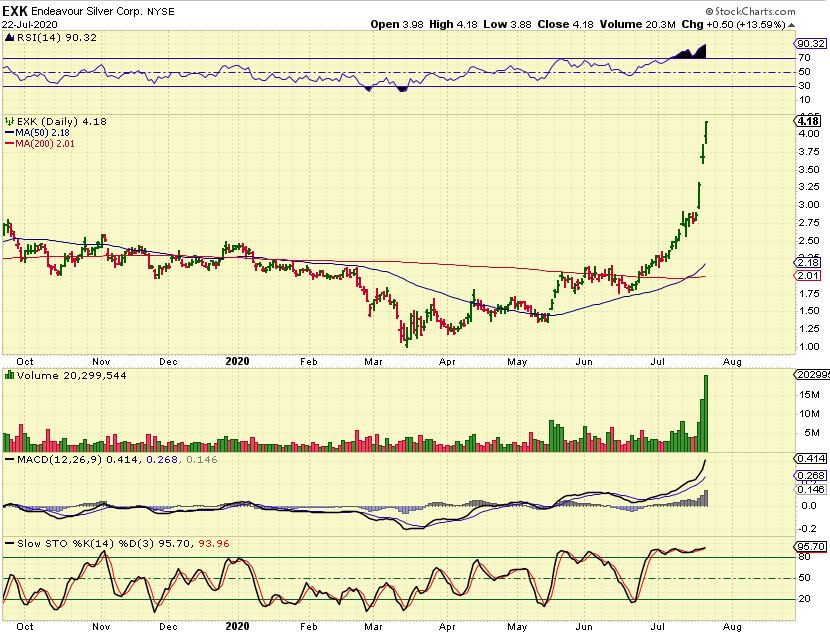
Some, like EXK, are now looking like they are going parabolic. This is AWESOME, but when a stock gets this high above the 50 & 200sma, gravity and a return to normalcy will happen. I usually start selling portions of my holding , just so I dont wake up one morning and see it gap way down and quickly waterfall back down.
.
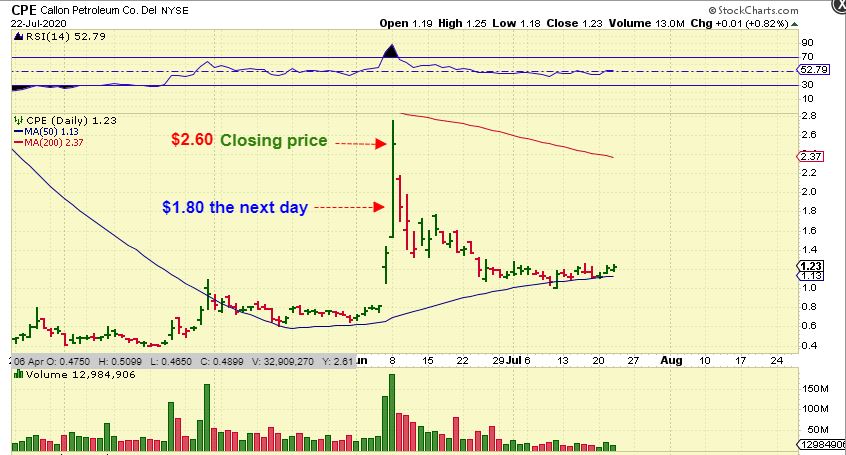
CPE AS AN EXAMPLE: Recently I (or we here at Chartfreak) rode VISL, NOVN, HTBX, OAS, CPE, etc. to parabolic heights. I mentioned on some of these that I sold on the way up ( 20% here, 20% there, after it gets too extended, etc) . Let’s look at CPE as the example.
.
CPE went straight up and suddenly one day it opened down and dropped almost $1 lower. 1000 shares, that is $1000 gone. It is normal for a parabolic run to collapse in time, I try to sell if it gets too extended.
.
The markets have been bullish in many sectors, there are strong strong runs, and often quick sharp pull backs. I try to admonish the Use of trailing stops under such conditions, and I also try to sell a little on the way up if the chart starts to get too steep.
.
Biotech and Miners are in a strong Bull run. The set back can be the dreaded public offering, so ride them while you can, trade them when you see fit. Enjoy your trading !
.
~ALEX
.
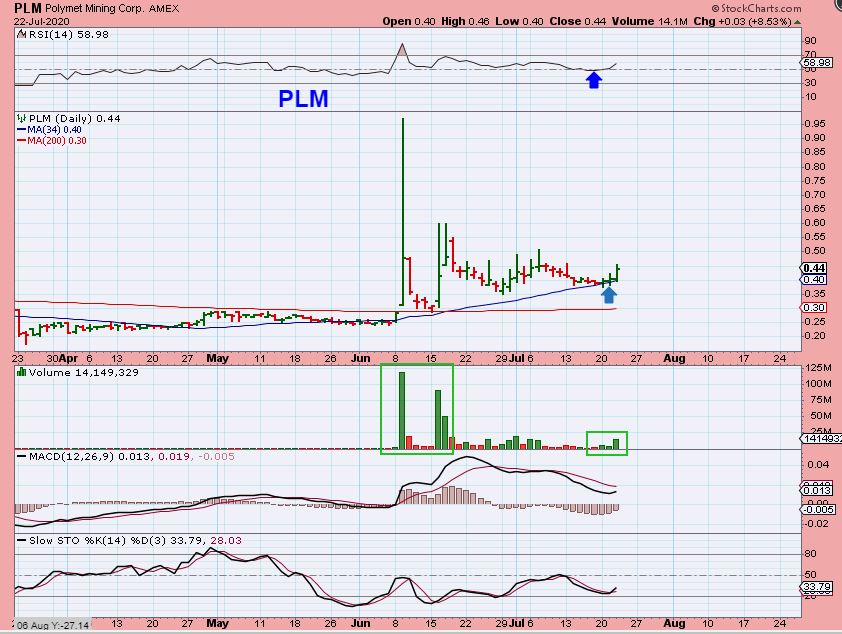
After seeing PLG start to run, I checked out PLM. This is a bullish set up after a nice consolidation. It sits on the 34 sma and volume is starting to come in, so this can be bought.
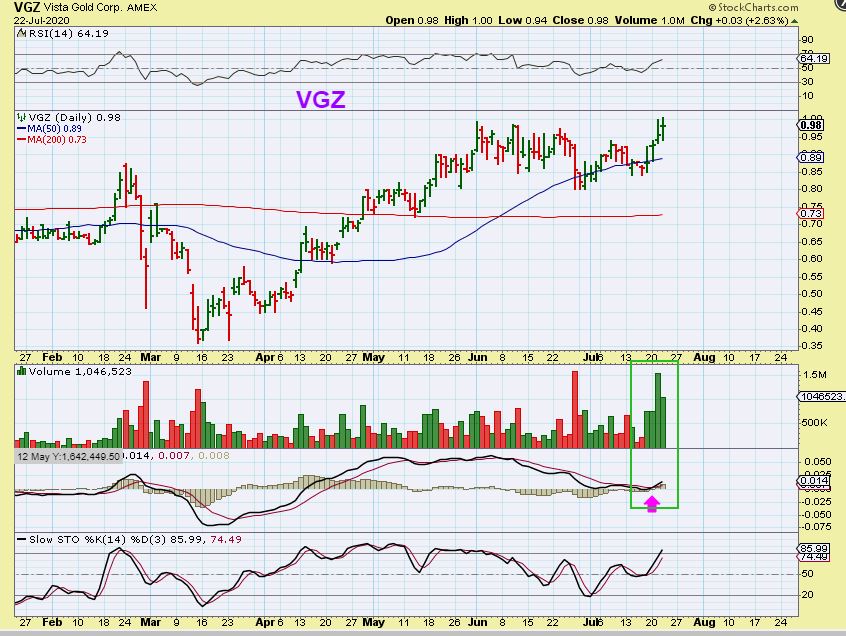
Oddly, I noticed a few laggards and VGZ is one. I say that this is odd, because it ran well out of the lows. Is something wrong with it? That recent volume indicates that it is setting up bullishly, so this ( or others that you see like it) could be bought as a lagger , but use a stop. When the run is done, so is the fun.
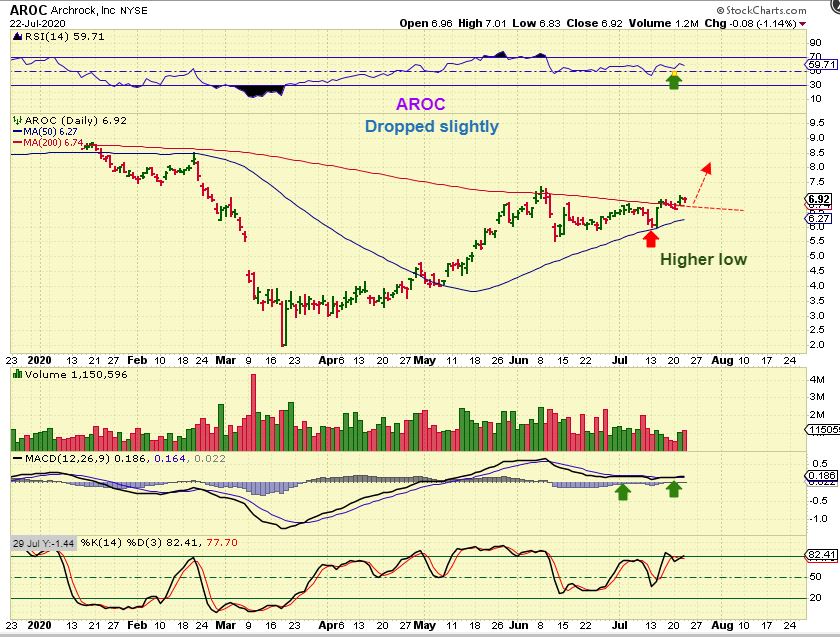
AROC – Just wanted to include one of those Energy Stocks mentioned in yesterdays report in this report too. Most that I mentioned recently are bullishly set up , have stalled, but should continue higher. AROC is even above the 200sma and looks good. See the chart.
.
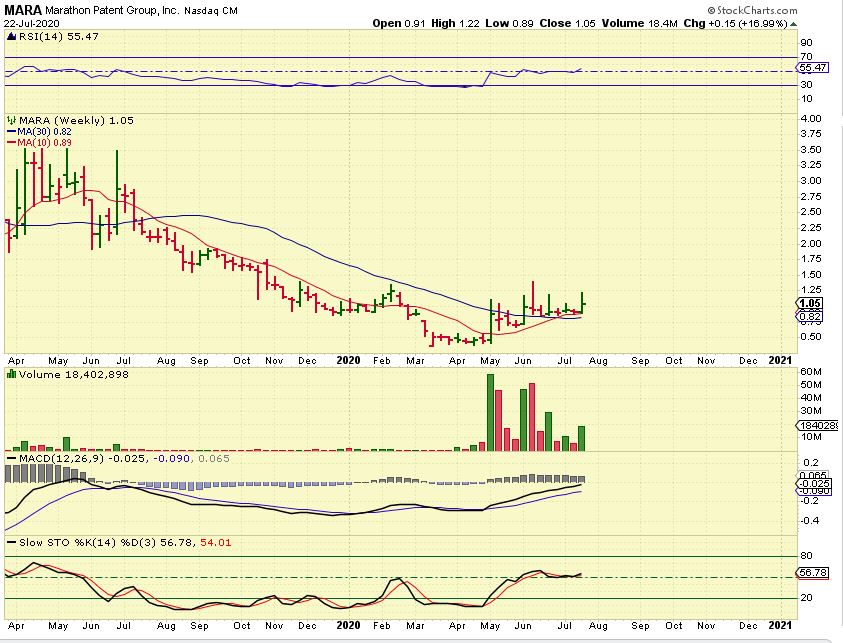
MARA- I bought MARA yesterday as it broke out above $1. This is the weekly chart and it looks very bullish longer term.