Thursday July 16th- No Straight Lines
I got called away from my desk midday yesterday and I was gone all day into the night. I came home too tired to write a report, so I went to bed and wrote this report at 4 a.m. to 7:15 a.m. I now need to go back & proof read / spell check, but I still want to release it at this time since some of my Australian readers have told me that they get these right before bedtime. If you see mistakes & Typos , please ignore it. Thanks 🙂
.
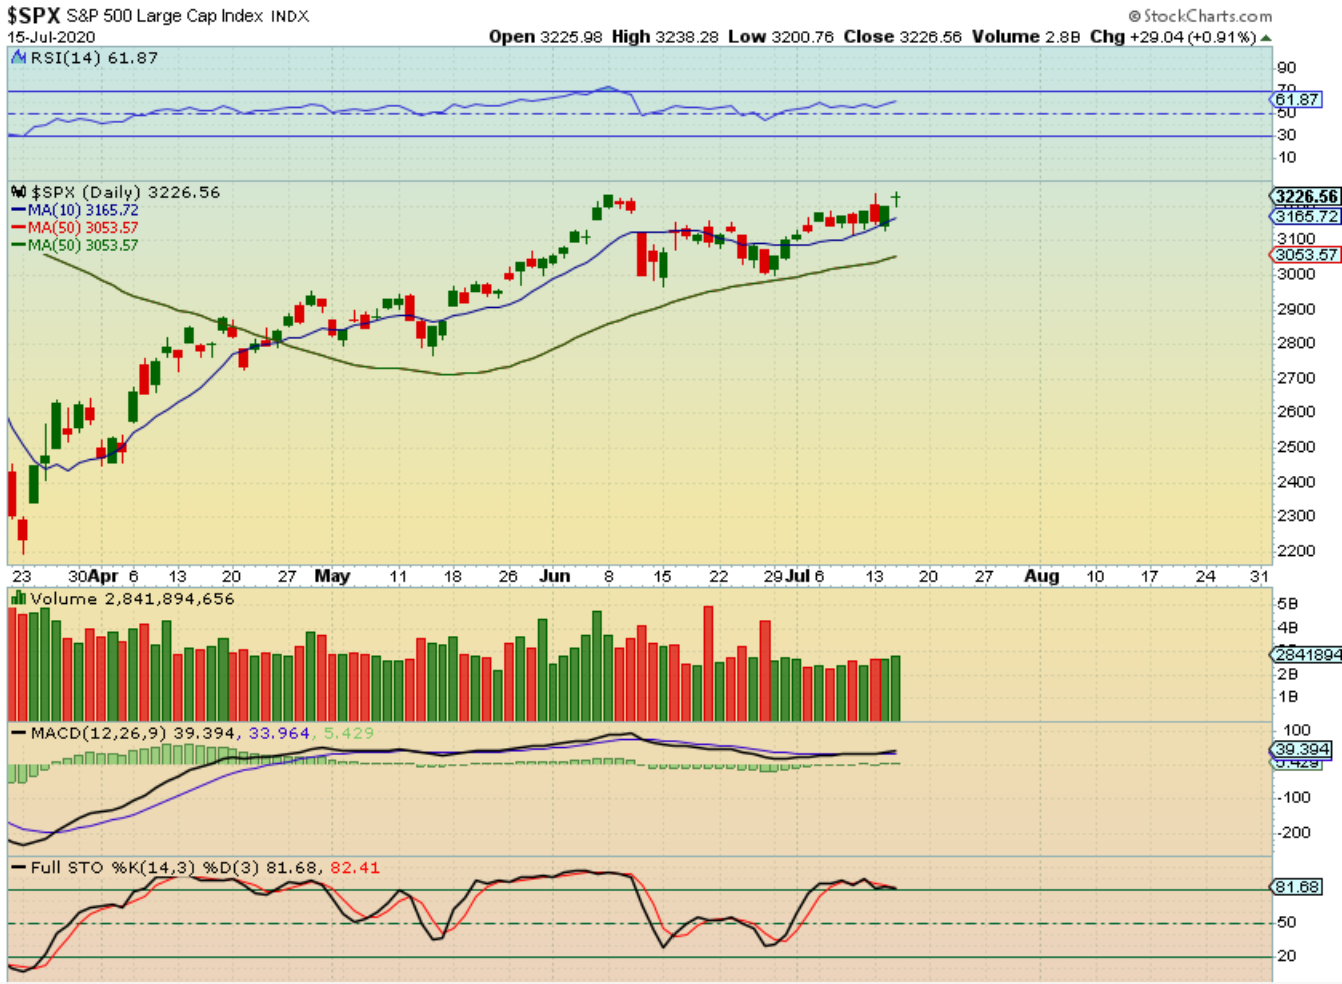
THE SPX found support at the 10 sma & moved a bit higher yesterday. This regained the drop on Tuesday and remains a bullish set up. Markets are choppy, but the NASDAQ had that bearish engulfing, and that can signal a ‘top’, so these markets can remain choppy & even toppy.
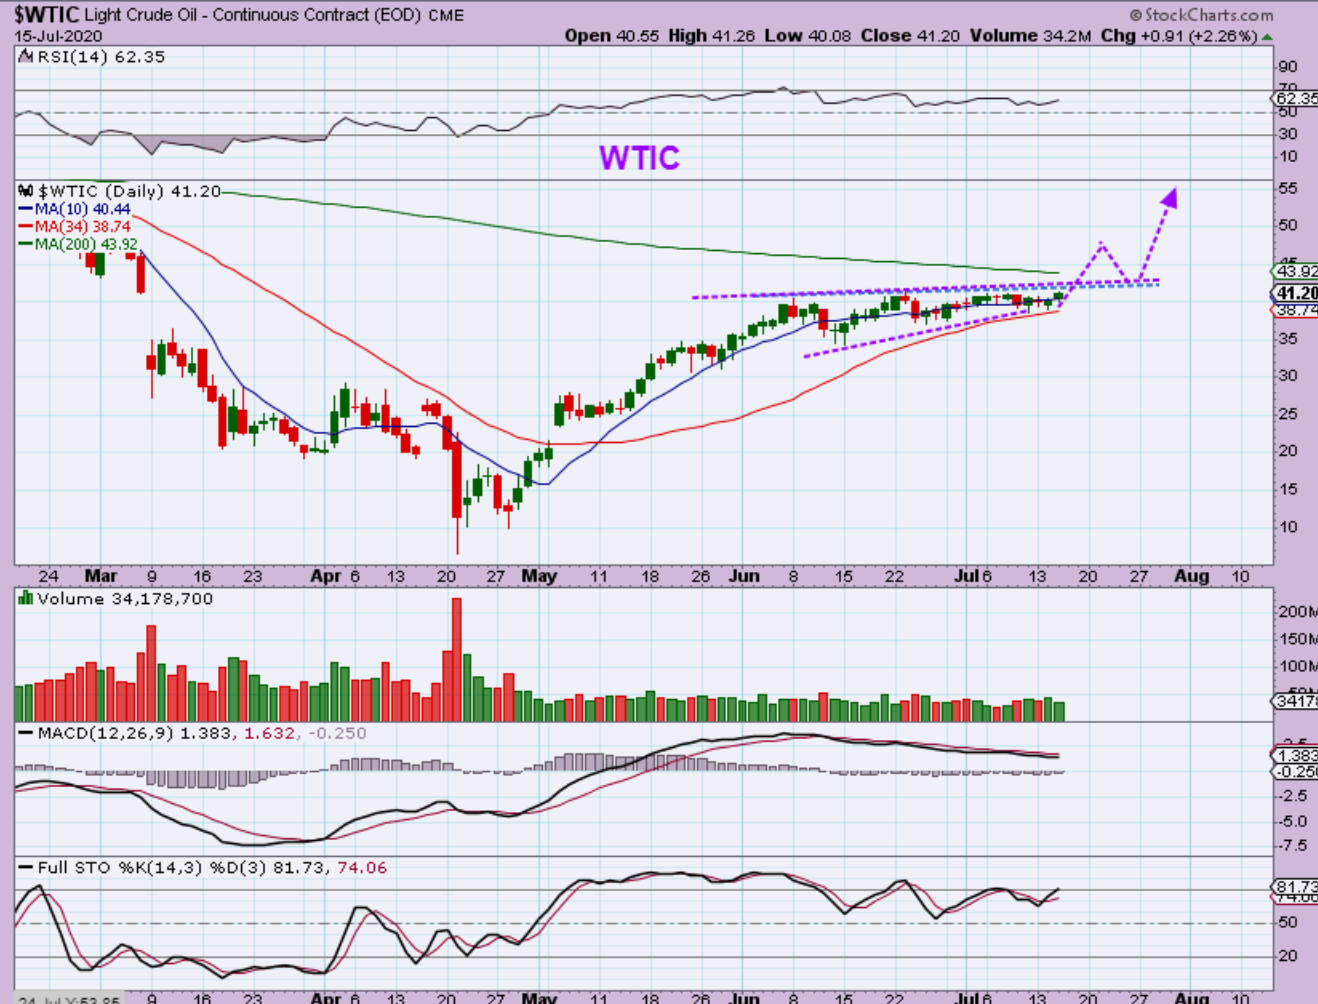
WTIC inventory was Wednesday and Oil moved $1 higher.This is a very tight pattern and if it breaks out, it should be able to burst right through that 200sma.
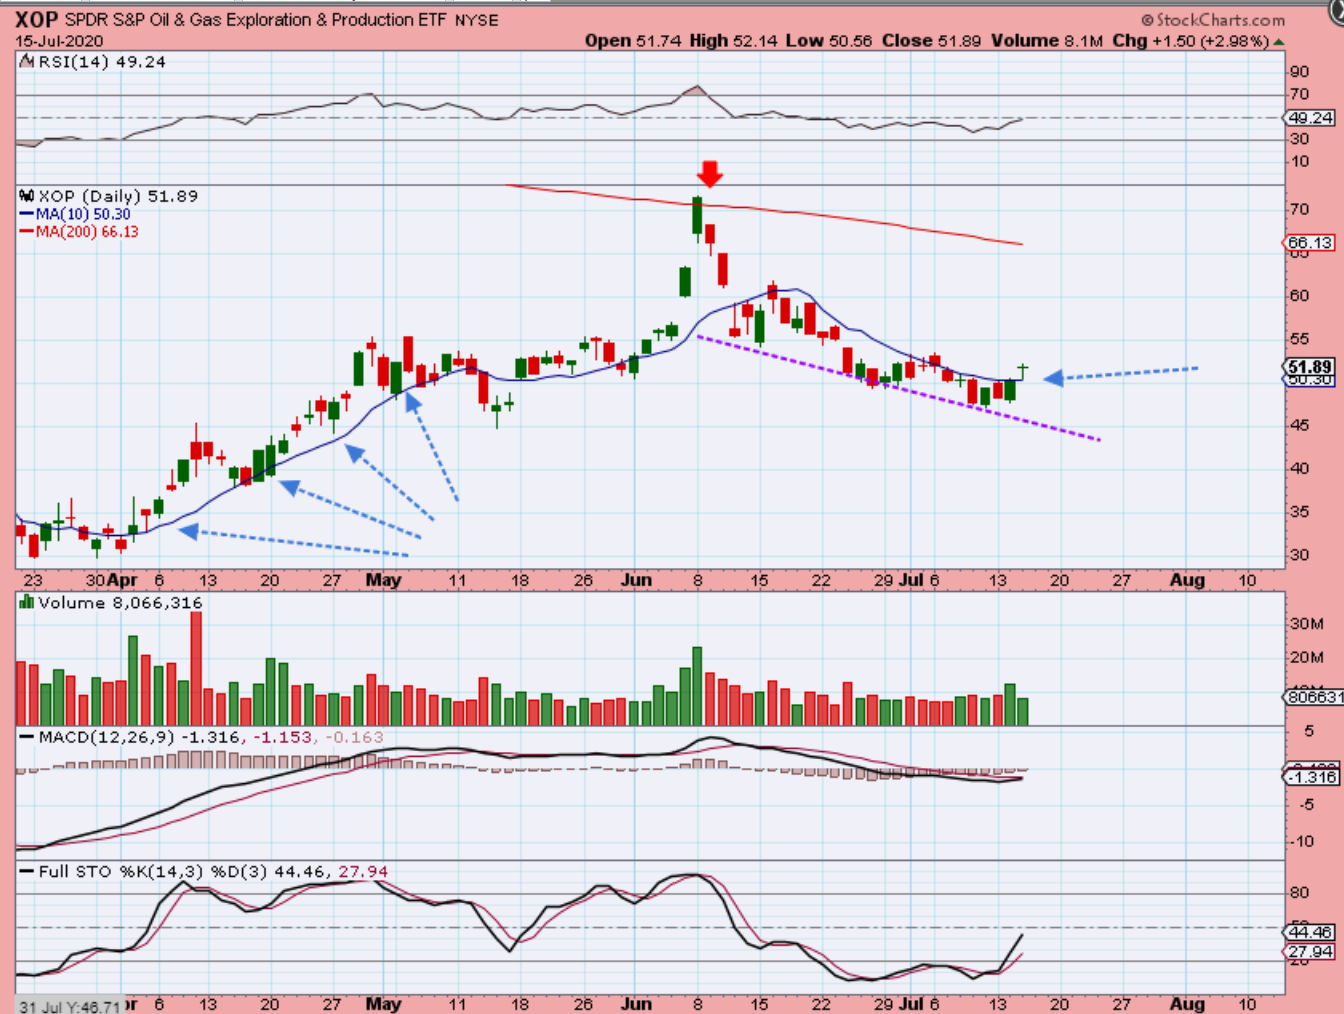
XOP -I’ve been watching Oil / Energy stocks for clues of a low ( I mentioned the 5 waves down looking complete) and the XOP DID pop over the 10sma. This usually signals a dcl is in place . I will point out a couple of Energy stocks that I have been mentioning in recent reports. They are ‘Buys’.
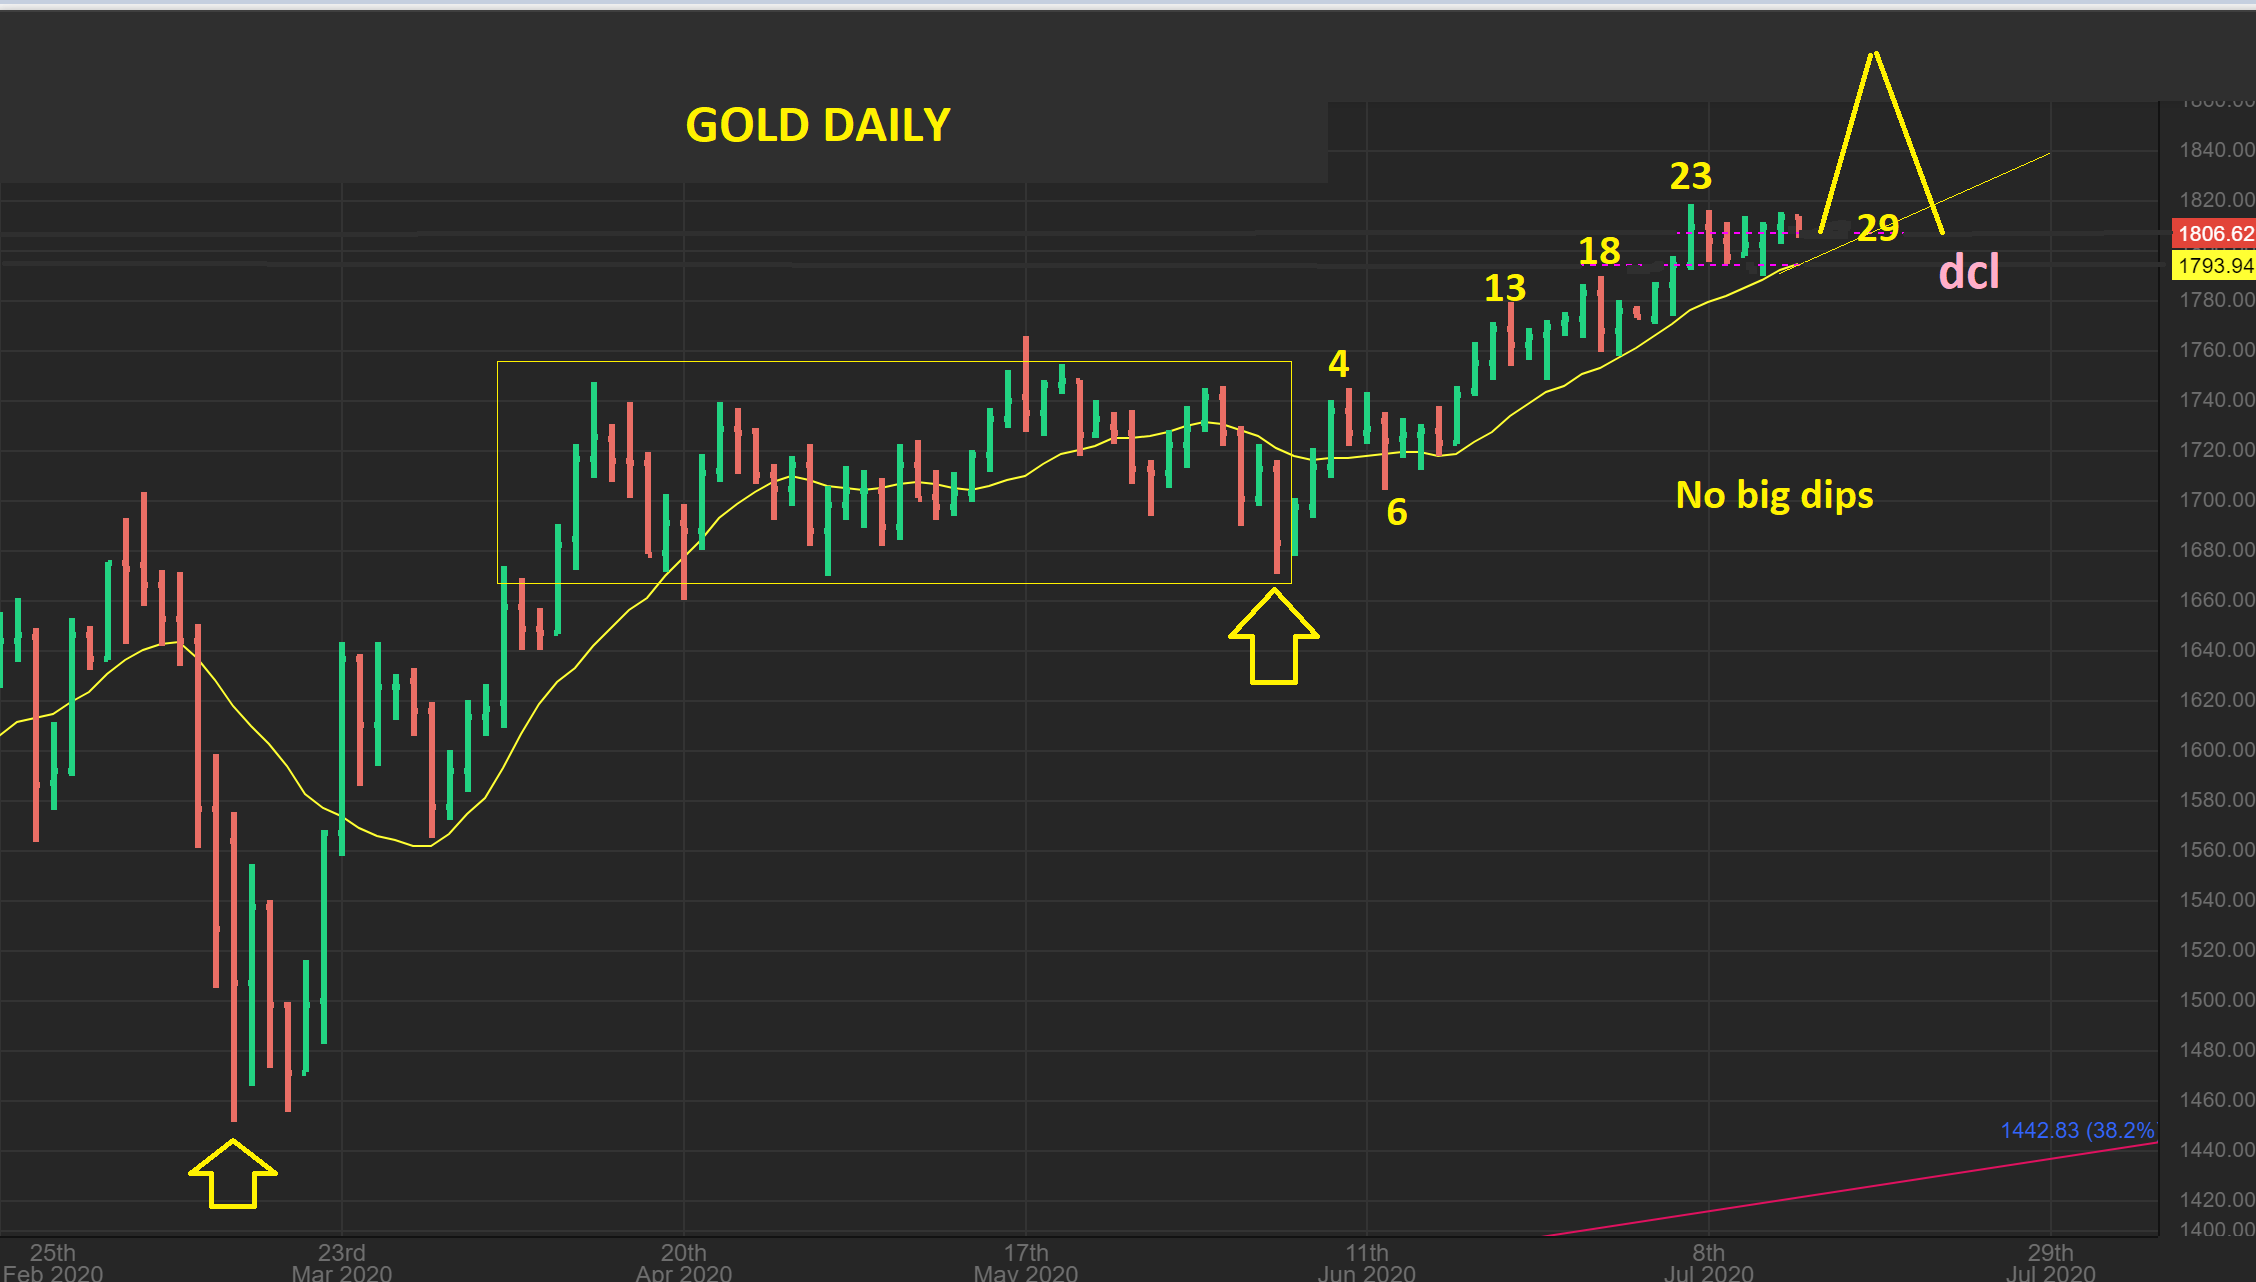
GOLD does not drop very far. Each pull back reverses at the 10sma, and that is bull market action. Even this late in the count off of the lows, we formed a flag.
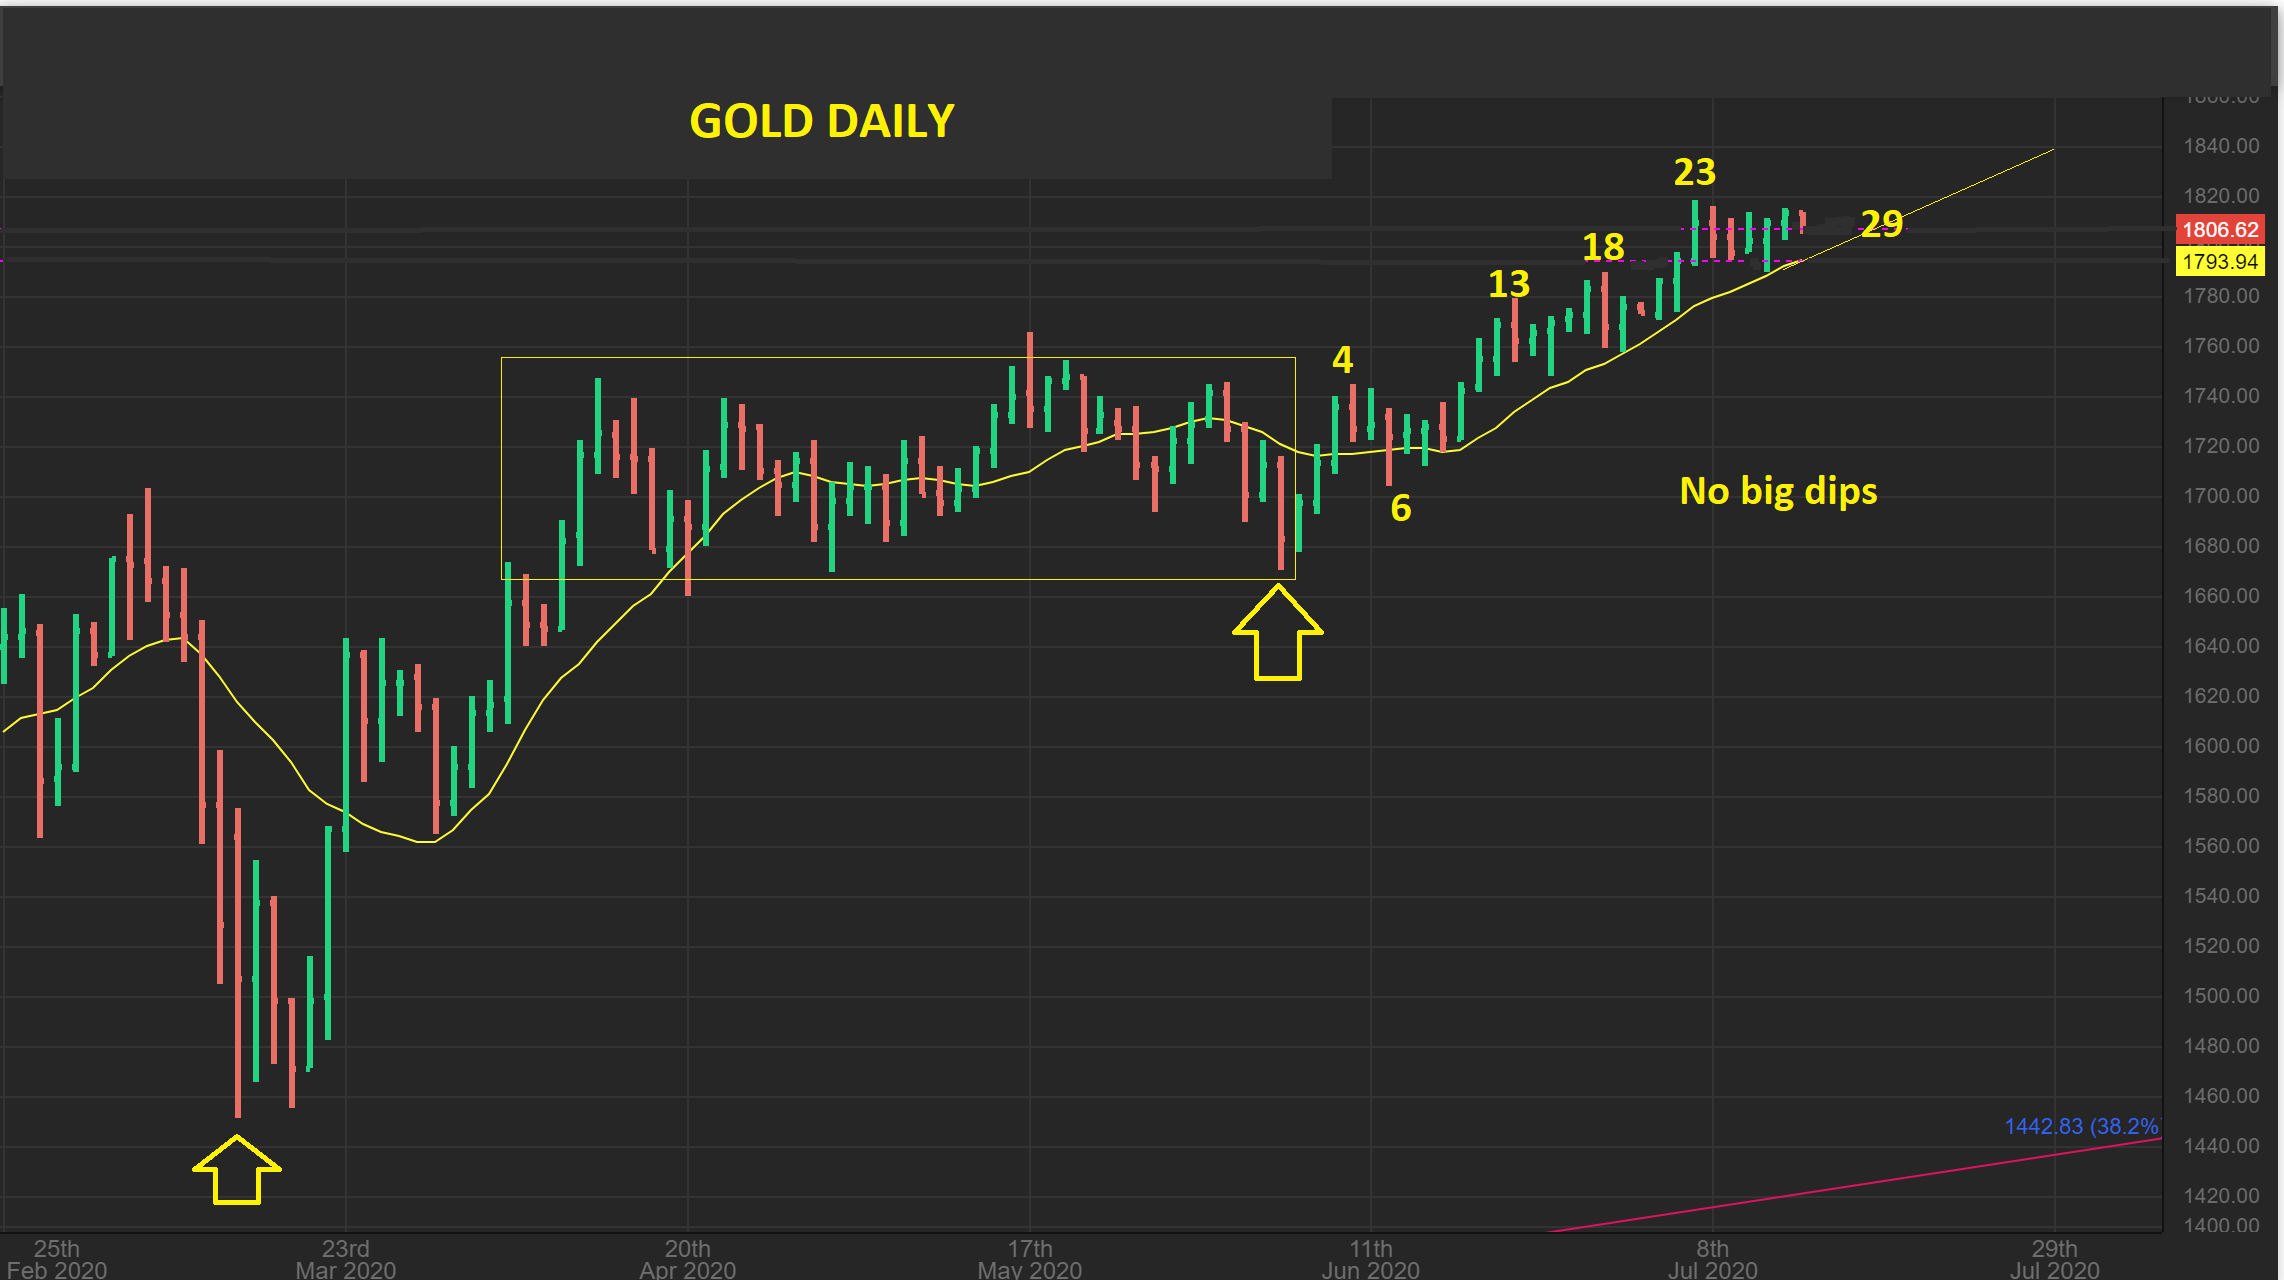
After our Box consolidation BUY at the dcl, Gold has continued to run higher. I would say that GOLD could still pop and drop ( to give a mild dcl), but we’ll just have to wait and see. It also could drop to back test the box as a DCL. A stop at the 10sma ( or 13 sma to allow a little movement) has kept bulls in the trade.
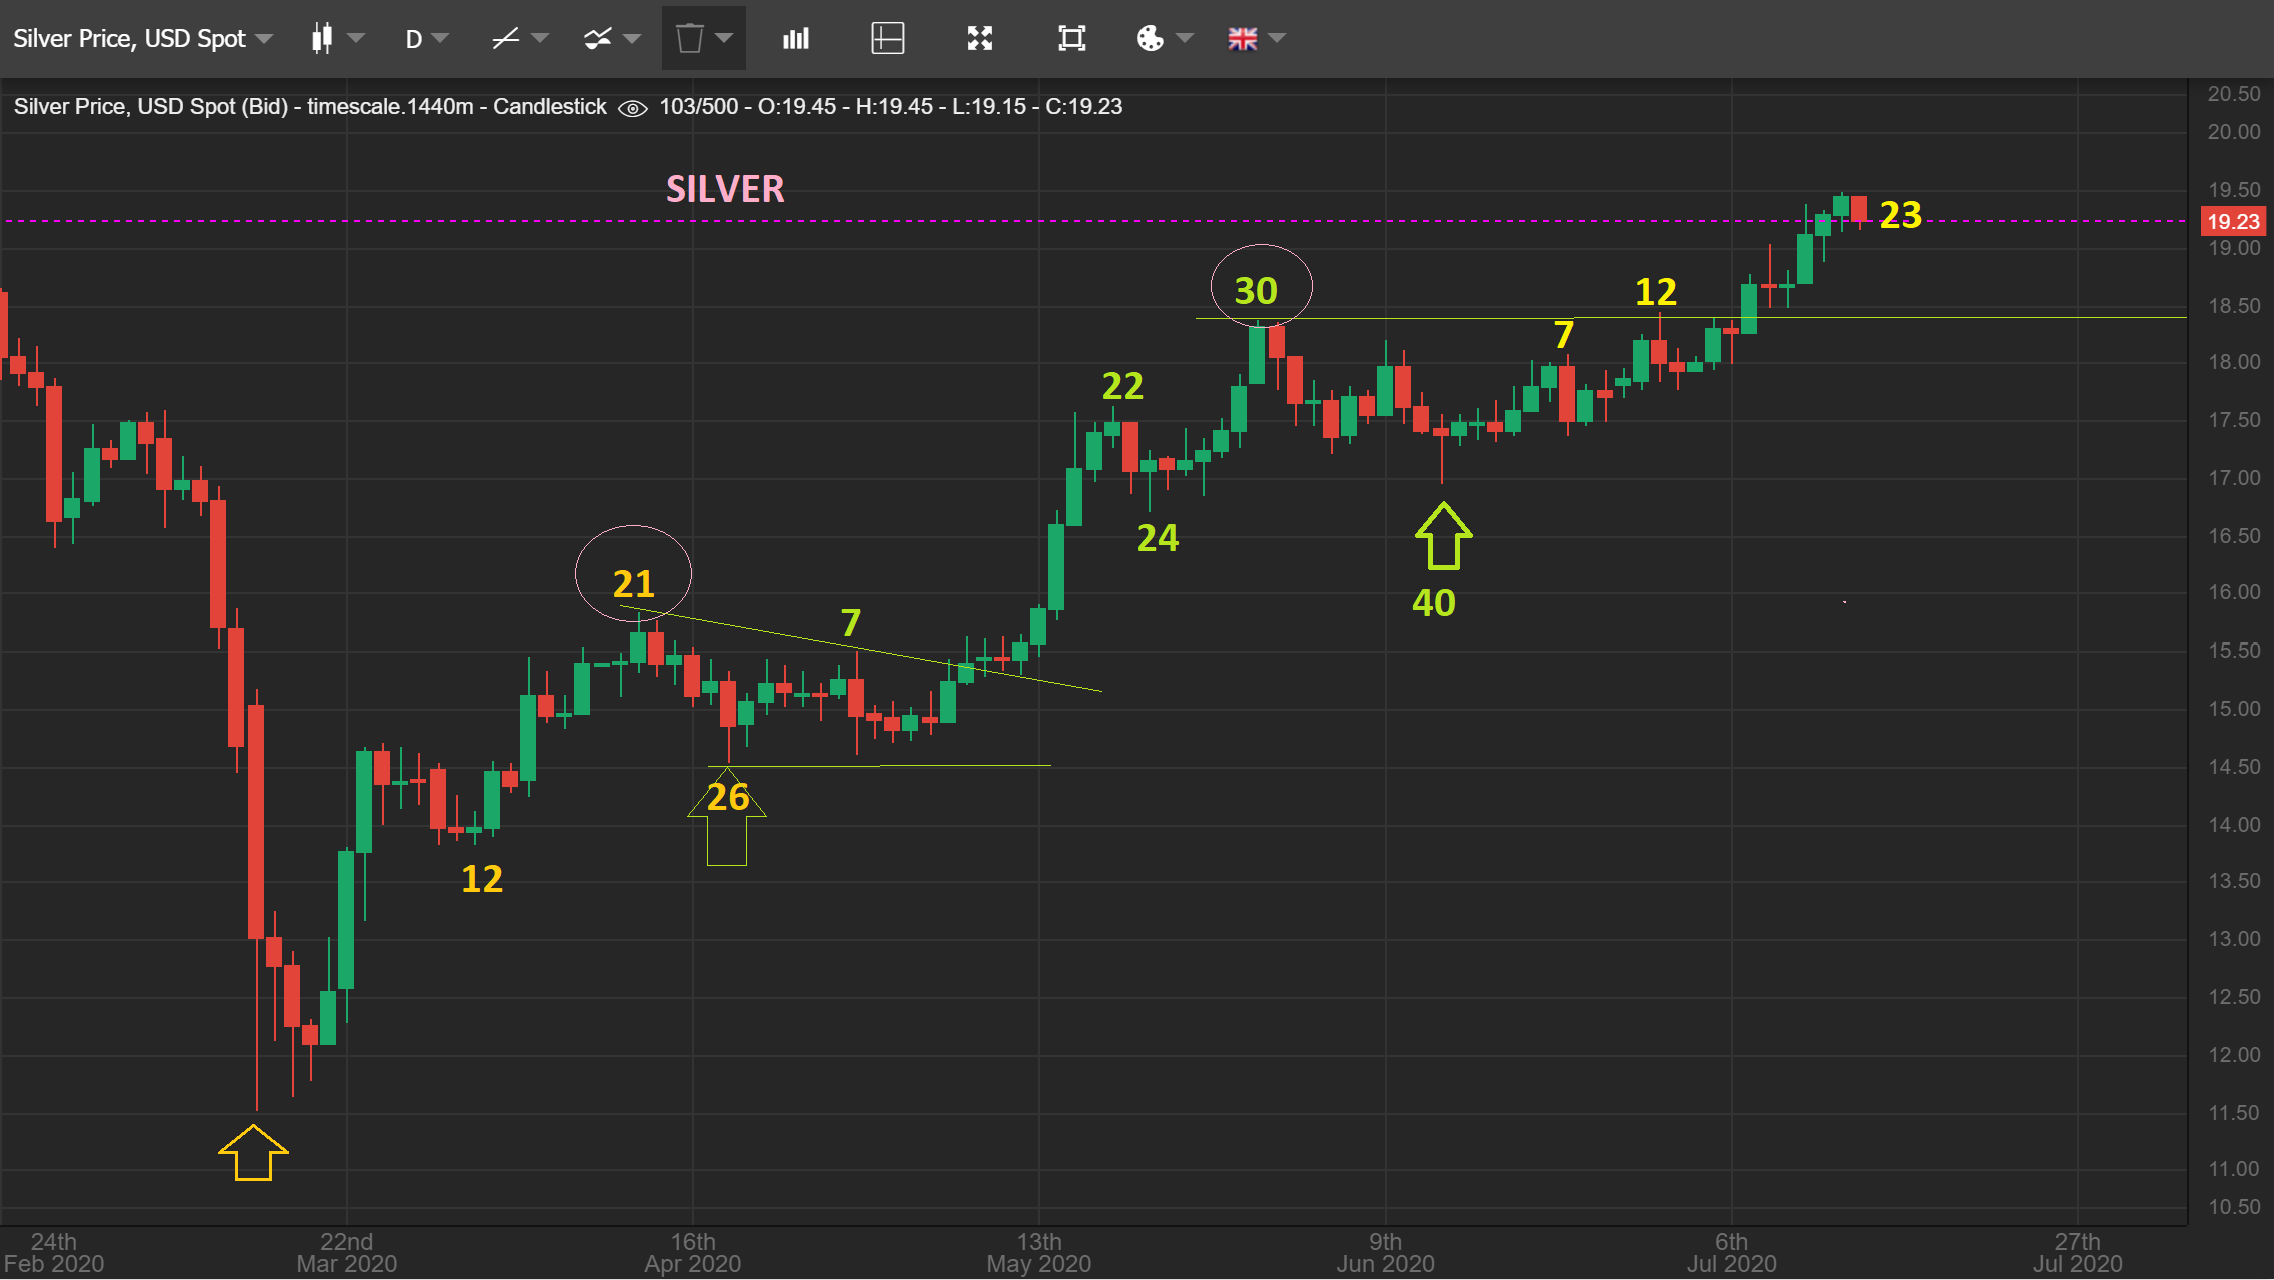
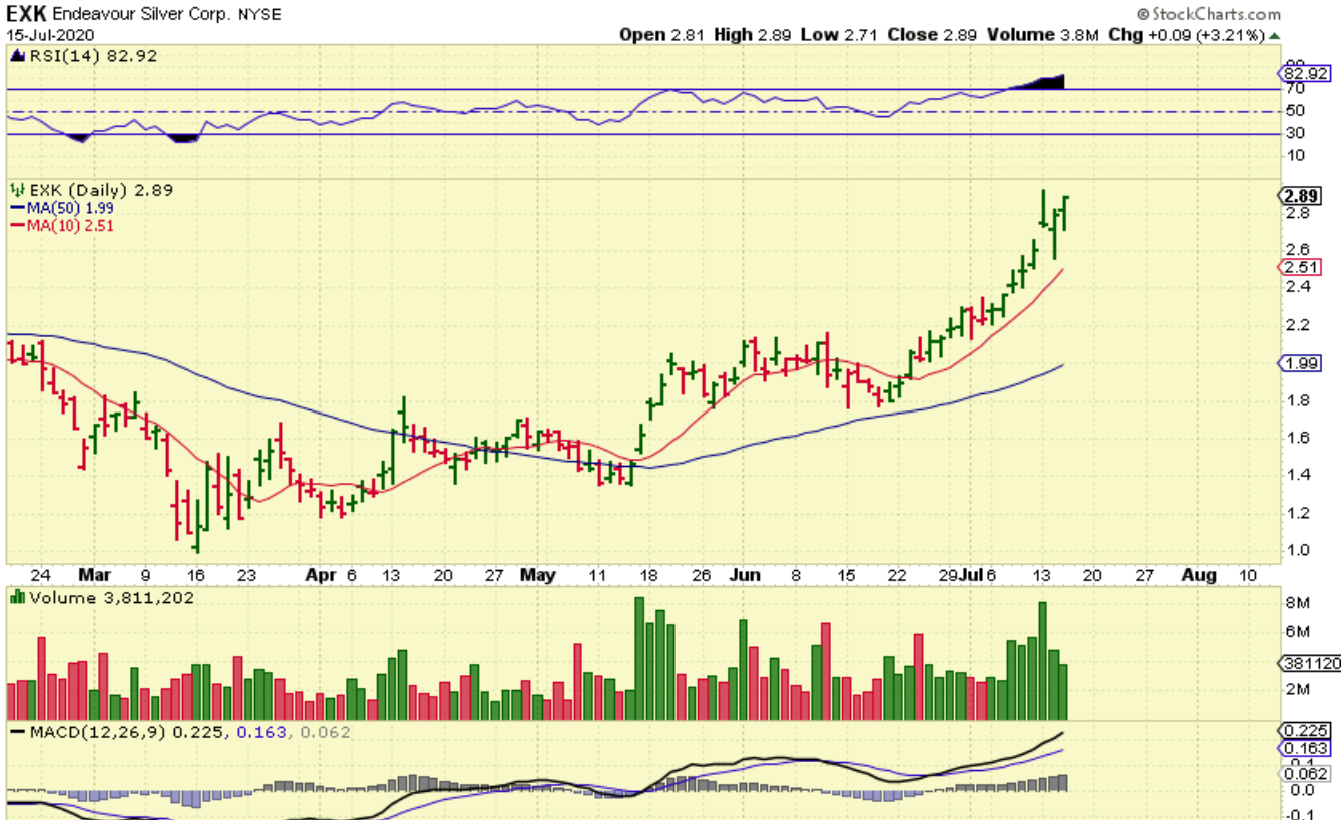
SILVER has been strong. It bottomed after Gold, so it and the Silver stocks are doing a nice job of playing catch up. Look at the chart and you’ll see Minimal dips from the recent day 40 lows. The last 2 weeks has been almost all green days or Red bullish candles.
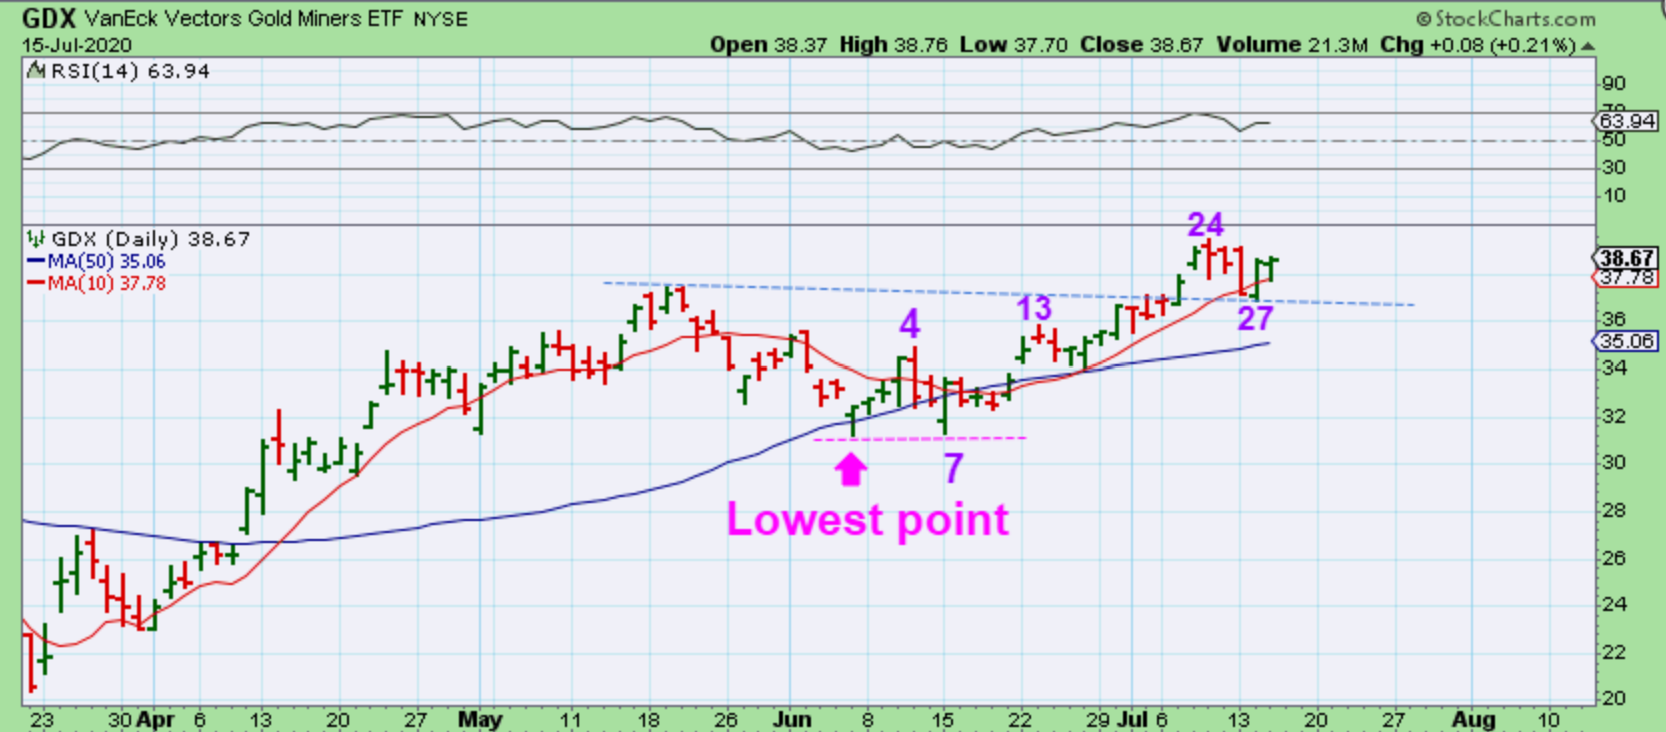
GDX formed a cup and has back tested it. This can be a high handle and a dcl may not even dip below that break out line, but instead form a slanted handle. Why? We are breaking from a bullish consolidation ( cup).
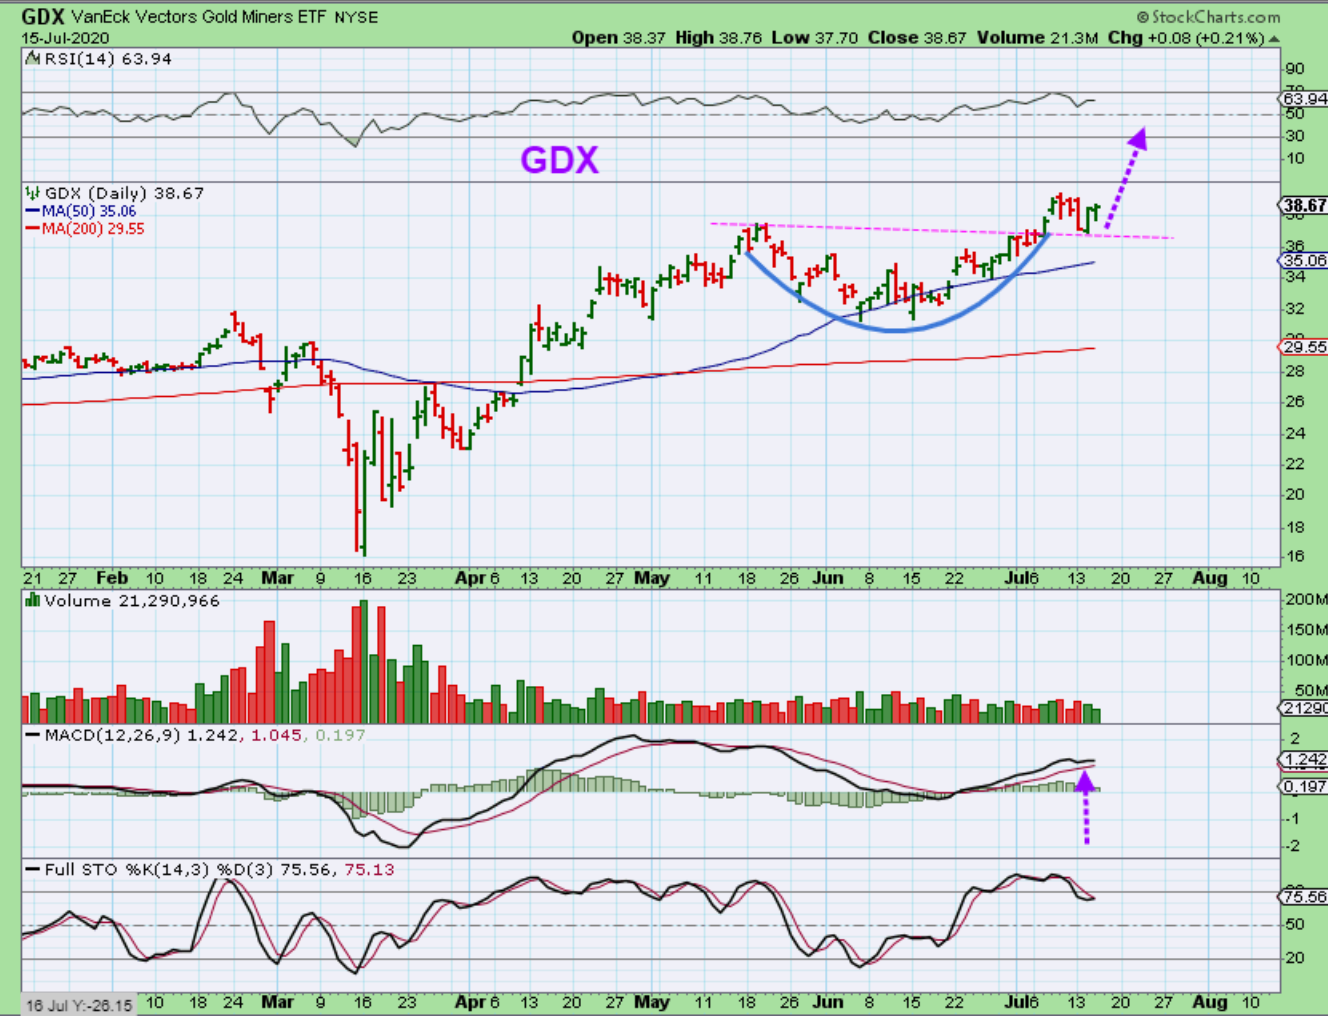
GDX – Zooming in we see a day 28 count off of the lows with 24 being the ‘peak’, and that is bullish ( R.T.). A handle could chop price & take this to roughly day 32ish low.
SILJ is a very similar set up as GDX & GDXJ. This is a 2 month consolidation breaking higher. So I wrote about Silver stocks yesterday…
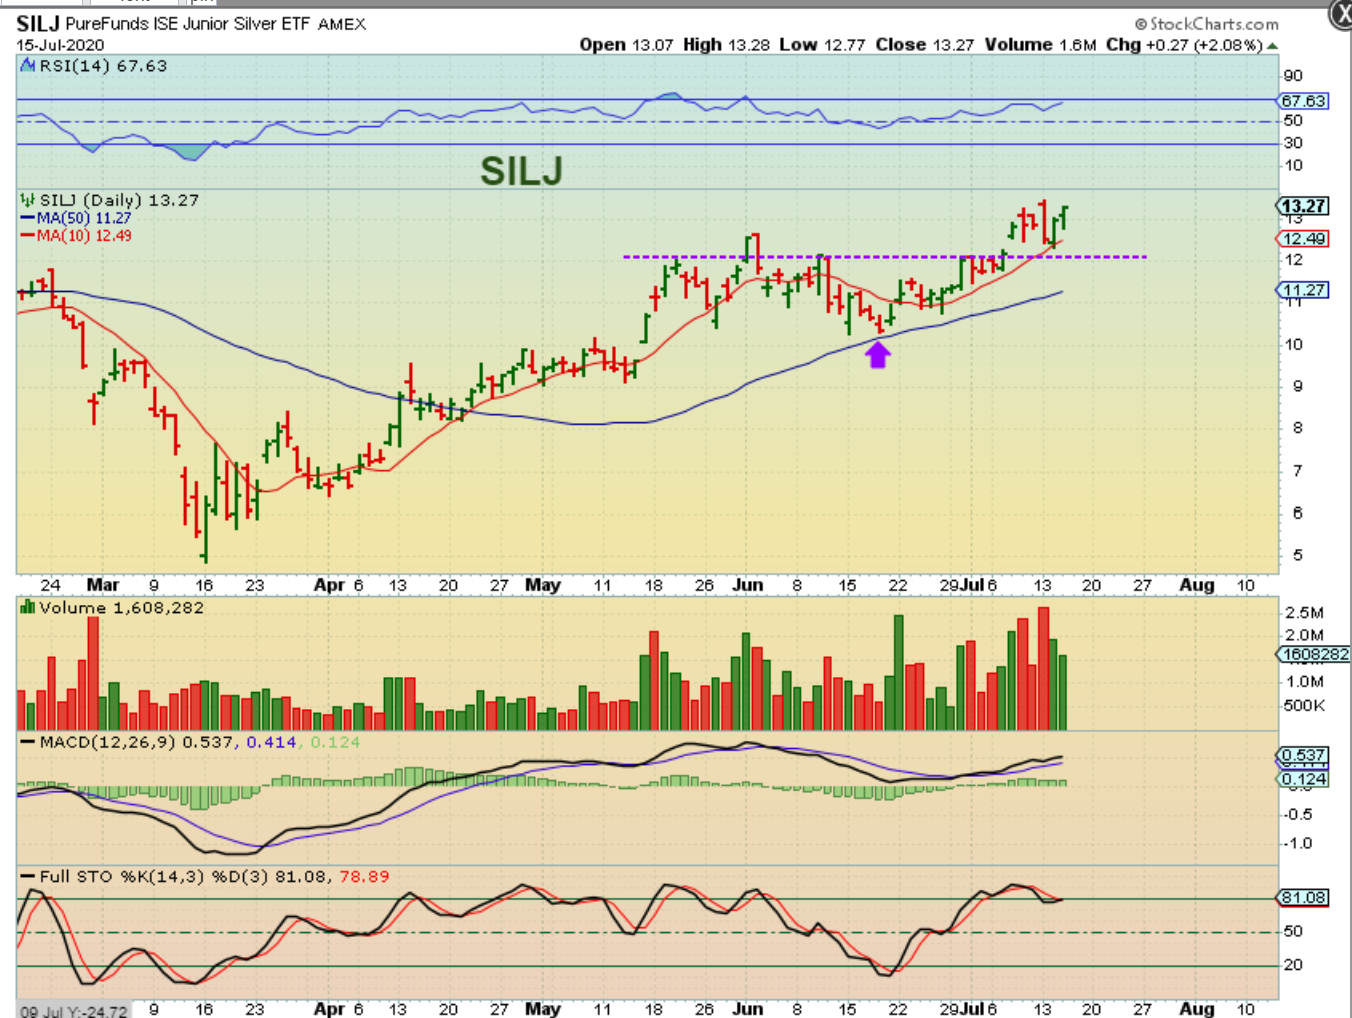
YESTERDAY I WROTE ABOUT SILVER STOCKS: You may recall that I said that SILVER & SILVER STOCKS BOTTOMED LATER THAN GOLD, so they may run longer. I have said that it may be best to use a stop under the 10sma and let the market take you out of the trade. So far you would still be in the trade…
.
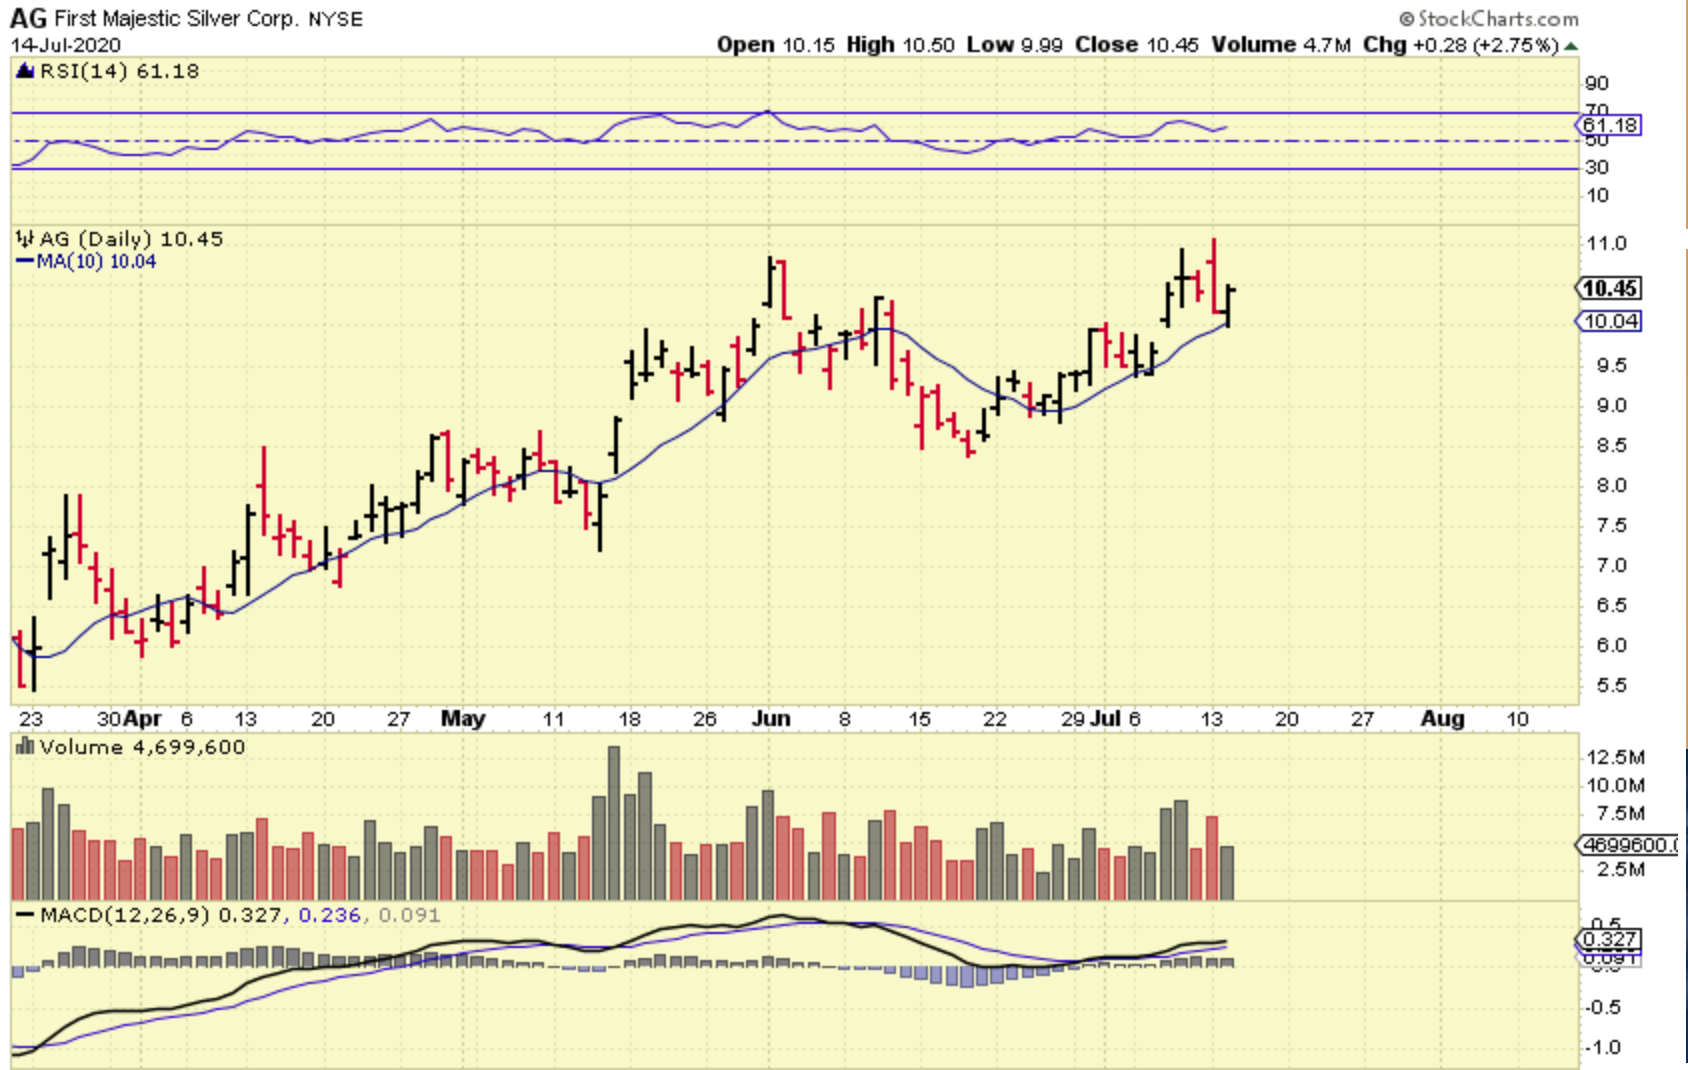
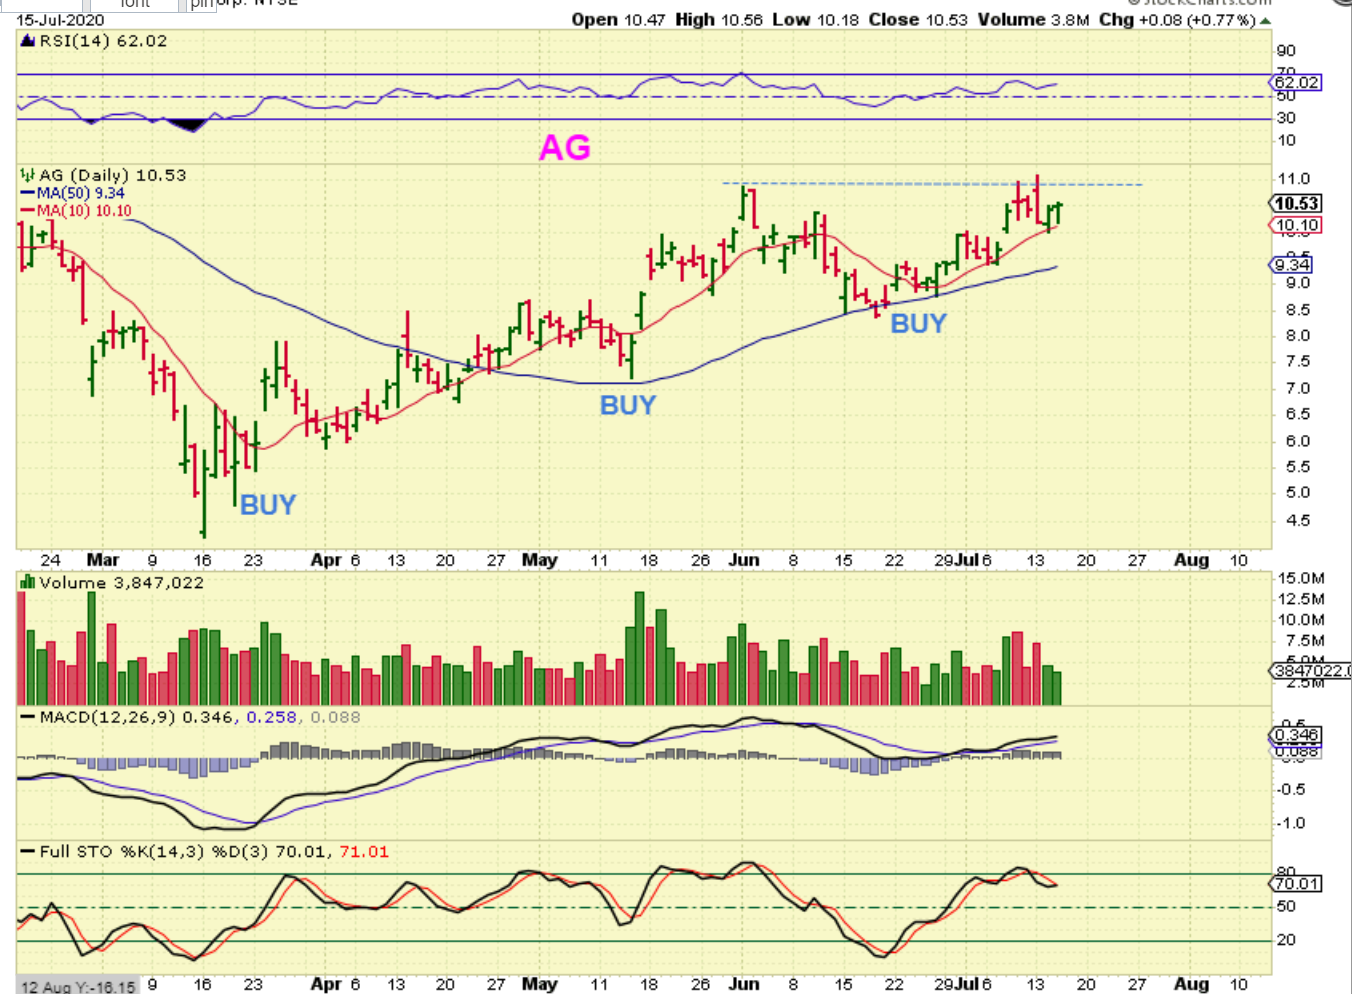
AG : Still be in the trade…
.
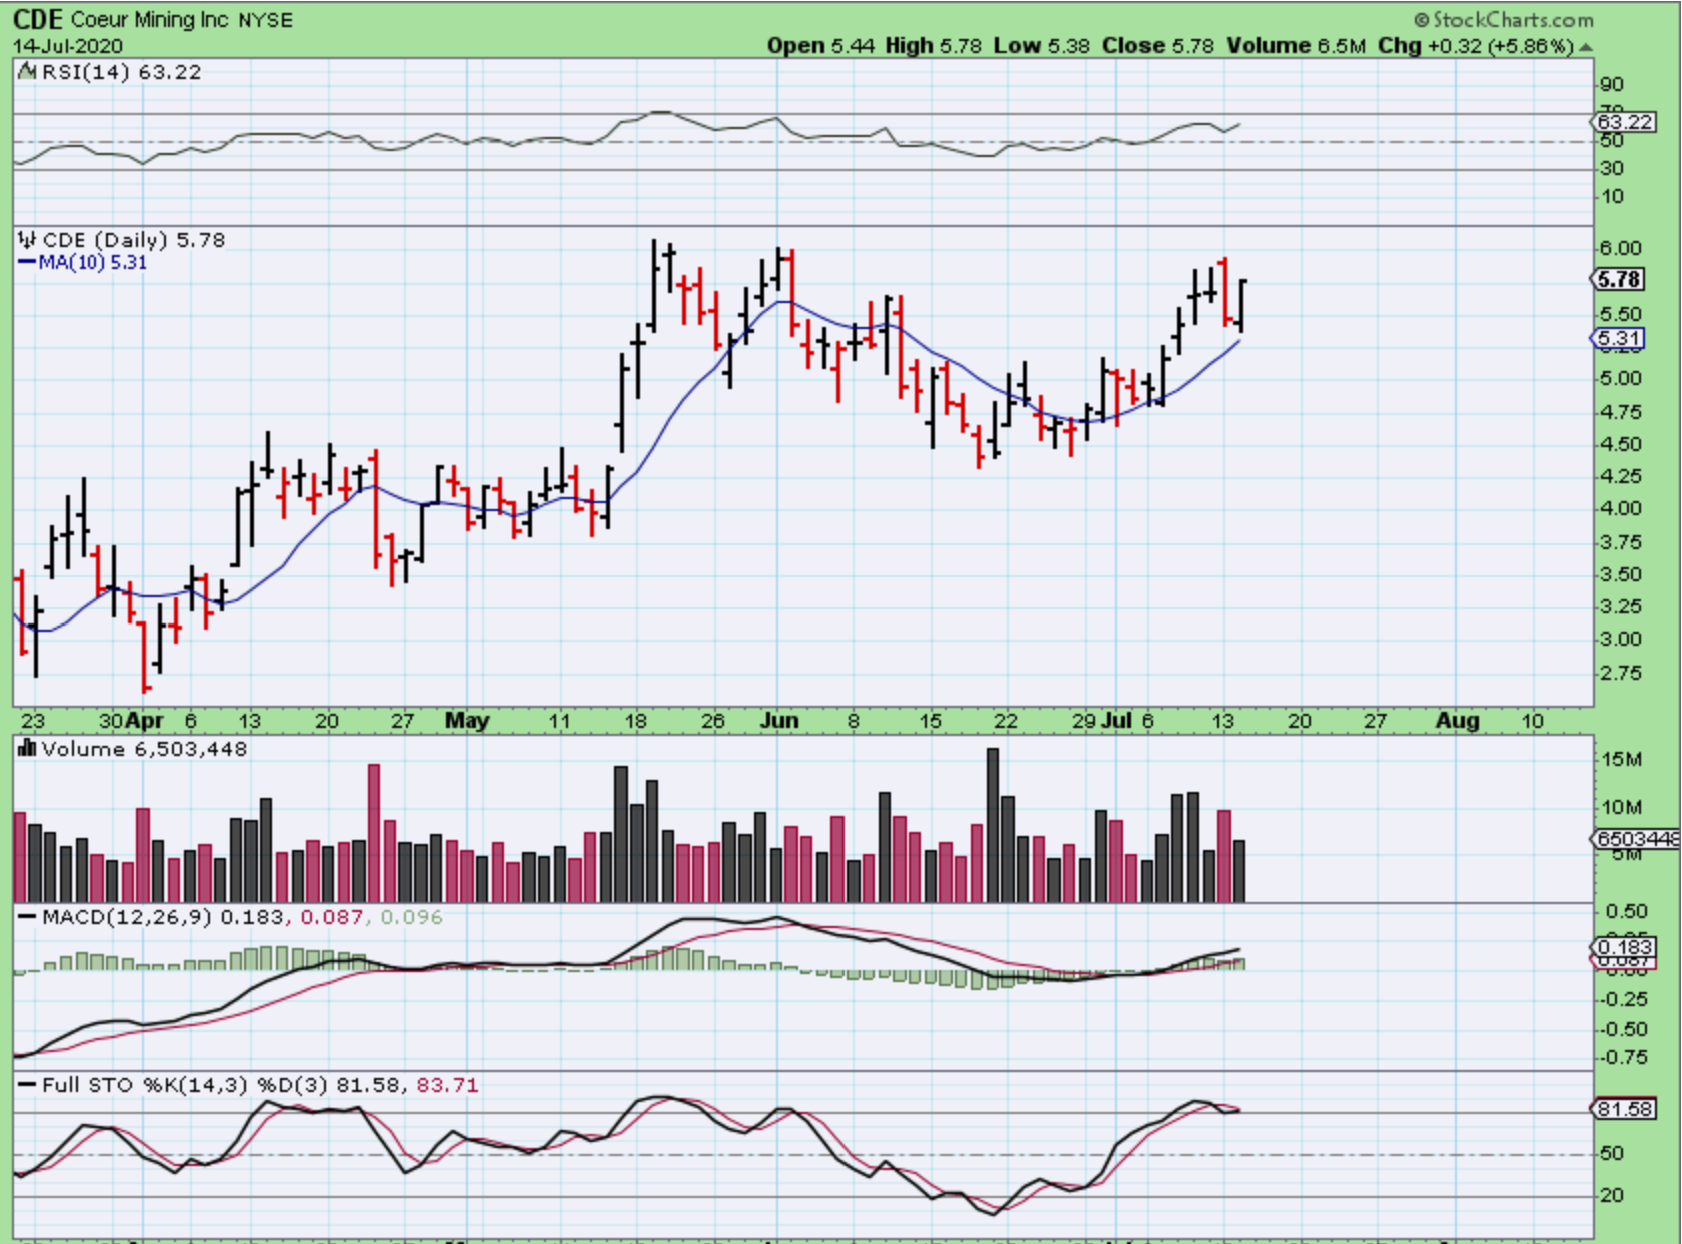
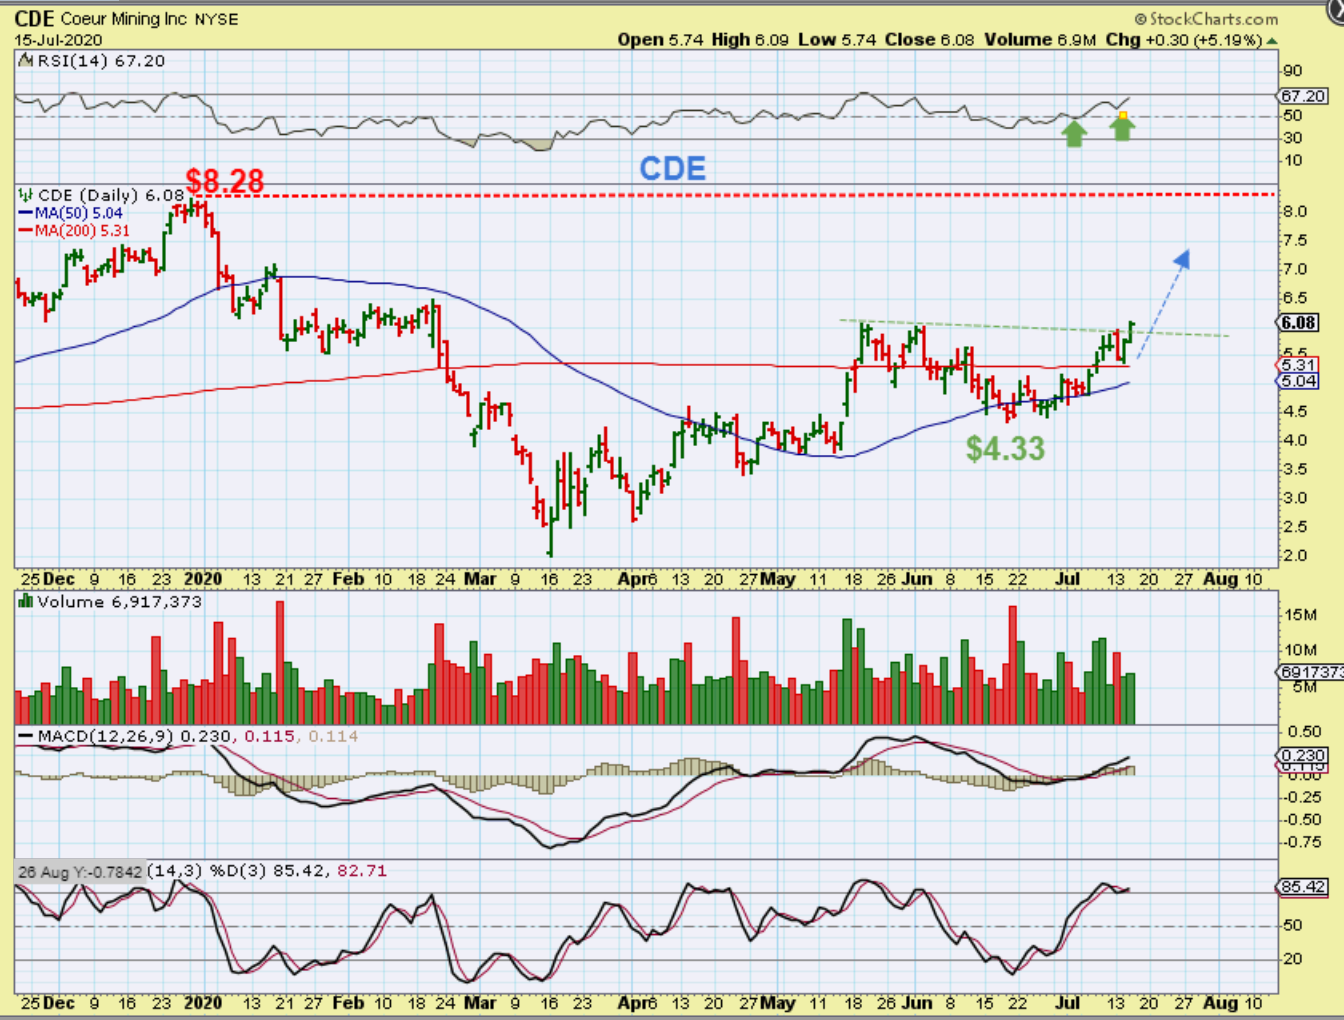
CDE : Still be in the trade…
.
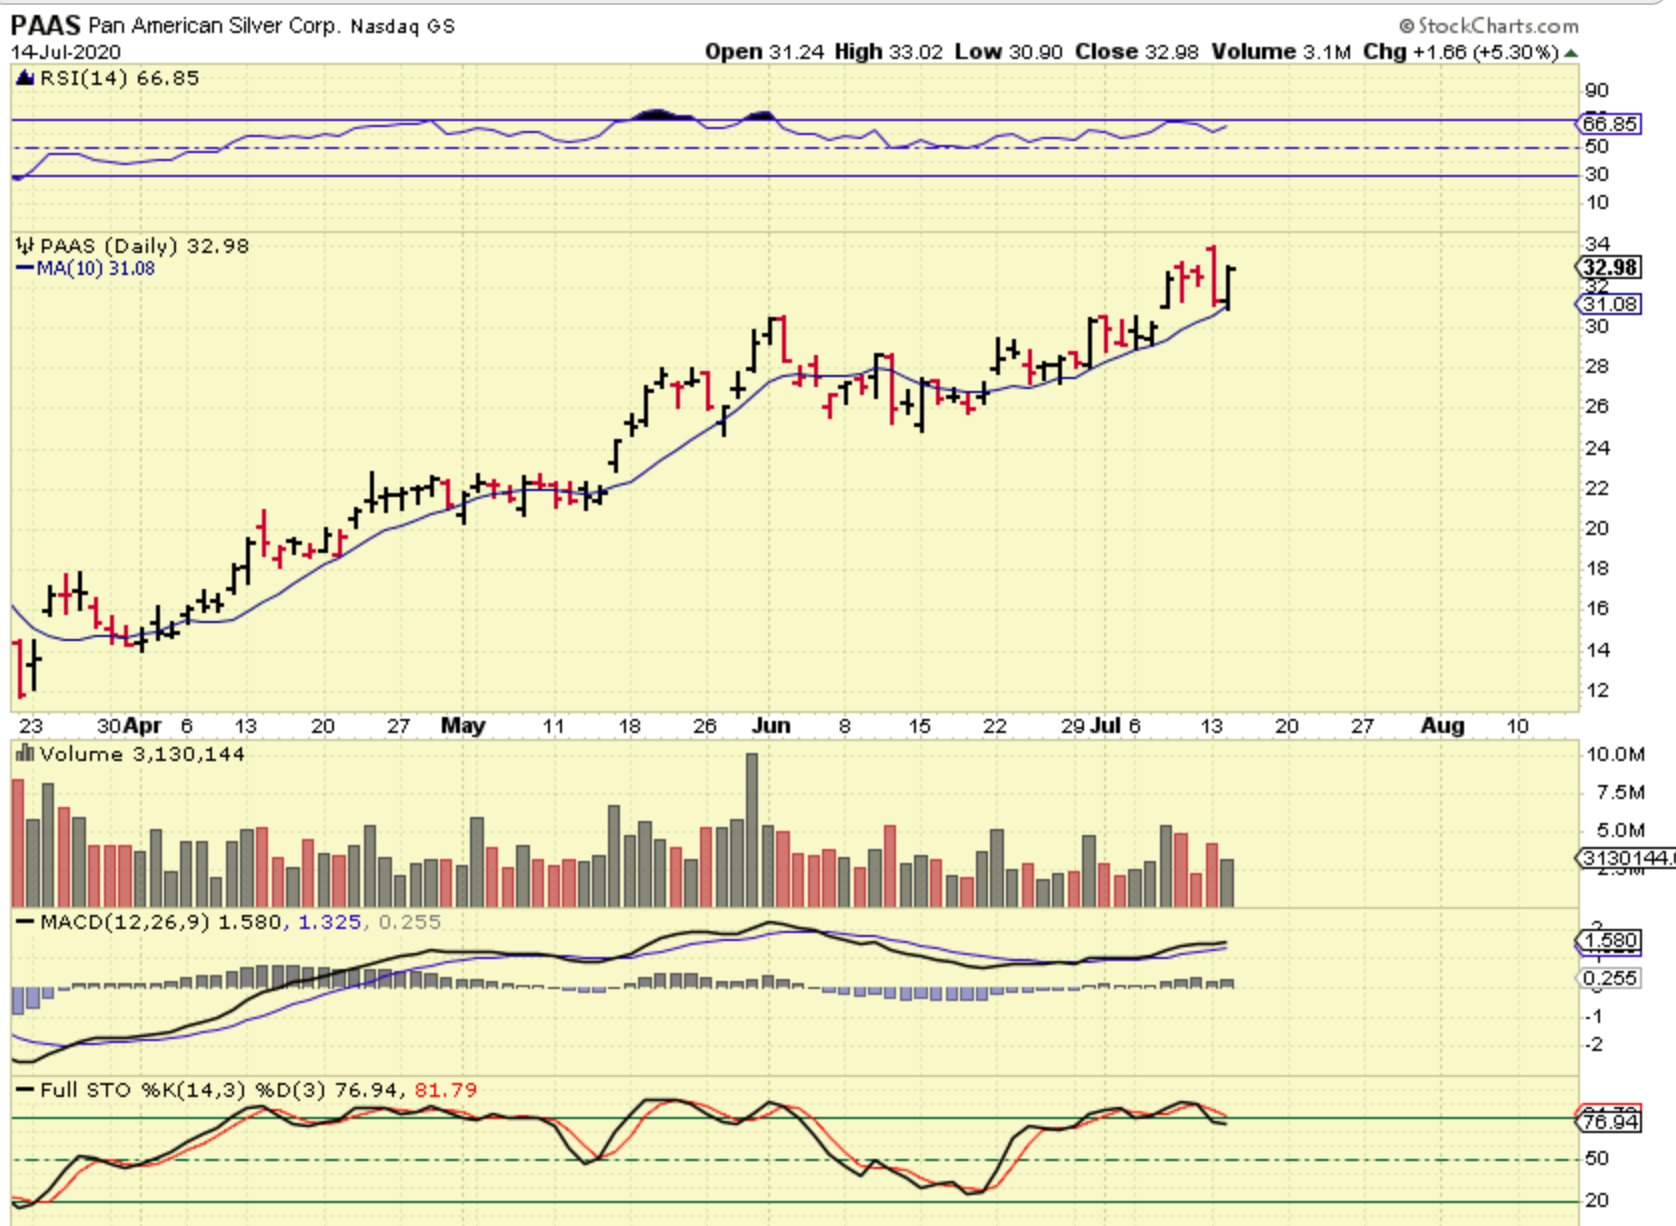
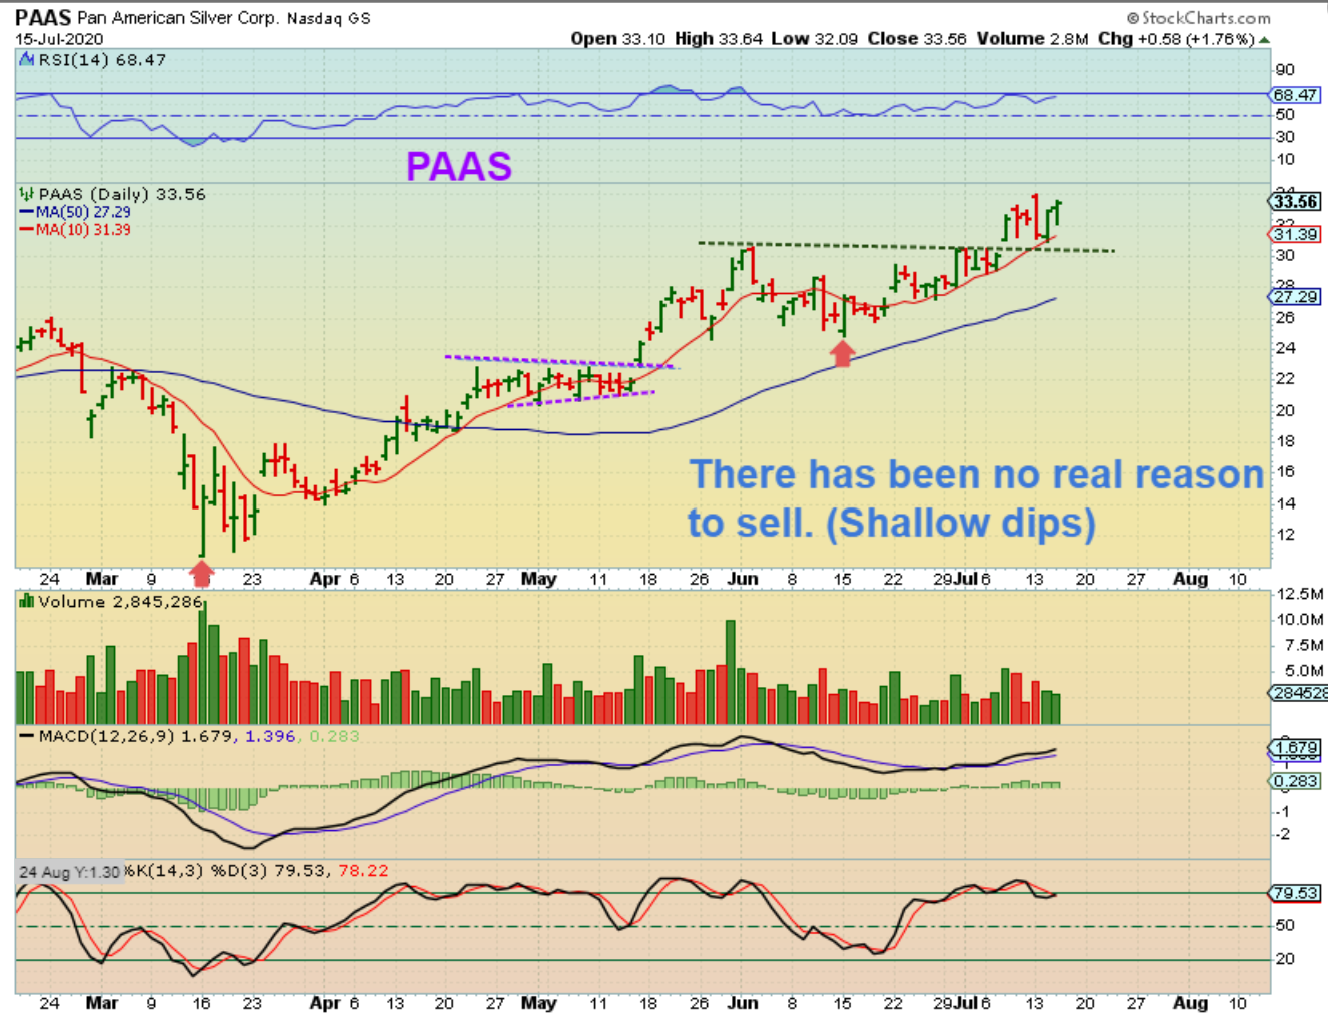
PAAS : Still be in the trade…
.
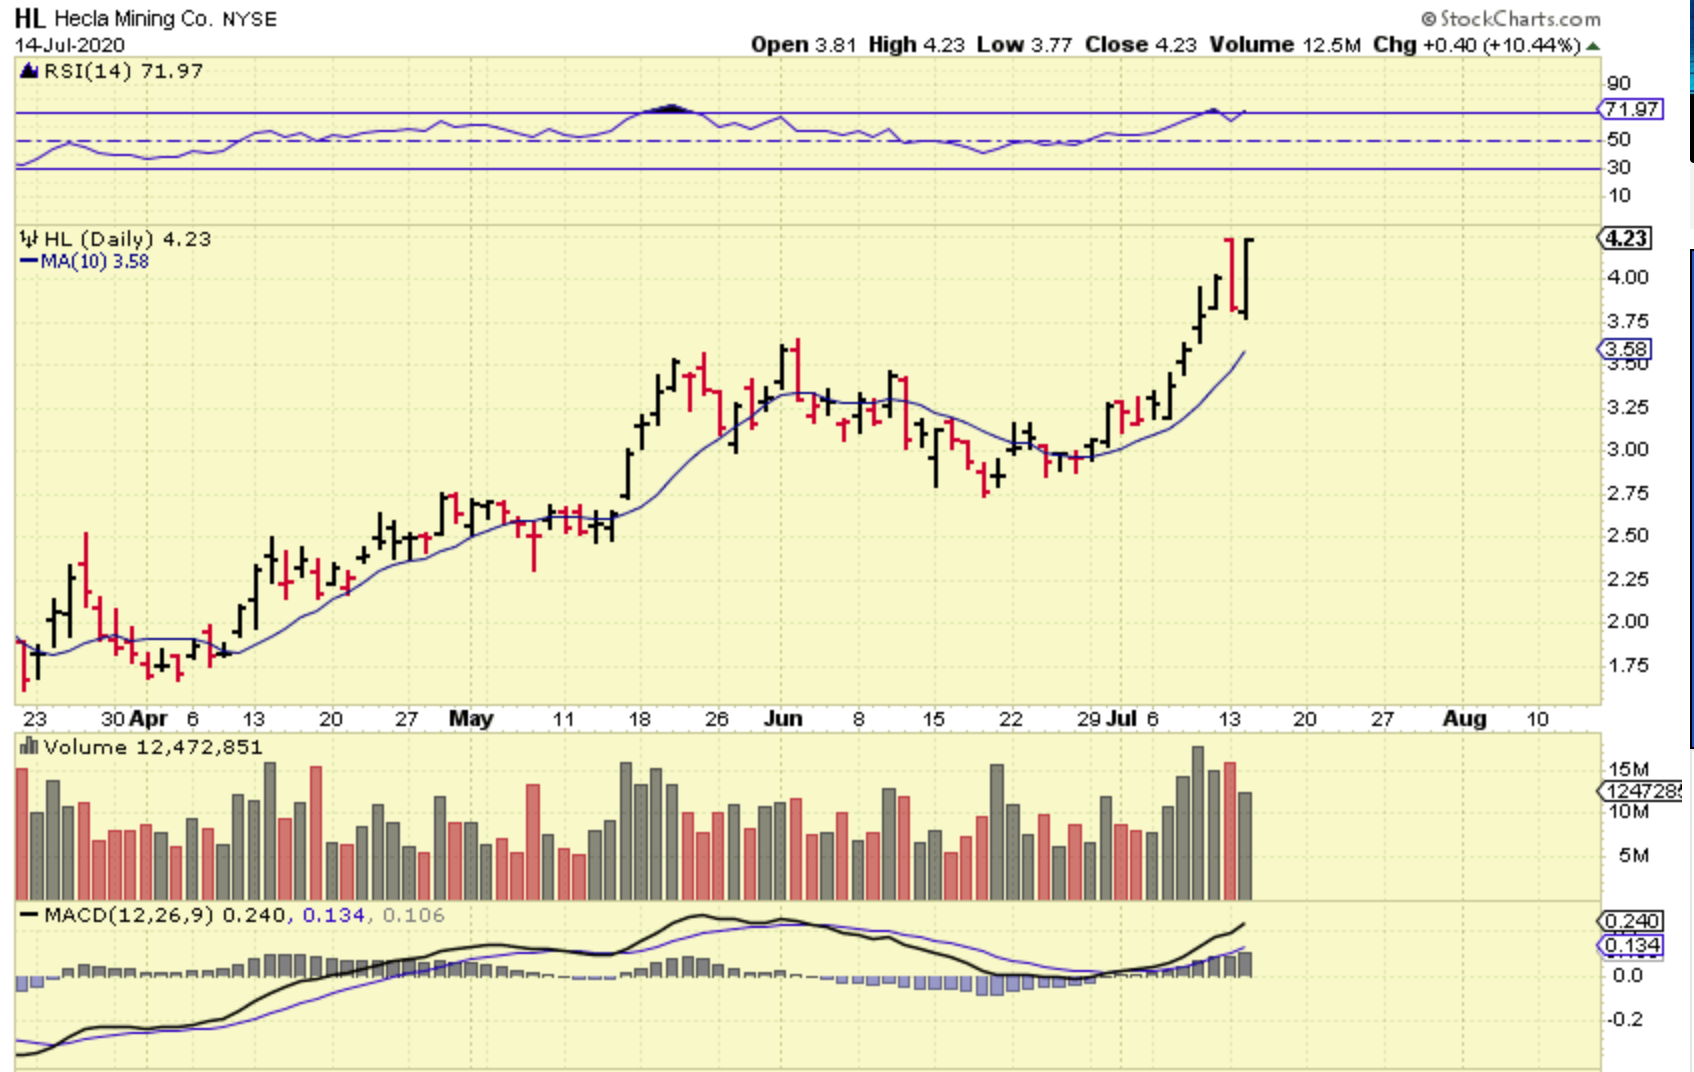
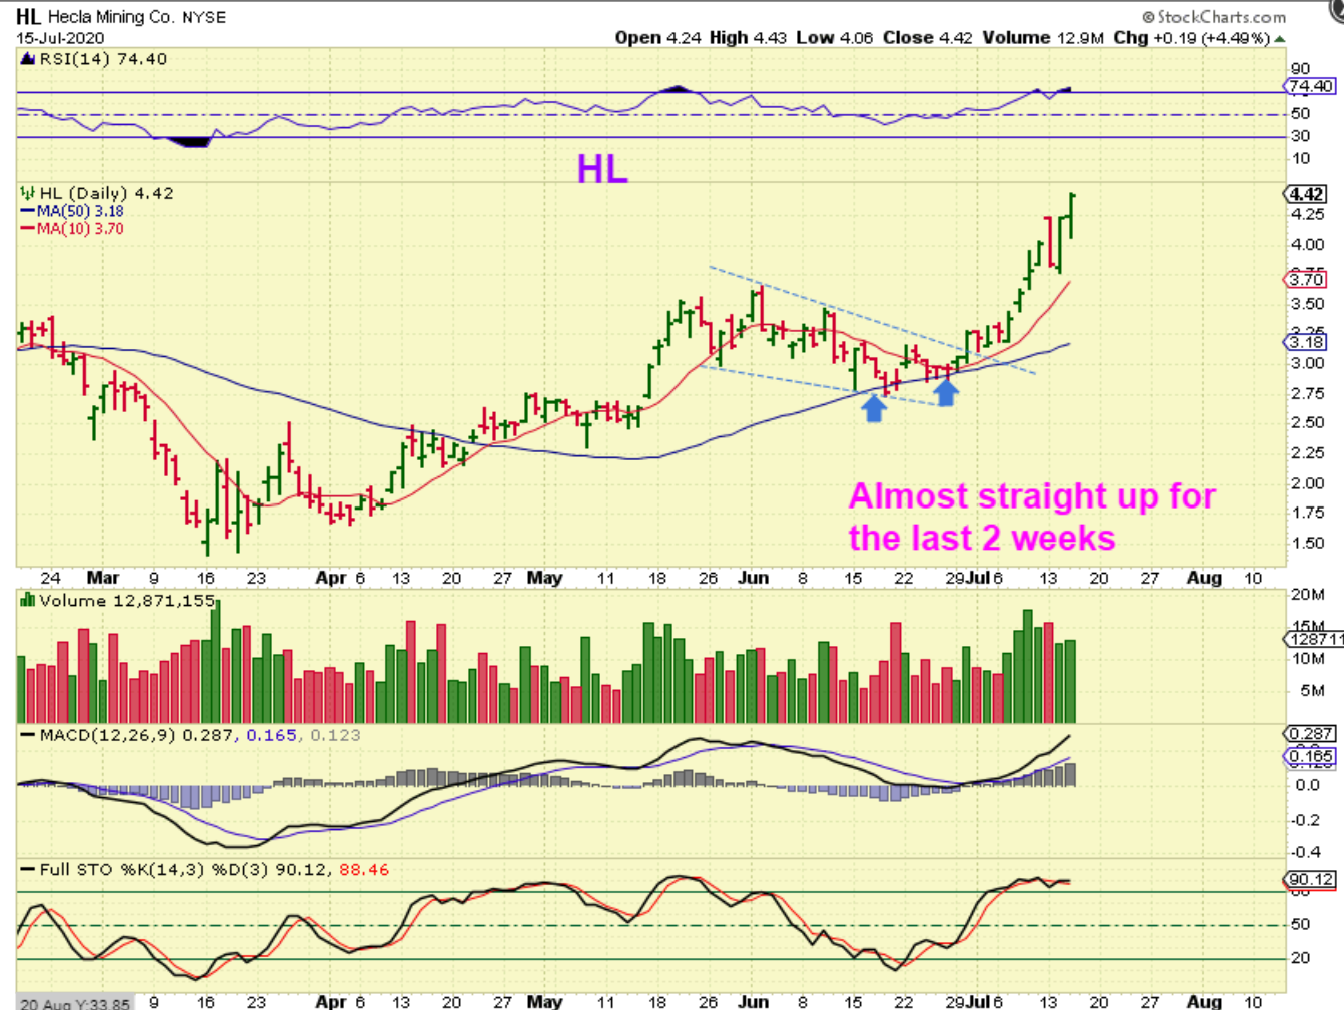
HL – Still be in the trade., and many other silver stocks are still acting bullishly at the 10 sma.
AG formed a cup and is simply in an uptrend. If we are due for a dcl in the next week or 2, it can just form a handle, or as an individual stock, it can just continue higher.
CDE broke above and back tested the 200sma recently. This was a buy in June at the 50sma & as it broke the down trend. CDE can run from that 44 point to $8+. See the chart.
.
EXK & HL have been almost straight up over the last 2 weeks. The volume is impressive in EXK. EXK is up over 50% in the last 3 weeks. Very Nice! A stop at the 10sma kept us in the trade.
HL has been running higher over the past 2 weeks too. This was a BUY at the 50sma & also 2 weeks ago as it broke the down trend line.
PAAS – Another bullish cup , those that bought PAAS weeks ago should also still be in the trade since the back test didn’t break the 10sma.
.
The Silver stocks are performing like a BULL RUN should, right? Well, I am going to discuss a few trades below, and the Uranium Stocks that I mentioned as a buy are looking VERY GOOD. They can put in a run similar to the Silver stocks, so if you have enjoyed those Silver stocks, you may want to enter a Uranium trade or 2.
,
Enjoy your Thursday trading!
.
~ALEX
.
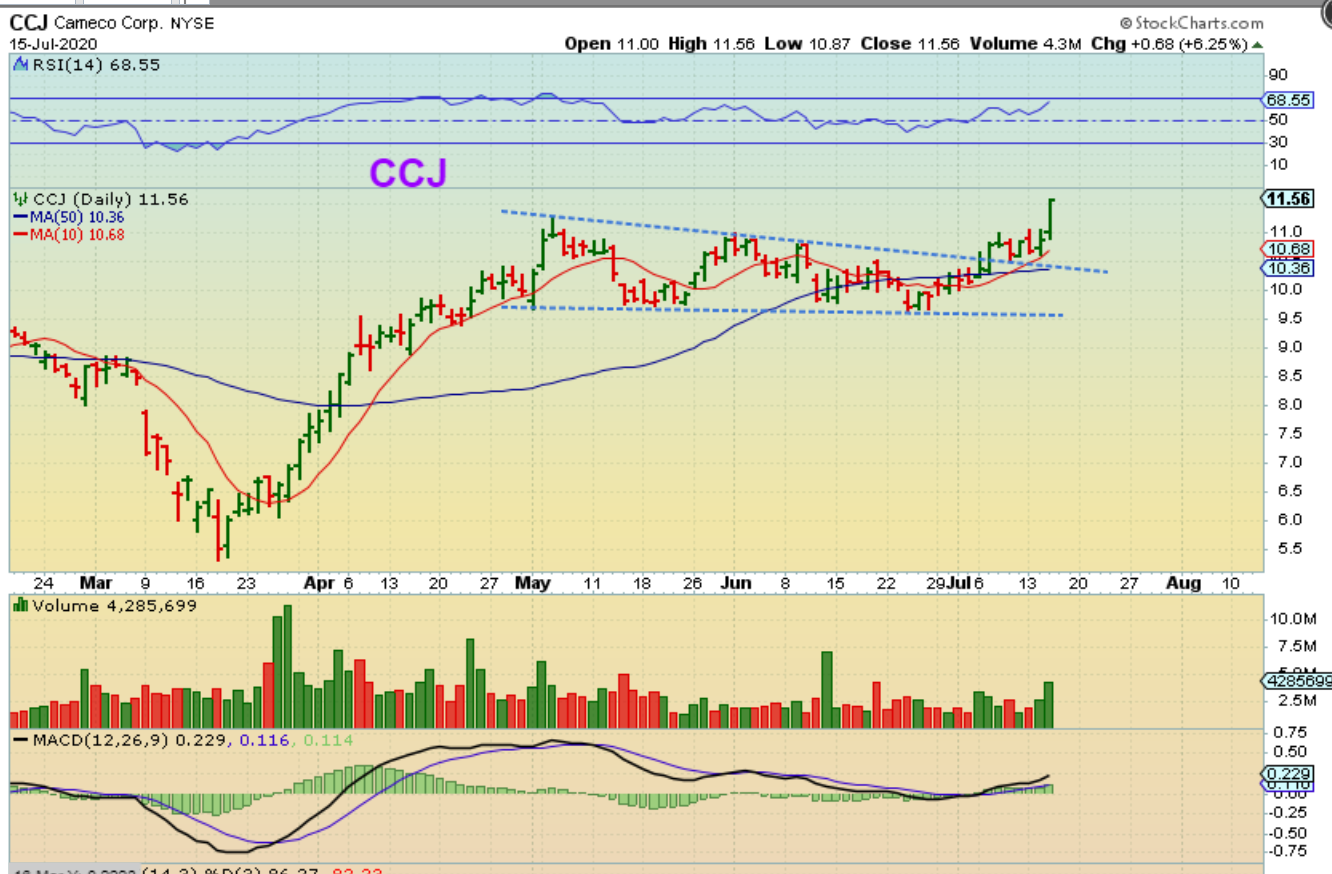
CCJ was a buy above the 50sma, and yesterday it gained another 6%. After a 2+ Month consolidation, these can run swiftly. Look at the March run day after day higher. Volume is bullish.
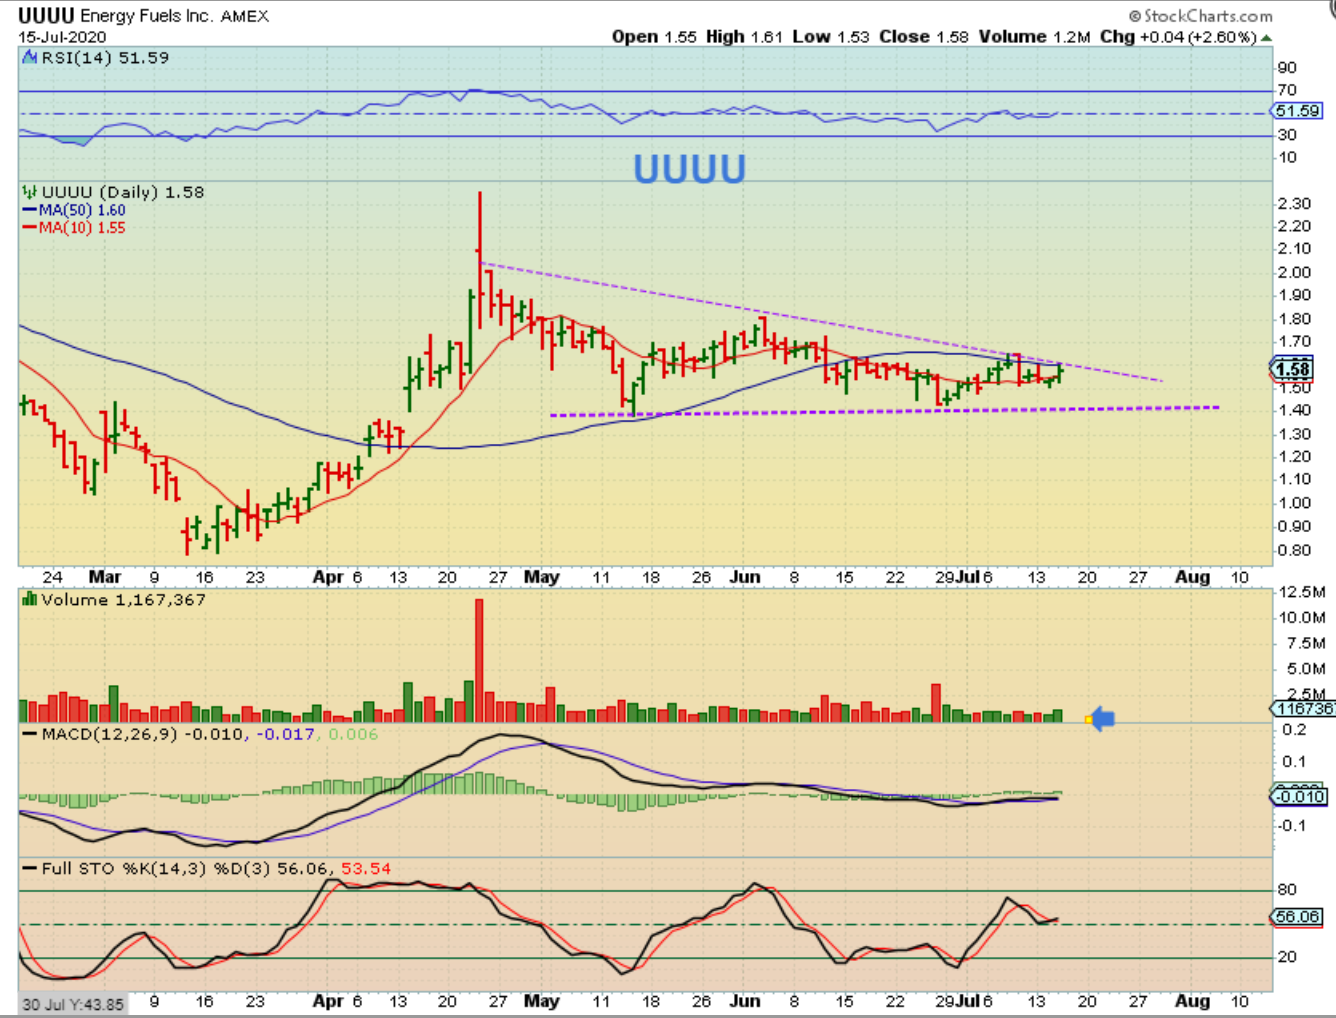
UUUU -Looking for a bullish set up that is still in the consolidation? UUUU was pointed out. This is a buy with a stop under the June lows. This looks ready to break out above the 50 sma Real Soon.
NXE – This is also a buy at the 50sma and it popped on strong volume. DNN is also ready to break a down trend line & Looks bullish, so this is a good looking sector.
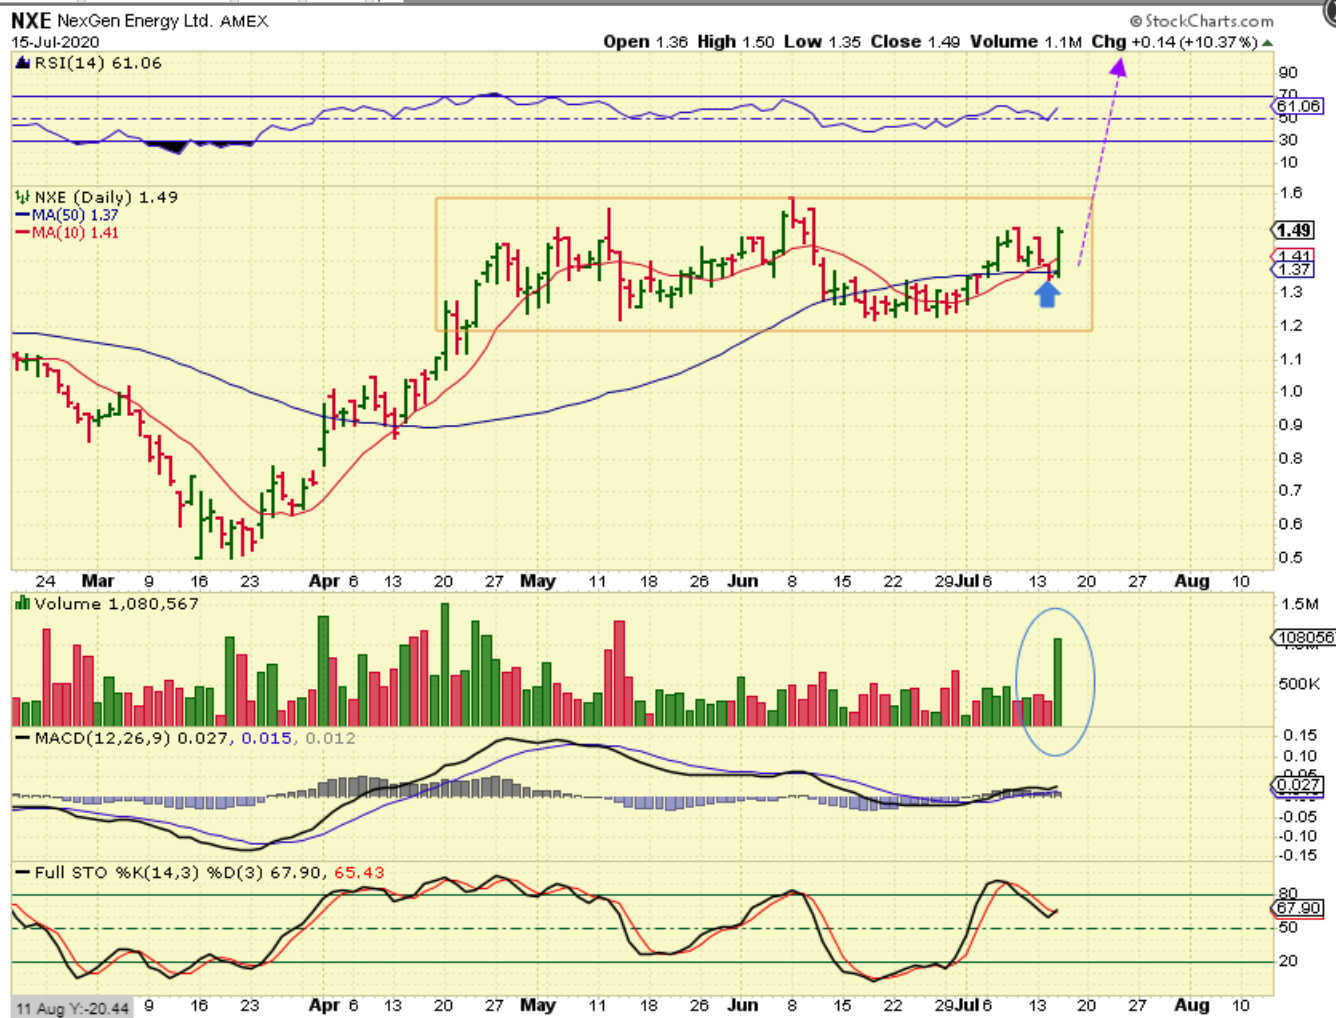
MANY URANIUM STOCKS LOOK BULLISH AFTER THAT 1ST RUN UP & CONSOLIDATION.
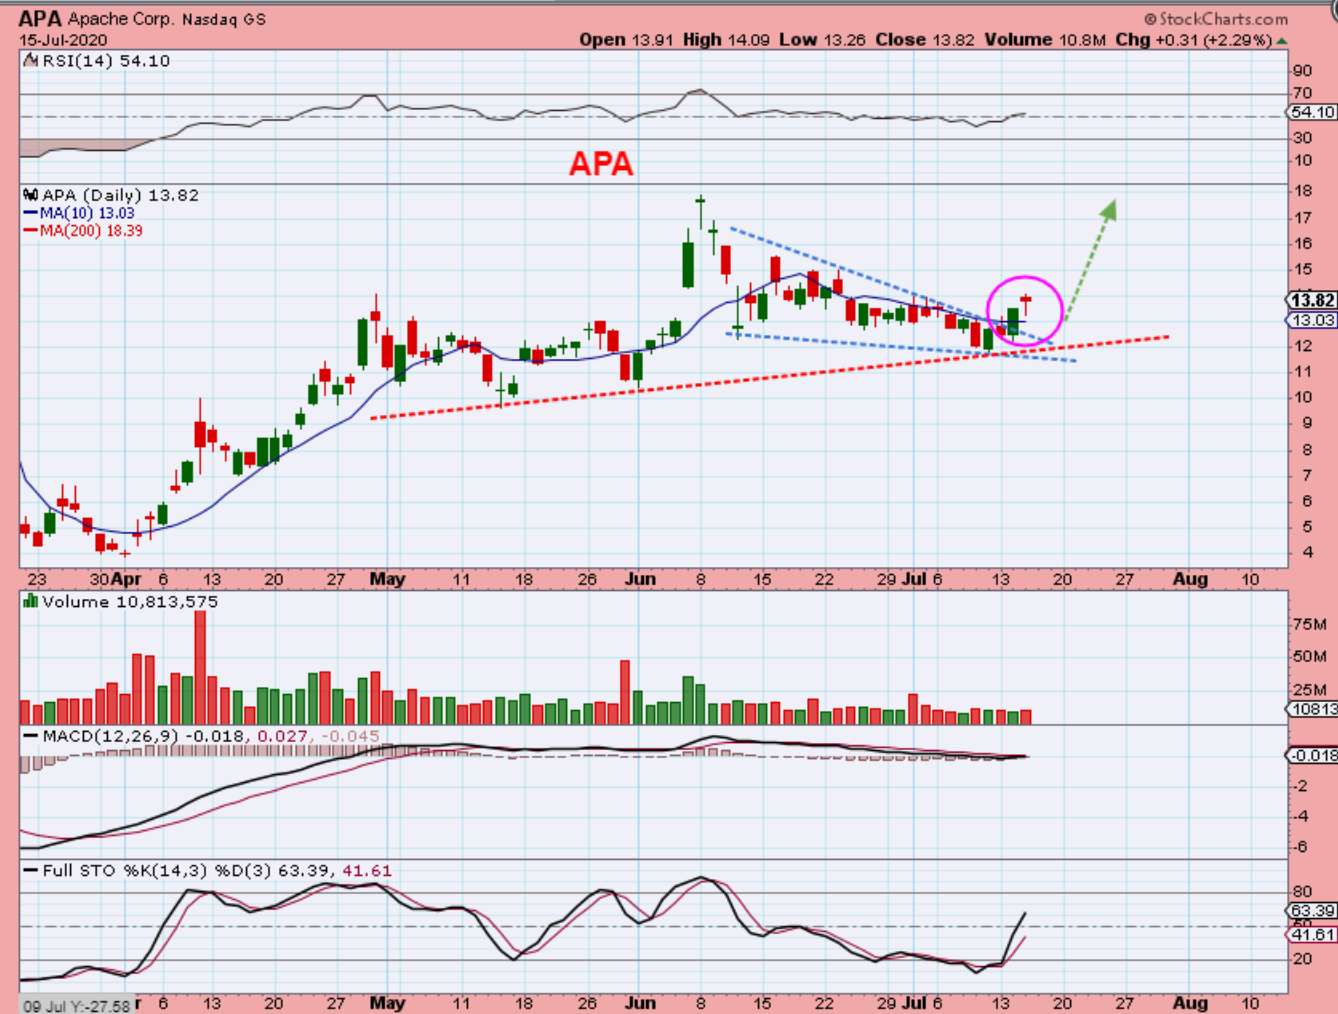
APA -I have been pointing out several Energy stocks that are now breaking out. I see OIL down in pre-market, so maybe they back test the break out? If so, add if they drop & reverse off of the support area. This now looks bullish and these can run & make great gains. This SMALL 4 day move is already $12 to $14. If it dips to $13, you can get $13 to $18+.
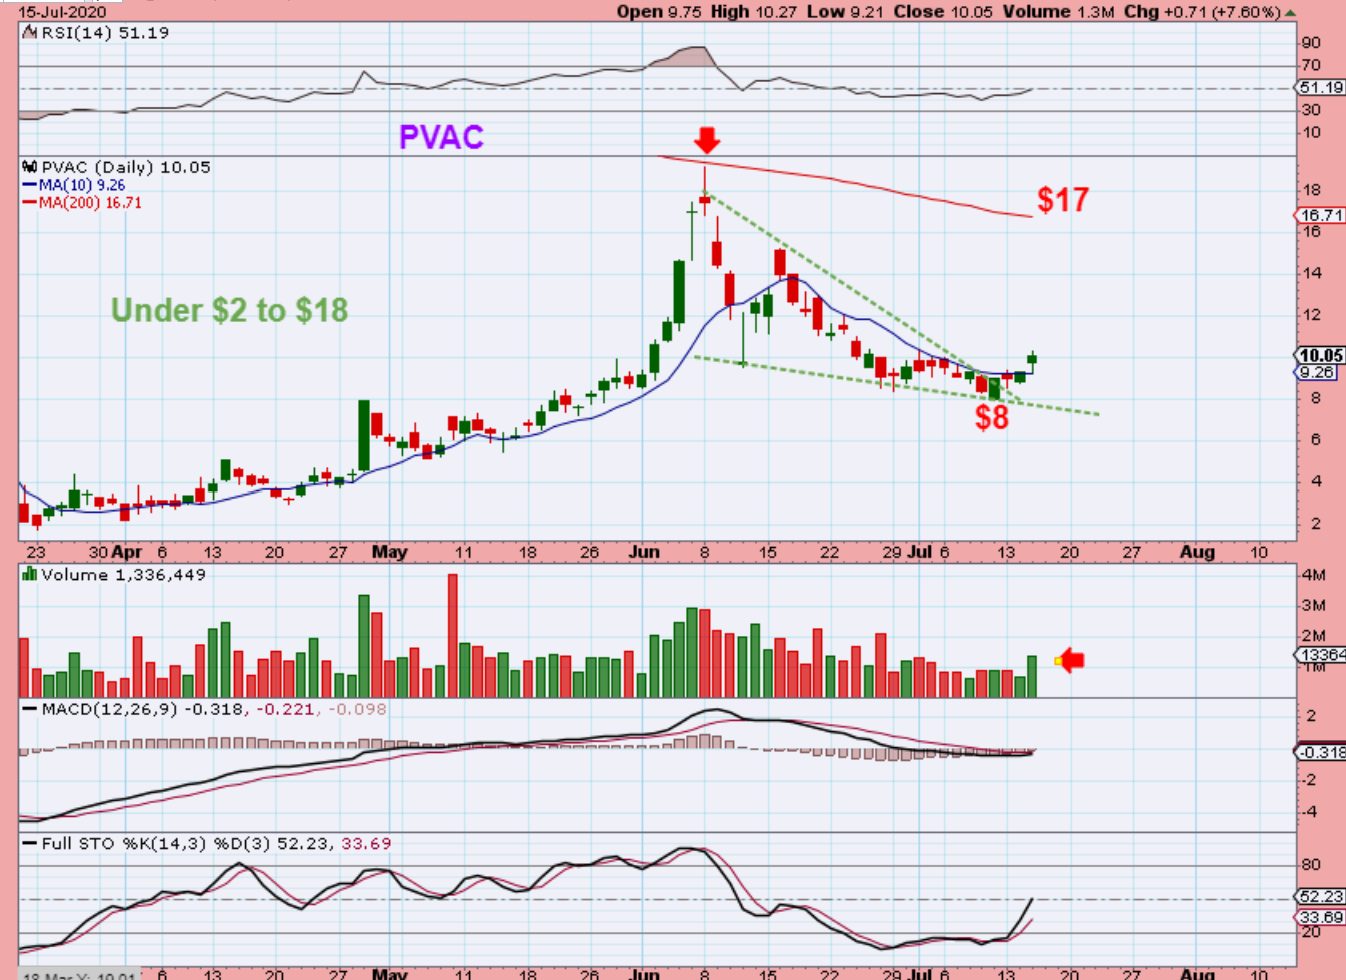
PVAC broke above the 10sma yesterday and it did an $8 to $10.27 move already, but this has much more upside if these get going. PVAC also has that 5 wave down look to it. I’d like to see 1-2-3-4-5 up. A tag of the 200sma again is almost 100% gains.
.
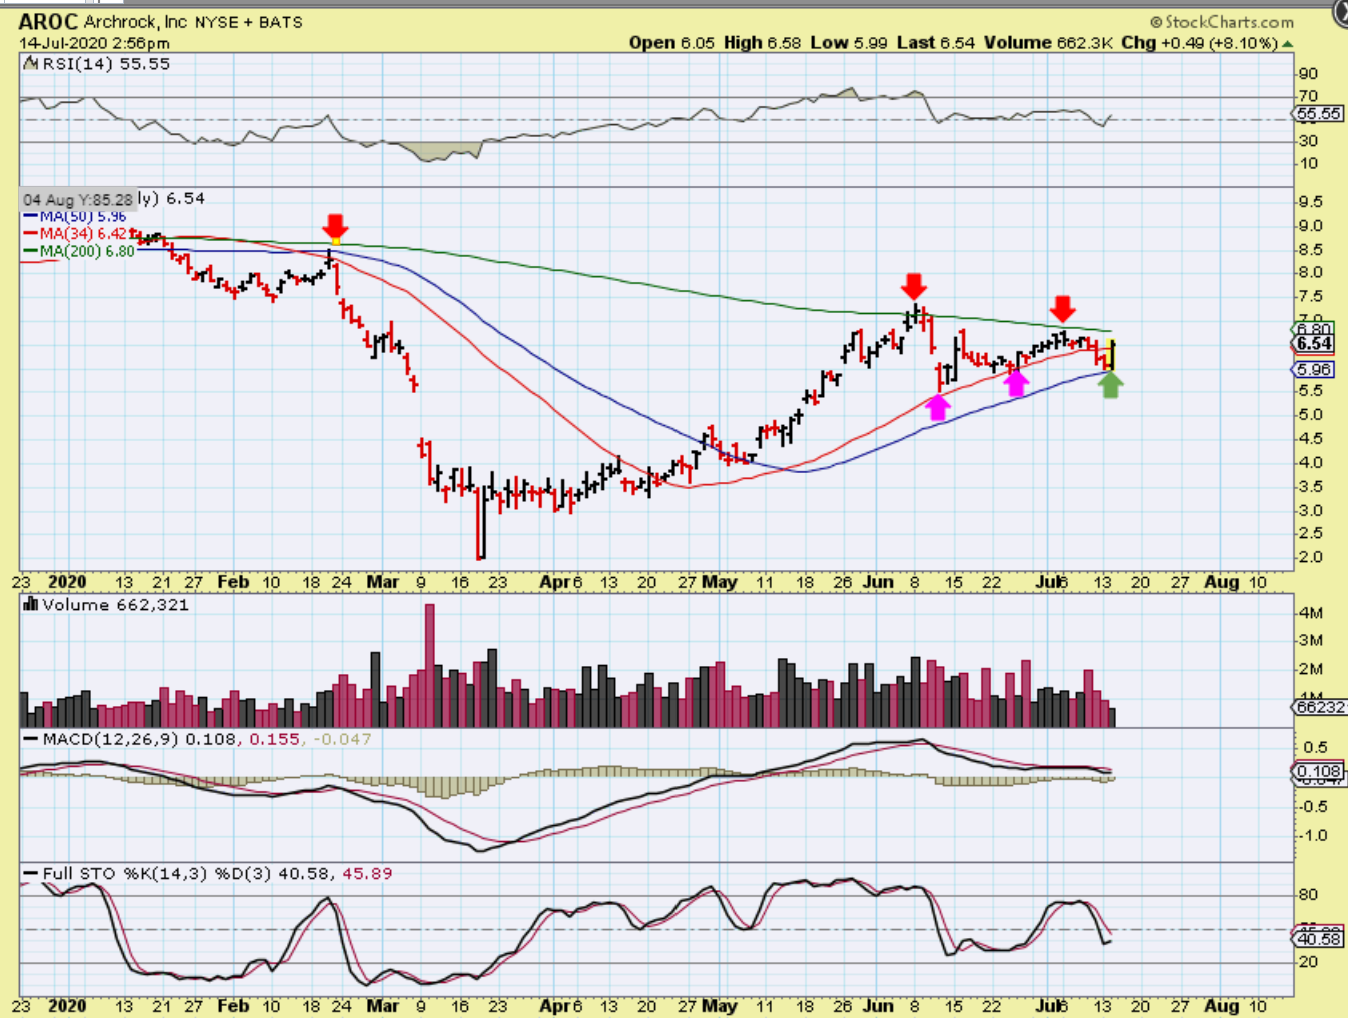
YESTERDAY I mentioned AROC as it reversed off of the 50sma. When I grabbed this chart, it was up 8% and looks excellent, as it approaches that 200 sma. It finally closed up 10% and is pushing on that 200sma. This ran from $2 to $7.50. EDIT: YESTERDAY IT CLOSED SLIGHTLY ABOVE THAT 200sma.
.
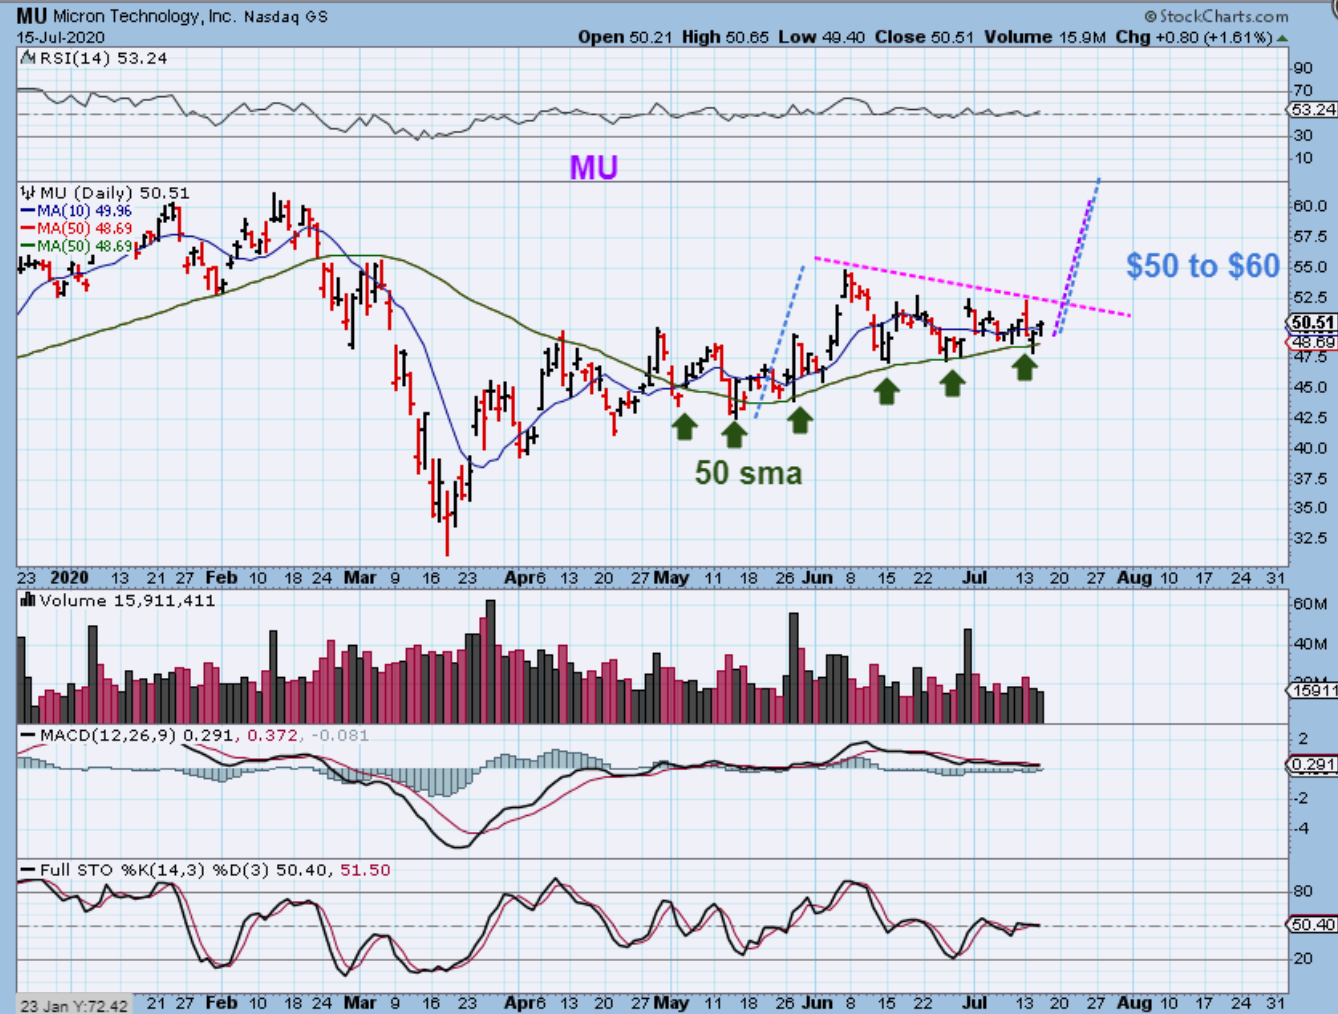
MU -I would be a bit more cautious with the Nasdaq forming that Bearish Engulfing Tuesday, but the semiconductor stocks AMD, MU, TSEM all still look bullish. I SEE RED FUTURES as I write Thursday morning, so if this drops to that 50 sma again, watch it for a reversal. If it breaks down, just keep it on a watch list. Tuesday it slightly broke the 50sma & recovered.
.
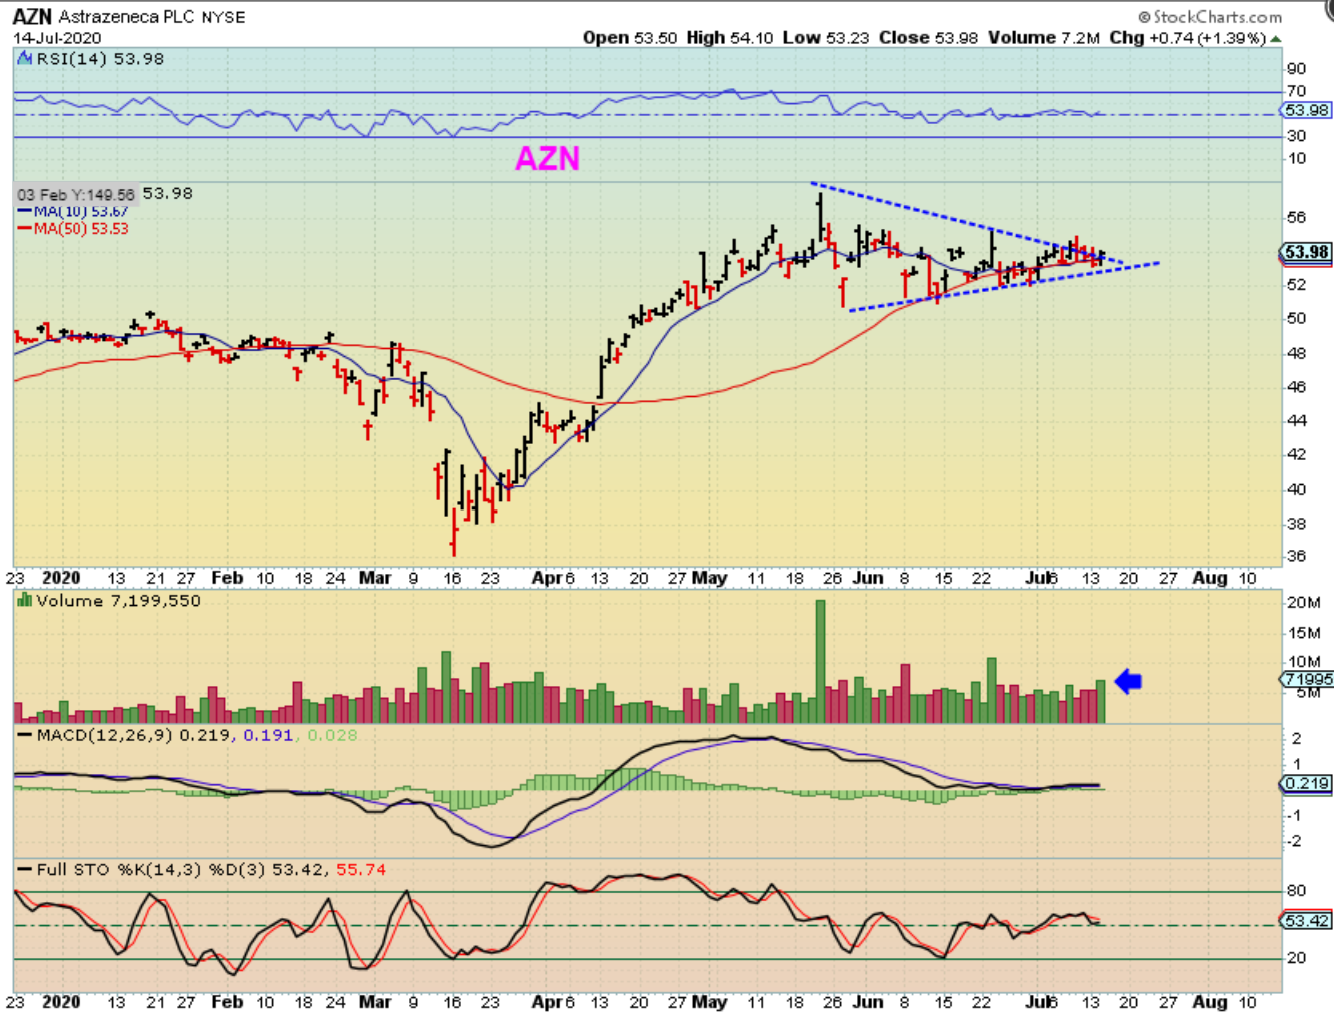
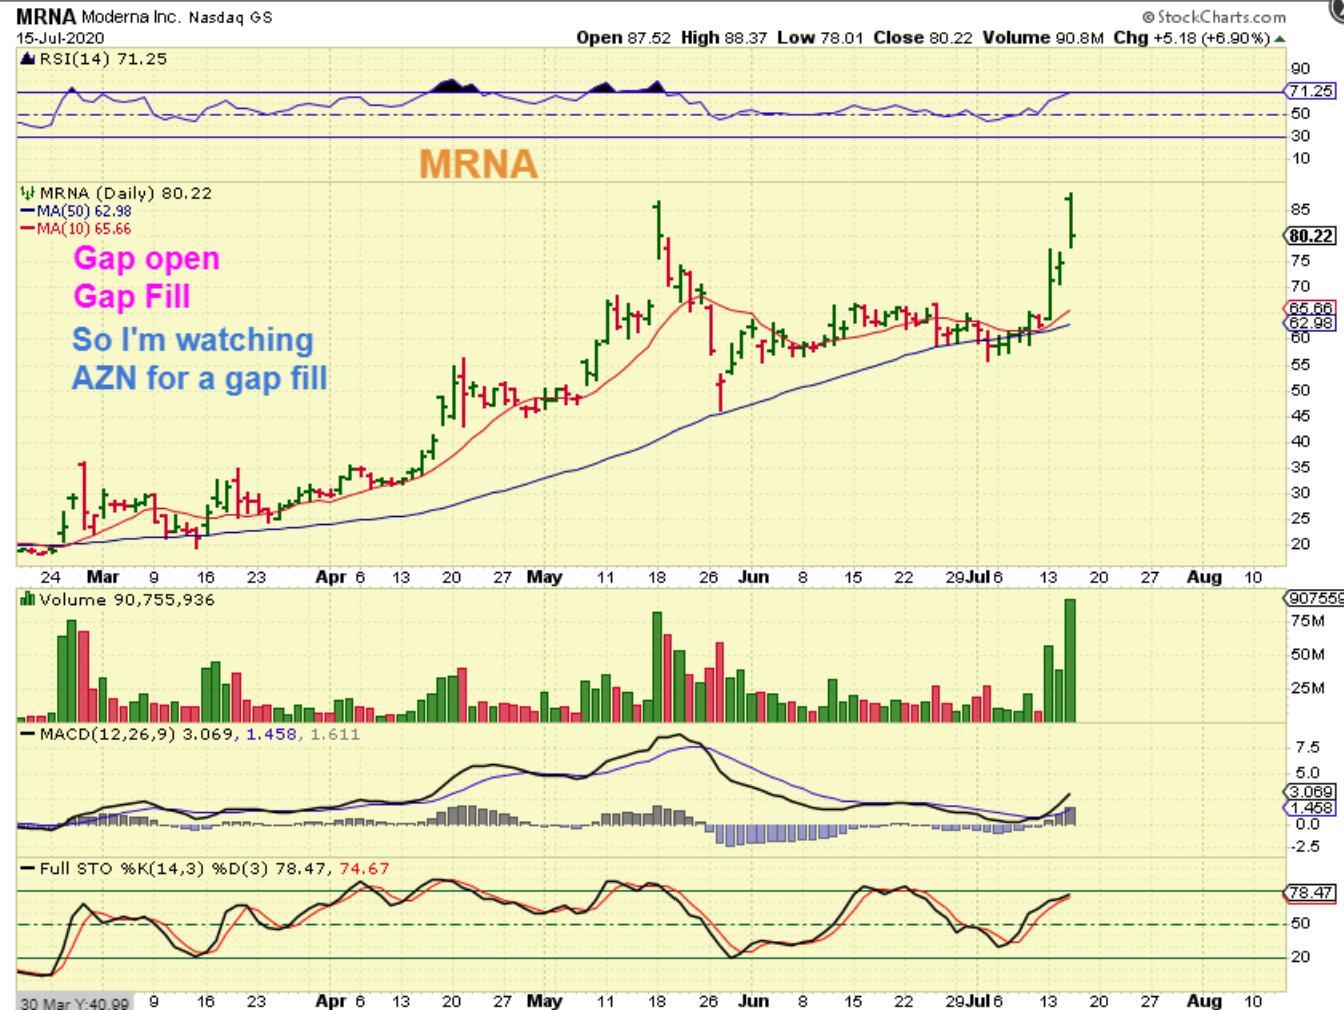
I WAS GOING TO PUT THIS AZN CHART IN YESTERDAYS REPORT AS A BUY SIMILAR TO RECENT BNTX & MRNA SET UPS. I THEN SAW MRNA AND AZN BOTH GAPPING HIGHER ( COVID VACCINE PLAYS) PRE-MARKET YESTERDAY, SO I DIDNT USE THIS CHART. SO WHY IS IT IN THIS REPORT? LET’s DISCUSS THAT…
.
AZN TUESDAY – This was perfect and since BNTX & MRNA both popped, I expected this one to also.
AZN WEDNESDAY -It took off higher in pre-Market when MRNA was up 16% and it gapped open & ran up 7%. This CAN just keep running, but if it dips , you may want to try to buy it on a pull back, and I posted this because…
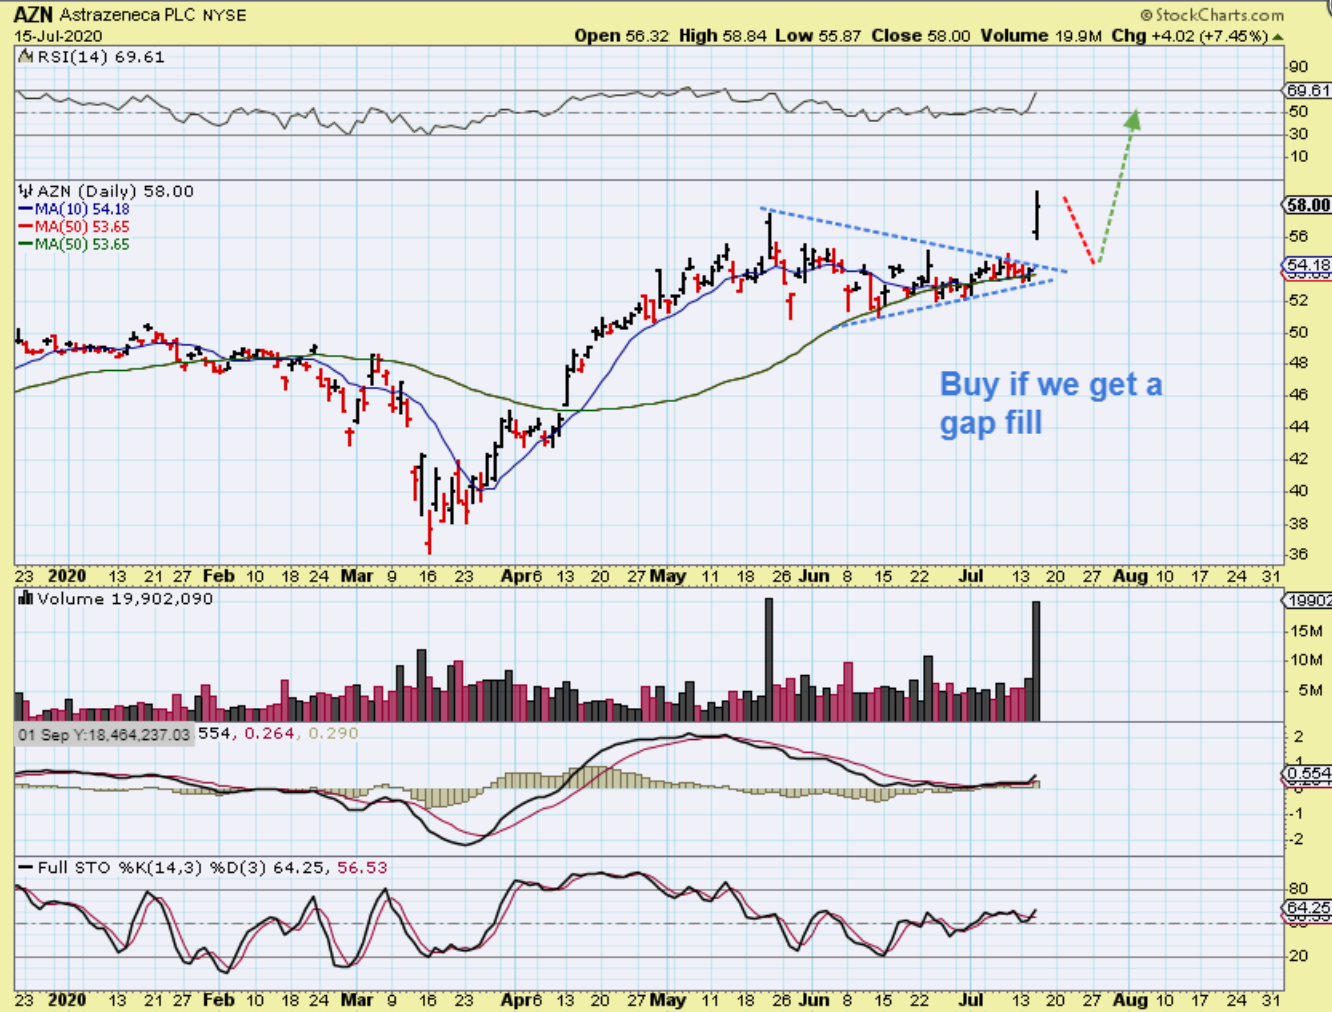
MRNA gapped open 16% and yet tried to do a gap fill. MRNA DID gap fill & start to move higher again, so there is a chance that AZN will gap fill. AZN is worth keeping an eye on (Watch list).
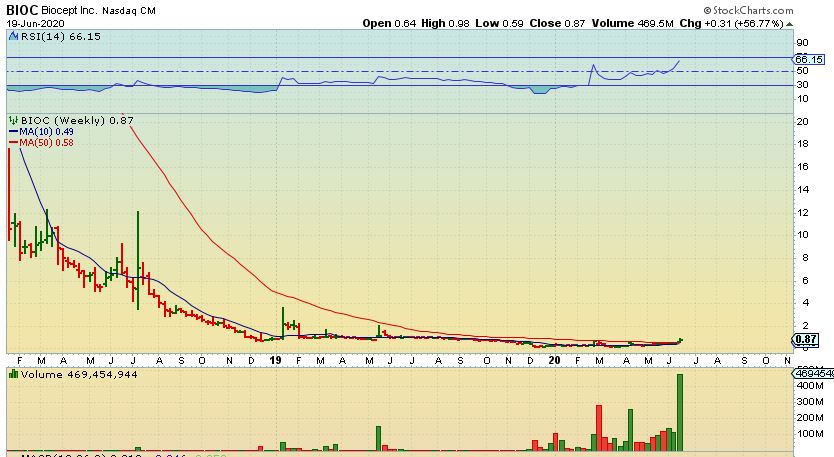
BIOC June 19 – This was my June 19 BIOC chart showing why I love it. I (we) Bought it near 40-60 cents and it popped to $1.00. I have to sell 50% when I see that, and then sold the rest when it dropped to 90+cents. I STILL LOVE THIS BASE THOUGH. Well…
.
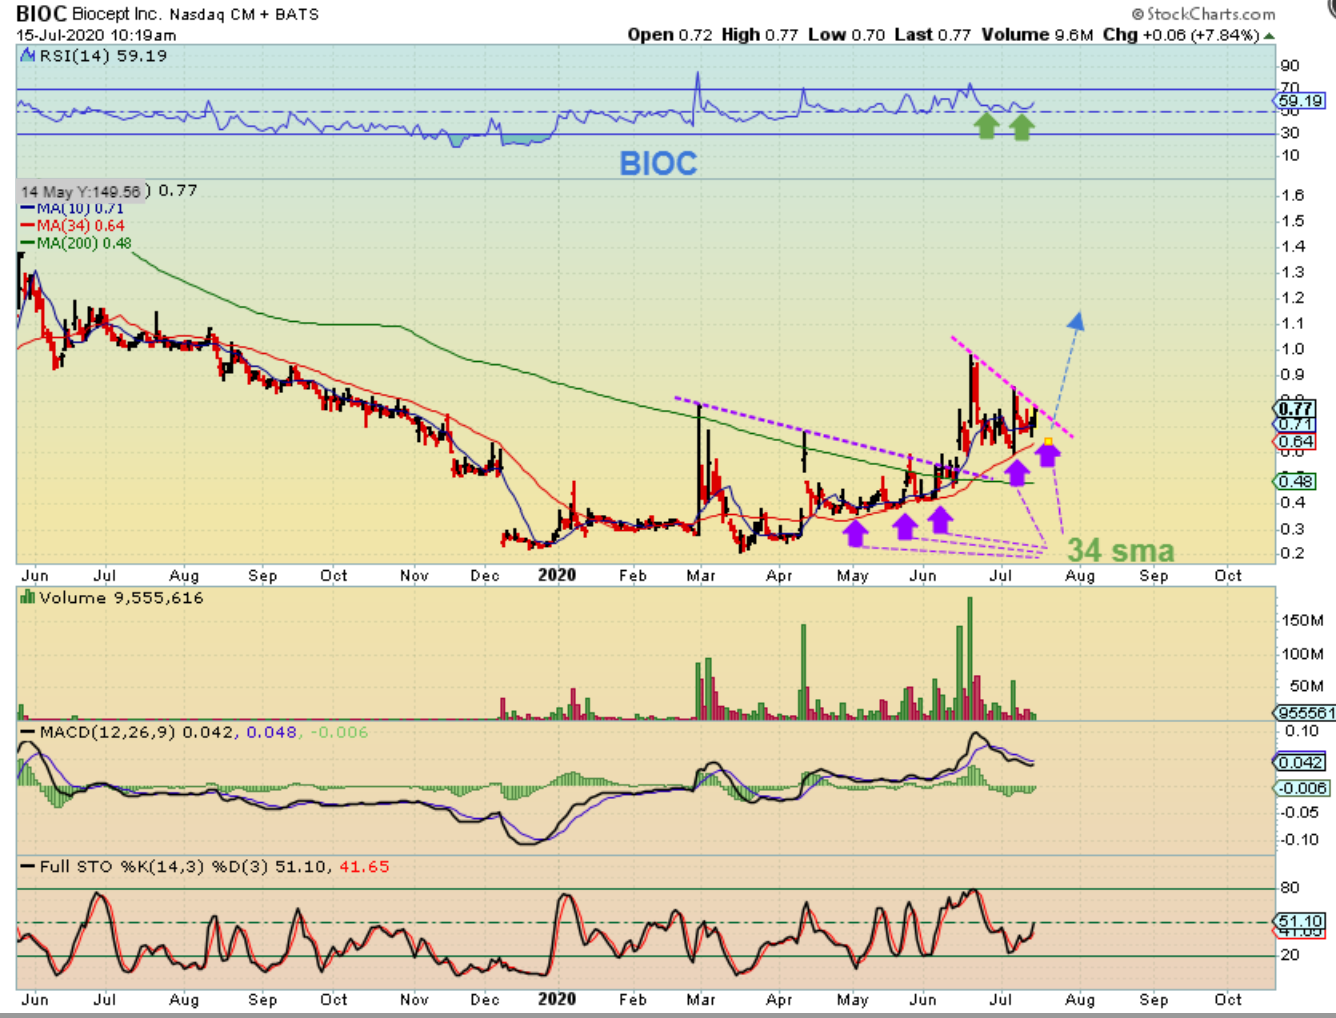
BIOC has chopped into a possible bullish triangle. It has faithfully climbed the 34 sma since way back in May and it dropped there after the run to $1.00. Note: This is choppy, this is VERY HARD to ride out. This swings wildly:This actually dropped as the day went on and closed at 73 cents. A bargain 🙂 That said, this could break out & run 100% again to $1.40. I say that it is a buy if it drops to the 34 sma 1 more time or breaks out. THIS CHOP IS NOT FOR EVERYONE, KNOW WHO YOU ARE AS A TRADER.
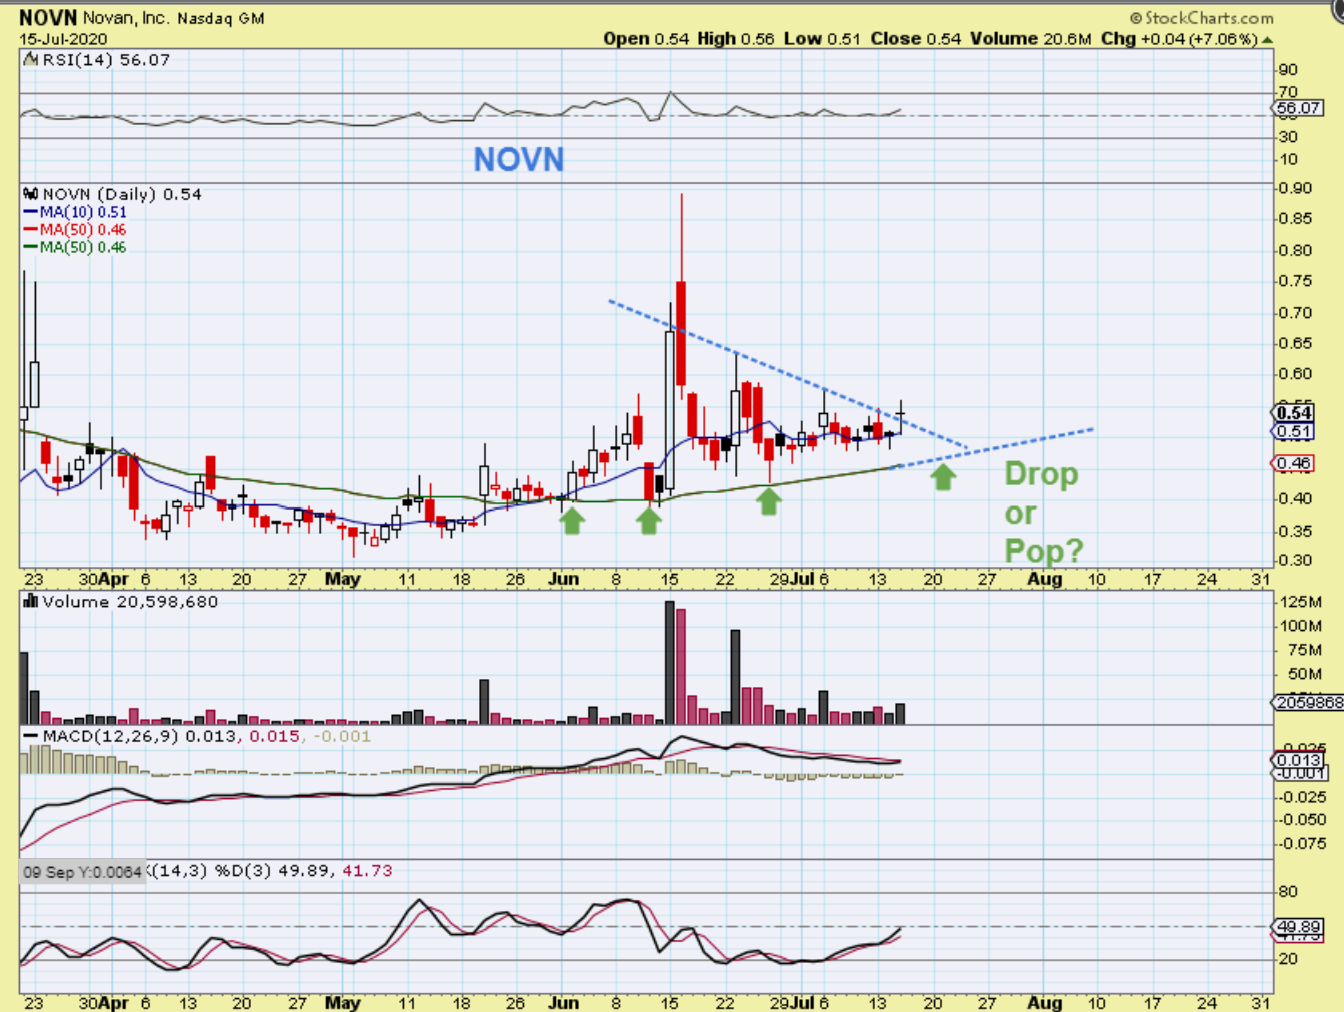
I have repeatedly shown the NOVN base & set up. This is my July 9th chart at 50 cents. A break out upside might really get good.
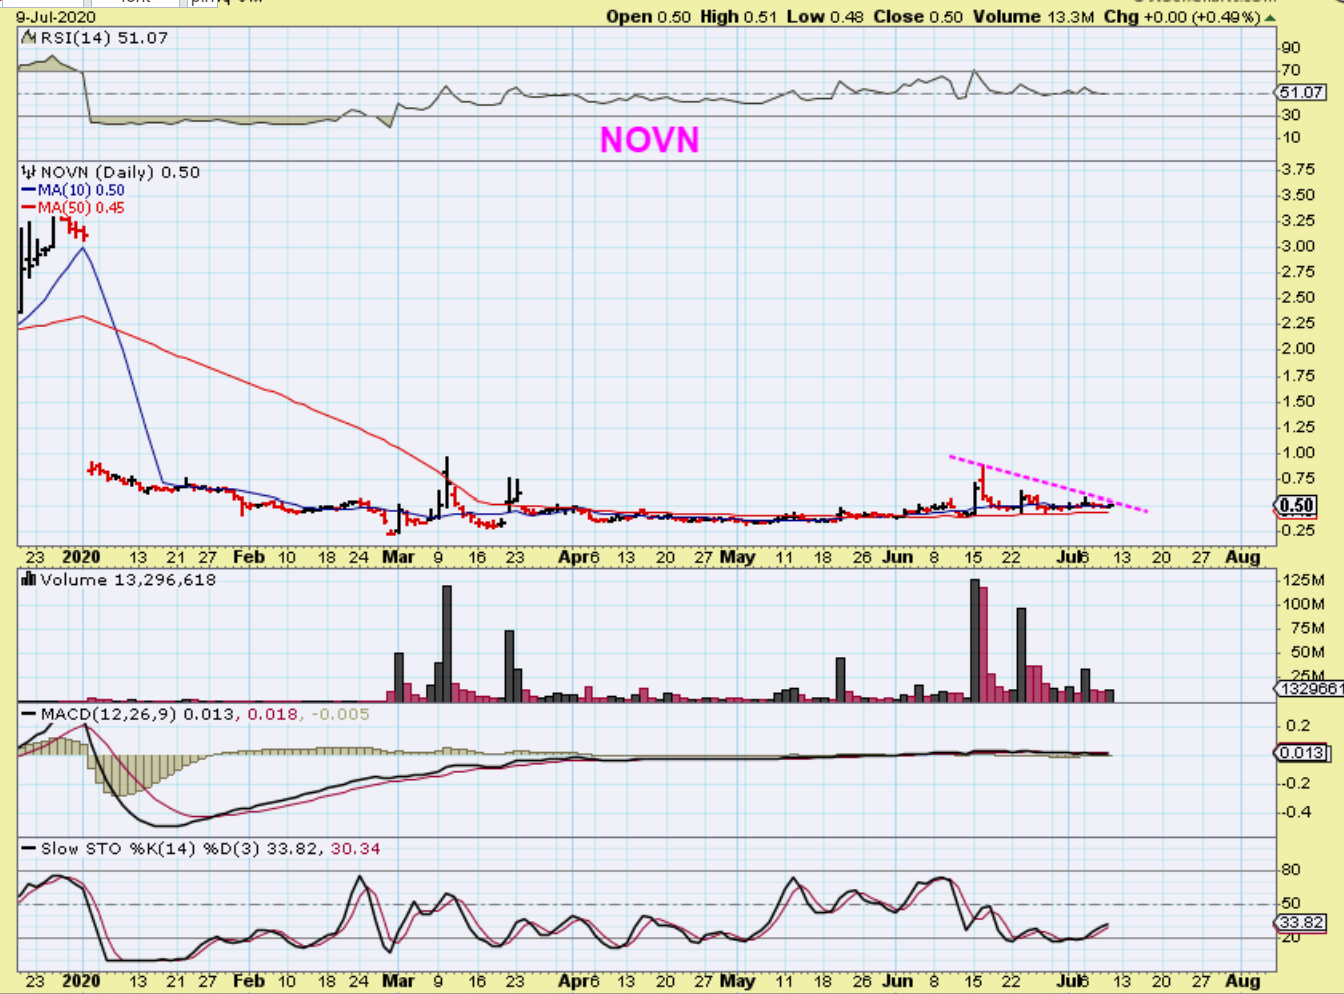
NOVN is still choppy, but it kind of looks like it could break out sooner than later too. It CAN drop back to the 50 sma near 45 cents as a false break out here too, so be aware of that. The volume increased yesterday so this may be getting close to breaking out. That JUNE pop was a 100% move and I sold a bunch and have re-purchased down here.
.
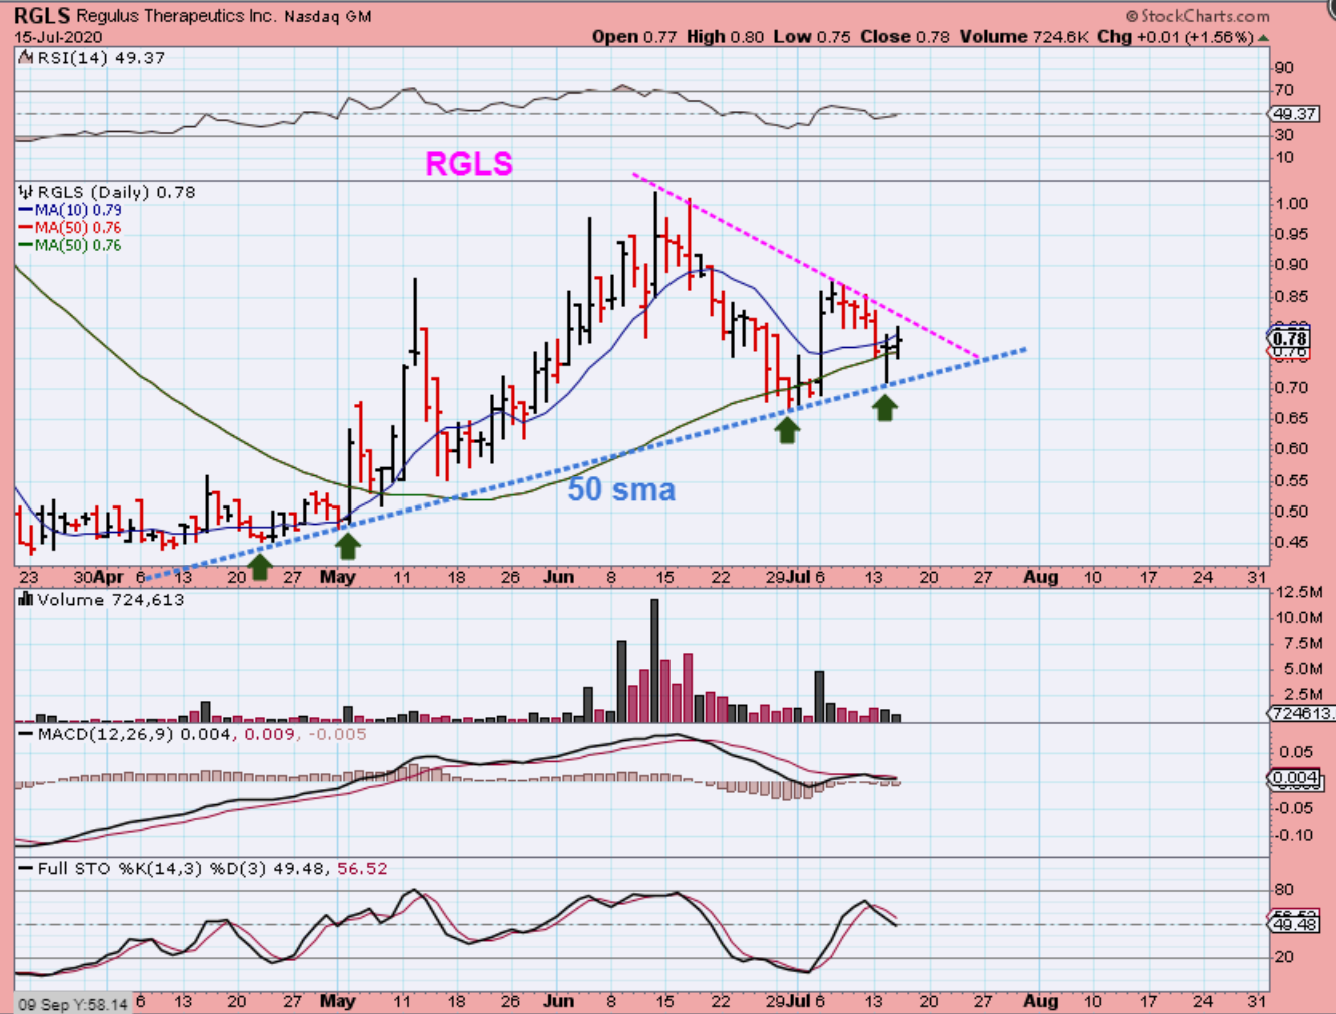
RGLS #1 was another that ran to 41.00 & retreated. This was a good run from 50 cents to $1.00, and I like the company. I re-bought this at the trend line and this is also near the apex so it either breaks up or down. Let me show you something else…
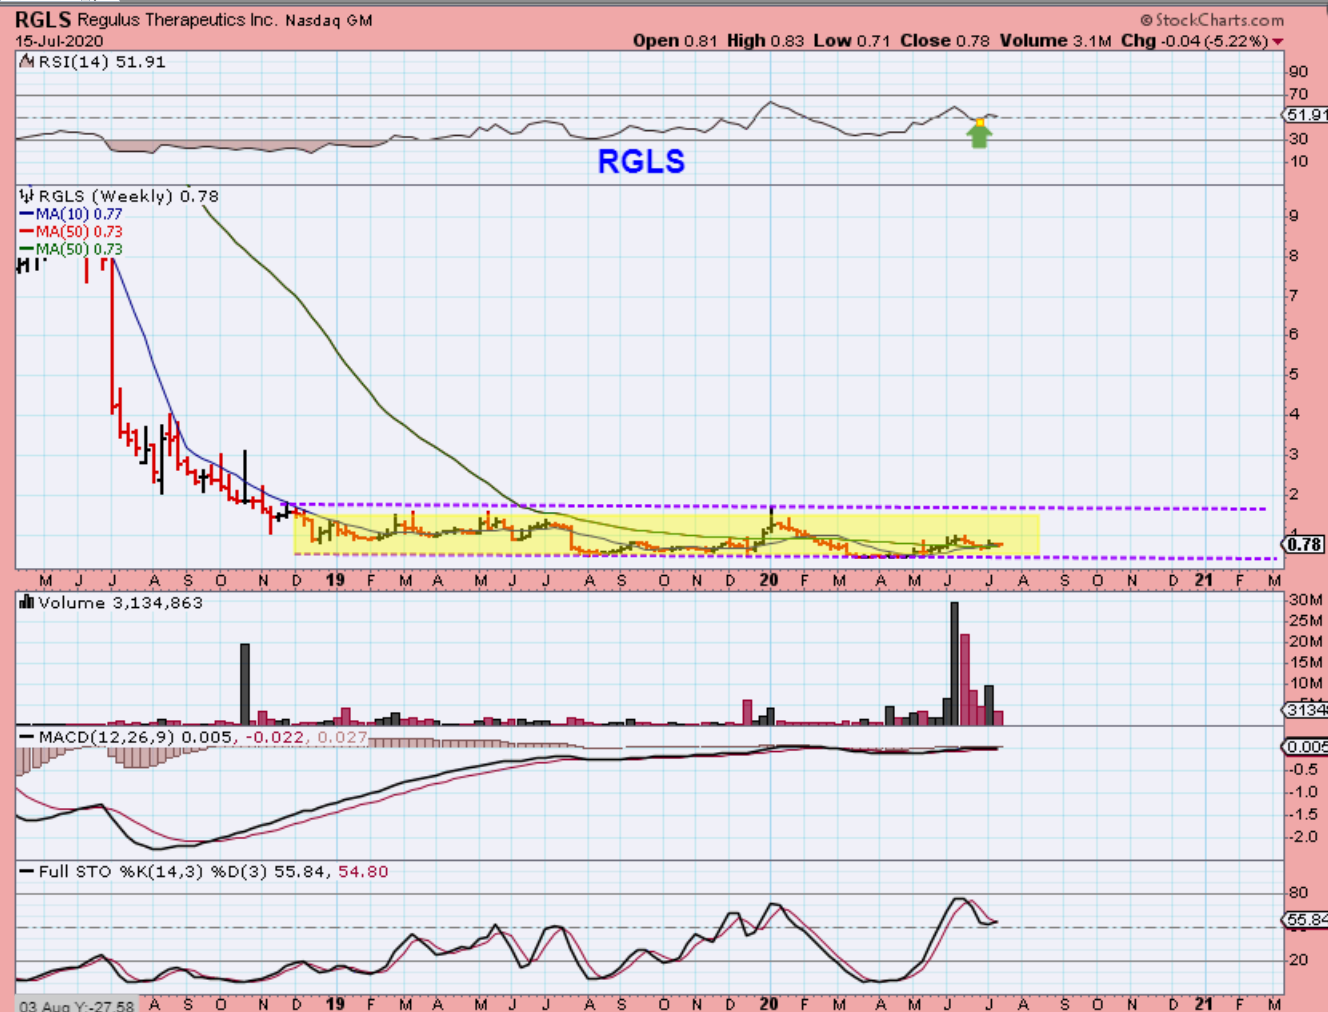
RGLS #2 is actually in a 1.5 year base and that MACD is what caught my eye when I first found this. So, we already know that it popped to $1 in June and pulled back …
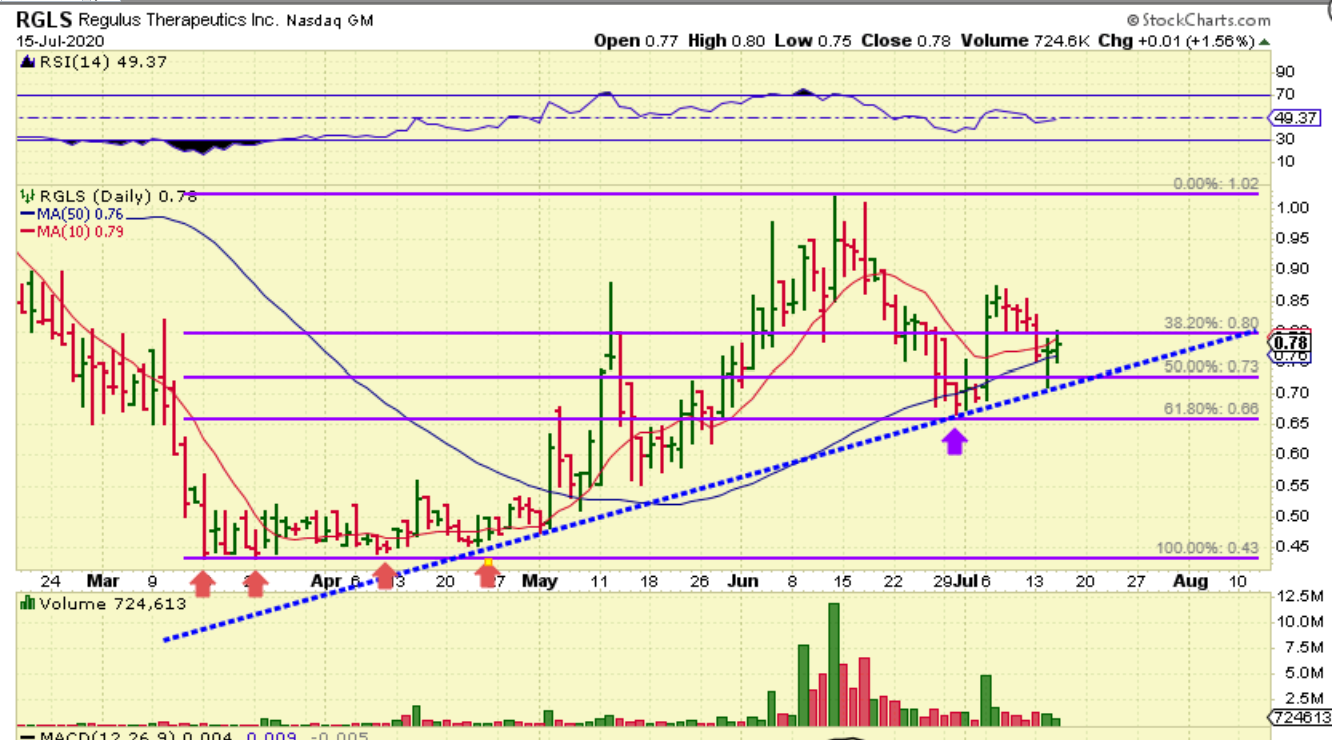
RGLS #3 : We already know that it popped to $1 in June and pulled back 6.18%. It is climbing a trend line, so it can either be bought here (with a stop) or buy the break out. I feel that there will be plenty of upside , even if you buy the break out of the down trend on the first chart that I put in this series of 3 charts.
.
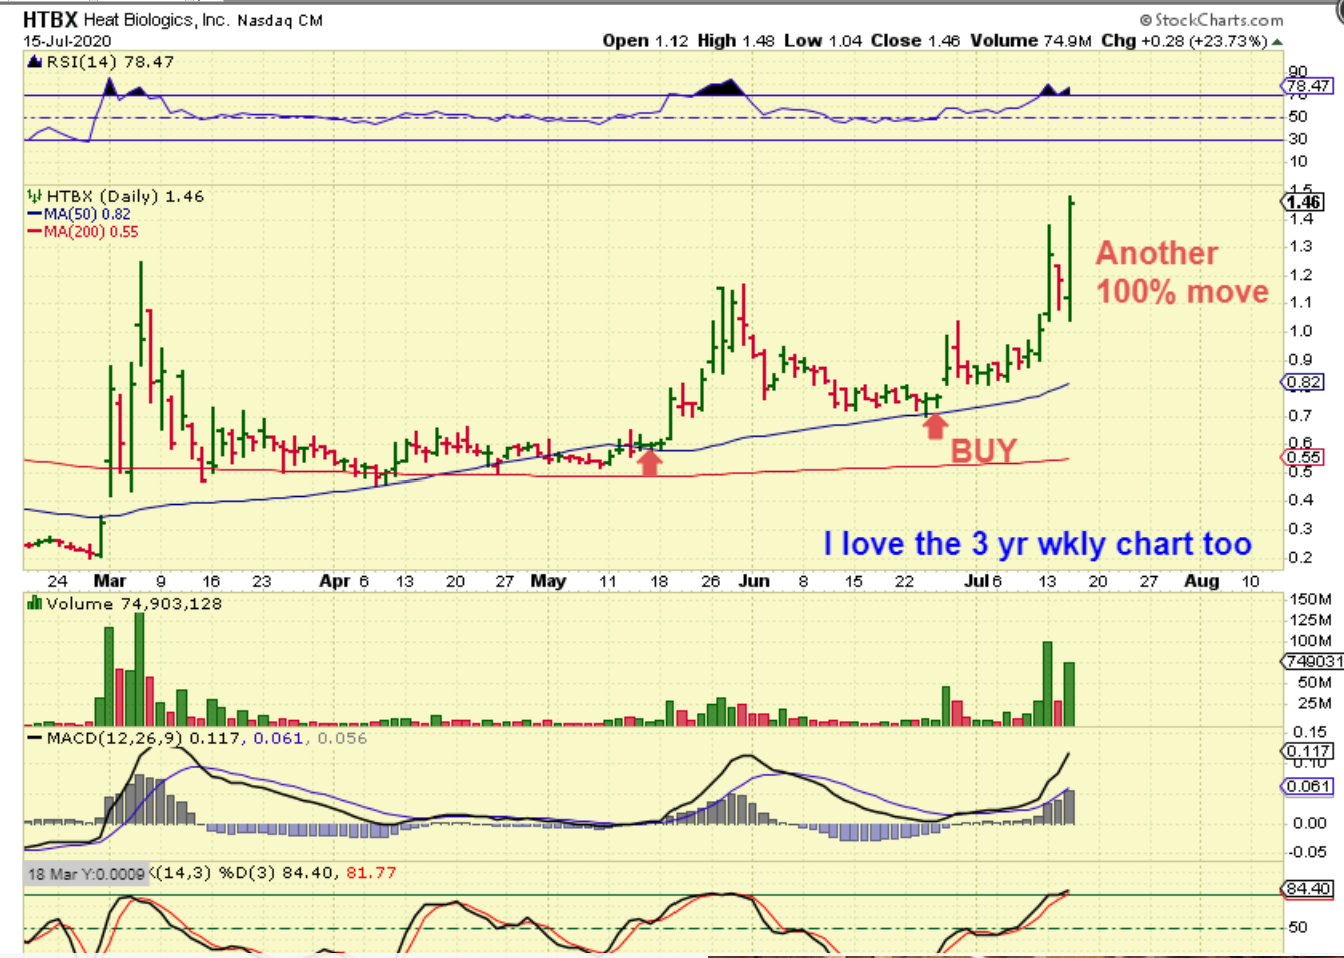
HTBX – Yesterday I had a buy order in to buy even more if HTBX tags the $1 area.
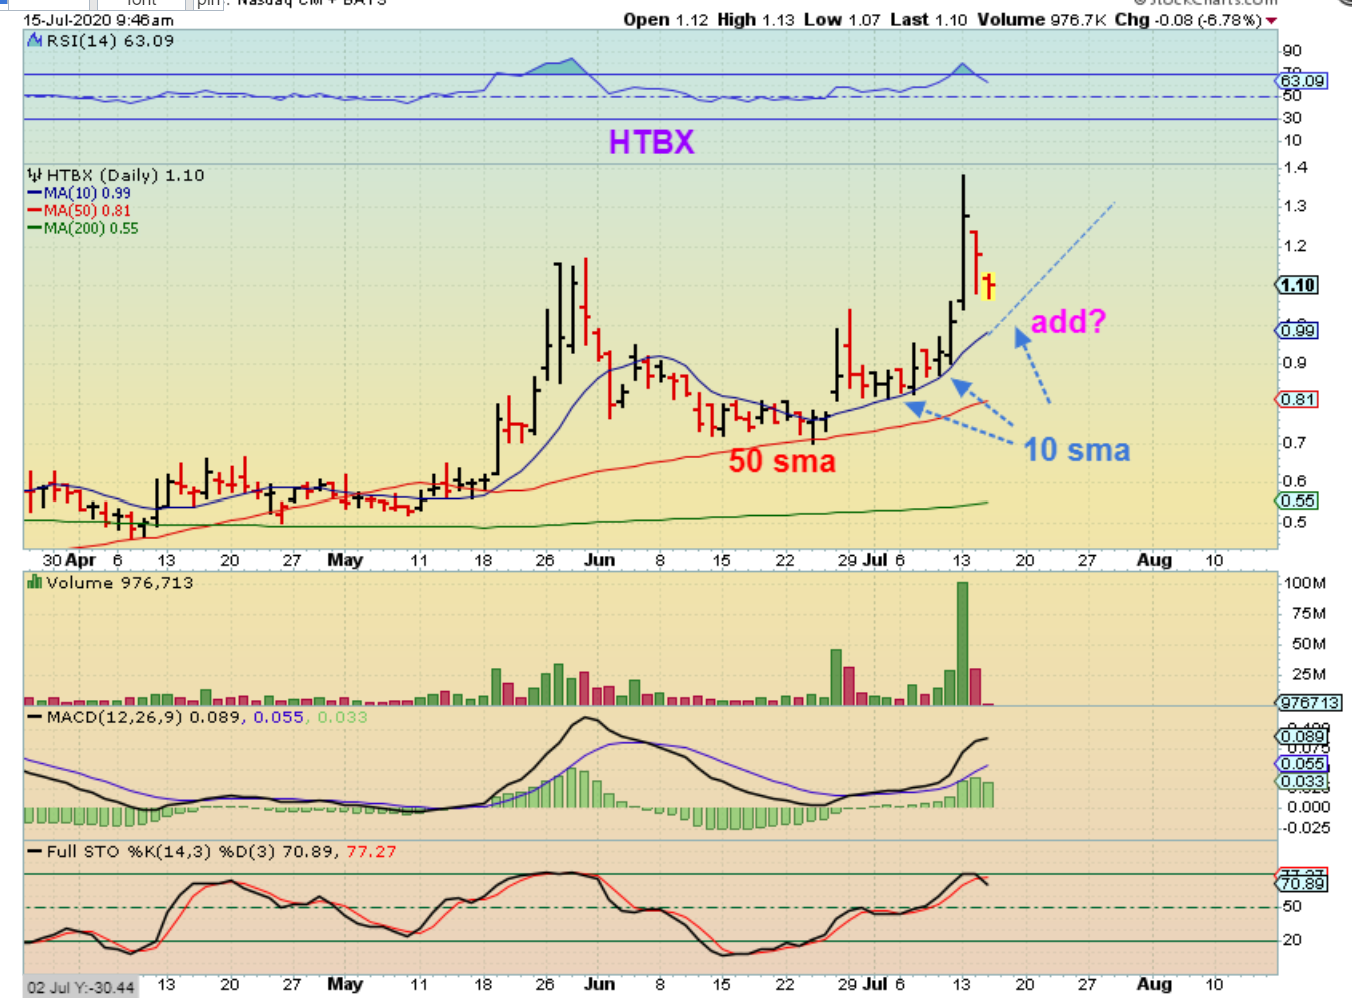
.
HTBX – Missed my additional buy by 4 cents , but that is fine, I was loaded up and it shot up 24%. This was a Rough ride , choppy up & down, but congratulations to all that held on! Another big winner and I love the long term chart too.