
Friday July 31st
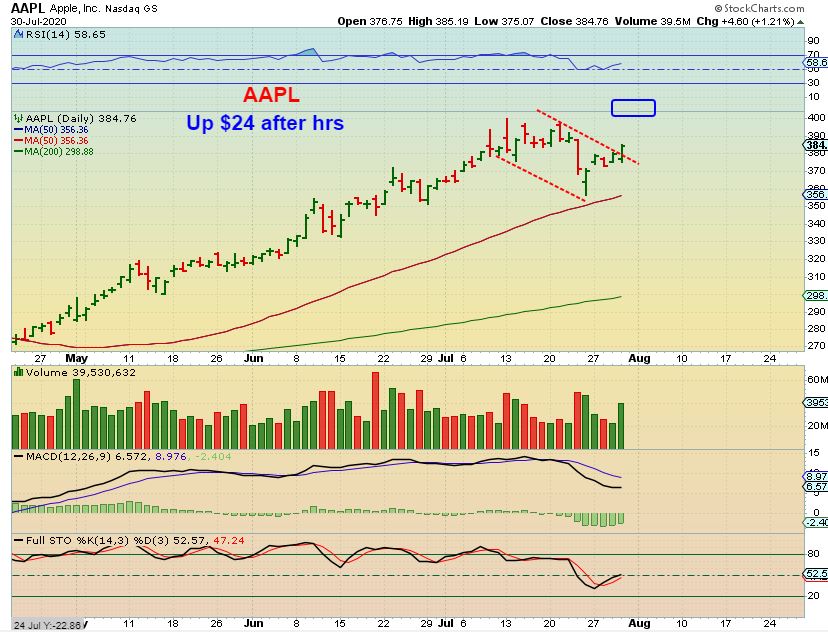
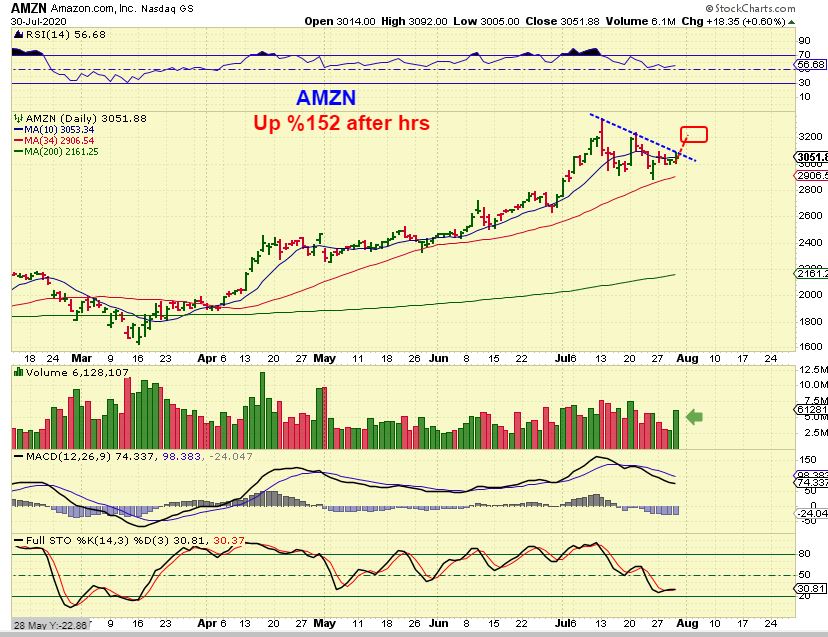
Yesterday I discussed the choppy trading that we have been seeing this week. Well, on Thursday the day started off with a bad jobs report and the Futures were quite red. By the end of the day the markets clawed their way back to almost green again, and then in after hours AMZN, AAPL, AND FB all shot up over 5% with earnings reports coming out.
.
Apple also announced a 4 for 1 split and the chart looks Bullish, so the Markets may continue their attempt at new highs…
.
AMZN has a normal bullish pull back this month, but after earnings it would be set to open inside of the red box.
.
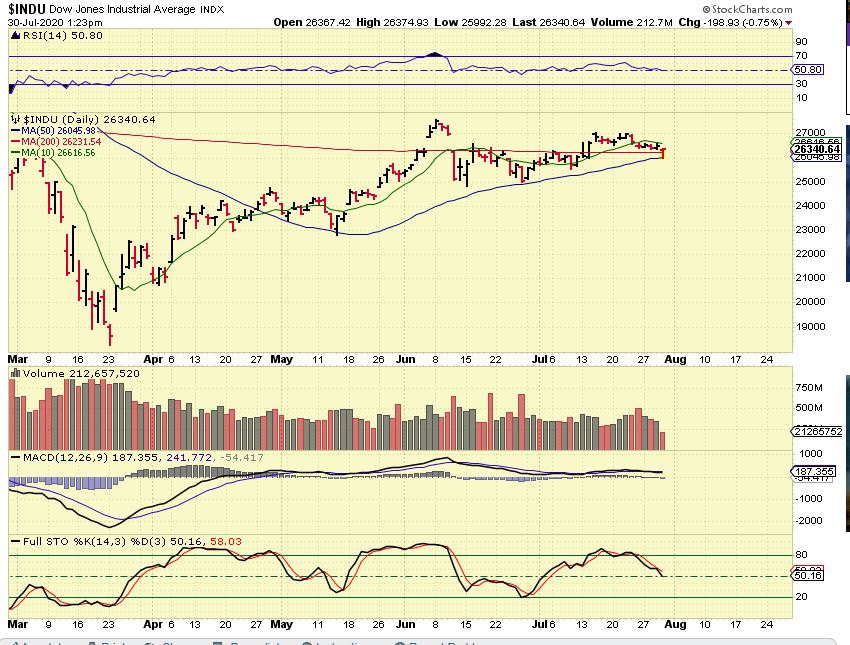
I captured this chart of the DJIA MIDDAY – it reversed right off of support and regained the 200sma.
.
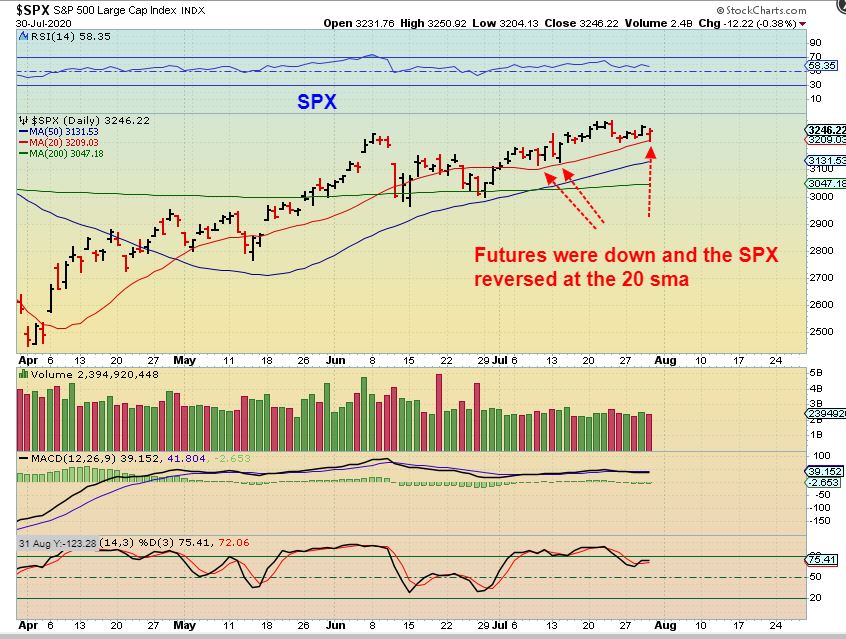
By the close The SPX had almost turned green after also reversing off of support. So the Markets are still choppy, but AMZN, AAPL, and a few other good earnings reports may keep the fire burning.
.
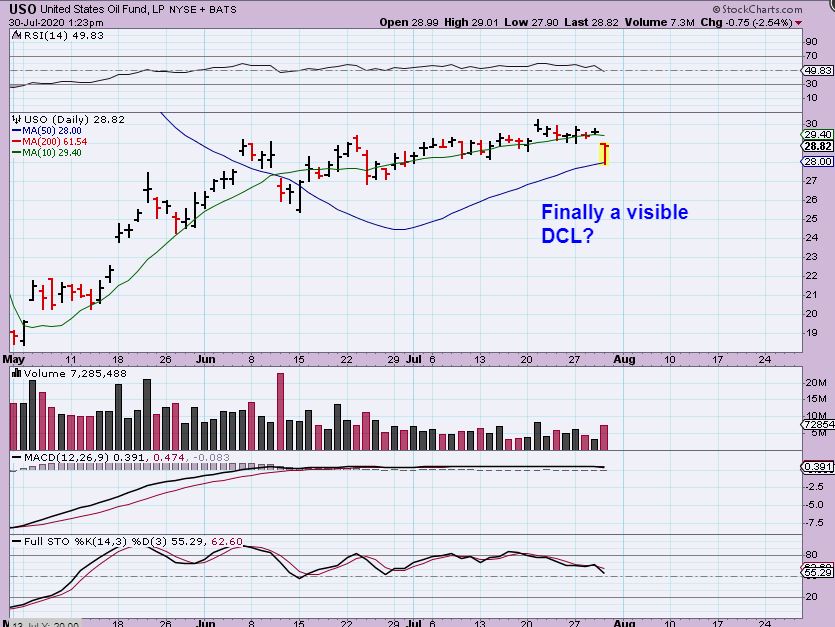
When I came back from lunch on Thursday I saw that the USO ( Oil Midday) had a sharp drop but bounced nicely off of the 50sma. COULD this be the visible version of a dcl for Oil?…
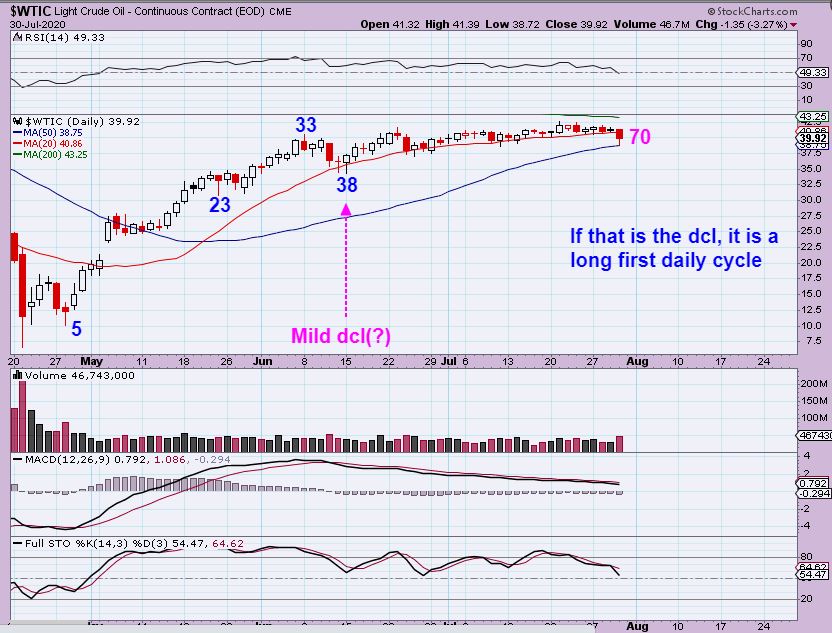
WTIC – Oil also bounced off of the 50sma. Cycle counts are tricky here. Oil daily cycles often go 50+ days, but did we have a milder day 38? Or is this a long day 70? It is hard to know , but let me remind you of something if you have been with me for at least 2 months…
.
Same Chart: let me remind you of something if you have been with me for at least 2 months.
.
Do you remember when we had a very strong run from GOLD in the first daily cycle, and then the 2nd one chopped sideways forever? At that time I said that the 3rd daily cycle could be very strong , matching the first one after a long choppy 2nd daily cycle (we had a Box Consolidation in Gold). Picture that here too. IF We break higher, OIL and Energy stocks might start doing what GOLD & The Miners did in their 3rd daily cycle. THAT WILL BE WORTH PAYING ATTENTION TOO.
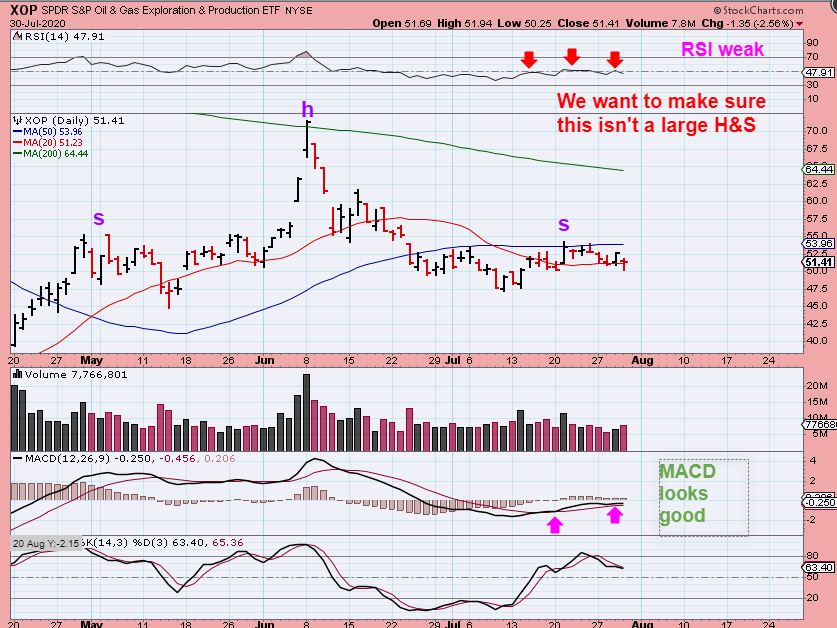
XOP – If Oil breaks higher, this will follow, but right now we also want to notice a possible H&S pattern. A break higher negates it, so we are watching this sector for a break higher and a BUY opportunity. AROC, SLCA, APA and a couple of others look to be perking up.
.
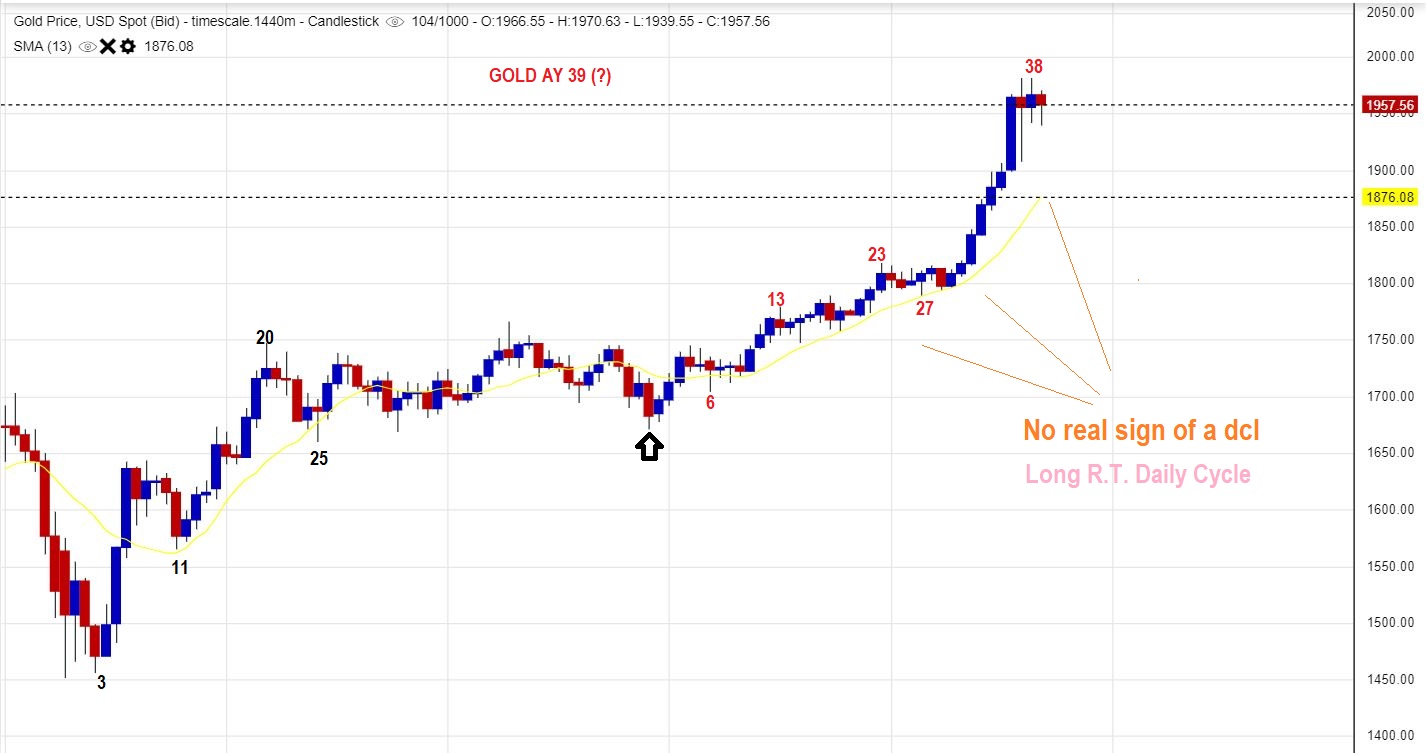
GOLD this is why I say that I don’t like to use ‘cycle counts’ in very bullish scenarios.
1. Gold looks like a Bull Flag and wants to go higher
2. However I do not see a visible DCL from the black arrow to now, and we are on day 39.
3. Some people that only follow cycles would normally sell on day 23 or so, expecting a dip into day 30 or so.
4. Right now, GOLD is strong and is just up there flagging sideways. THIS LOOKS LIKE IT WANTS TO GO HIGHER. Push cycles aside and I would say that this looks like a bull flag that wants to go even higher. Amazing.
.
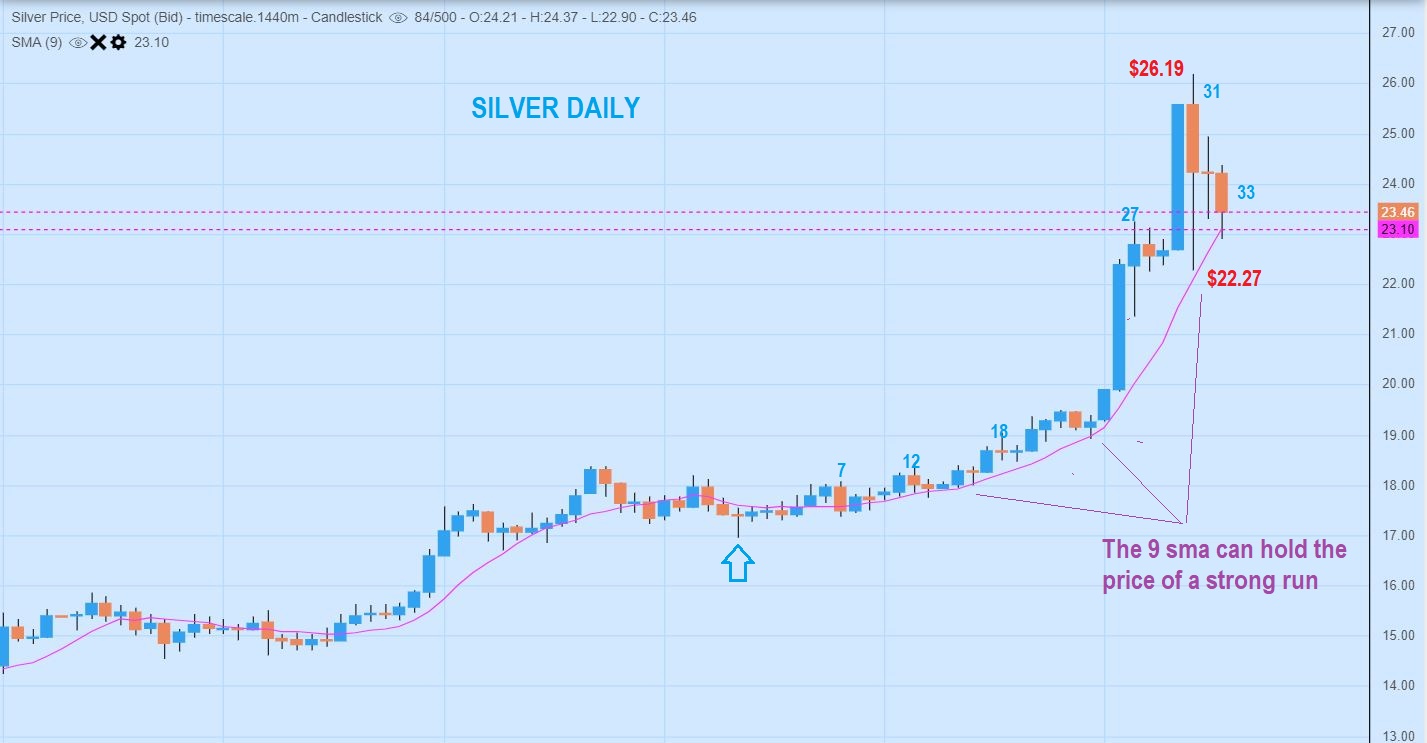
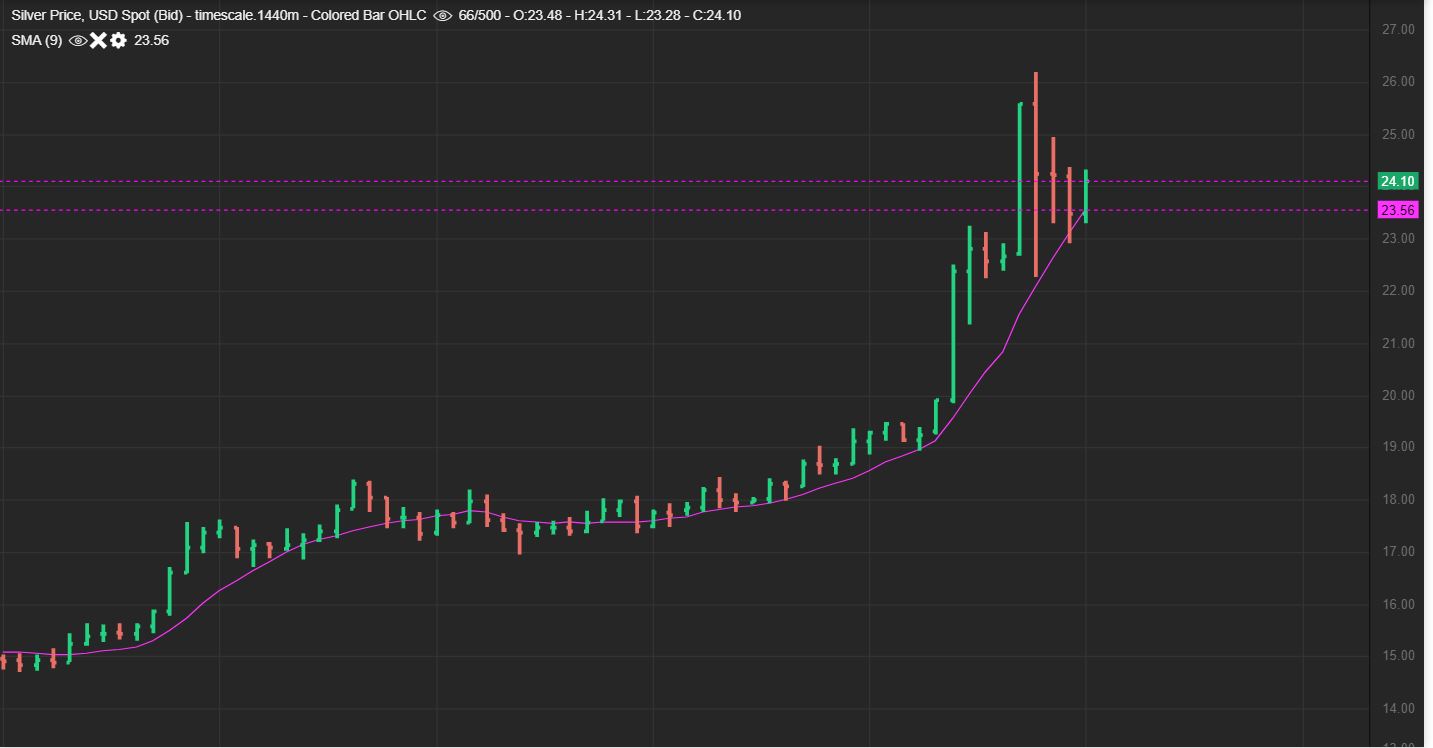
SILVER is a bit different, it did drop $4 from the $26.19 highs, but this also has held the 9 sma, and that is a strong move. Will it flag or form a pennant here? We’ll have to wait and see. Note: $26 was a target with resistance.
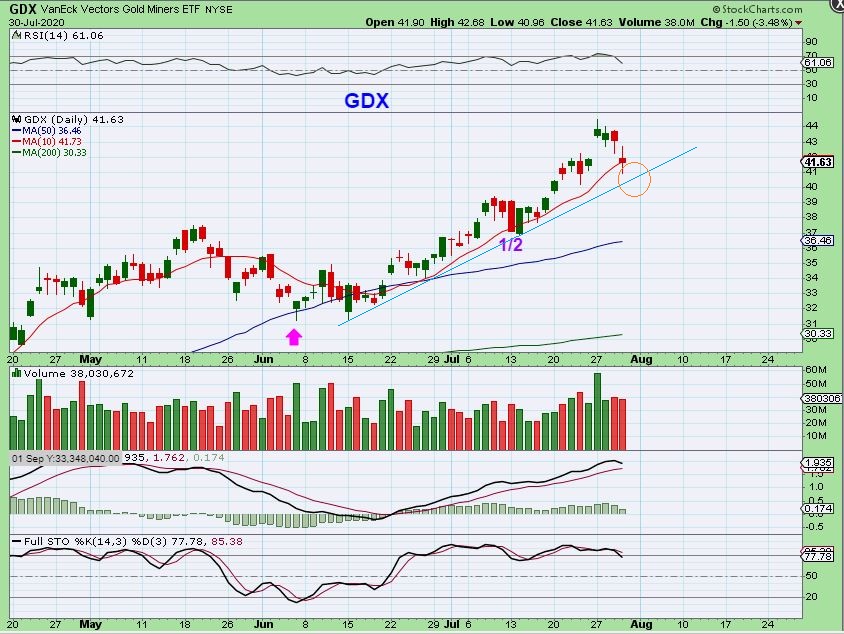
GDX looks to be dropping to a dcl. It broke the 10sma, the count is 38 days away from the lows and it would seem that we could drop down to the orange circle for a dcl.
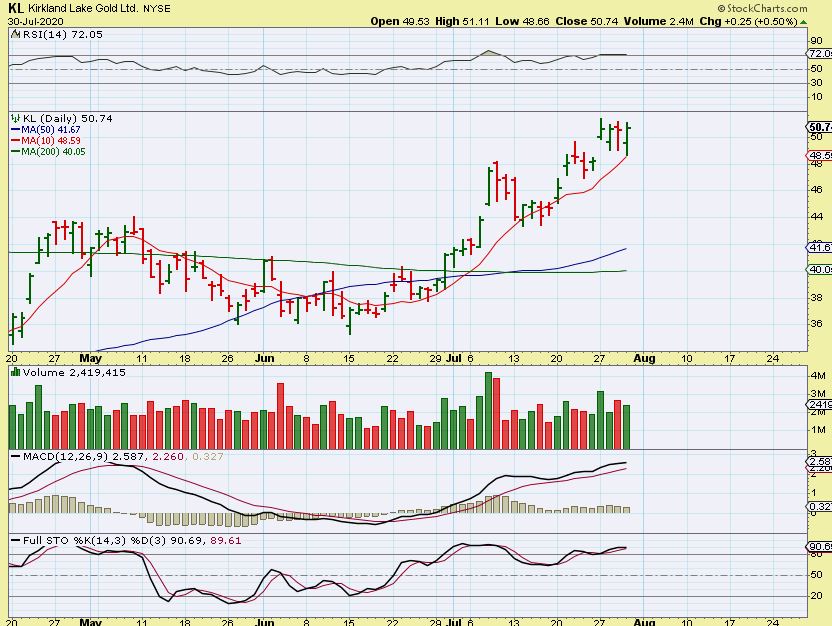
KL – As I have mentioned repeatedly in the reports, even with the drop in the GDX, GDXJ, and SILJ, some Miners can do their own thing. KL did drop, but it flipped off of the 10 sma and is already back near the highs.
 .
.
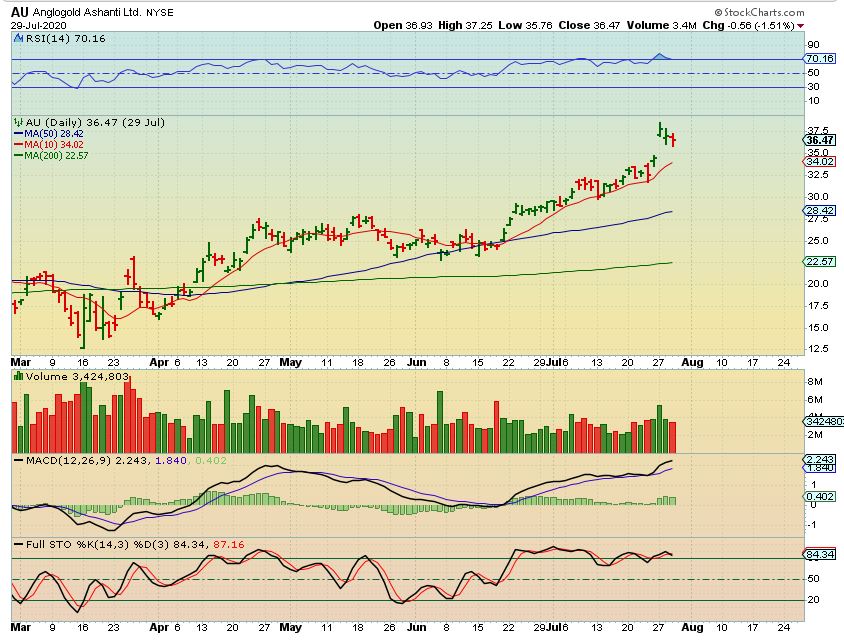
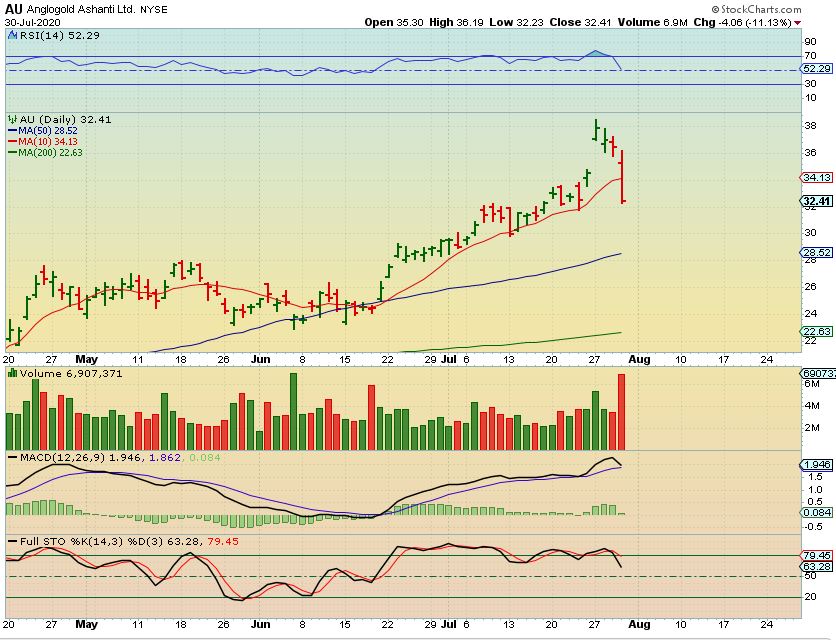
Speaking of doing your own thing, look at AU:
.
AU was looking quite bullish on Wednesday after the FOMC Mtg, as seen here. Would it fill the gap?
.
AU – Whoa! This just shows us how quickly things can change. If you bought this 2 or even 3 weeks ago, you are now break even, so things can change fast hen a dip comes due. We want to stay alert and see how the sector plays out .
.
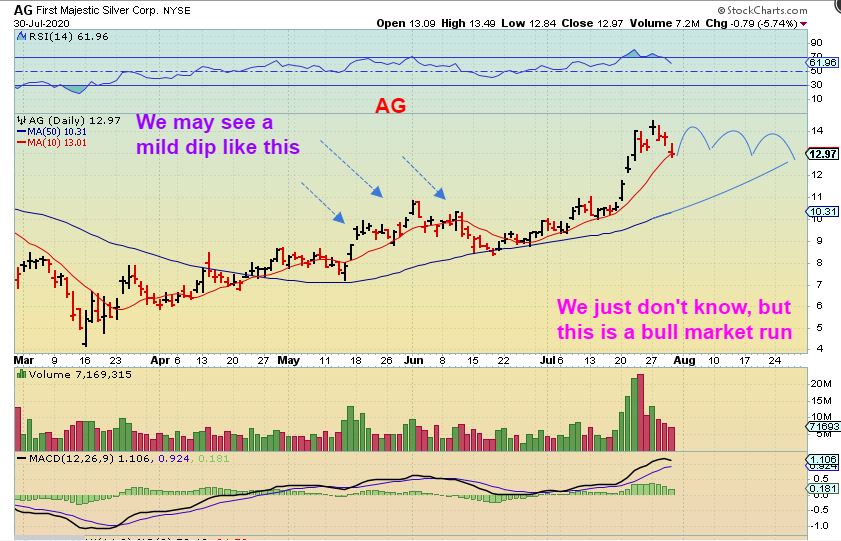
If you own a core position or sold partials and will let a stop take you out of the trade as recommended, you may still own many of these Miners that held the 10sma so far like KL shown above or AG shown here. There are several others too.
,
AG – I just want to point out that we could get choppy sideways consolidation (as shown) and lowering the stop to the 20sma may keep you in the trade longer, even permanently, just so you can see how it plays out. If you don’t mind riding the chop, a longer term buy & hold position works in a Bull Market too, since we can get milder dcls in the first 3 daily cycles. . AG has dropped from $14.50 to $12.80. and it COULD drop to $12 or $11, but if you don’t mind riding chop, that is another option.
.
At this point for Gold, Silver, and The Miners the set up remains bullish. Cycles are not really all that helpful, because they would have been calling for a pull back 2 weeks ago, but using a trailing stop , as recommended, has been more useful. I don’t see (visibly) a dip into a dcl, but a runaway move can just …..run away. At this point holding a core position into a dcl has helped one to stay in the trade, using moving averages has also kept some in the trade. This daily cycle would be very right translated, so one would expect the next daily cycle to be able to pop to a new high before rolling over. To sum it all up: This has been a strong move in the Precious Metals. That said, as seen with AU & KL examples, different Miners do act differently. Some are pulling back more than others.
.
MORNING UPDATE: SILVER HAS FLIPPED HIGHER OFF OF THE 9 or 10 SMA AS I PROOF READ THE REPORT FOR RELEASE THIS MORNING. IT JUST DOESN’T WANT TO DO A NORMAL DCL BREAK BELOW THE 10 SMA YET. A silver miner at the 10sma or even SLV could be bought by anyone that wants to see if this has further upside as a trade, but we do want to remember that Silver does have that resistance at $26, so we may just see a double top & then chop or drop for a while.
.
Today is Friday , the last trading day of the week, enjoy your day of trading!
.
~ALEX
.
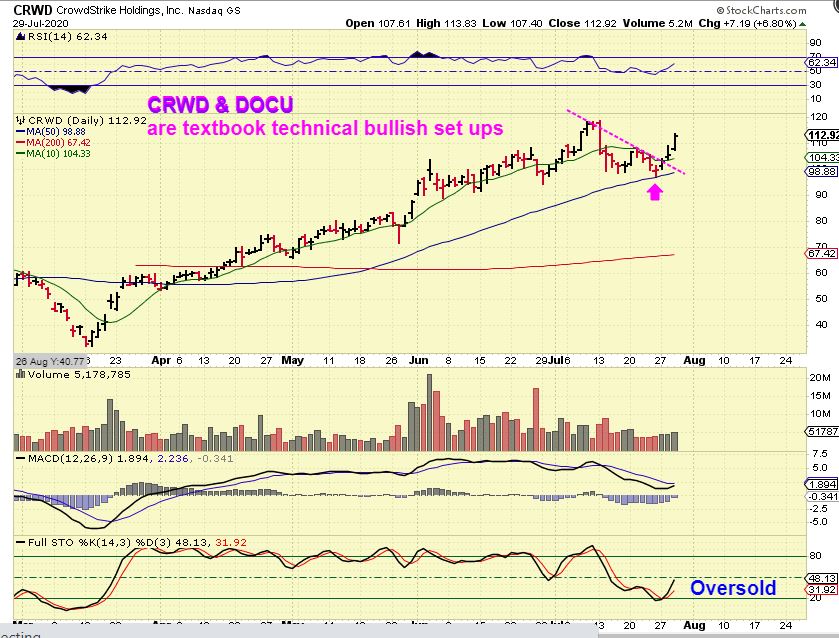
CRWD & DOCU – Yesterday I pointed out a couple of stocks that looked bullish after a small (normal) pull back. These can be bought with a stop trailing below it, and remember the charts of AAPL and AMZN in the report above. Those remain bullish and Covid has helped business in some cases ( Shop from home). AAPL is doing a 4:1 split, that can be bullish.
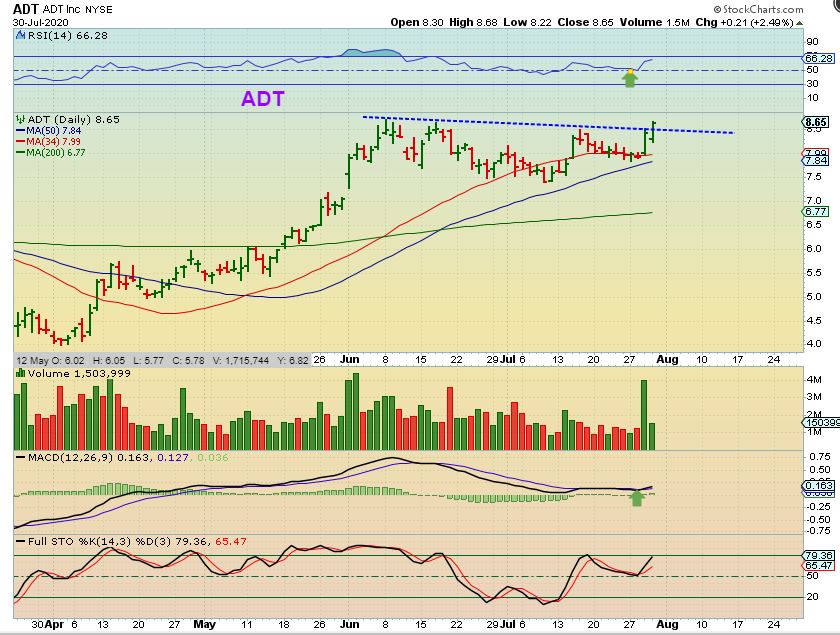
ADT – This is an inverse H&S with good volume coming in. It is a buy right here with a target over $10.50.
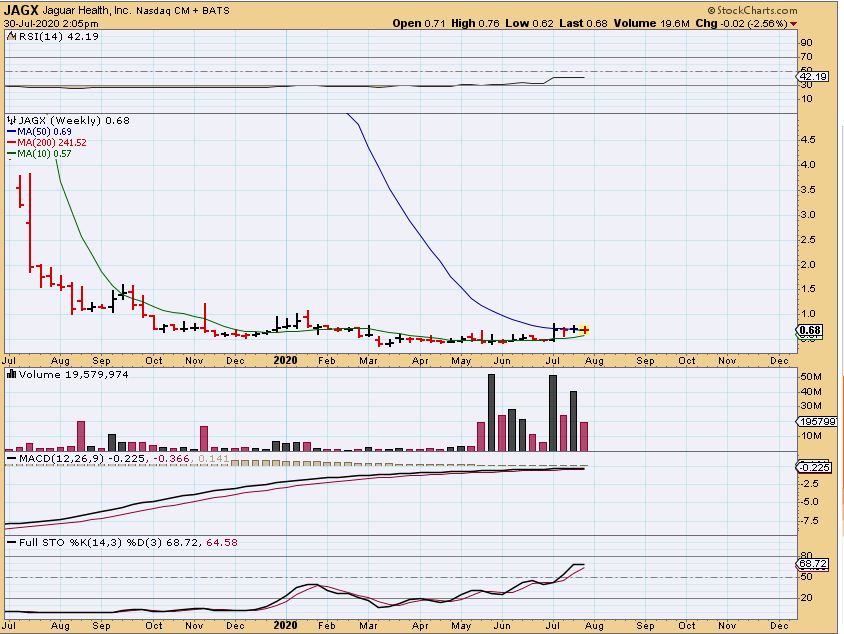
JAGX WEEKLY – I mentioned this as a long term chart that is Bullish. That is a very long base and it has what is called a ‘3 weeks tight’ pattern. The volume is pushing to the upside. I own this, but please know that it may not break outright away. These are longer term trades like CHFS, BNGO, BIOC, etc. The day to day action may vary.
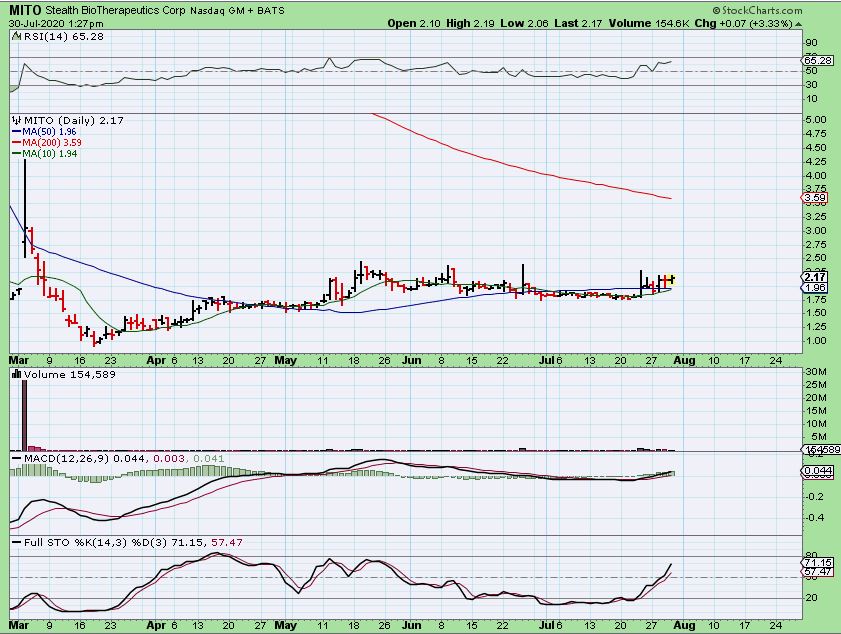
MITO DAILY – I have been watching MITO and it is also a good daily set up. I do not own this, but if it breaks higher with good volume, I may trade it for a few days or weeks. It is ore of a watch list ( Corona stock).
BIOC JUNE 17 WEEKLY – Corona-treatment , Still Making progress:
We originally bought this lower in the base around 45 cents and it started to break out and we added or jumped in here.
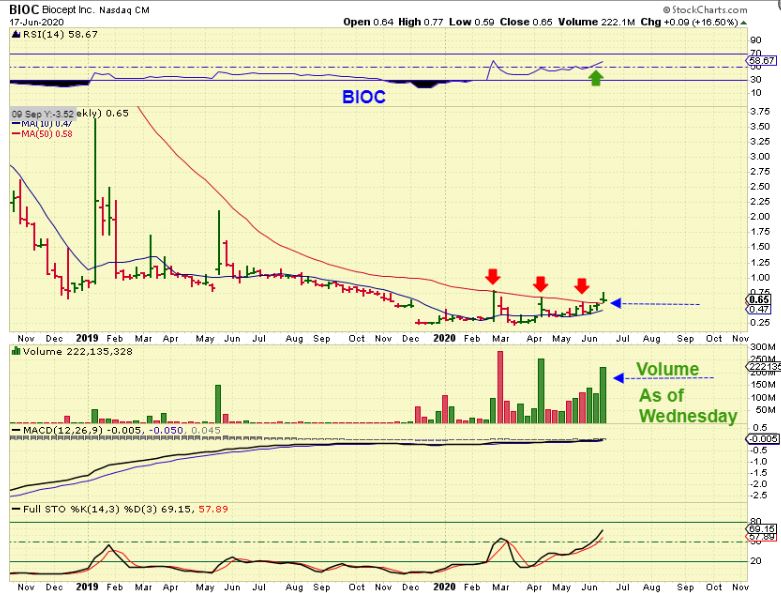
Bioc then ran to 95 cents and started to pull back, so some sold all or a partial to lock in gains and have been riding this chop for a month. On JULY 21 I called this reversal at the 34 sma a buy expecting a break out & rally. Did it?…
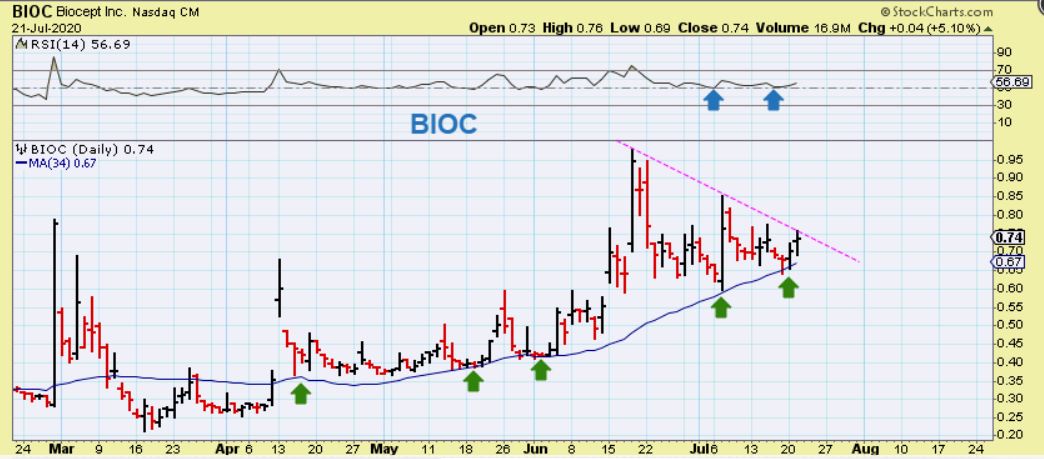
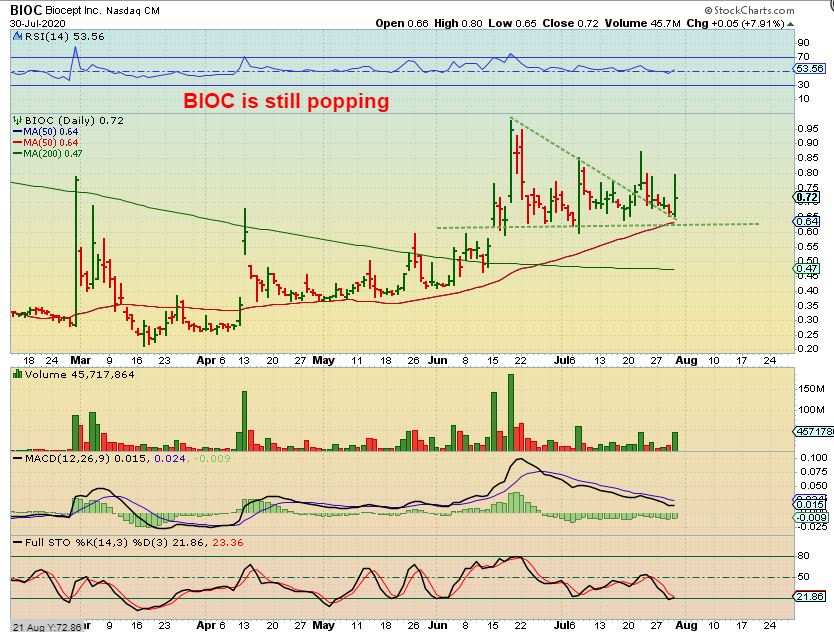
BIOC broke out and has drifted back down , now reaching the 50sma & reversing. It could be viewed as a back test of the first trend line since it actually ride right down that trend line. Yesterday we saw a POP with volume again, so NOW it MIGHT be ready to move higher. I still owned some and added just in case this runs. That is actually a healthy BOX consolidation forming now and it just needs a good catalyst.
.
BIOC SAME CHART: Since I said that “That is actually a healthy BOX consolidation forming now and it just needs a good catalyst”, it also could just keep chopping sideways. I do like that it reversed at the 50sma with volume.
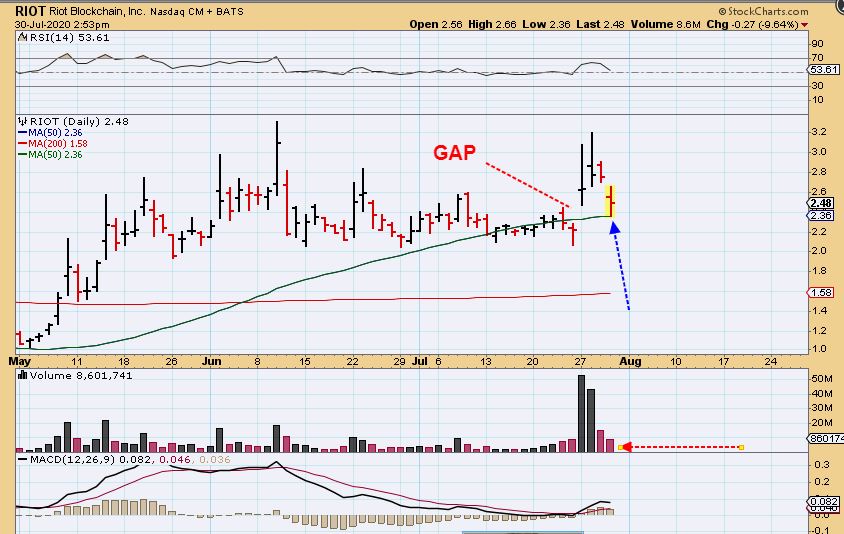
RIOT dropped sharply, but landed on the 50 sma & reversed. This was taken midday and it actually closed higher, so at this point, it is still a choppy price range wih good potetnial as Bitcoin moves higher (Above 10.000).
.

