July 30th – The Non-Event
If no one told you that Wednesday was a an FOMC Mtg with a Speech by Fed Chairman Powell, you may not have known it. The markets basically treated it like a Non-Event. One thing that I do see is choppiness and directionless movement is showing up on intraday time frames, which often bleeds over into the daily charts. One day things can look good and the next it looks weak. I’ll explain as we go on, so let’s take a look at the charts…
.
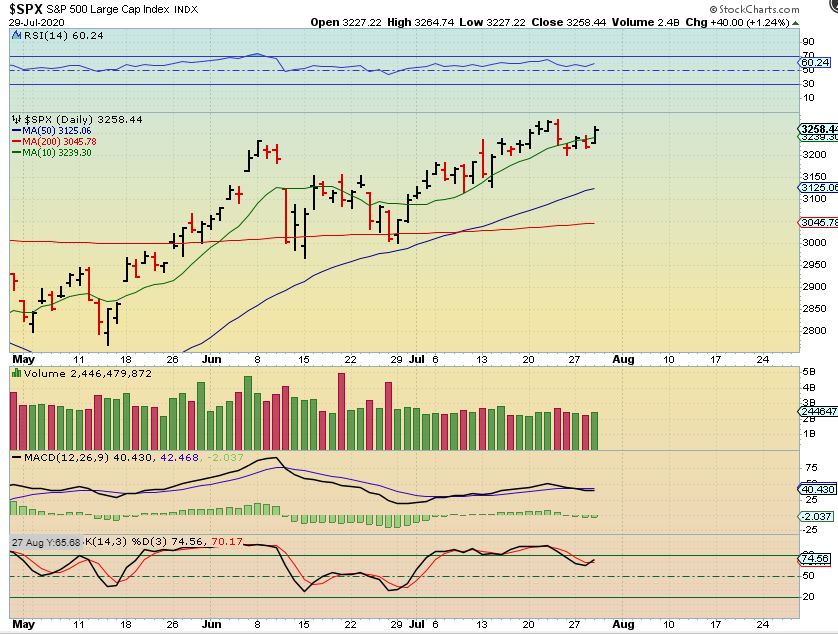
SPX – The General Markets broke above the 10sma and look ready to climb higher, but they have been choppy on a smaller time frame too. This is the 3rd daily cycle so proceed with a little more caution, it is choppy. A stop under the 20sma may be enough at this point.
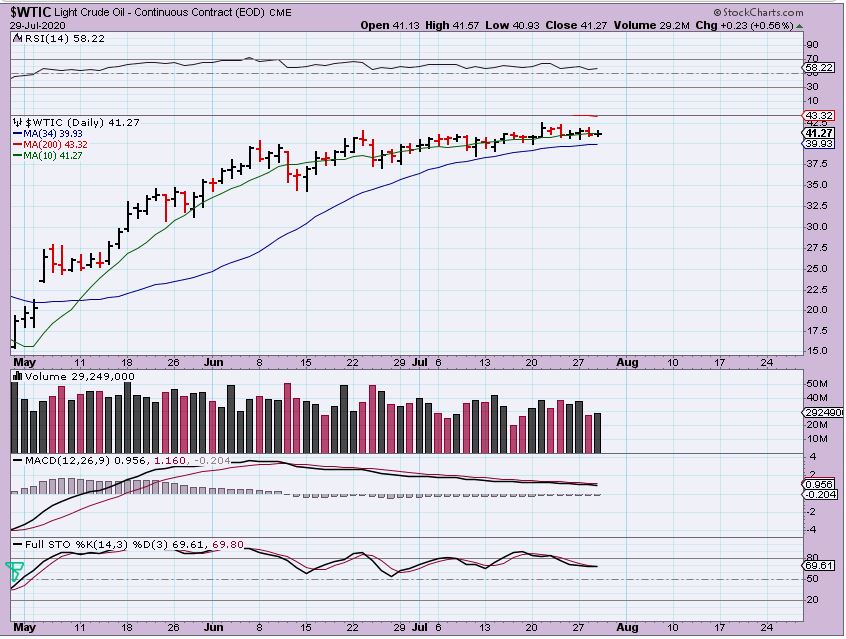
WTIC – Oil is the definition of choppy. If you just look at the last 10 days its up one day and down the next. We really need a strong break to give this direction, it is pinching tightly between the 200 sma & 34 sma.
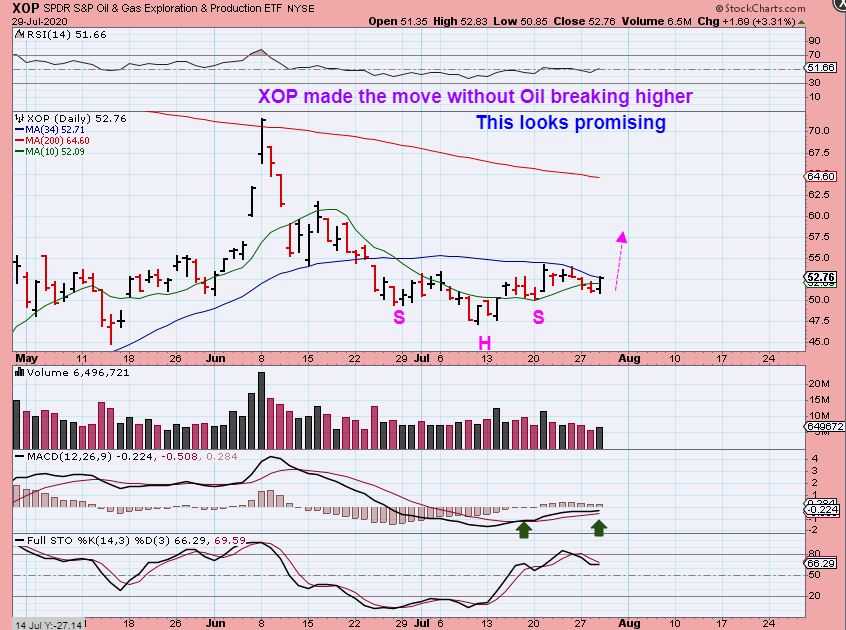
XOP -The XOP looked better Wednesday, and it was able to get above the 10sma, but has resistance at the 34 sma. This looks bullish and looks like it will break higher, but has also been choppy & Could chop under that 34 sma a bit more.
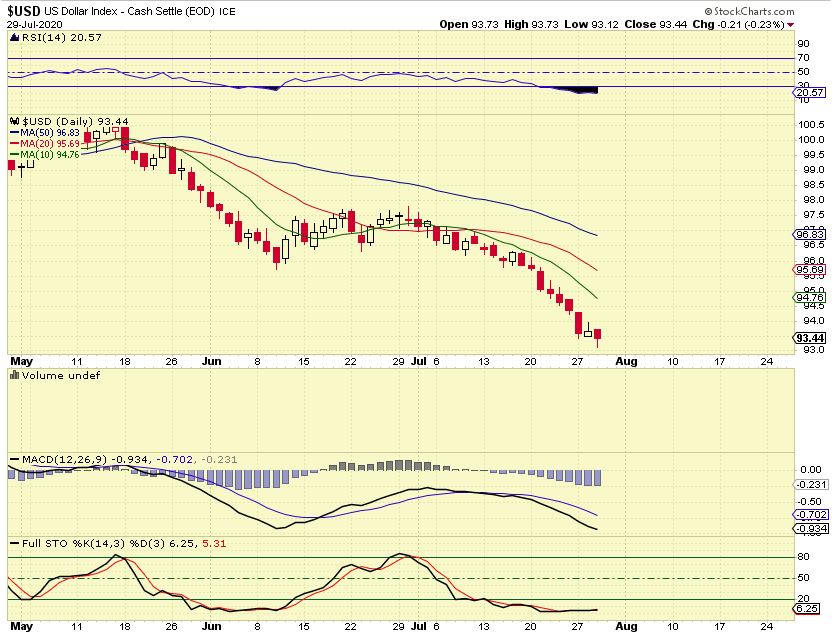
USD – We will keep in mind that the USD is oversold and Overdue for a dcl. That was a reversal candle on Wednesday . I am thinking that when the USD Bounces, Gold & Silver Top. THAT MAY HAVE BEEN YESTERDAY, EVEN THOUGH WE DIDN’T GET A BIG DROP ON FOMC DAY.
.
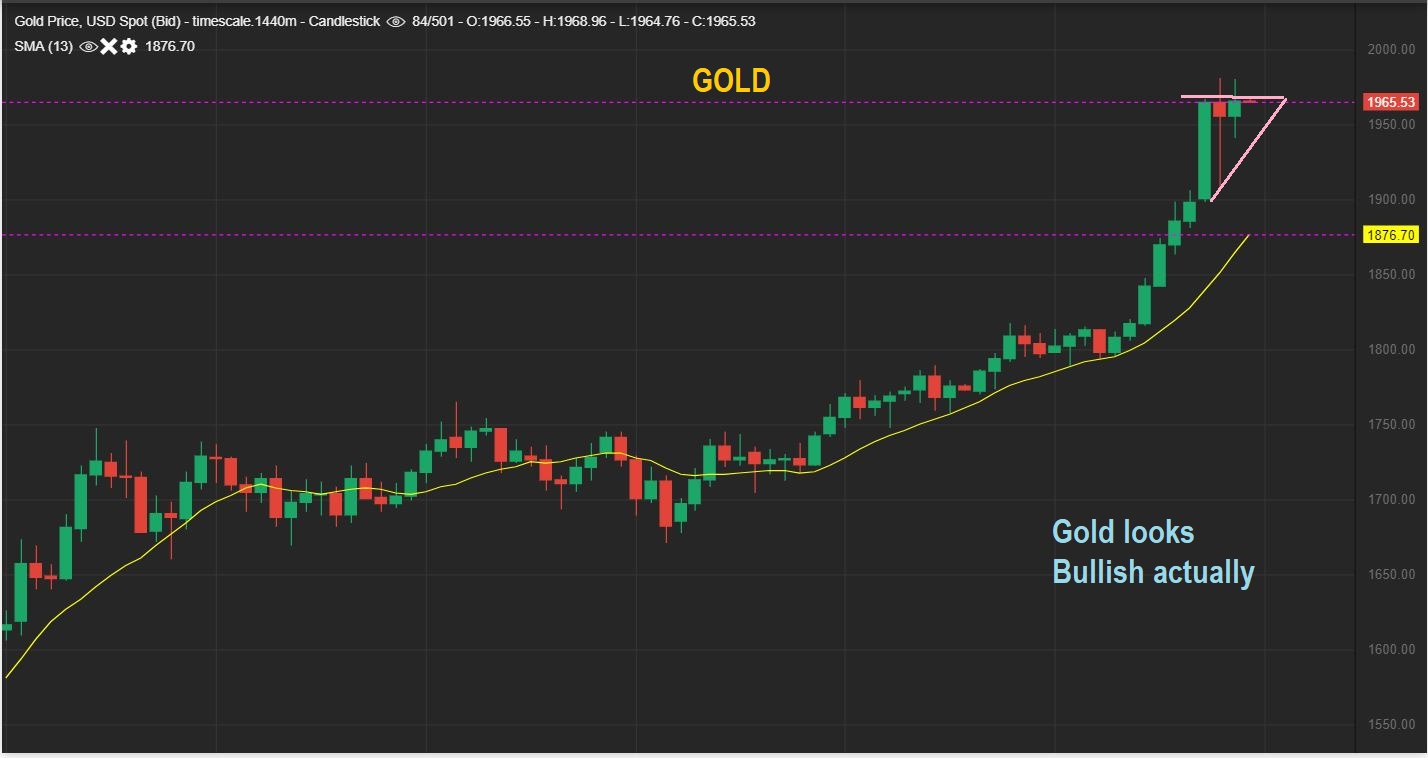
GOLD – When I look at GOLD like this, it looks like a bullish flag, but the internals look to be weakening. We’ll have to see if this has follow through higher or is it topping. If the USD Bottoms, this will likely break down.
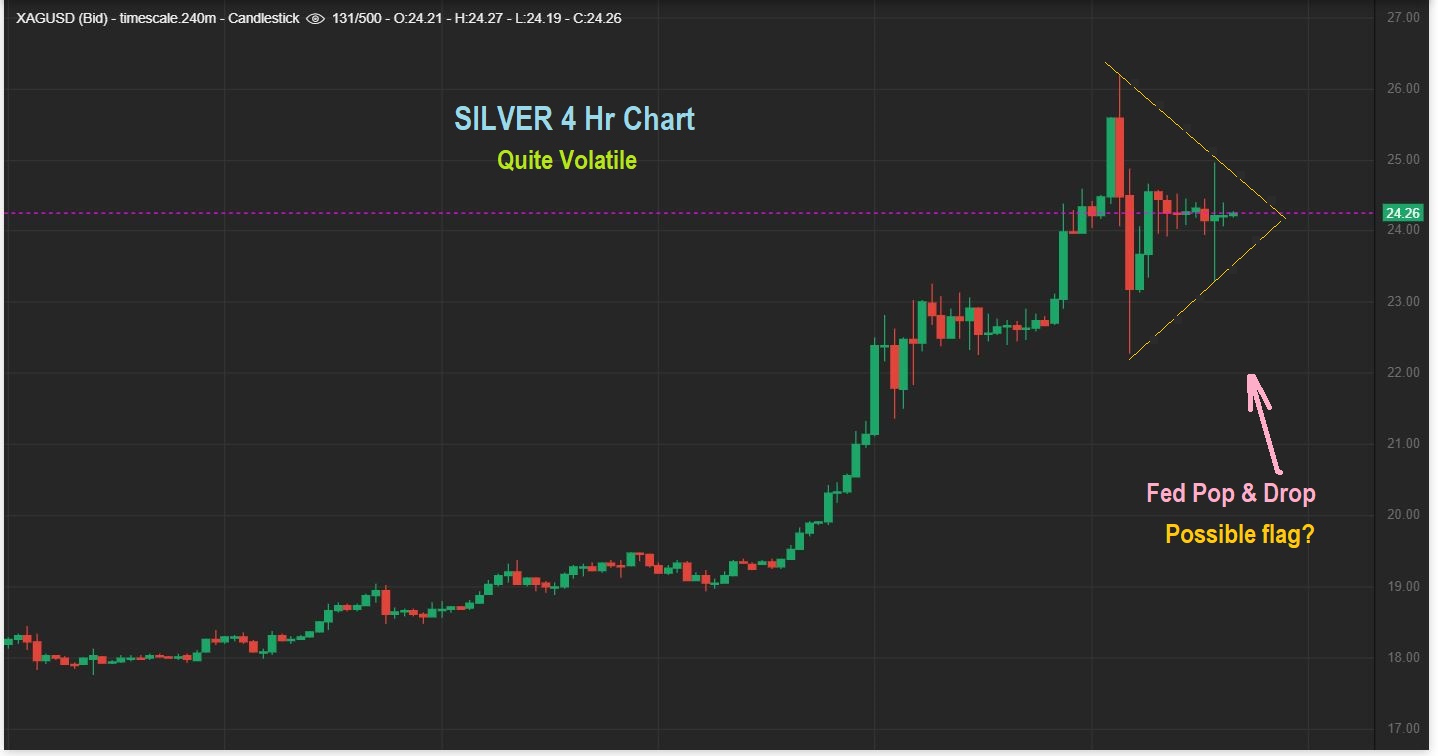
SILVER (4 hr chart) – Ignore that triangle that I drew and we simply have CHOPPY CHOPPY action , and this could be a top to a very nice Bull Run (Temporary short term top). This can break down just as easily as it could break out higher, because these WIDE SWINGS are a sign of indecision. A sign of buyers & sellers at battle.
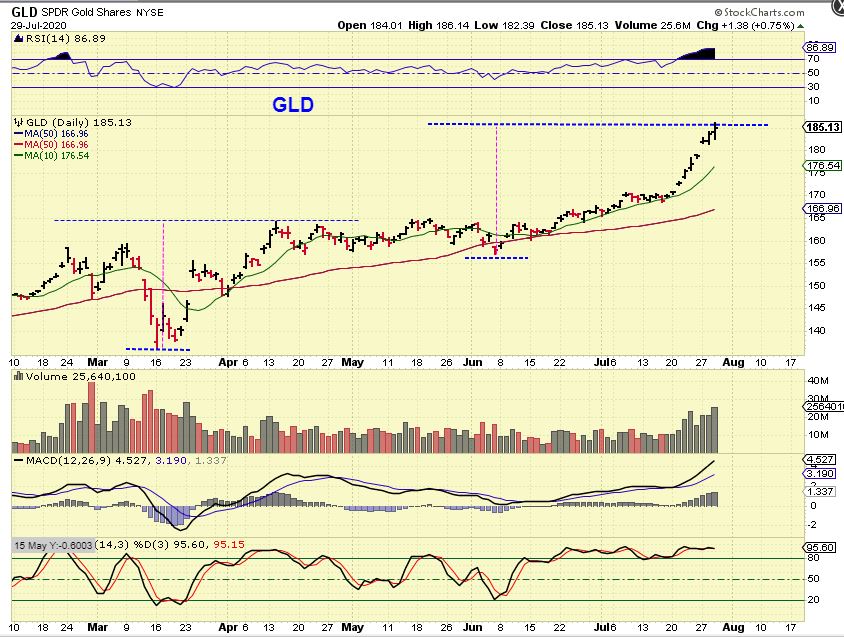
GLD – I drew the GLD as a very bullish run, and it looks like a possible break away gap, however we have seen these gaps in GLD at the end of a run in Feb, March, and April….
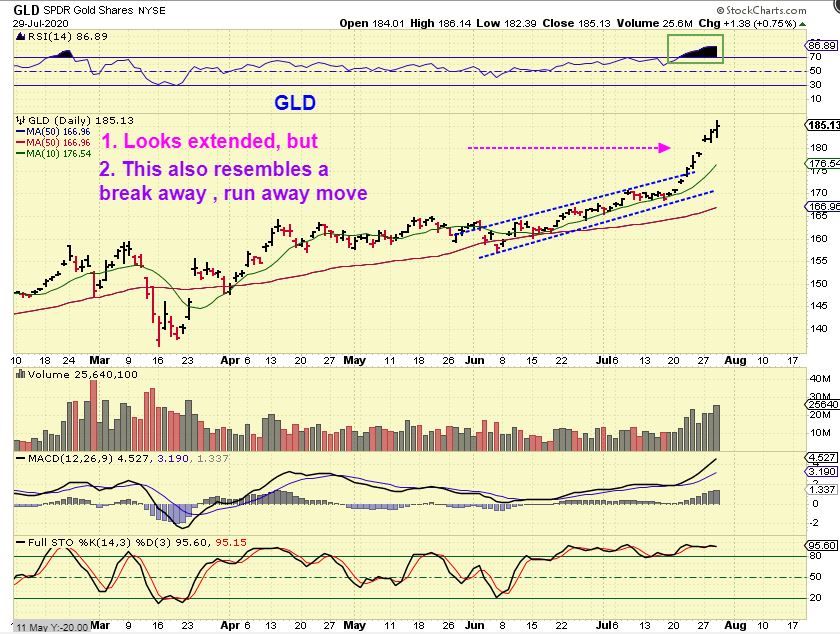
GLD – And if I do the measured target we see that GLD is at the target. A drop to a dcl would fill that gap.
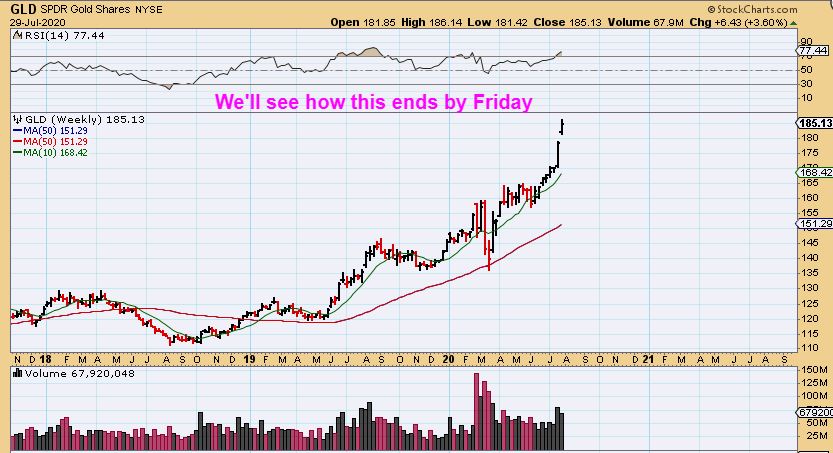
GLD WEEKLY – If Gold drops Thursday or Friday (or both) this will look like a topping candle, so be aware of that today & tomorrow.
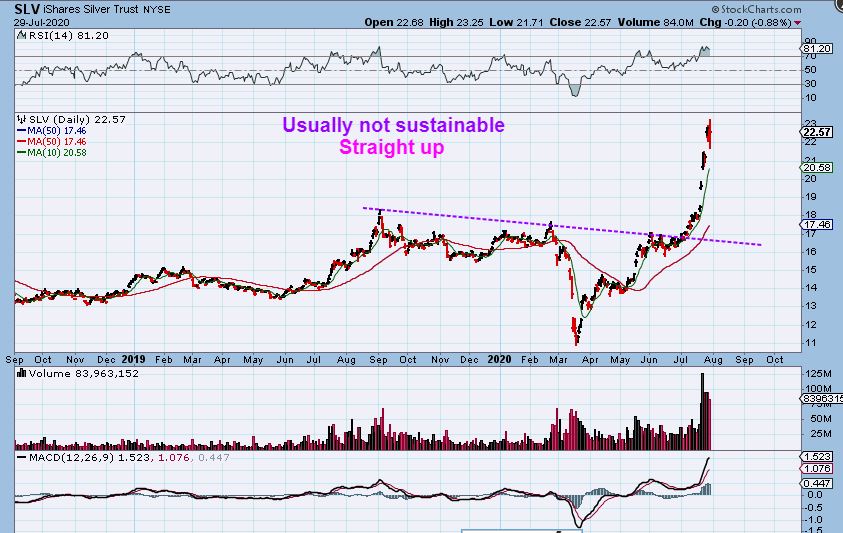
SLV – When I look at SLV, I just have to say that this kind of move is rarely sustainable. It is just a matter of time until this pulls back. We COULD bull Flag DCL, Pop to new highs and then drop in the next daily cycle, but basically when you look at this you just think to yourself, “ Great Run, but this is do for a pause & Pull back”.
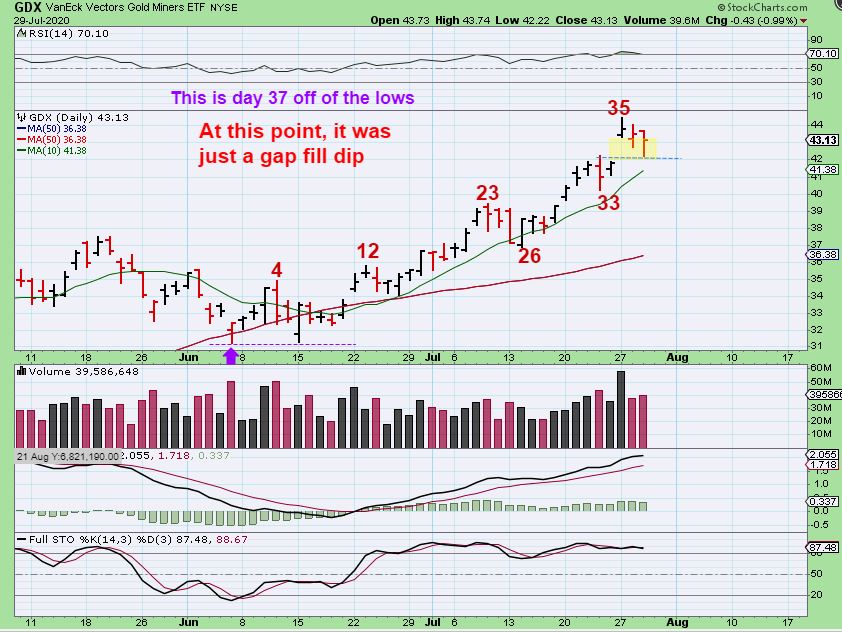
GDX does not look overextended, but when I count the number of days from the lowest point it has been 37 days. Do we see a dcl in that time? Not a CLEAR one, that bends the 10sma down, but 37 days is getting long. SO FAR we just go a gap fill on FED DAY, and then it bounced.
.
SAME CHART – Look again at the cycle count again and Mild Pull backs on GDX again.
1. The Deeper low for day 1 is very close to the day 6 low, but trust me, the purple arrow is The Low.
2. The dips that came after that day 6 low do now show a deeper dip for a dcl, except for MAYBE day 26.
3. Day 26 did not bend the 10sma down, so we usually ignore those, but in hindsight might it be the dcl?
4. Next let me show you something else…
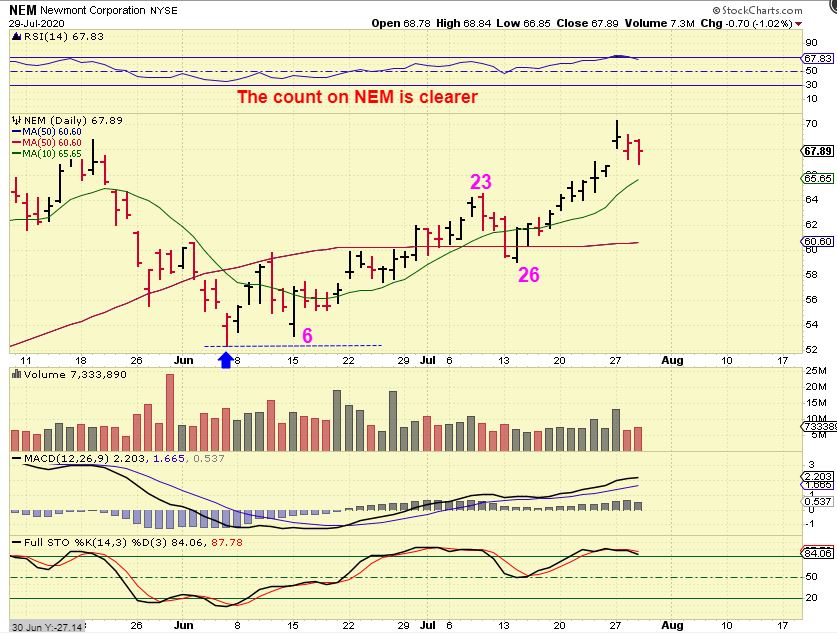
NEM – When I look at NEM, the initial low (blue arrow) is clearer than the day 6 dip, and the day 26 drop was clearer than what showed up in GDX. On this chart , that dip may qualify as a 4 day dip / reversal into a dcl. Just keep that in the back of your mind. Why? IF SO, this would be a day 9 peak on the next daily cycle.
.
During choppy sideways moves, especially in the latter part of a daily cycle or Intermediate Cycle, you usually need more time find direction. It also becomes difficult to trade or ride positions at times. This chop can even lead to a late cycle POP and Drop (a false break out that rolls over late in a daily cycle). Initially, the FOMC Mtg was a ‘Non-Event’, it really didn’t cause a big Pop or Drop with a lasting move Wednesday, but at times we have seen the move develop the next day. That next day is today, so we’ll see how this plays out.
.
Note: At one point over the past few weeks I have had as many as 16 long positions open at once! Many Miners trades were just trending higher, since I had mostly Silver Miners and The Biotech bases that were Popping or trending higher too. last week I started to skim some profits from my extended Miners. EXK & FSM for example looked extended, but have since consolidated a bit and may continue higher out of flags. I can always add back on if I want. The point is that I wanted to lock in some gains before the FED MTG, just in case there was a slam down. Now I want to see what follows. After selling some POPS in Biotech and skimming some Miners, I am about 40% cash at this point, I have smaller positions open, and I’m very happy with the results of the last few months of trading. Our accounts should reflect good gains in the Miners alone since March, but it does seem to be getting choppy again later in this intermediate cycle. I feel the choppiness in other areas too. My stops ( mental stops) are threatened and upward progress slows down. This has happened in a couple of the Energy trades that I took. So for now my eyes become a short term trader again, until I see more of a trend. I am hopeful that the BITCOIN/Blockchain trades can be held for longer term. Maybe today & tomorrow we’ll be able to see if this is the short term top for the Precious Metals with all of this choppy indecision, or do we have a little more upside ahead. And is this a low for Energy with a trend higher starting? Or is it more choppiness? Can the SPX get to prior highs like the NASDAQ did? Time will tell.
.
Stay Frosty and Enjoy your Thursday trading.
.
~ALEX
.
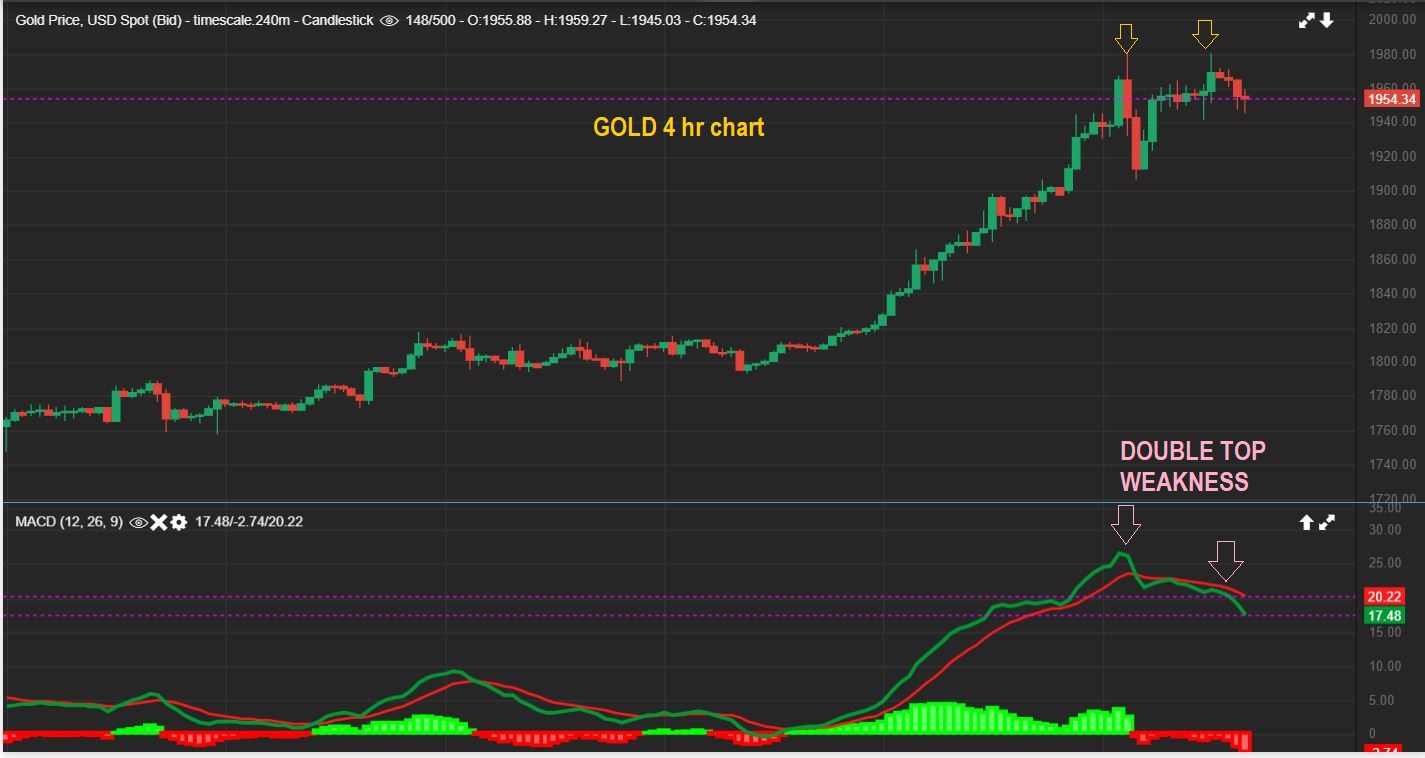
GOLD 4 HR CHART 6 a.m. Eastern time- Gold double topped last night and there was Weakness on that 2nd top, so Gold looks ready to pull back, at least in the short term, but this may be a double top that lasts.
.
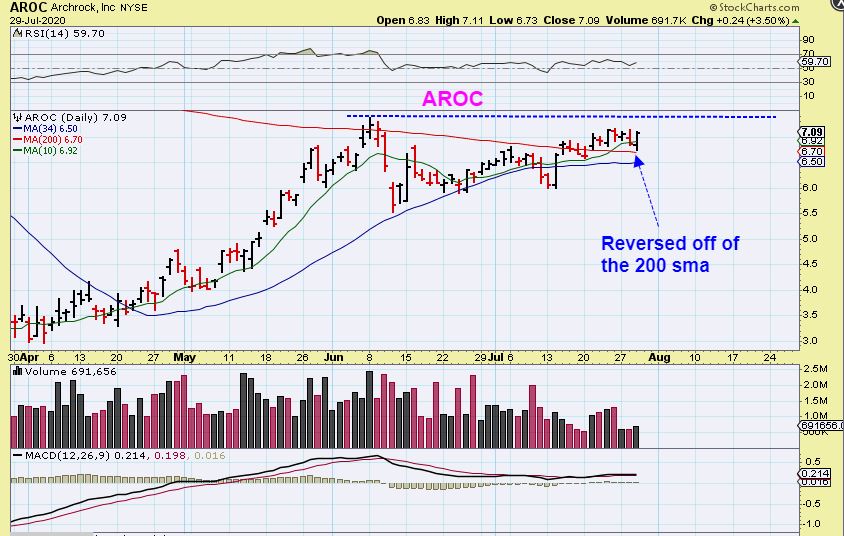
AROC still hasn’t lost the 200sma in all of this choppiness, so I like it as an energy stock.
.
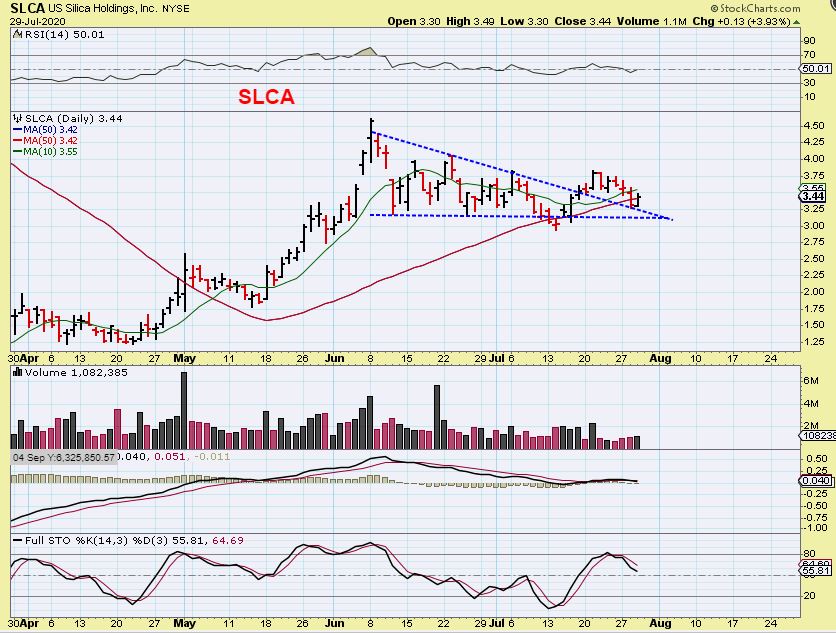
SLCA – Another Energy stocks that I think is acting correctly, but it also has been a bit choppy short term.
.
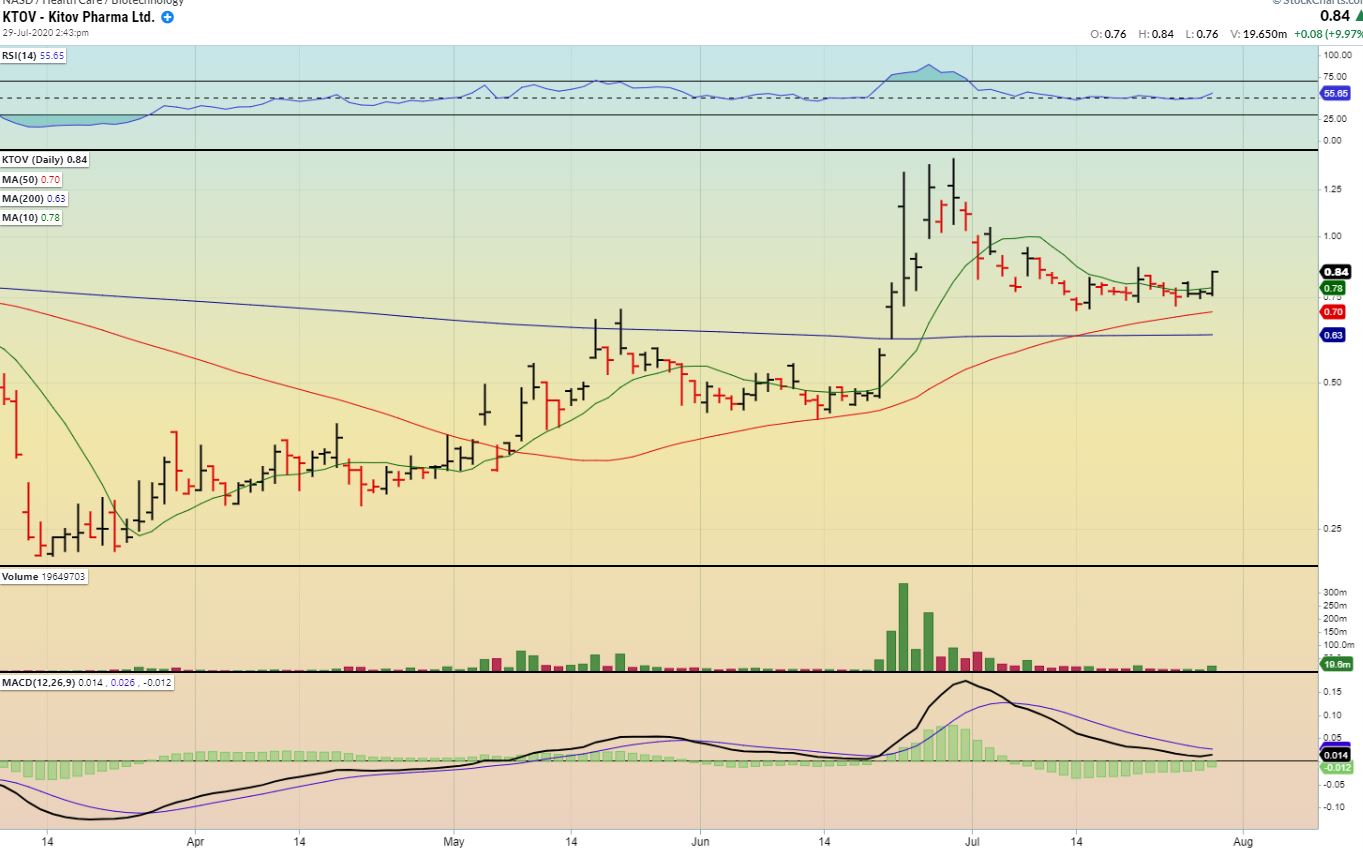
KTOV – This is a Pharma stock that had a choppy trend higher, then it dipped and POPPED for a week with solid gains. Now it has been consolidating sideways above the red 50sma. I entered the trade with a starter position, but this also may continue sideways until that 50sma catches up. I just like the set up & gains produced in this one.