
July 25th Weekend Review
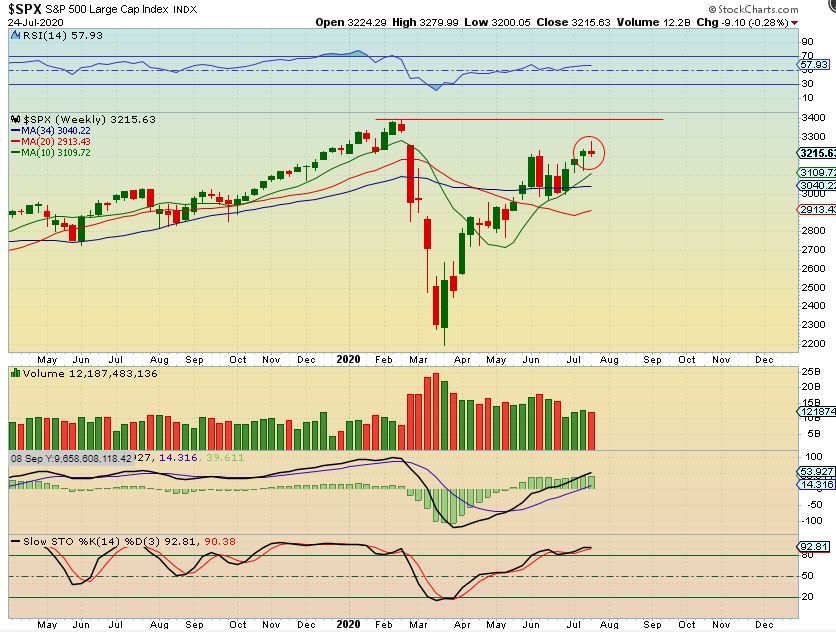
SPX WEEKLY – I took a small short position as a hedge 2 days ago, and I’ll discuss that in a moment, but I’m thinking that it may just be a very short term trade. This does look like a possible topping candle and the dip could continue…
.
SPX WEEKLY – I am a short term trader as well as medium term swing trader, so the short was thought of as just a short term trade / hedge. I would say that cycle-wise, we could have a 1/2 cycle dip develop. They occur roughly 1/2 way through a daily cycle, so that would be around day 20 or so (These are not exact). It shows up on a daily chart, so let’s take a look at that.
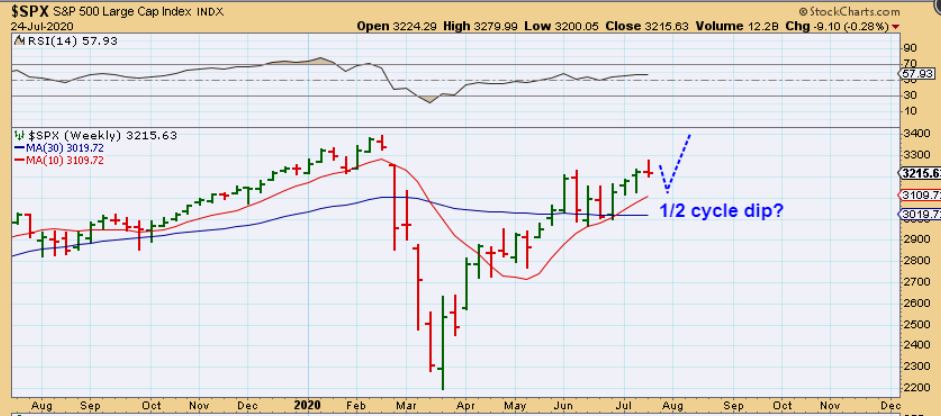
Let me start this way: A first daily cycle out of an ICL (Intermediate Cycle Low) is strong, roughly 30-40 days long trough to trough. The 2nd is also usually progressive and can be strong too, but the 3rd may become the peak of the run, a run that consists of 4 or 5 daily cycles. The 3rd may start things rolling over, we’ll see. In a strong bull run, the cycles can just keep climbing ( we saw that with Gold recently). The 3rd daily cycle for Gold was still at the highs on day 30. THAT SAID…
.
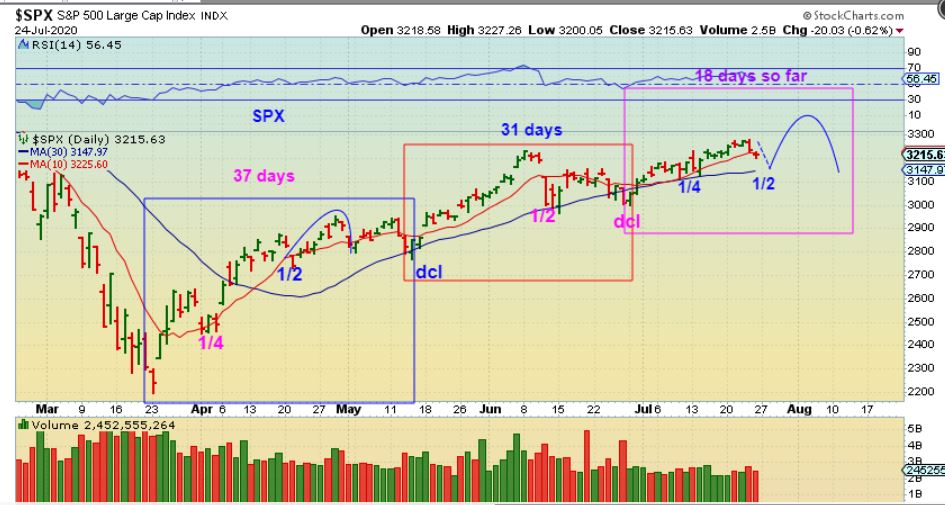
SPX DAILY CYCLES – Each daily cycle ( box of roughly 30-40 days) has dips along the way too. We call those 1/2 cycle lows at midpoint , but I also at times see 1/4 cycle lows, so I pointed them out here. I didn’t label it, but that first daily cycle has a 1/4, a 1/2, and even 3/4 dip, before the dcl arrived. So now, with Thursdays drop starting in this 3rd daily cycle, I am expecting a dip here at roughly the 1/2 way point. I took a small hedge/short. I have drawn a bounce after- we’ll discuss that day by day in the daily reports.
.
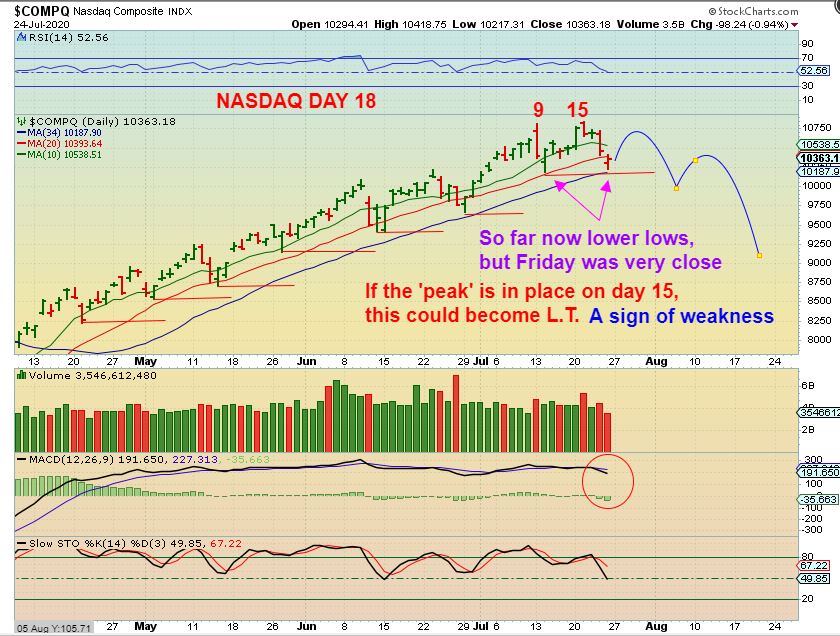
NASDAQ DAILY – In my daily report I said that one sign of weakness that I will be taking note of is a change in strength of the Nasdaq. It has had higher lows all the way up, and the 2 DCLs are even hard to see on this run. Well, WE ALMOST broke the last low on Friday. Is the selling over with that reversal? Maybe. If not, we may get our first sign of the run possibly growing tired by breaking that low. Read the chart: that should say ‘No lower lows’. This is 1 thing that I am watching. We could gradually begin to sell down toward an ICL in the near future.
.
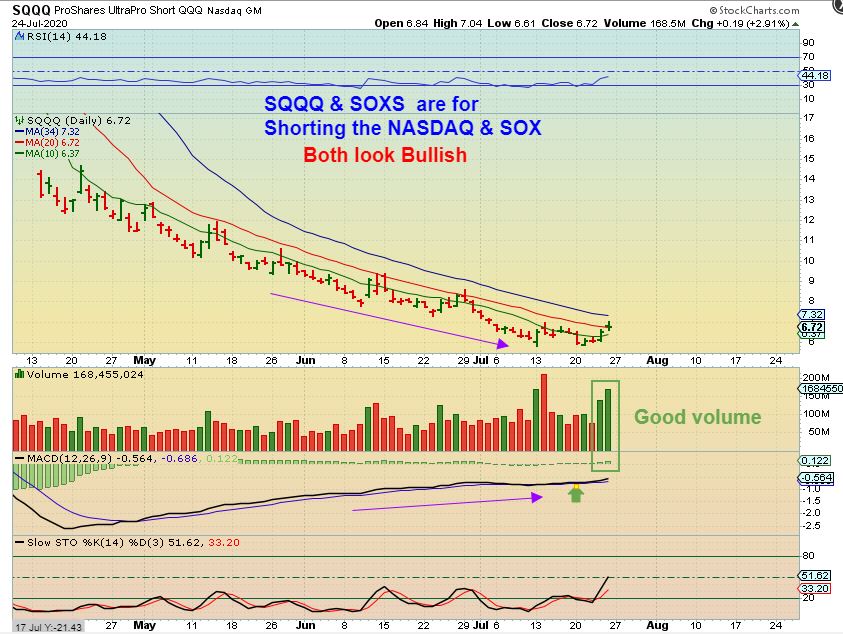
SQQQ ( AND SOXS) – The trade that I took Thursday was SOXS and AMD is not helping my case. I called for long trades in MU & AMD, and AMD is strong, but the SOX did drop and my SOXS trade is green. Look at the volume in SQQQ & SOXS. THIS has me wondering if our 3rd daily cycle is going to be the topping process / peak soon. These look to be in a bottoming process.
.
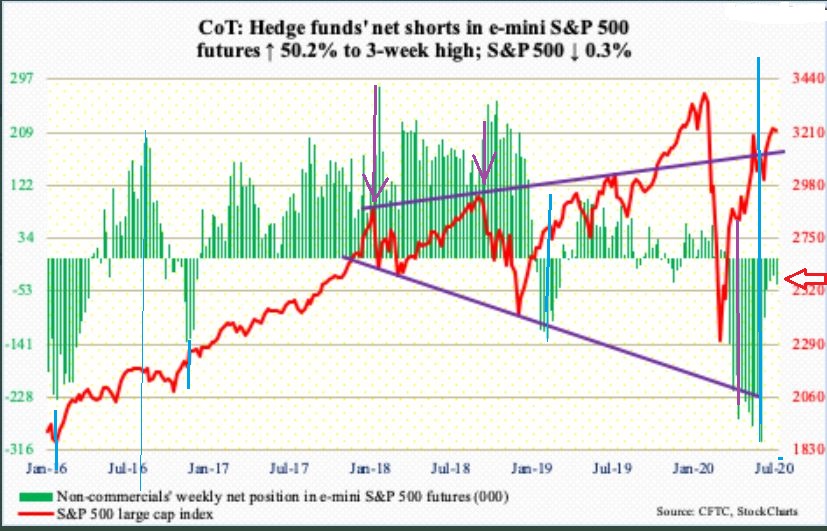
COT SHORT WKLY – When Hedge Funds have been heavily short, markets rally. When hedge funds are heavily Long, they’ve dropped. In other words, don’t follow them, they are often opposite at extremes. They were very short all the way up in this rally and suddenly dropped their short positions on the way up 5 weeks ago. This is rather neutral, but they increased their short a bit . I conclude that : The dip this time may be almost over- just a 1/2 cycle dip. Nothing extreme yet.
,
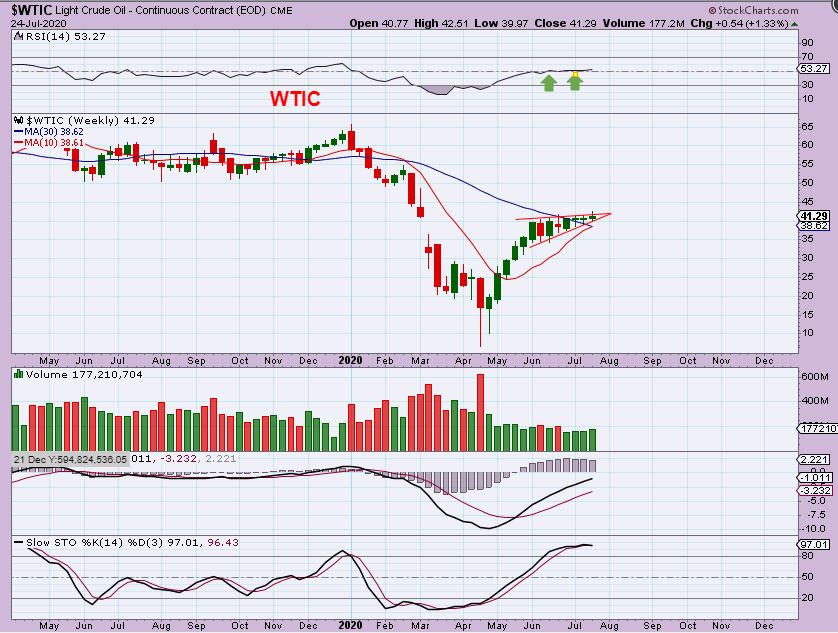
WTIC WEEKLY – I am just waiting for OIL to break from this very tight pattern. Oil has longer daily cycles that Gold , so it stretches further. Believe it or not, to me it looks like Oil won’t dip into a dcl, it is forming a triangle dcl, and they can just break higher. The weekly price is above the 10 & 30 week ma, and that is recovery type action. I think that the OIL / ENERGY Sector is setting up long for the stocks there.
.
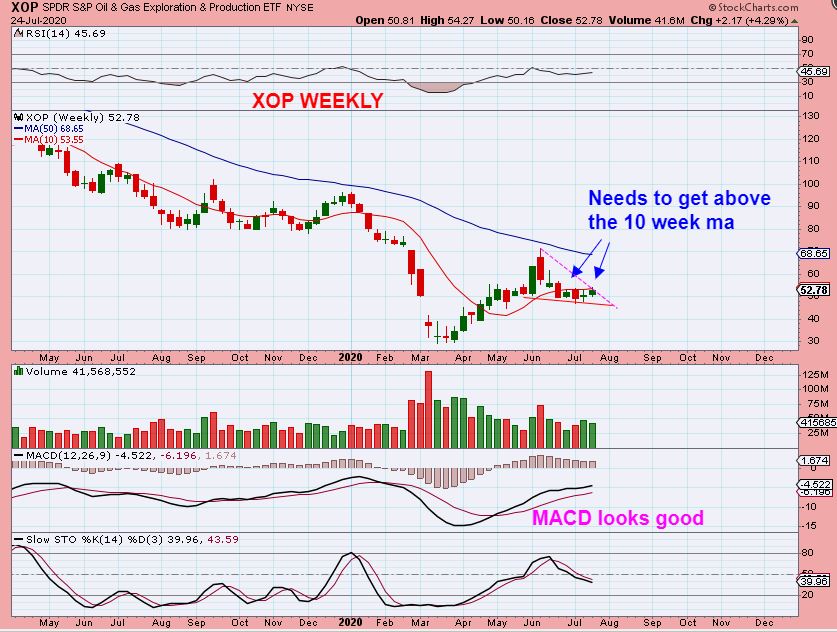
XOP WEEKLY – The stocks in this sector had very strong runs, some of them even 100-500% off of the lows already and have pulled back reasonably. We caught that first run, and I want to catch the second run too. Many individual stocks will still have good gains ( or you can trade GUSH as a leveraged play out of the lows). It moves quickly though, and is not for everyone.
.
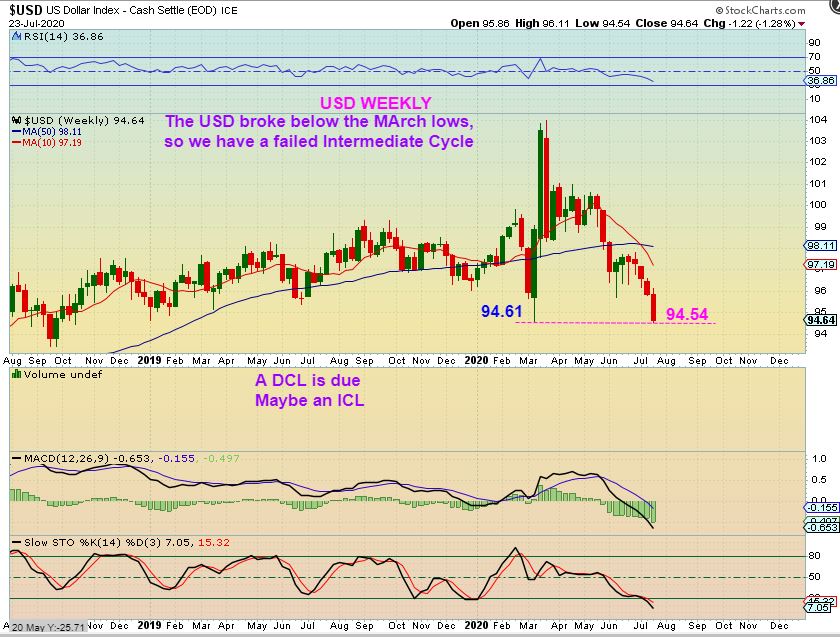
Often the USD & GOLD have inverse relationships. I want to study the USD this weekend with that view, and it can help us to ‘time’ things out. You will see what I mean as we go forward .
,
USD WEEKLY – The March lows were slightly broke this week, so the USD is failing in the Big Picture. It is coming due for an ICL however, so it can bounce for 2, maybe even 3 daily cycles before rolling over again.
Put it this way:
1. For the last few weeks, Gold rallied strongly, the USD crashed down.
2. Now a rise out of an ICL for 2 daily cycles with the USD should allow for a pull back in Gold into its ICL ( 2 daily cycles).
3. So let me break that down & simplify it…
.
So let me break that down & simplify it…
.
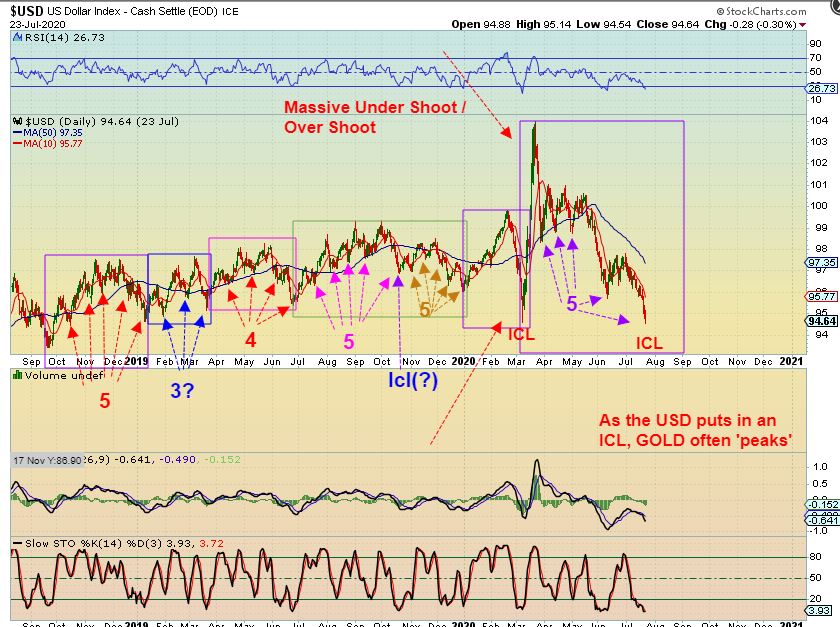
USD CYCLES – Try to see the daily cycles along this road map of the USD.
.
1. A BOX is an entire Intermediate Cycle, ICL to ICL, holding the smaller daily cycles.
2. Within the box are daily cycles, low to low ( or dcl to dcl). 4 or 5 usually happen in an Intermediate Cycle.
3. Read this chart, study this chart. It will help you to understand cycle movement.
.
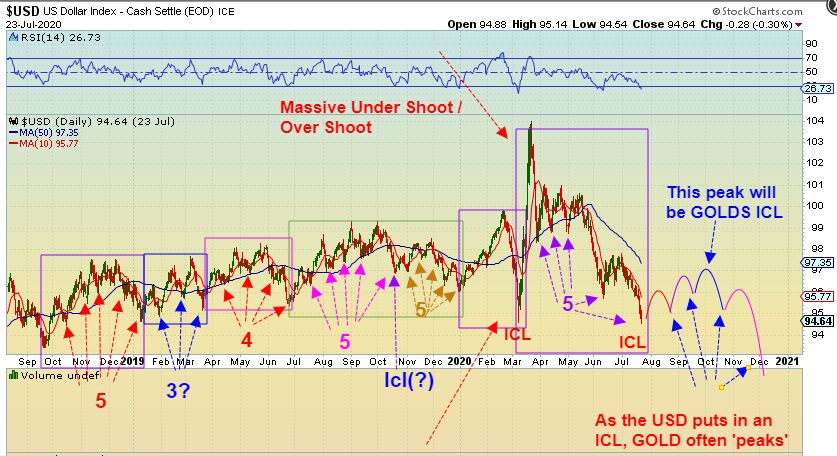
USD VS GOLD: THE INVERSE RELATIONSHIP RETURNS?
.
.
USD CYCLES VS GOLD : Now I added an idea of another 4 or 5 daily cycle Intermediate Cycle. If THAT cycle peaks the USD in September or OCT, then GOLD should bottom (ICL) around that time. Read this chart, it will help you…
.
NOW ON TO GOLDS CYCLES:
.
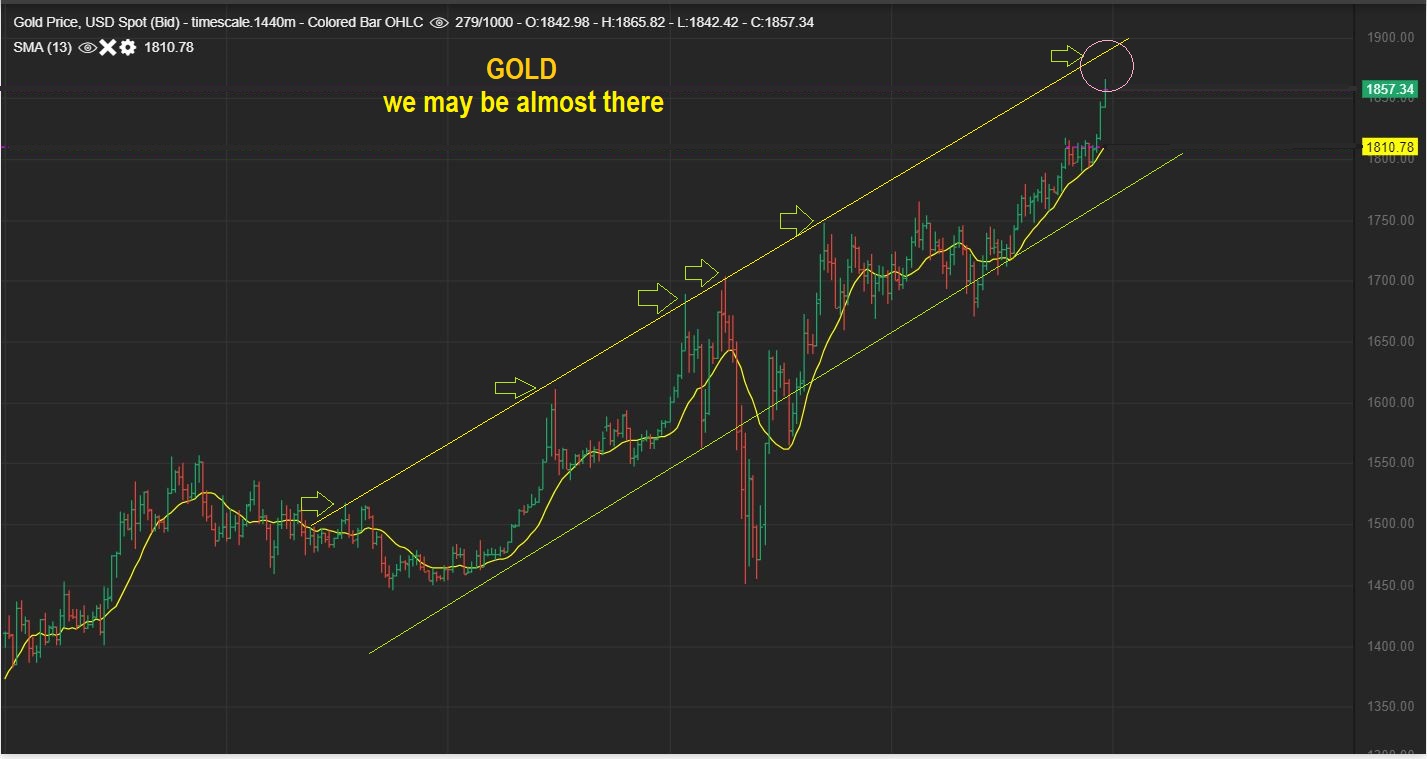
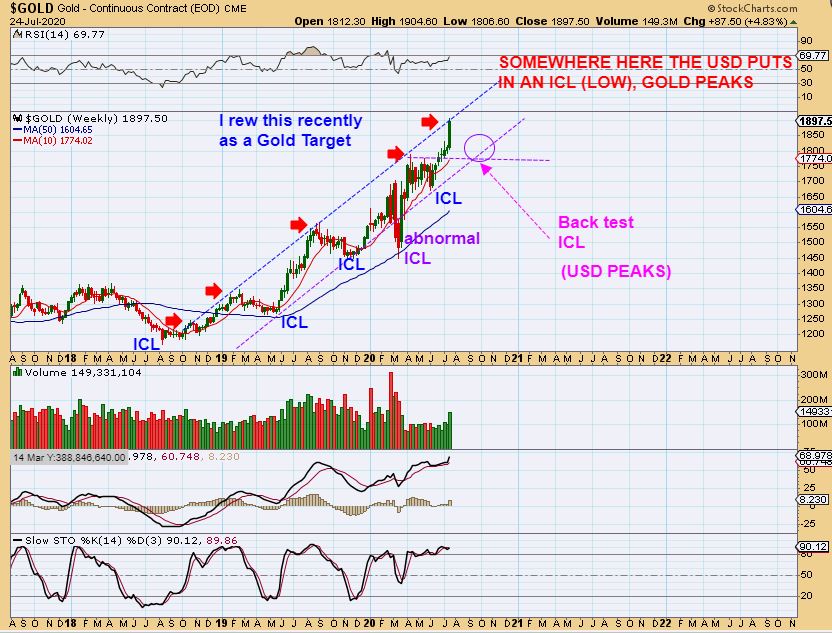
RECENTLY I DREW GOLD AS POSSIBLY TOPPING OUT AT THE TOP OF THIS CHANNEL. A GOLD TARGET.
.
WE ARE PRETTY MUCH THERE NOW
.
GOLD CYCLES #1 – if the USD is about to put in an ICL (low), then GOLD may be about to Peak. This would make sense at the top of this channel. It CAN overshoot a bit, but that will become a false break out in hindsight.
.
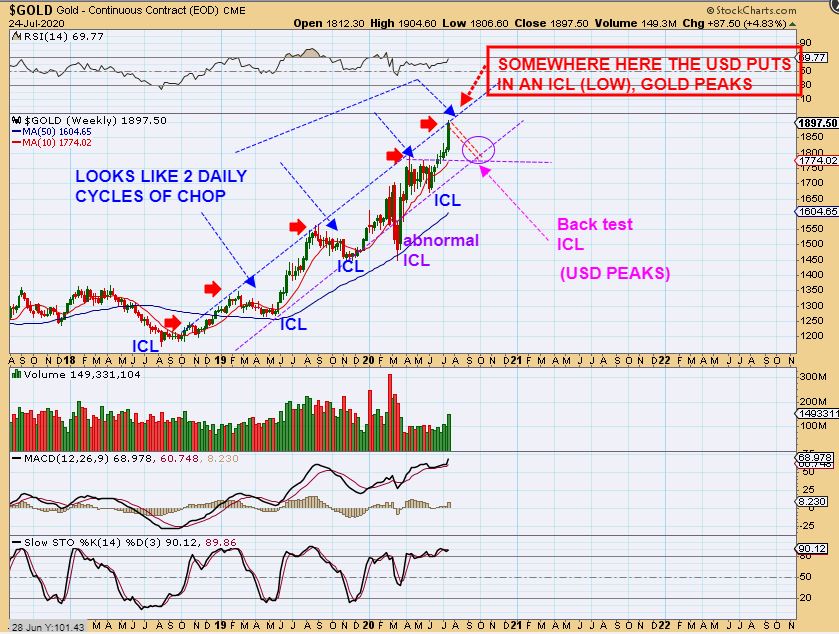
GOLD SAME CHART : I just want to point out the Red Arrow ‘Peaks’ that dropped down to the ICL (lows). Notice that most are NOT a steep drop or crash, it was a slanted choppy pull back in this Bull Run (except for the March anomaly Crash). So when I say that Gold can drop into an ICL, it may become choppy and build a ‘handle’ on its recent formed cup. KEEP THAT IN MIND.
.
GOLD CYCLES #2 – I am highlighting those drops into ICLs here. Gradual choppy boring barely trade-able daily cycles down to the lower end of the channel. Like I said, this may build a handle on the recently formed CUP for Gold.
,
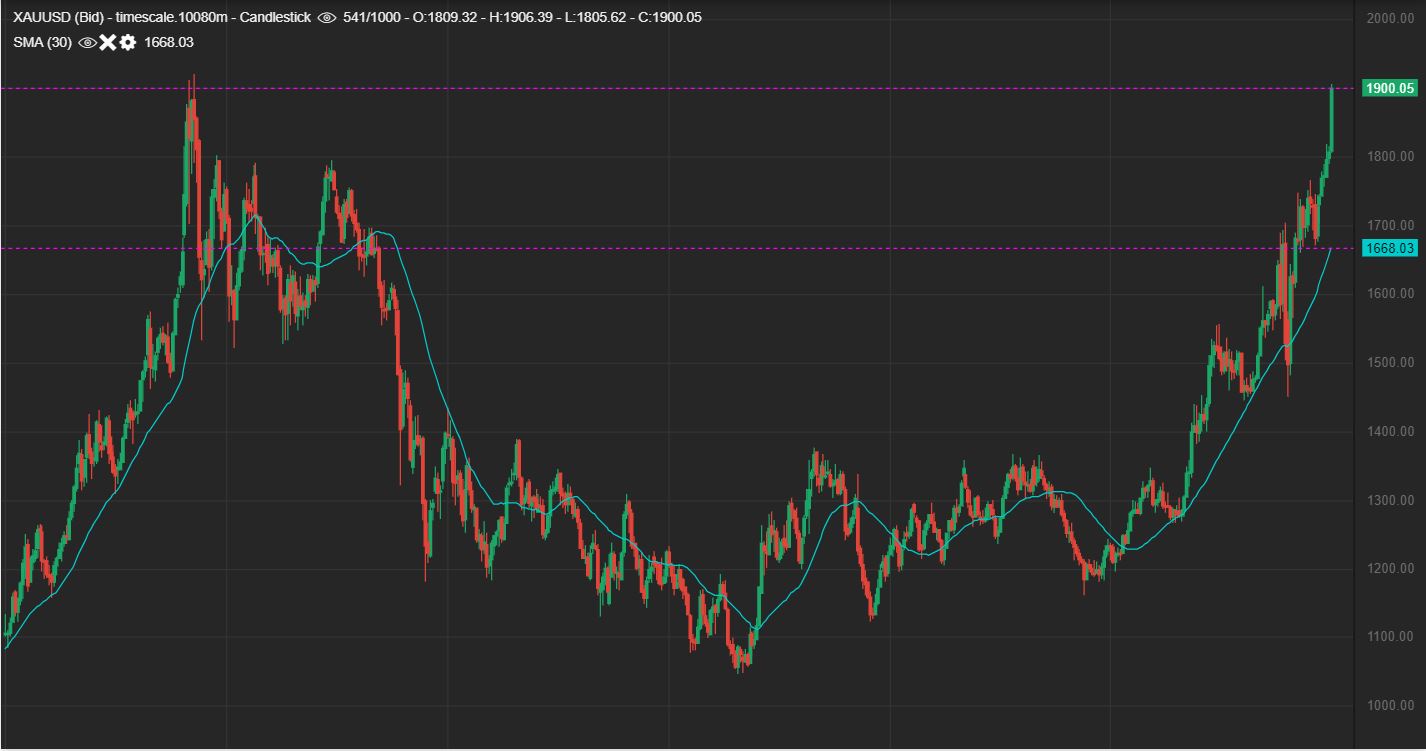
GOLD BIG PICTURE -SO AS I SAID, GOLD MAY BUILD A CHOPPY HANDLE ON THIS CUP AS IT DIPS TO AN ICL SOONER THAN LATER.
.
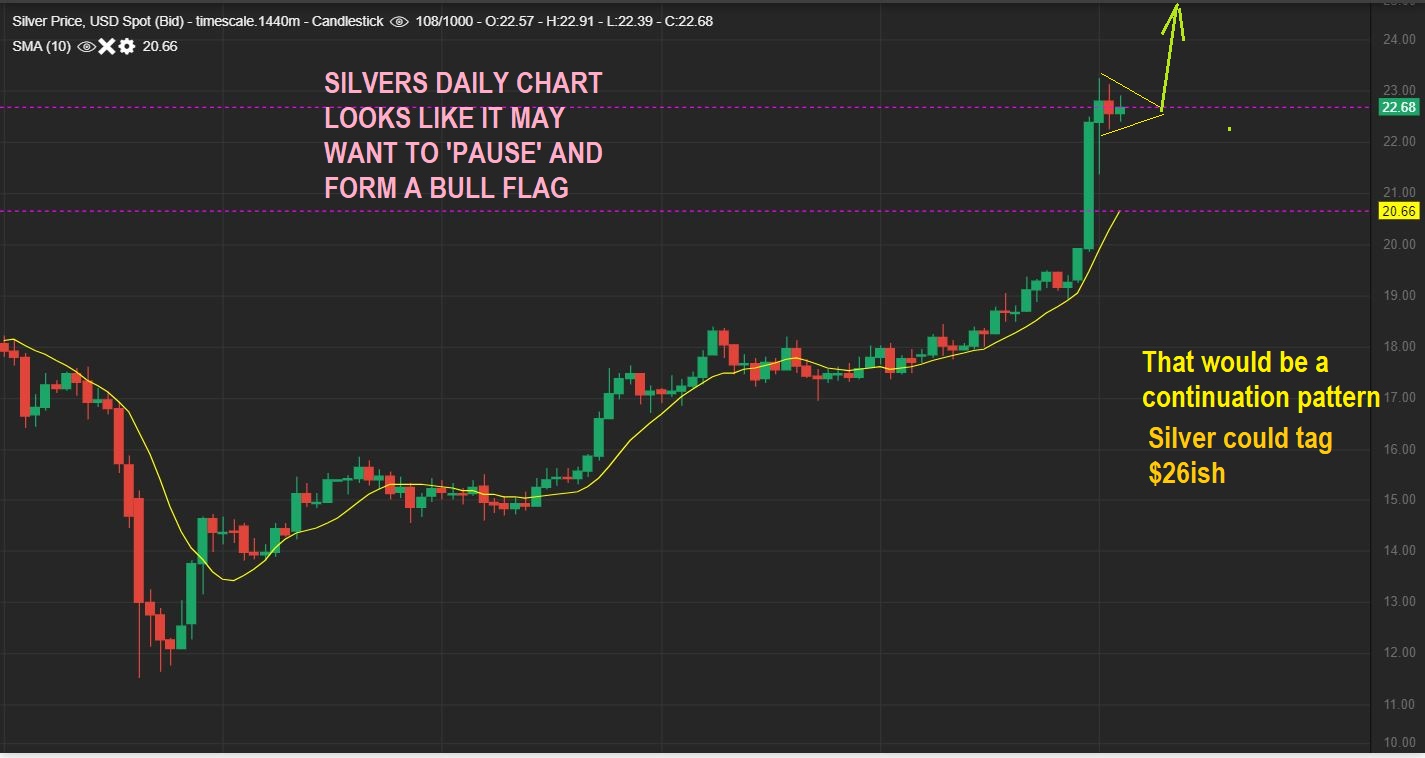
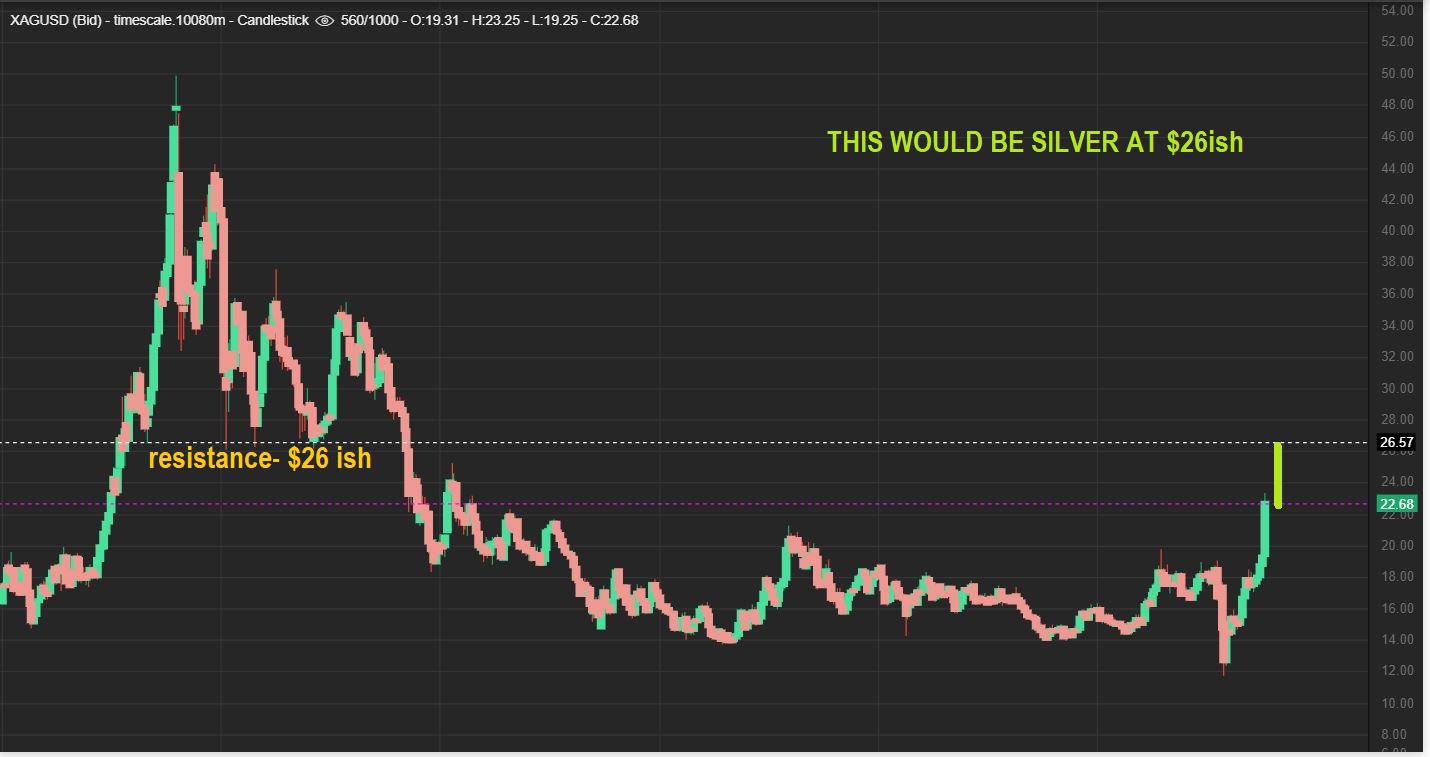
SILVER DAILY – SILVER bottomed a bit later than GOLD and may have another push higher. This does look like a Bull Flag. IF the flag pole is added to the flag, I get $26. keep that number in mind. It is a big move, but is $26 Possible?…
,
SILVER AT $26 – Using technical analysis, a move to $26 is actually the next resistance point. It actually does make sense, but it may or may not happen, we’ll keep an eye on the bull flag.
,
SILVER WEEKLY -In past weeks like on this June 5th chart , I mentioned that resistance area. I also said …
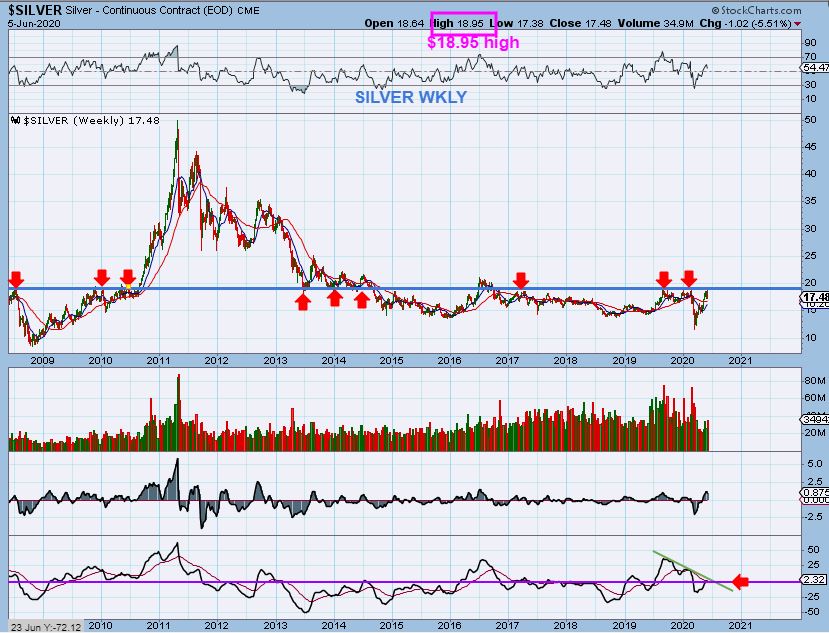
I also said (like here back in May) , that this could chop sideways first, and build an inverse H&S, so we would stay long but watch for a reaction at this resistance point.
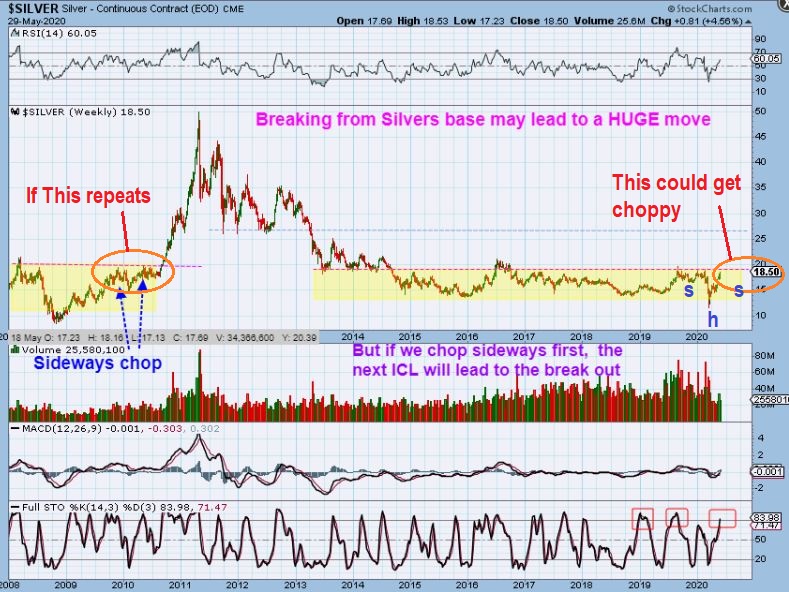
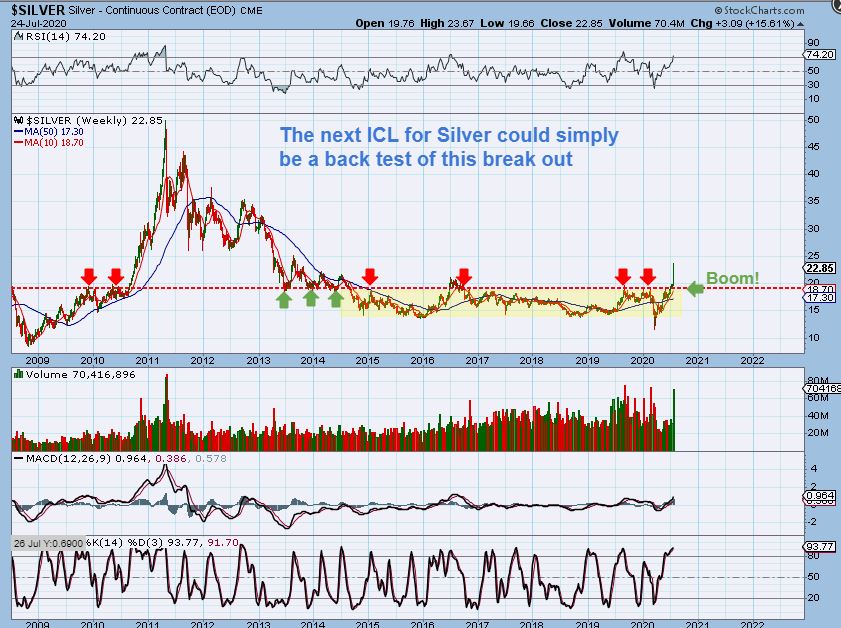
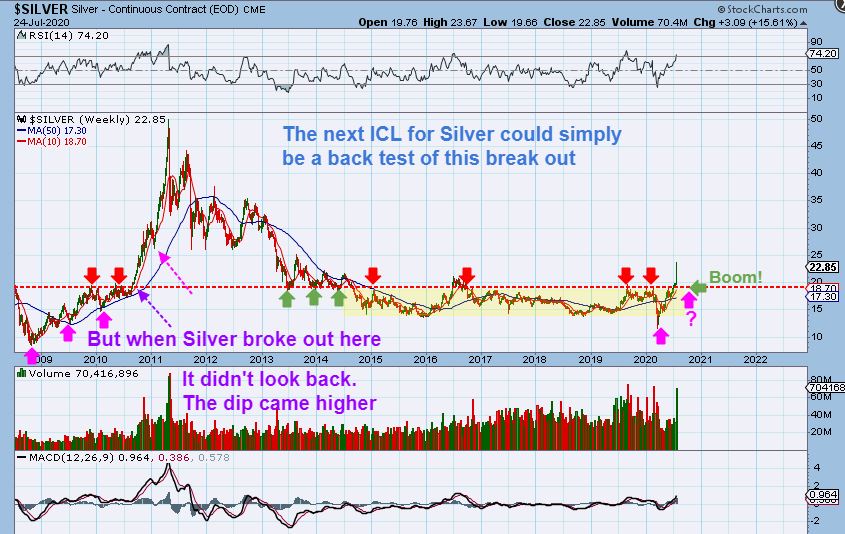
SILVER WEEKLY – After chopping sideways since that May & June chart, we got the BOOM last week. THAT is a 16% move for Silver all last week. Wow!
,
SILVER WEEKLY – So with this break out, we get further Bullish confirmation that Silver wants to run back to the 2011 highs, just like Gold has. IT MAY DO A BACK TEST at the next ICL, so it may not be straight up right now, but when silver gets running, it really runs. Take a look at the time that it broke out in 2010.
.
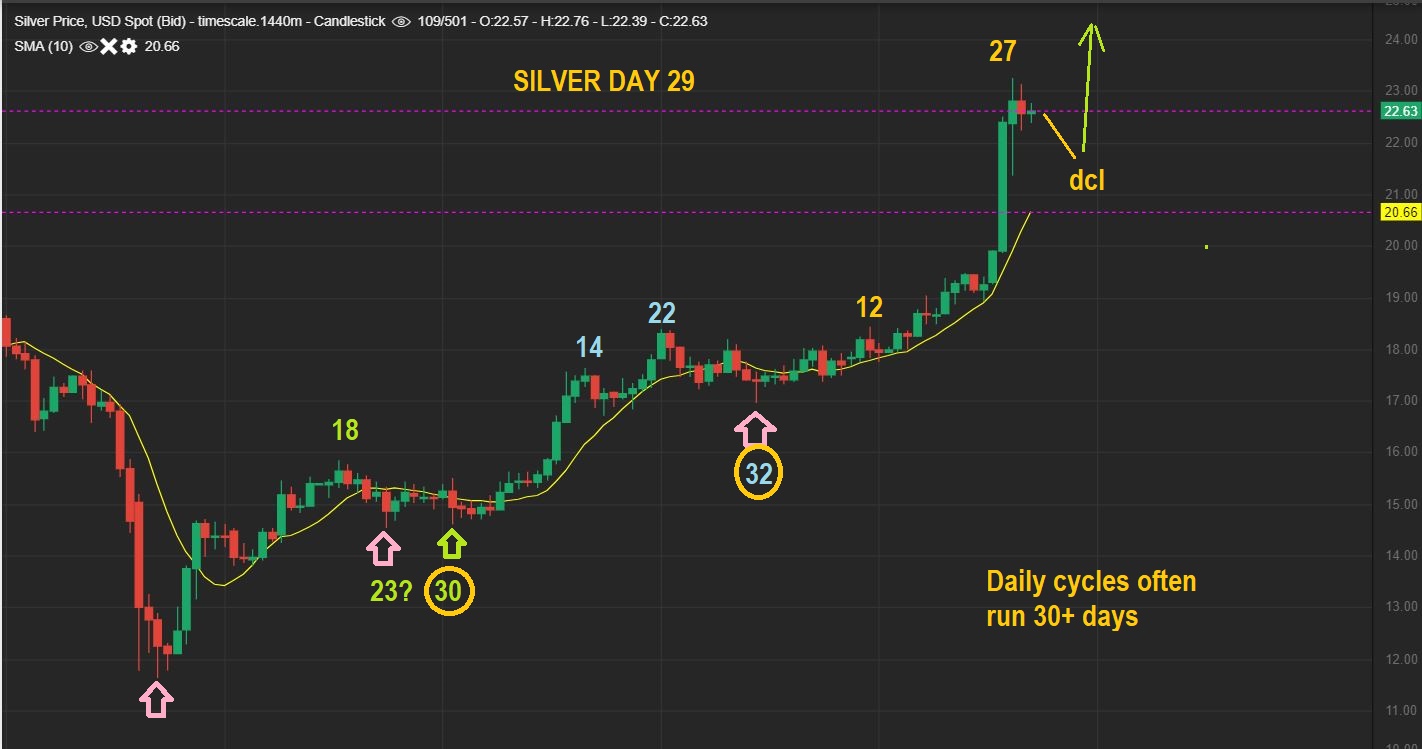
REMINDER: IN FRIDAYS REPORT I WROTE THAT THE CYCLE COUNT FOR SILVER IS LATE, WE WERE ON DAY 29- Today is day 29 and Silver is red hot. That means that it MIGHT continue higher toward $26, even if Gold itself pauses. This could also just Bull Flag as a dcl and then start the 4th daily cycle higher as shown here. Silver has had a Massive up day on day 26, and it is right translated, so after a pause or dip for a dcl, it should make new highs again.
.
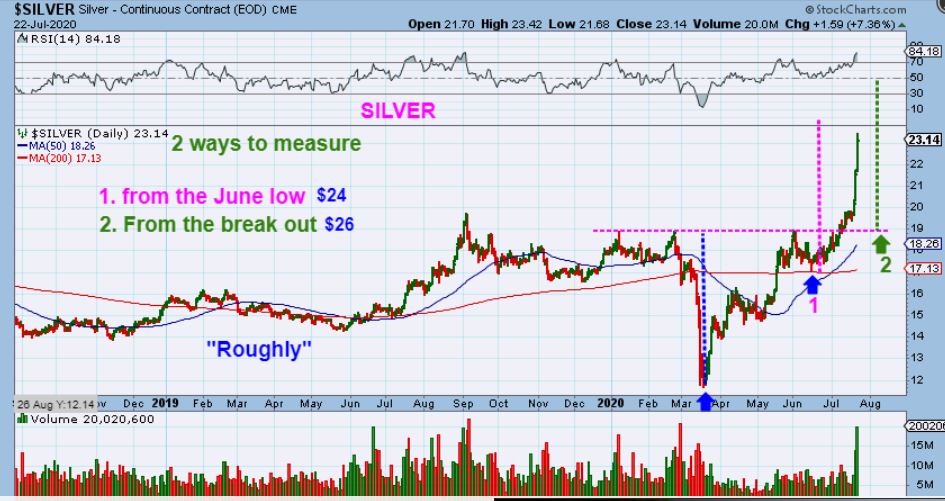
REMINDER: ON WEDNESDAY NIGHTS REPORT I GAVE 2 BASIC MEASURED MOVE TARGETS FOR SILVER :
,
If I use this method, I get these targets for Silver, but we all know that Silver can extend when it heats up. As a guide though, I roughly get ( #1) $24 conservative, and (#2) $26 Actual. Note: $21+ was my original first target and that has been left behind.
.
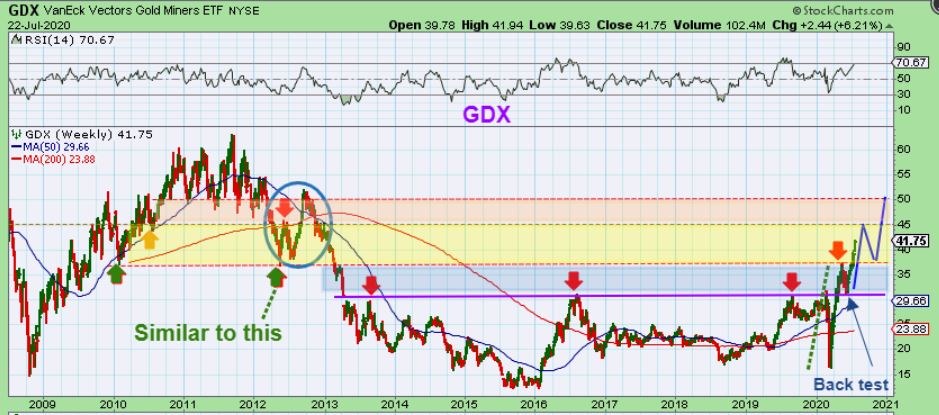
GDX WEEKLY – GDX has continued higher as expected too.
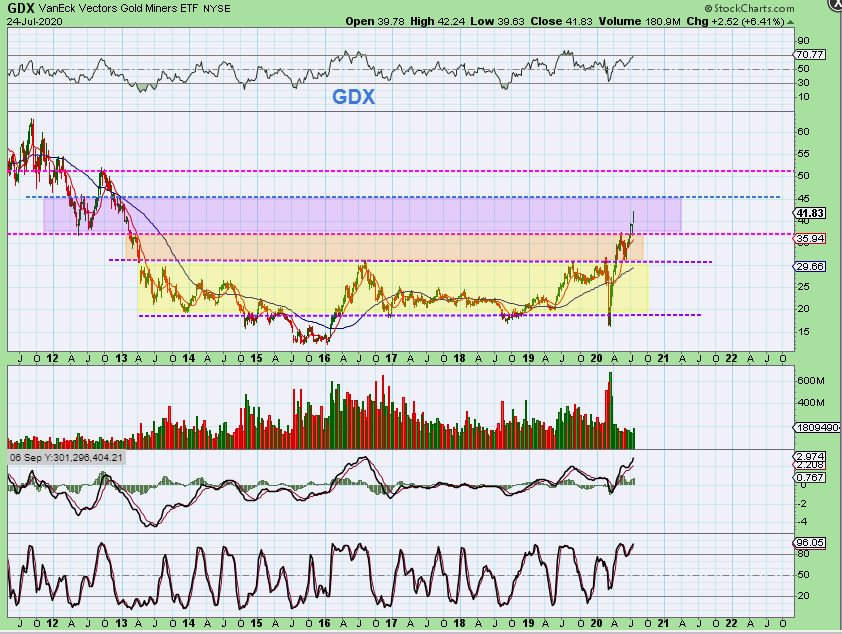
.
This was in Thursdays report. If GDX runs to $45 and then drops to a dcl as a ‘back test’ again, another run could take it to that $50 line . Look at the circle where I wrote ‘Similar to this’. A repeat of that is possible.
.
For many weeks I have been saying that GDXJ should run to $60+ . This was my GDXJ chart from that weekend of JULY 2. The next resistance line was roughly $60-$64, so GDXJ can get all the way up there…
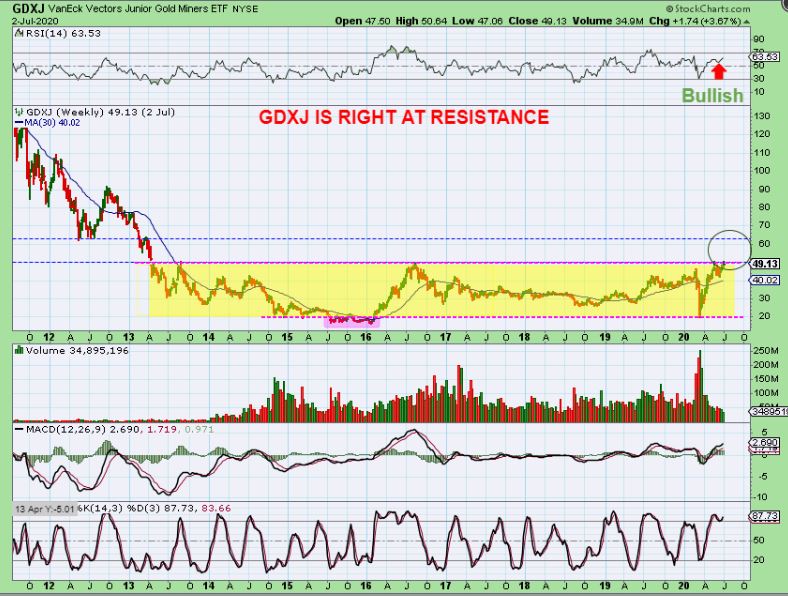
.
GDXJ – This JULY 10 chart pointed to the same area , between $60 & $64 ish.
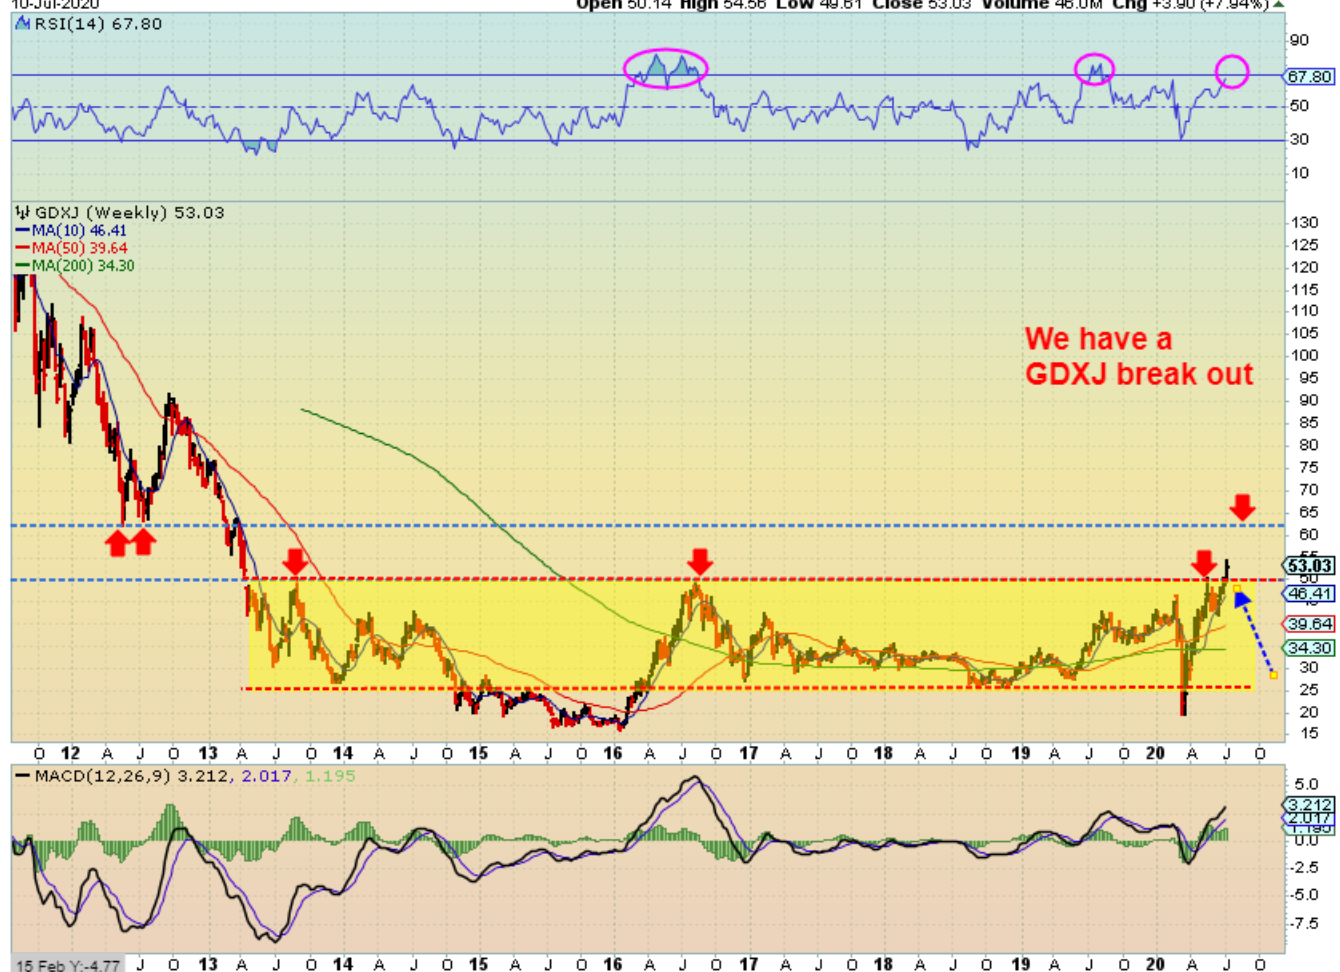
..
JULY 24 (Now) GDXJ TARGET $60-$64ish– GDXJ passed $60 last week. This can be the normal area of resistance and we may start to see some short term topping or selling soon.
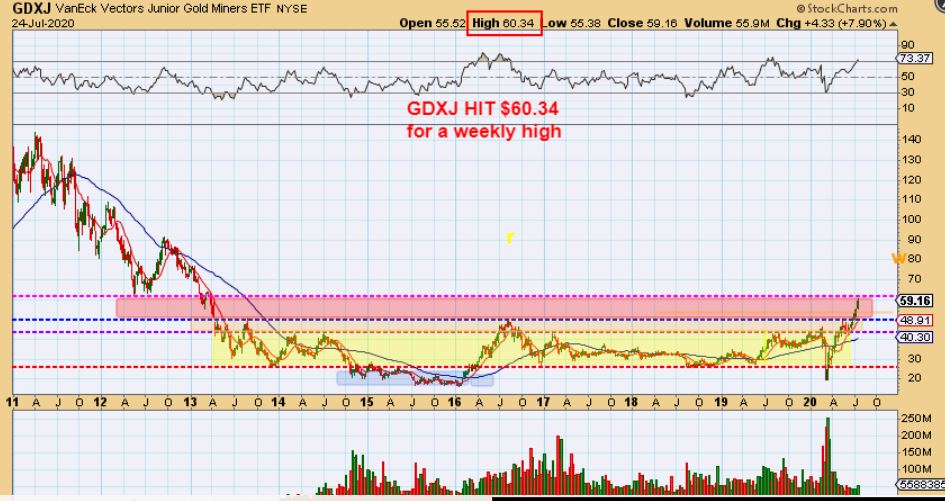
.
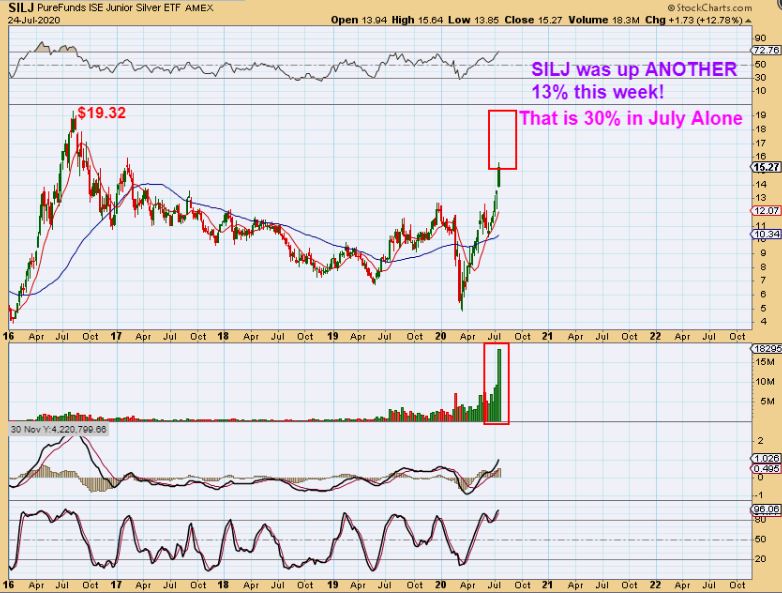
SILJ WEEKLY – SILJ gained another 13% this week alone, so it has tacked on 30% in July Alone. Look at that volume. If Silver were to bull flag and run to $26, SILJ could tack on another good week, pushing it even closer to the 19.32 2016 Highs. It will eventually finish this large cup formation.
.
I put a little extra work in this report to really try to explain how I am viewing things right now. We could be approaching turning points, and that needs to at least be addressed. I wanted to try to show how things could play out if we consider the USD and GOLDs usual inverse relationship. I expect a dip to come, and I would say that it’ll be ‘sooner than later’. Sure, I can see where the USD could drop for another week and the bull Flags break higher and add on some additional gains too, but we’ll have to wait and see. In my opinion, it was time to start at least skimming some profits from extended runners and pocketing some gains. It is rewarding to let things run, and then harvest some gains. It is also good to remember from past experience that as fast as things have been running higher, they can flip overnight and gap down on us too. A Sunday night sell off and Monday morning Gap down could be a possibility, so locking in some gains is one way that ‘the market’ can’t take back what you have worked hard to build up. 🙂
.
Have a great weekend everyone, and We’ll see what next week brings our way. It is true, in a Bull Market the surprises are to the upside, so next week could be as interesting as the last. rest up!
.

