Tuesday June 23rd
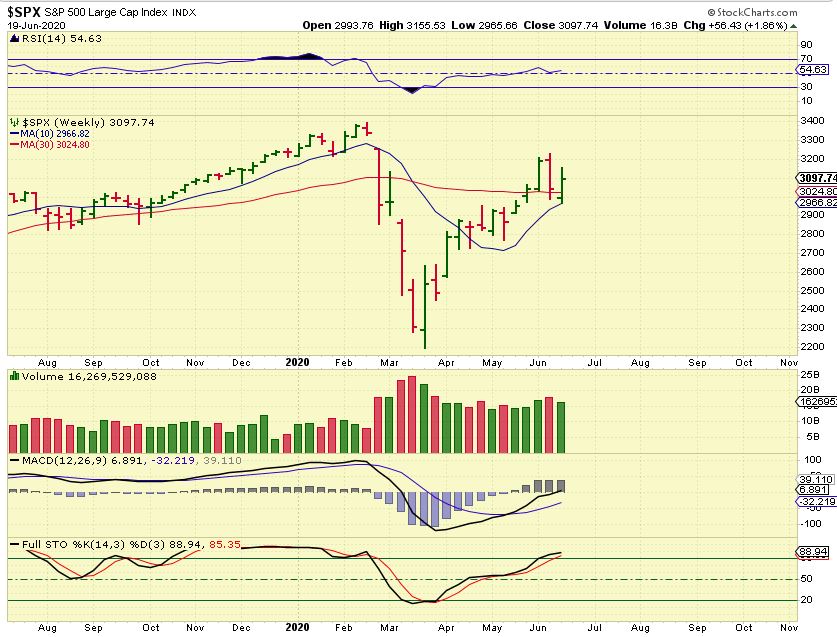
OUR WEEKEND SPX WEEKLY CHART SAID: Plain and simple: This is a bullish chart set up with a reversal off of the 10 week ma. We just had a quick ‘crash’ into a 1/2 cycle low and are in the 2nd half of the 2nd daily cycle, so I would expect this to run to the prior highs. Maybe 3400?
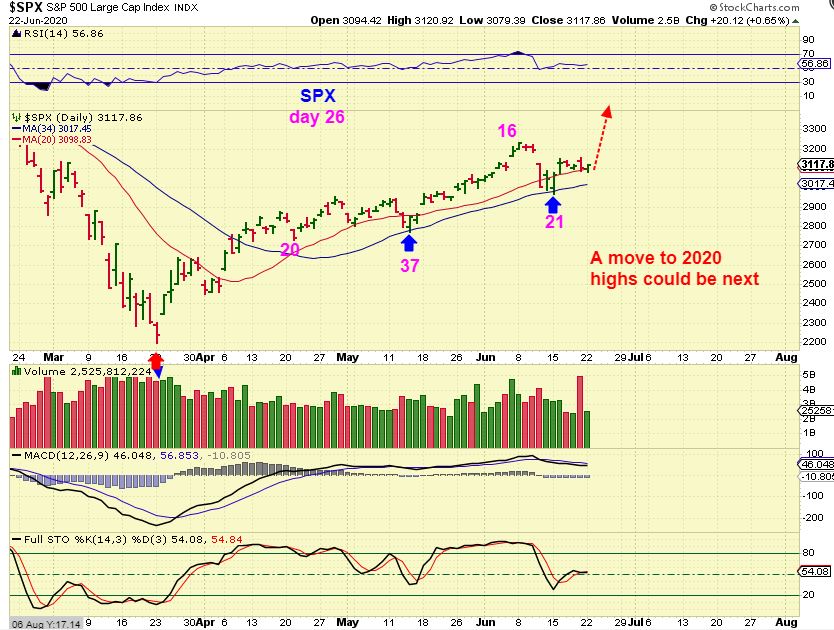
The SPX had a gap open & sell off Friday and a reversal Monday to green Monday. The General Markets were a buy a week ago with a stop under recent lows. This is still a buy ( UPRO , TQQQ, SOXL for example).
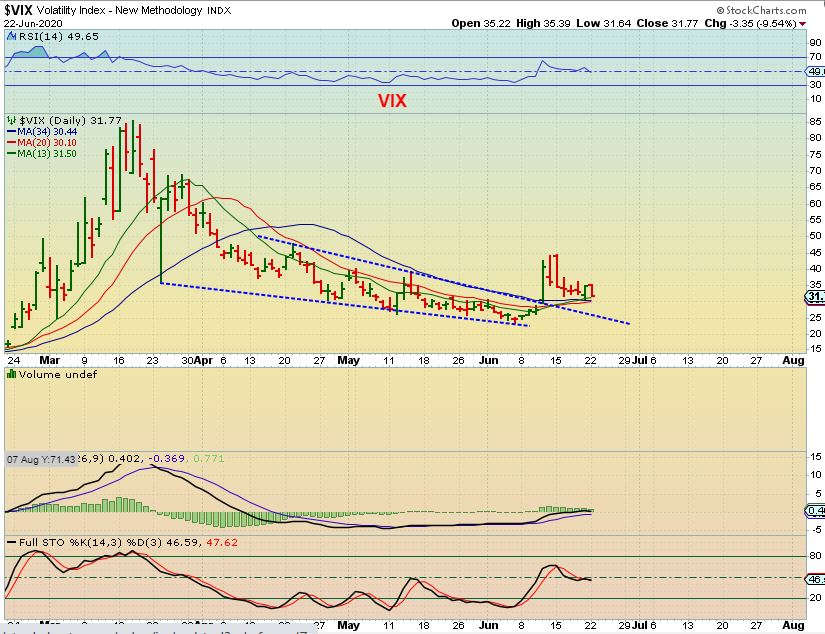
The VIX fell to a support area, but it can back test the blue line and thus fall further.
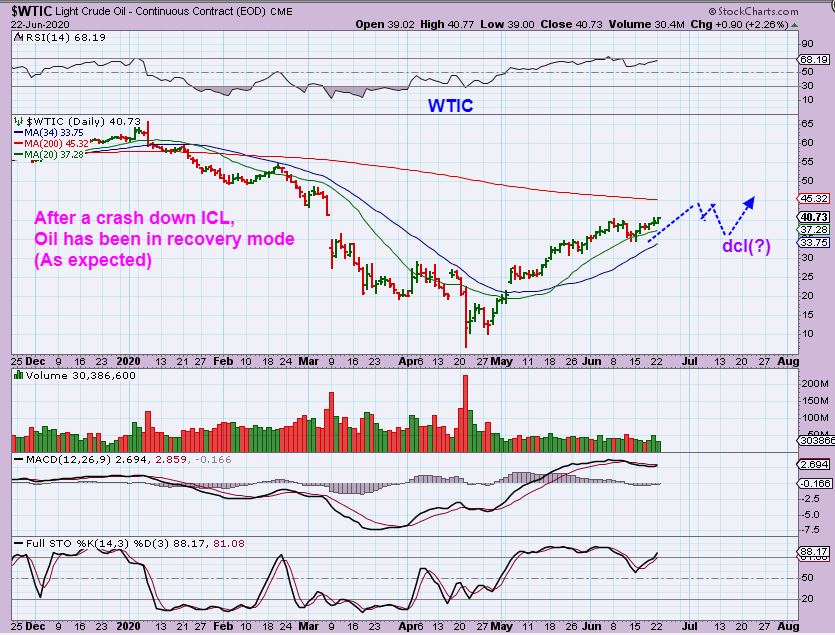
WTIC was also a buy after that dip and I have been saying that I expect a run to the 200sma. It is slowly creeping up to that $45 area.
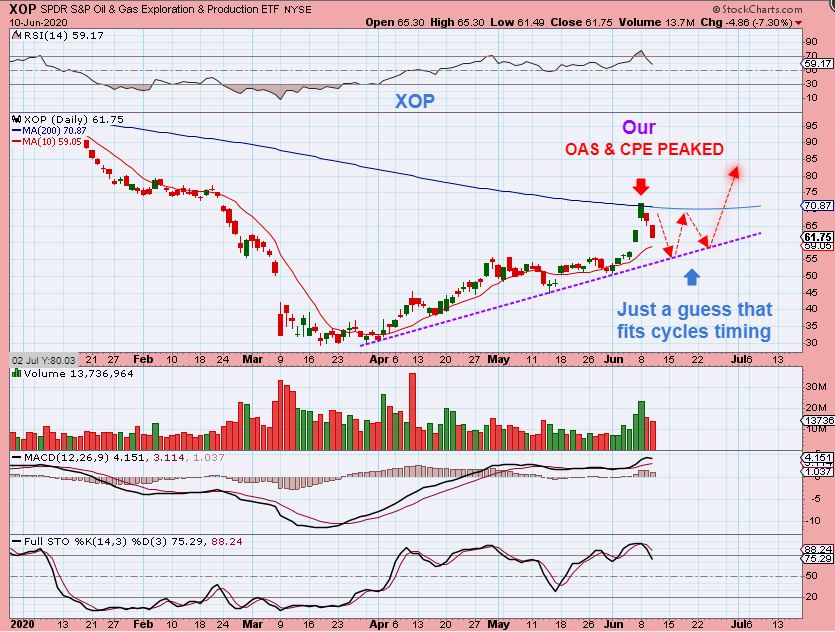
XOP – You may recall this chart from over a week ago where I pointed out how the XOP probably peaked and could now bounce around between the moving averages as shown.
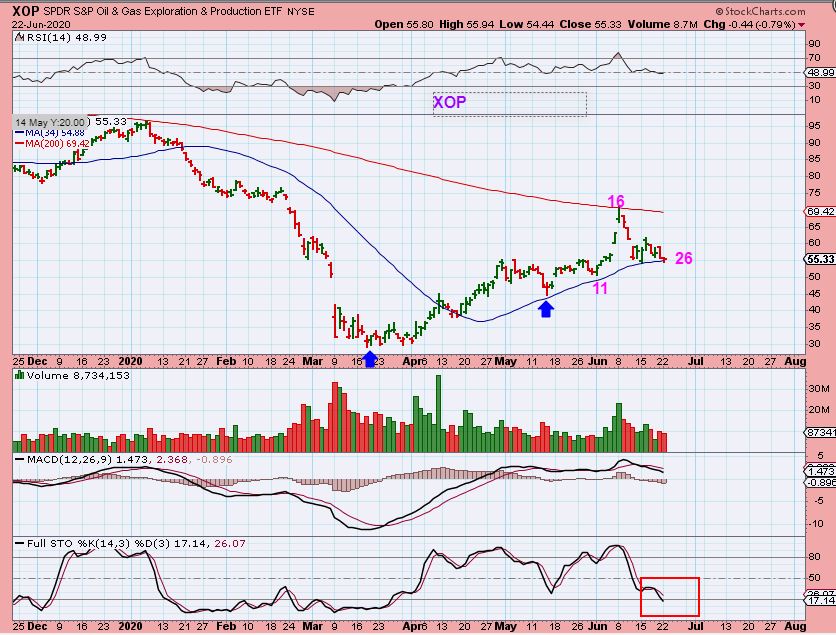
XOP – So far we do see that happening. Energy Stocks popped sharply higher during their 2nd daily cycle, hitting Resistance at the 200 sma. The XOP then dropped from there back to the 34 sma and has been a bit sluggish lately, bouncing there. I would think that this can make a run to the 200sma again, as Oil climbs higher. It has now reached oversold.
ARE WE THERE YET?
.
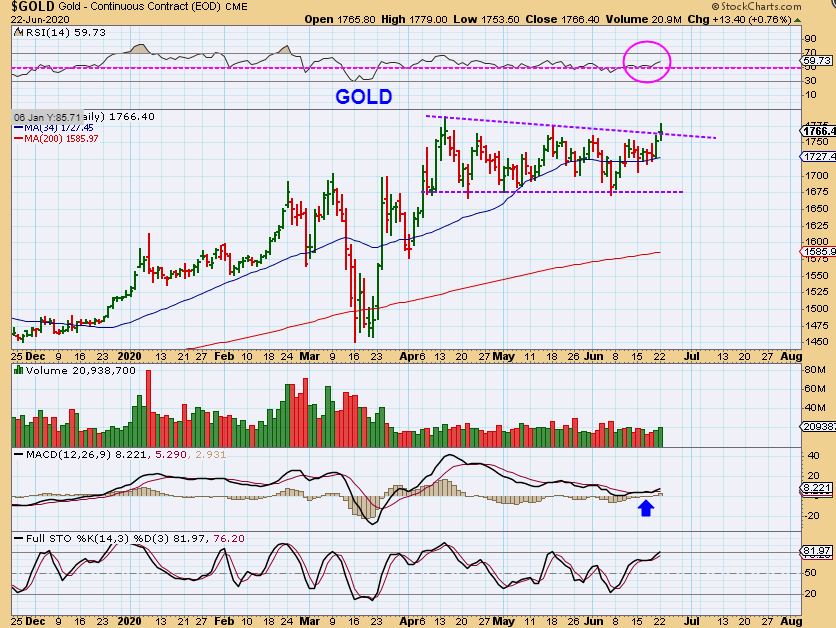
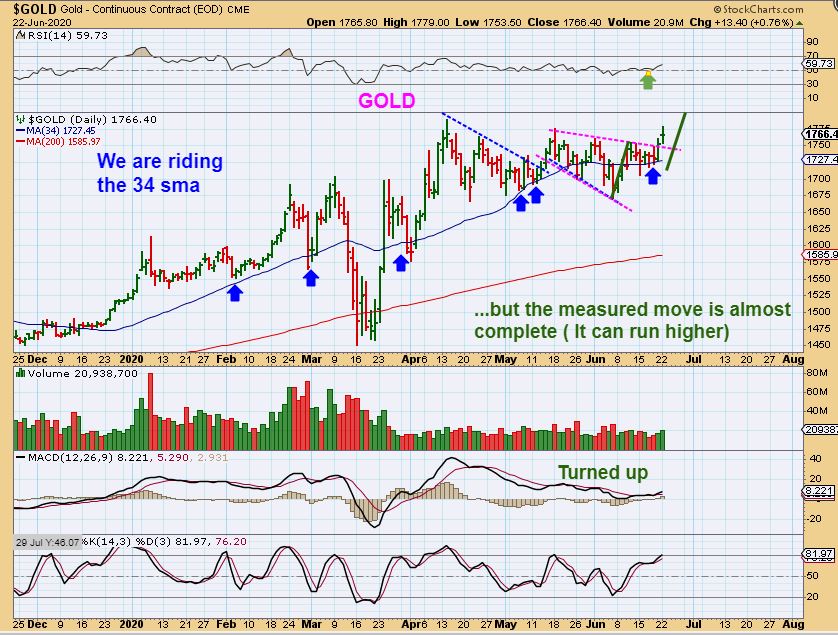
GOLD 1 of 3 : GOLD did not break to new highs, but from tip to tip along the top of our consolidation, it has broken through that trend line. The MACD & RSI are bullish and we have been expecting a run higher out of this consolidation. This is Bullish.
GOLD 2 of 3 – If I draw a short term ‘measured move’ from the June lows, the target has almost been reached at about 1800, but…
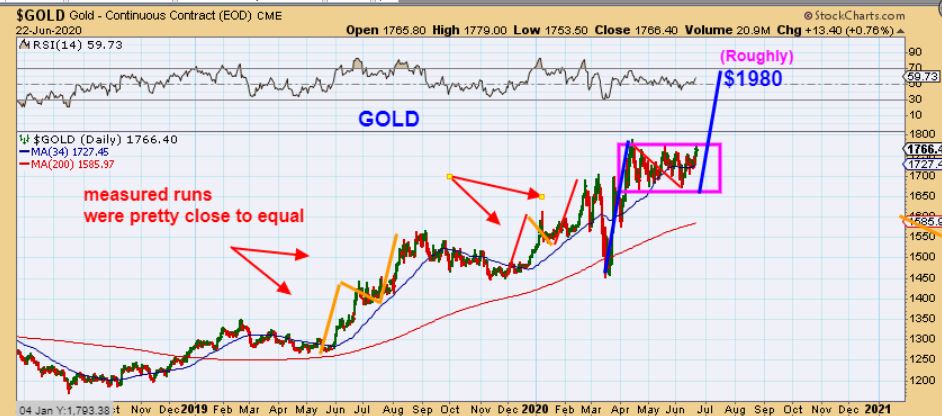
GOLD 3 of 3 – If Gold decided to do a strong run out of a multi-week consolidation, it can achieve a measured move that reaches near $2000. Look at prior runs on this chart and you’ll see how quickly Gold can do that.
LAST WEEK : SILVER JUNE 15 – Silver was announced as a low risk buy with this reversal on day 38. A stop would then be put under that low ( Buy Silver stocks or AGQ & USLV are leveraged etfs that could be bought too)
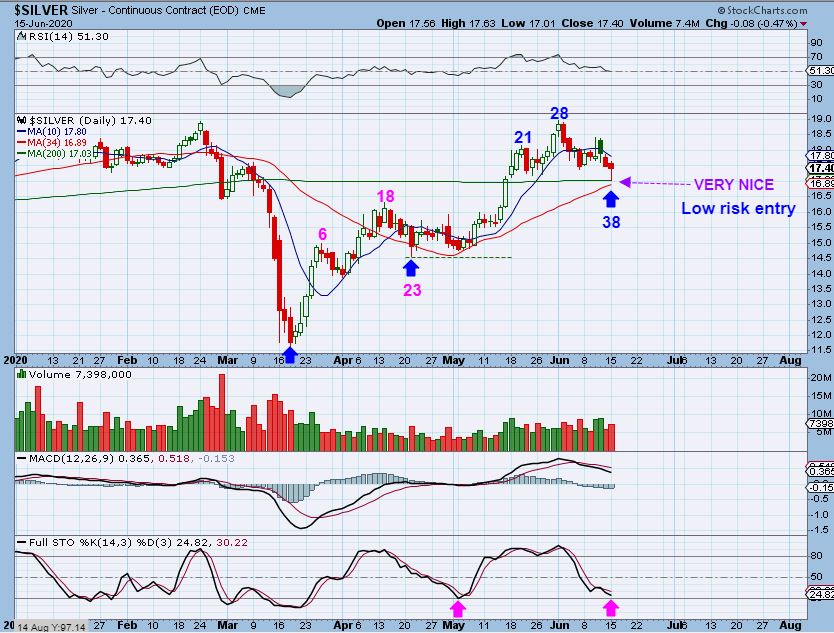
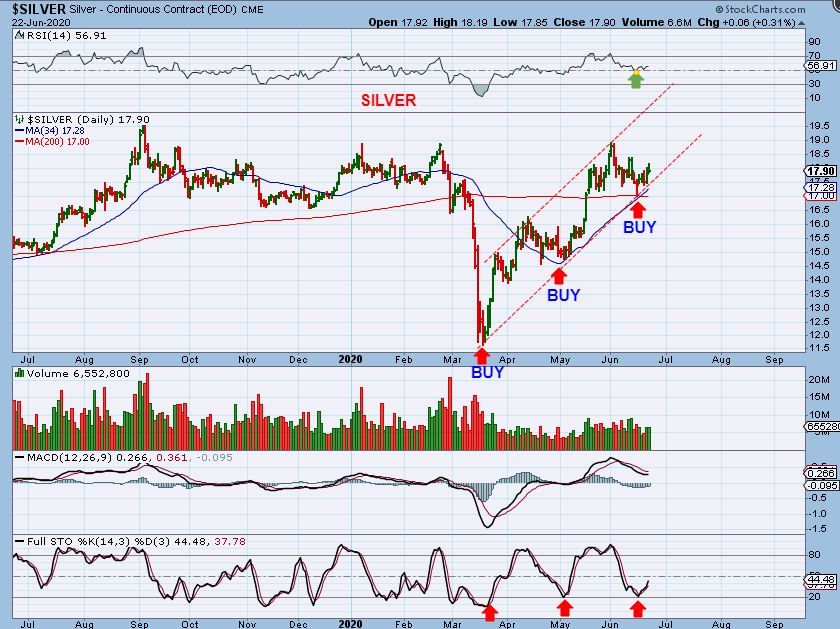
SILVER – And price has slowly been pushing higher and is still rather oversold, so Silver & Silver stocks can still be bought ( AGQ, USLV for leverage) with a stop.
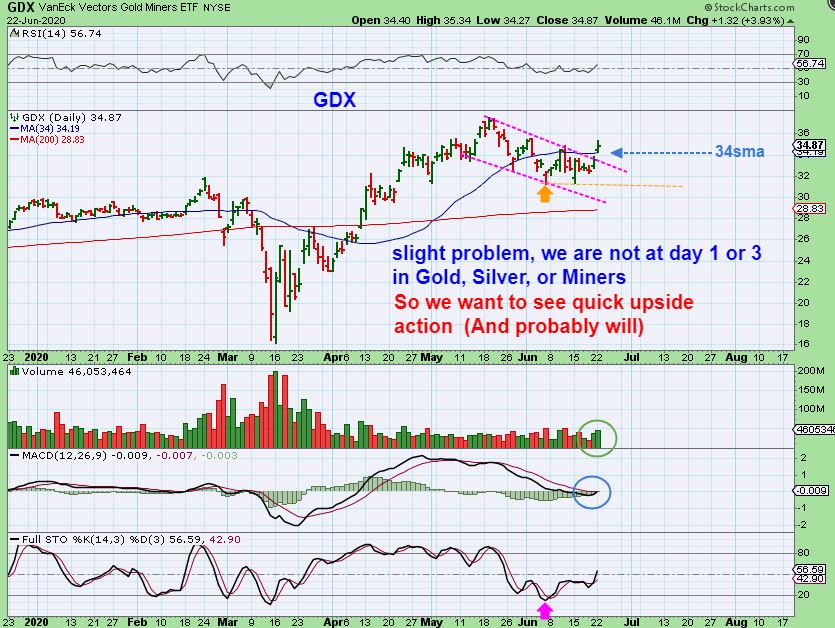
GDX #1- GDX broke higher and closed above the 34 sma. I prefer to really see price accelerate higher from here, since the lows were put in place a while ago. This is a bullish set up, and the MACD is set to cross higher . read the chart.
GDX #2 – I took a look at our strong bull run in the summer of 2019, GDX ran from ICL to PEAK in 4 months, as seen here. Then we had a grueling slanted choppy down into the next ICL. So…
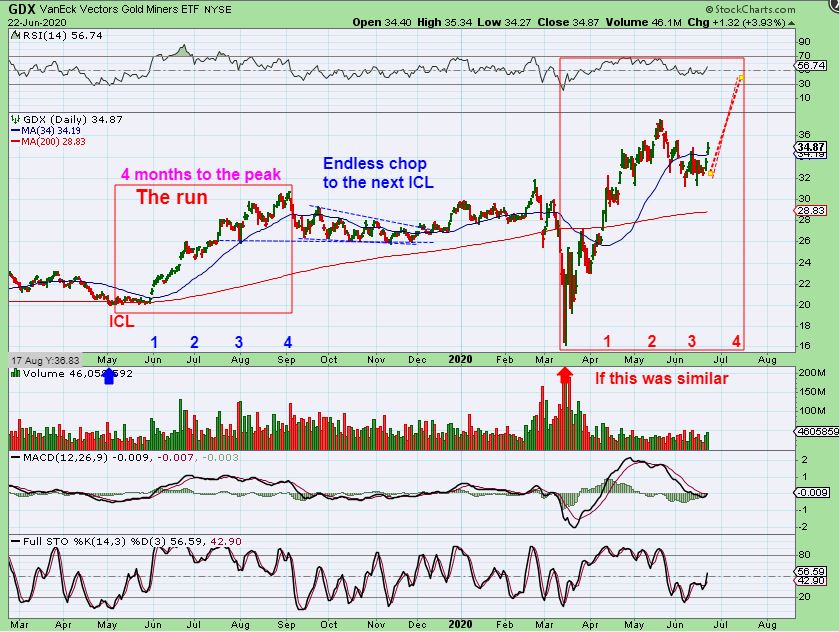
GDX #3 -If this ran 4 months too, we would see a peak soon ( Early to mid July) as shown here. That is why I said that I would prefer to see price accelerate sooner than later to give us a pretty solid run – like this.
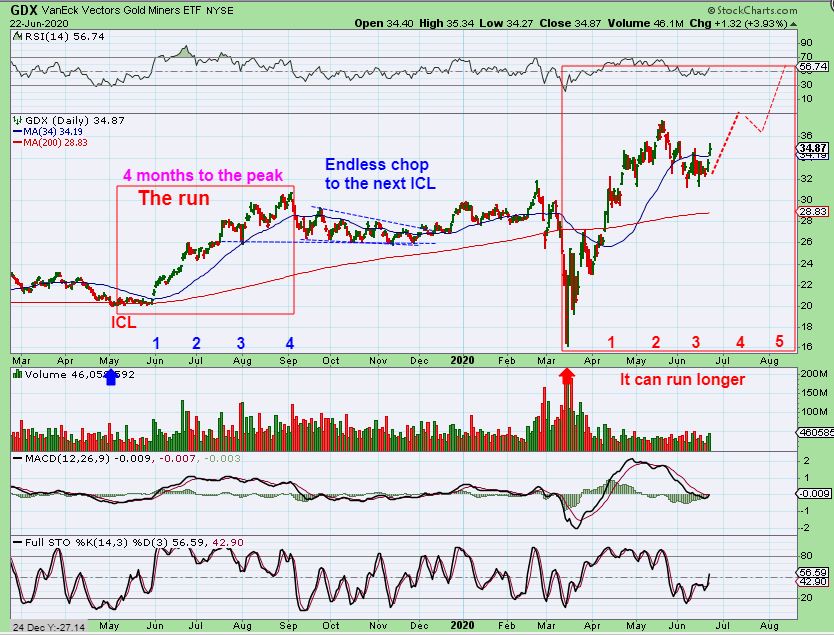
GDX #4 – It IS possible that with that longer consolidation, we could see an extended time period for this run too. As an example: I’ll just draw this as a run up, a cup & handle, and then another break out.
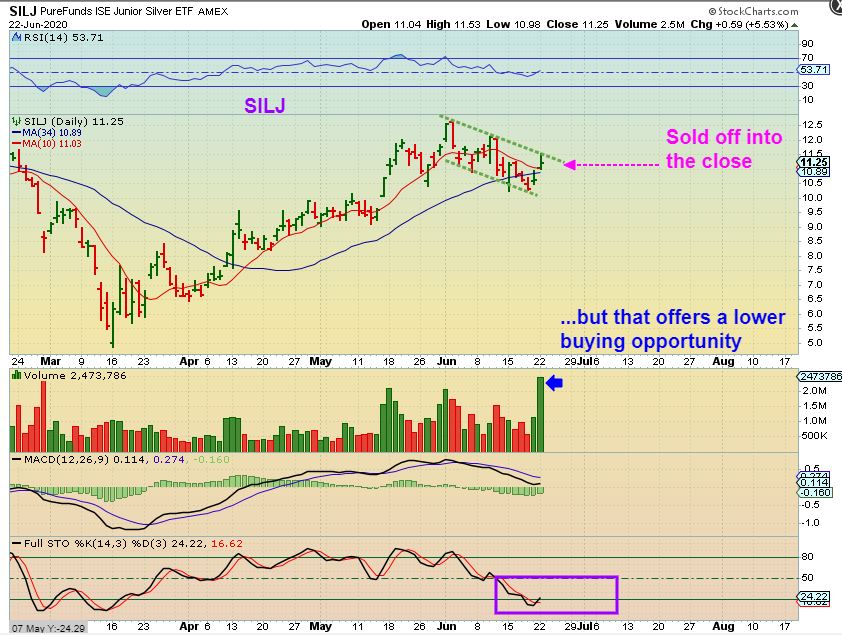
SILJ did not break out, but the volume was very good. Since Silver stocks( & SILJ) pulled back through the day, that means that if you still had some shopping to do in the Silver Stock area, price is still low and not overextended. SILJ remains oversold. I’ll discuss a few stocks at the end of the report.
.
So I have mentioned in recent past reports that you want to own your Miners. So far things are still playing out as expected, I’m just hoping that we really get some acceleration in the Precious Metals and leave this choppy Buying & Selling phase behind. There is good reason to believe that we will see a nice move higher, I’ll discuss that below with our DRD chart.
.
Enjoy your Tuesday trading!
.
~ALEX
.
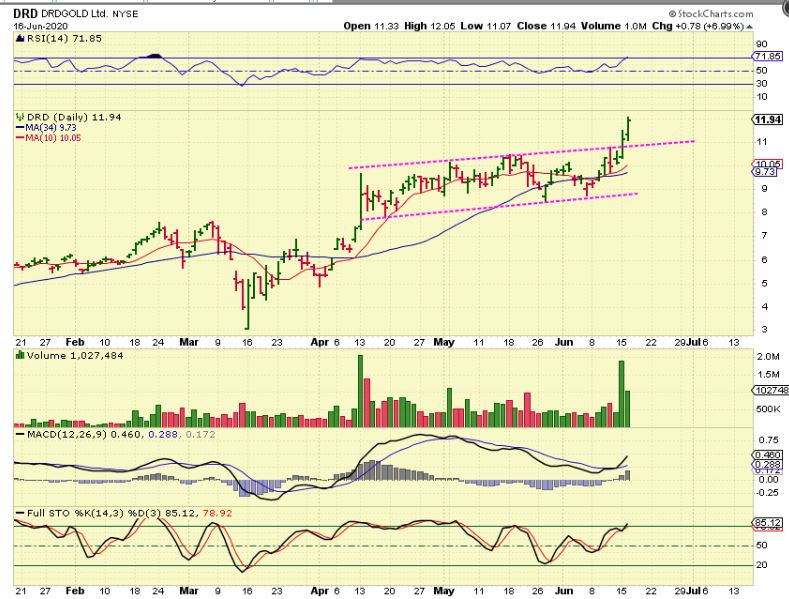
On June 16th I posted a chart of DRD showing that it was leading the way. Notice that DRD broke from a multi-week consolidation earlier than other most Miners…
,
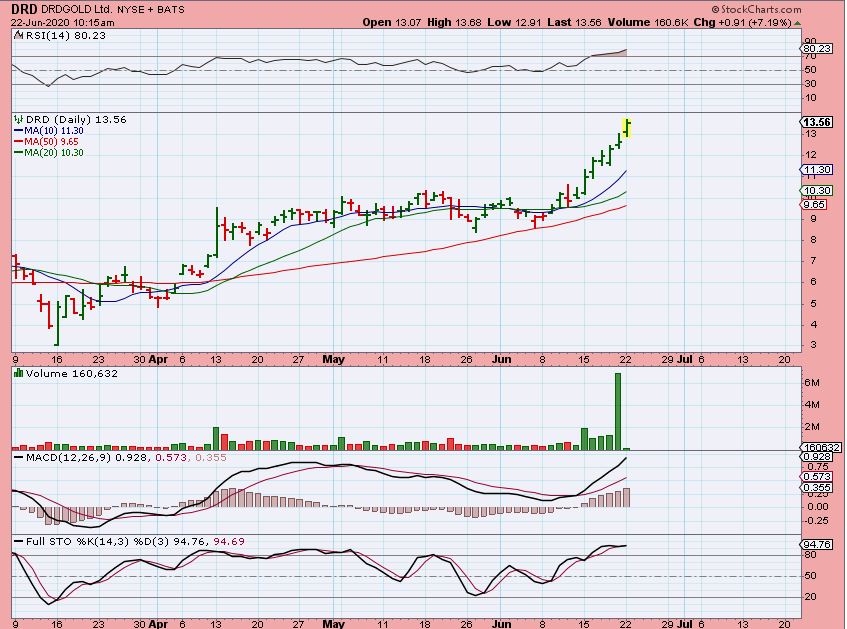
And here is the point: Now look at the run that DRD is putting in after breaking from that long consolidation. 7 green days in a row and that run is vertical. This is what gives us the confidence that a nice vertical run could unfold in other Miners. Other Miners in the consolidation or just breaking free could also run for several days.
.
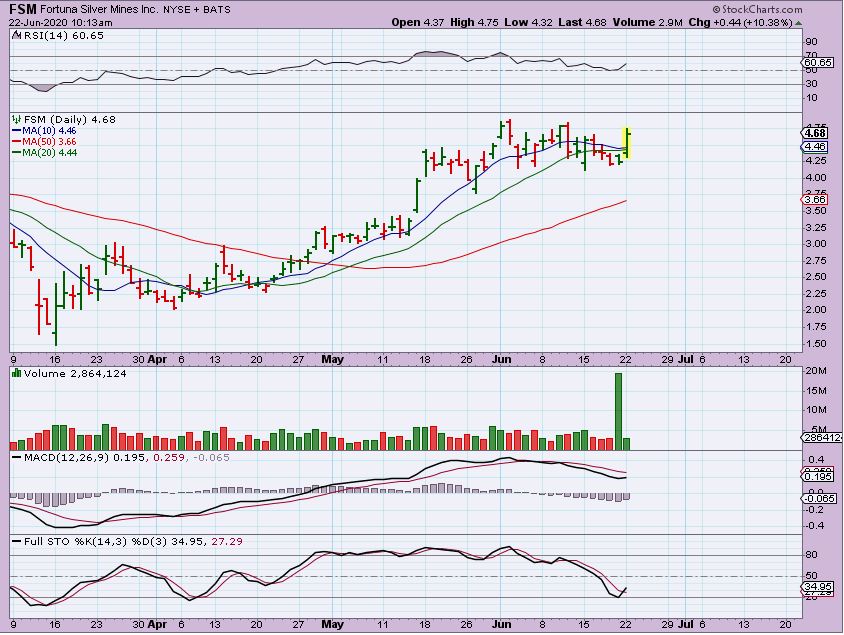
FSM looks like it wants to break out like DRD did, and the good news? It closed a bit lower than this chart by the close, so you could have bought it lower and may be able to enter lower than this Tuesday too.
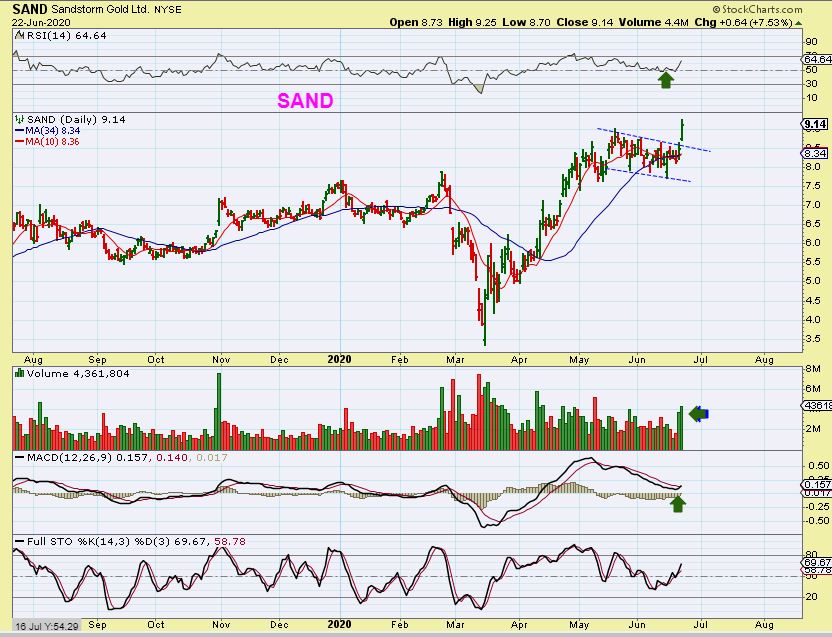
SAND did break out to new highs, so we’ll see if this does what DRD did. It looks very good with strong volume. That first run was strong from $3.50 to $9! This can run into the teens.
,
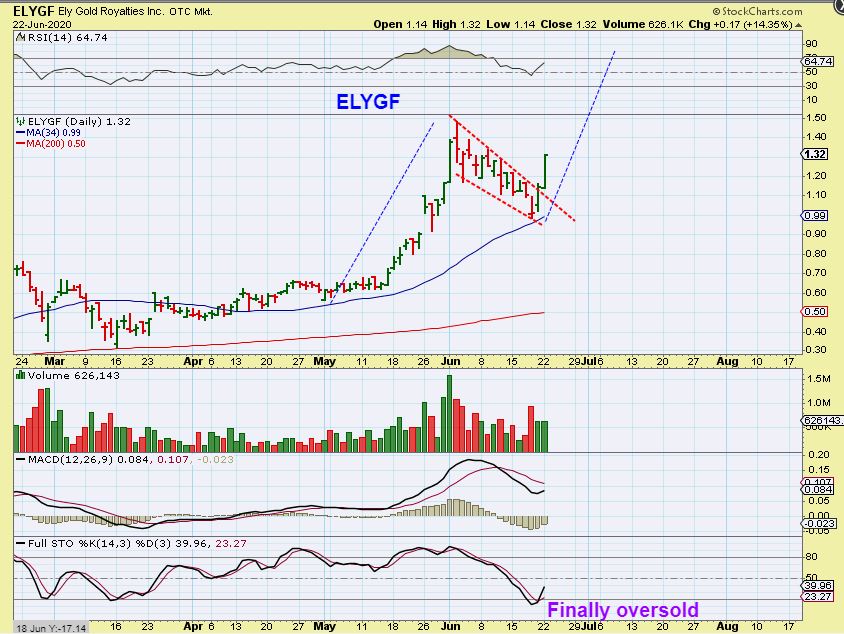
ELYGF broke a downtrend line Friday and remains oversold, so this has room to run too. I bought ELYGF after Fridays pop and I added to ELYGF right at near $1.30. I had to add at a higher price here, but if it runs to $2.00 over the next 2 weeks, I’ll be just fine with buying near $1.30.
,
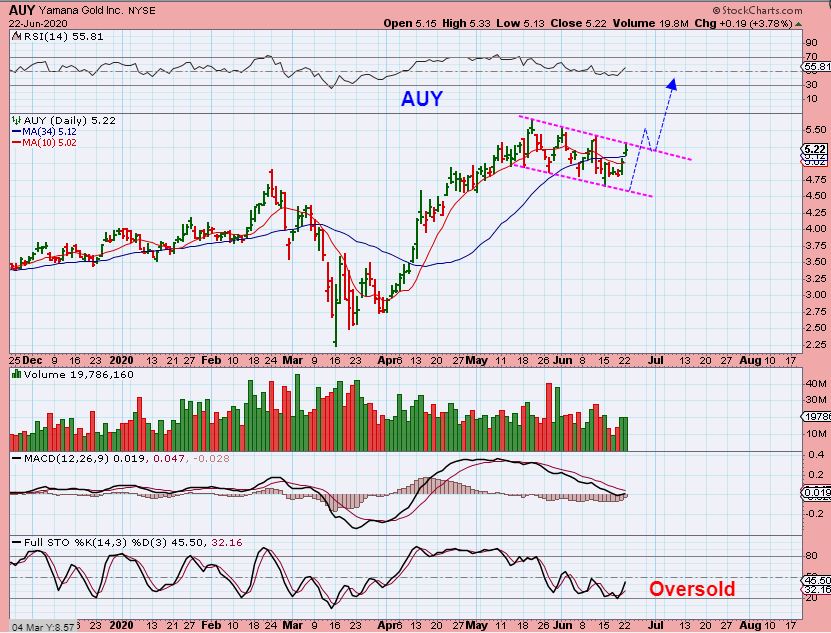
AUY backed off into the close too, but this is a bullish set up and I would expect it to break out & run too.
,
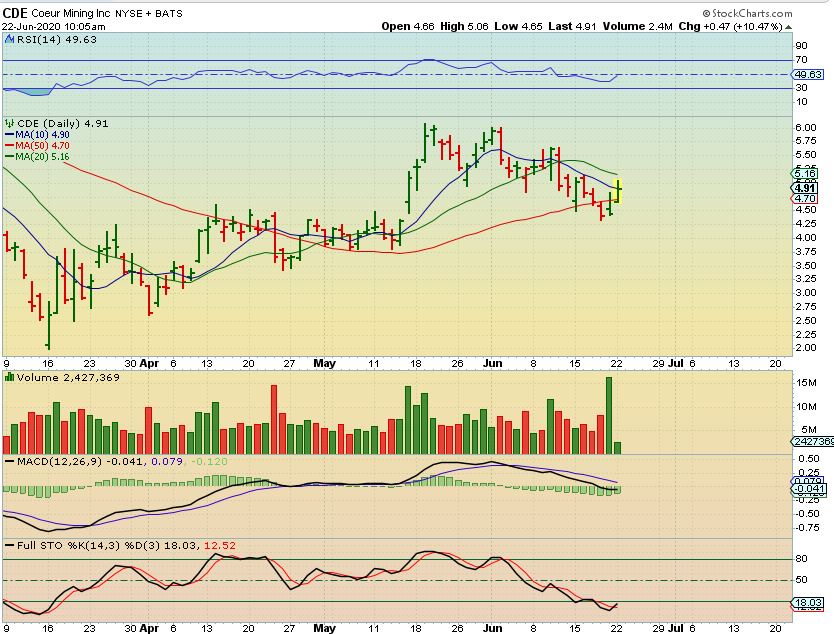
CDE had good volume in the first 30 minutes of trade, so I posted this and added to my position as it broke back above the 50 sma. It is oversold too, so it has time to run and tack on some nice gains quickly.
.
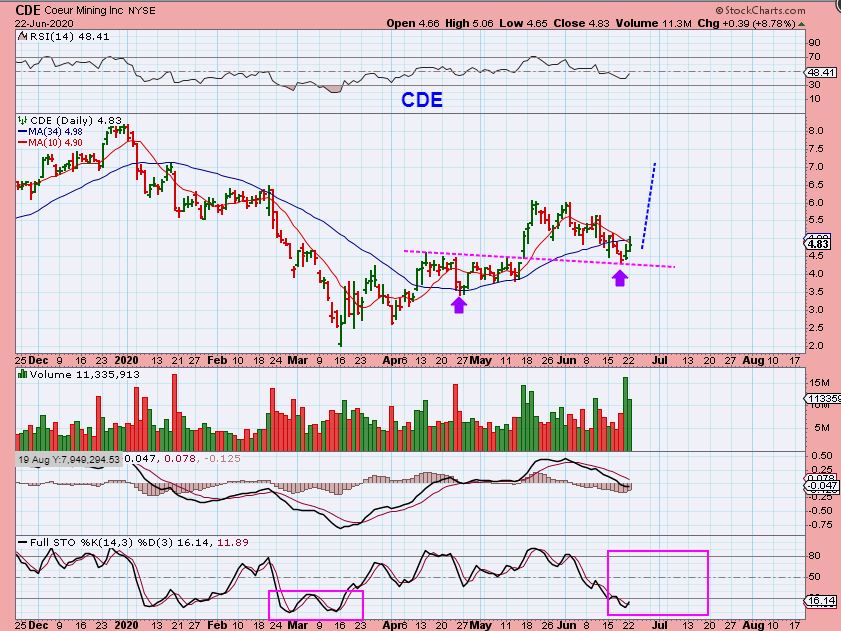
CDE also pulled back into the end of the day and closed a bit, but here I am pointing out a break out in May and a back test. Now this may be ready to break out from this consolidation too. That is great volume and a run to prior highs would be a run from $4.50 to $8. CDE is a low risk buy with a stop under the recent lows.
,
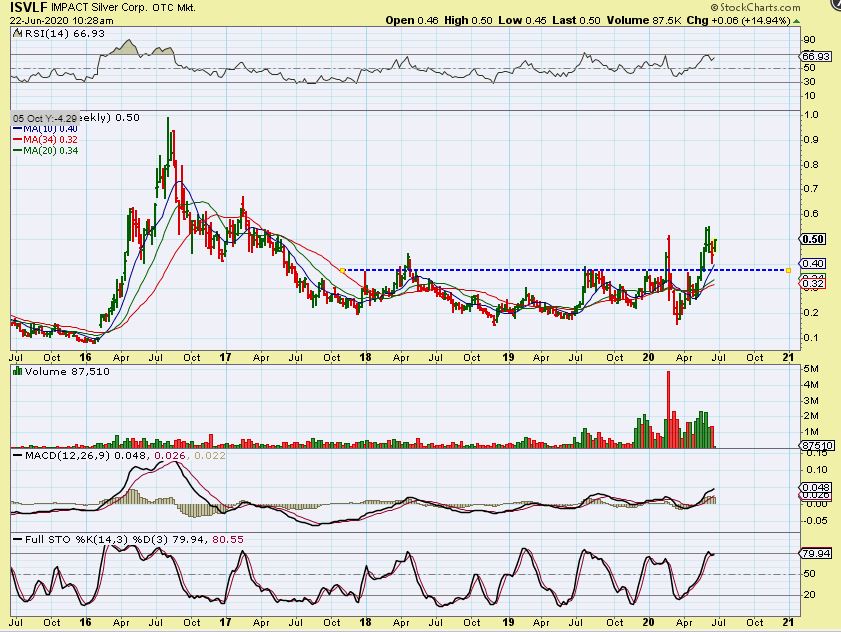
BY REQUEST ( Thanks Richard) : ISVLF– I took a look at the weekly for ISVLF and it looks rather nice. It broke from a long base and back tested on the recent dip. A run to prior 2016 highs over time is a 100% move from here.
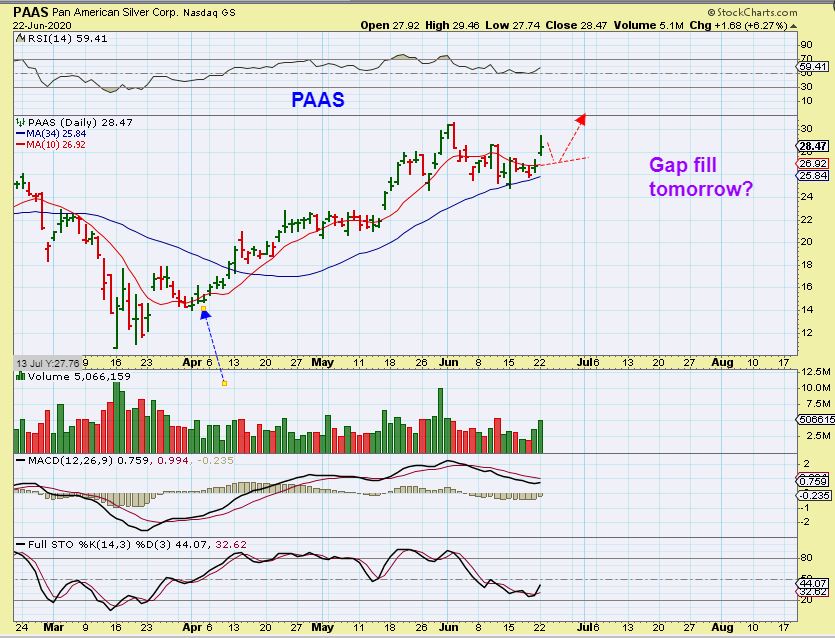
PAAS gapped up and looked great, but then it too sold off into the end of the day. It is still healthy & still bullish, but what if it drops lower tomorrow too? It may just do a gap fill, 10sma test & then run higher. This was and is a buy at this 34 sma line area. These are all oversold & should run higher.
.
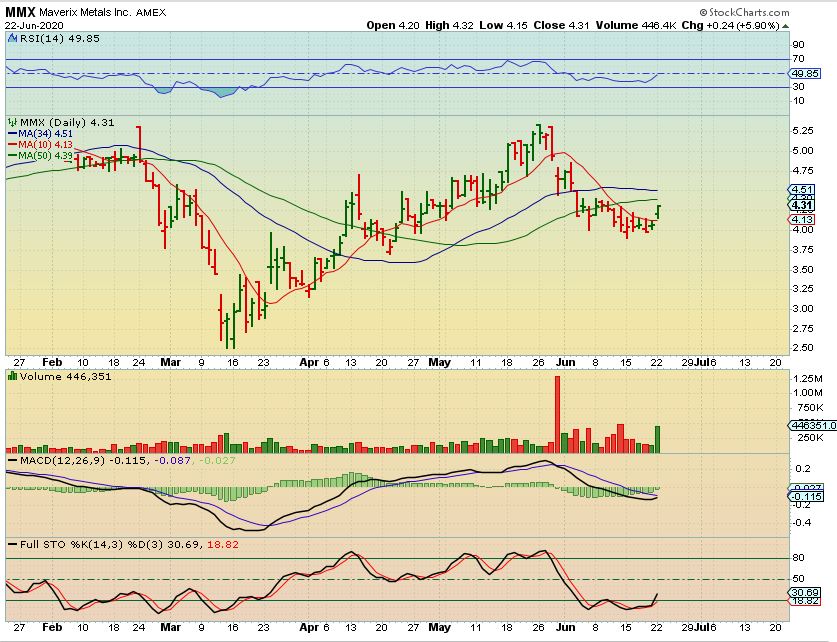
MMX – This was mentioned by JT ( Thx) – This is a nice chart. It is a buy. It trades on light volume on occasion, but the Volume yesterday was solid.
.
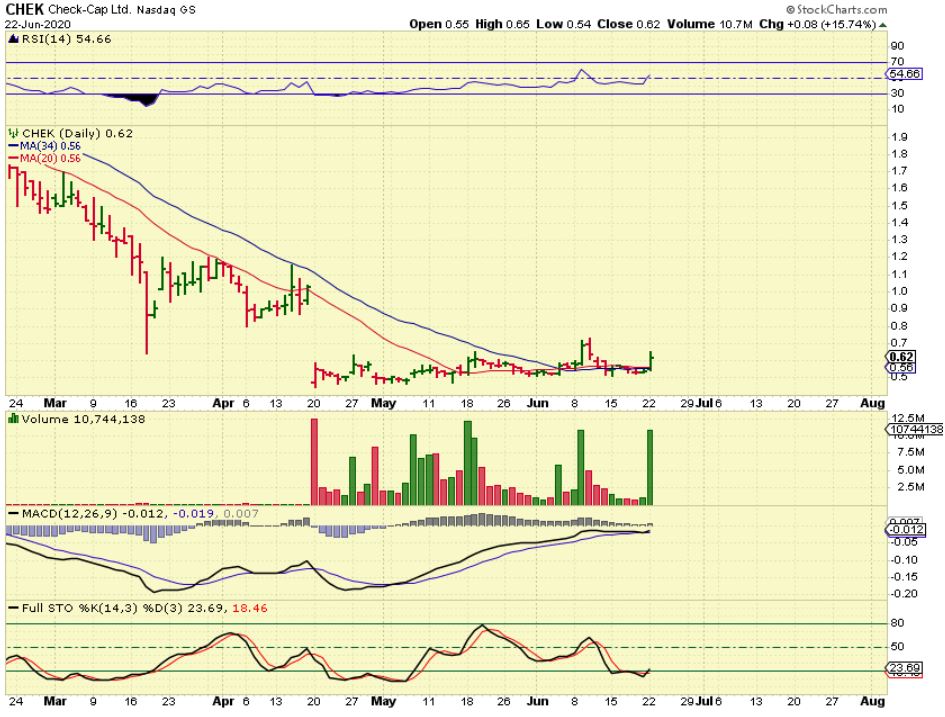
I had CHEK in a report recently as a base with high volume pops ( & good potential). It had 2 million in volume at the open, so I quickly grabbed this and posted it in the Live area at the open. It is a set up that looks ready to go higher and is also oversold…
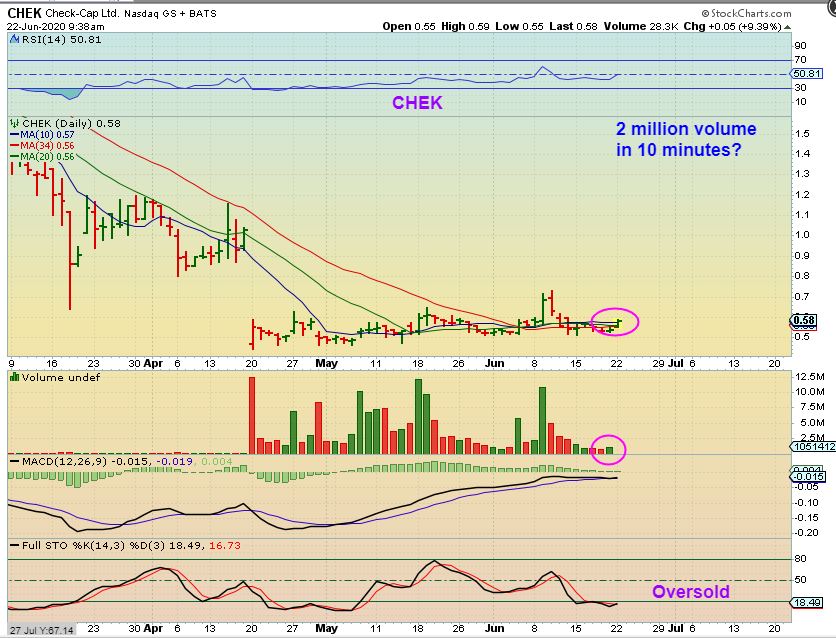
CHEK had over 10 million in volume by the close & was up about 20% at one point. I think this might be ready to go, we’ll see soon enough ( and I hope that it isn’t another false start).
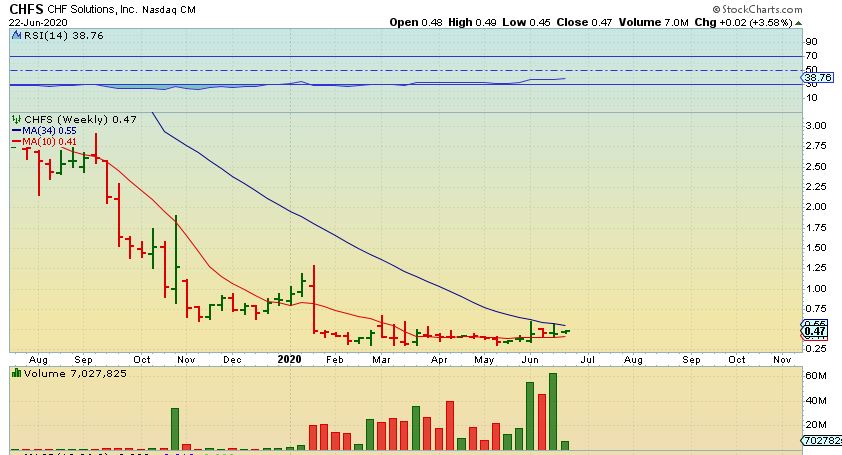
CHFS – Yes, I still own this squeeze play in CHFS and if this breaks this week, it could Pop higher as a big %-Gainer. For now it is pressed under 50 cents.
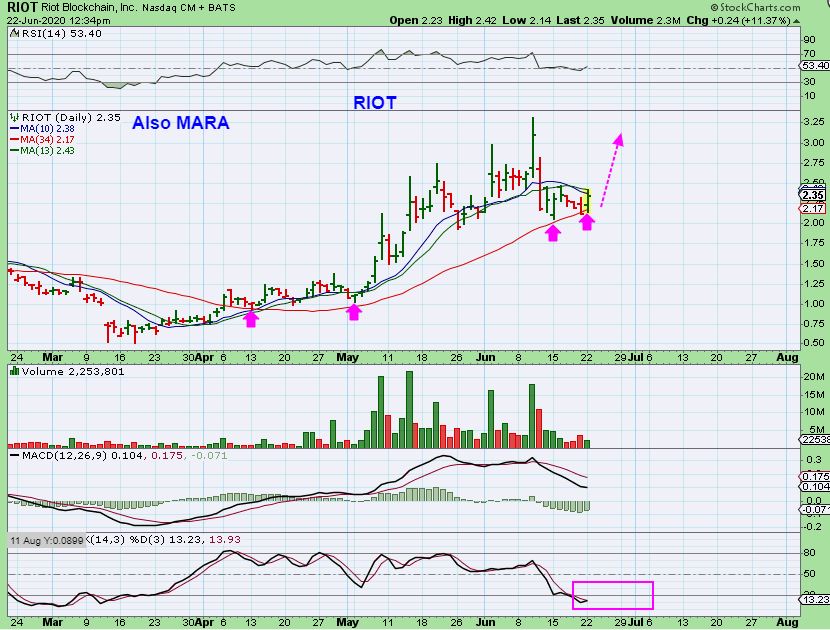
RIOT & MARA both reversed off of their 34 sma and this is was a buy, especially the way these can move. They did extend higher after I posted this , so if they pull back Tuesday it may offer a better entry.
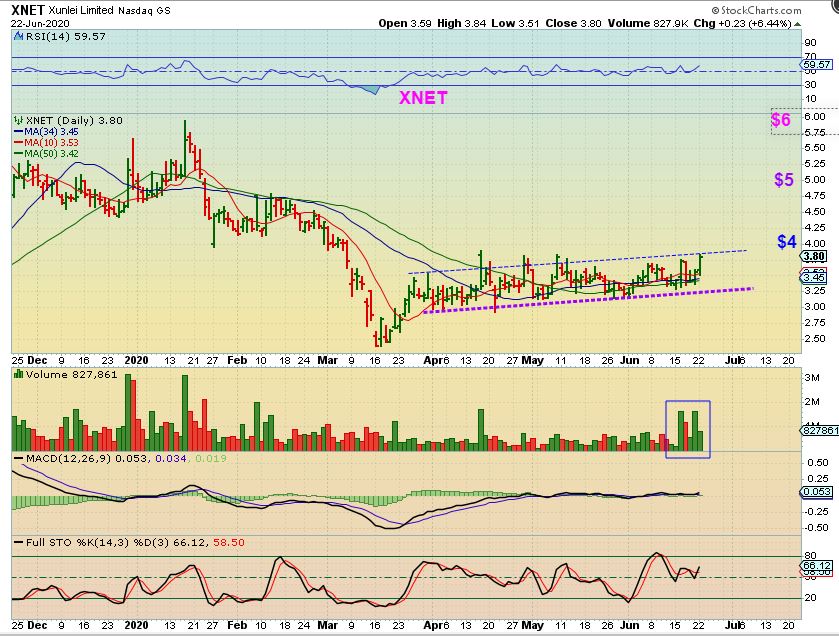
XNET is in the same (Blockchain) category. It also is a low risk entry with a stop under recent lows. It looks ready to break out & run. You could wait for the break out if you want, since it also could just continue riding sideways.