Tuesday June 16th
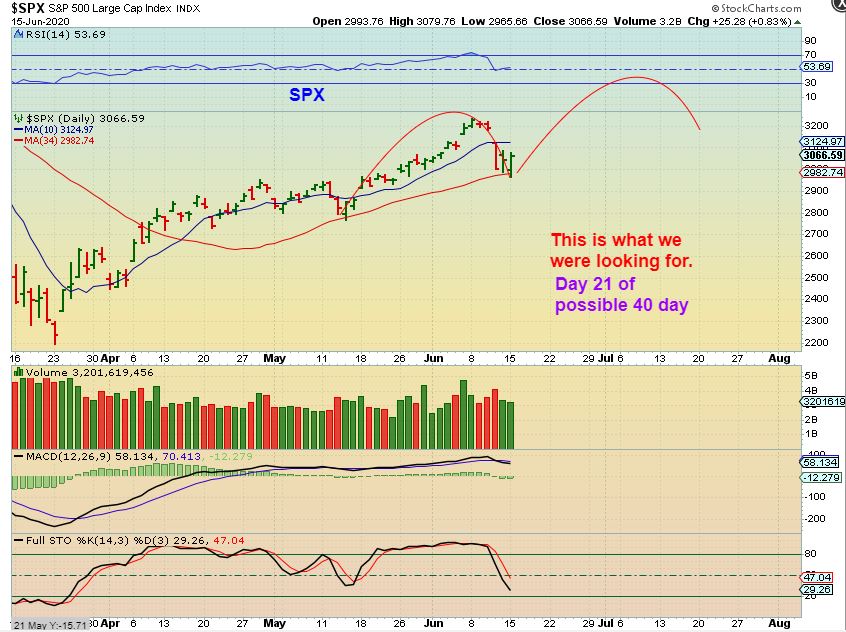
IN THE WEEKEND REPORT : SPX CYCLE COUNT – The first daily cycle out of the ICL (Intermediate Cycle) was strong. The 2nd should be fairly strong too, and then the 3rd could weaken and the 4th could sell off sharply. Well, the first daily cycle was 37 days long ( they are roughly 40 days long), and the dcl dipped to the 34 sma. Now on day 20 ( 1/2 of a 40 day cycle) we dipped to that 34 sma again with a reversal, so Friday was a possible the clue. A reversal at the 34 sma. COULD BE A 1/2 Cycle LOW…
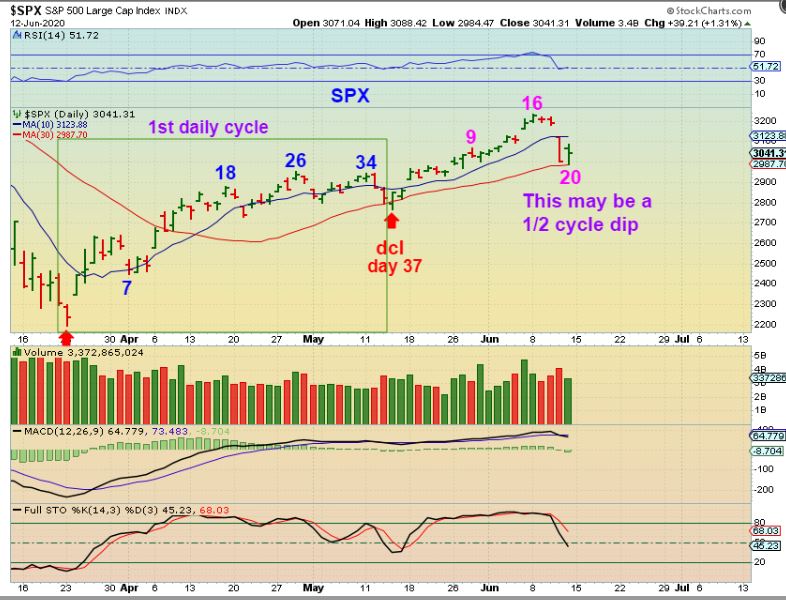
SPX – Reversal after a gap down. It seems that selling has dried up, they couldn’t push it down. We now get a bounce / rally, but how long will that last coming out of day 20? 5 days? 10 days? We do not know, so we use a trailing stop ( If you buy UPRO, TQQQ, SOXL, etc with a trailing stop).
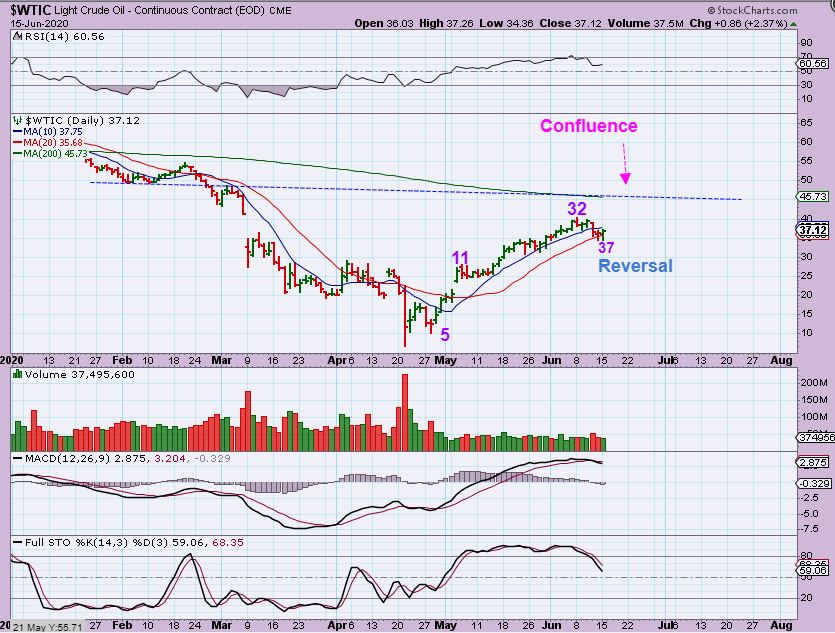
WTIC reversed at day 37, so this may run to Resistance and then drop to a dcl.
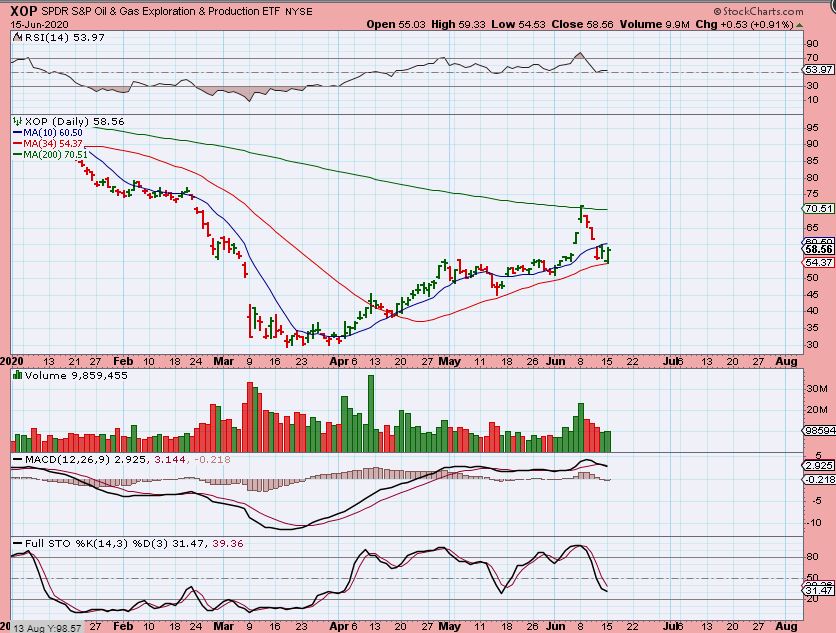
IN THE WEEKEND REPORT: The XLE & XOP bounced off of the 34 sma in May, and may be doing that now too. Oil stocks have followed the General Markets and NOT Oil at this point.
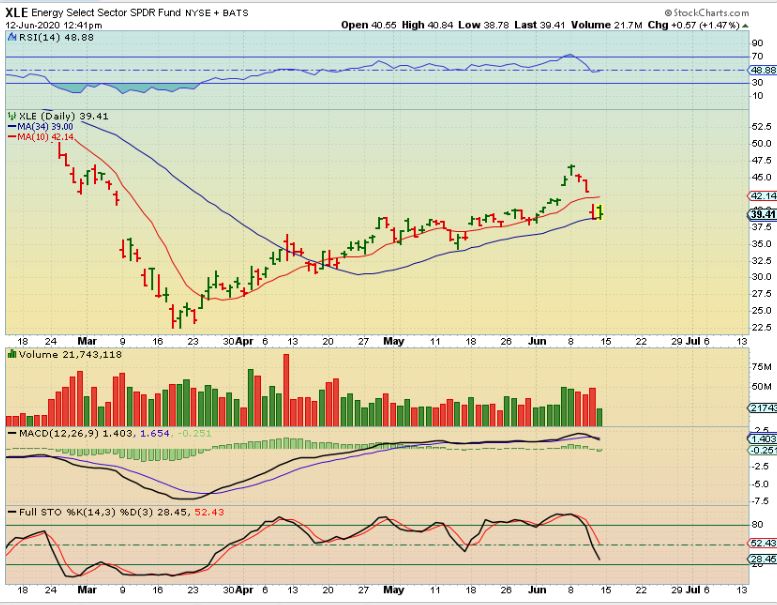
It is a low risk buy: XOP and OIL STOCKS reversed at support and can be bought with stops . I will cover a few later in the report.
.
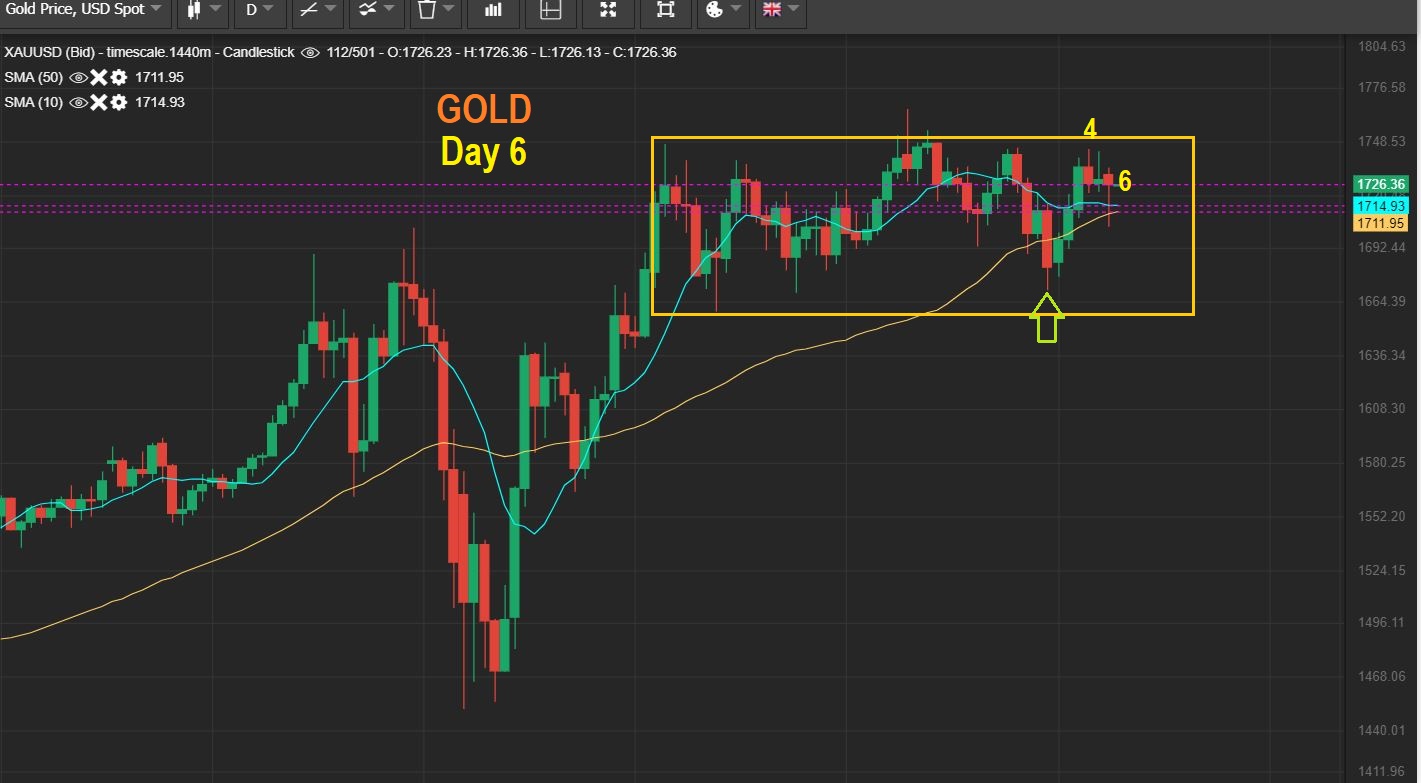
GOLD is in a Box Consolidation, but it still may have a dcl in place and if so we’d be on day 6. Gold stocks are bullishly set up.
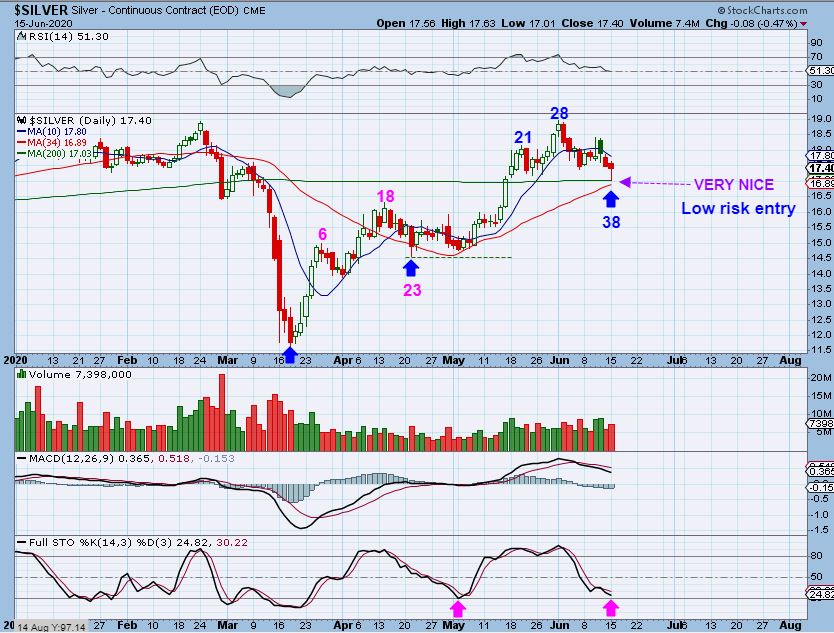
SILVER reversed perfectly at the 200sma. This would be a day 38 low, slightly long after a shorter 1st daily cycle. We are finally near oversold and Silver can be bought with a stop. I wouldn’t go too tight, I wouldn’t expect much of a drop if Silver did break these lows.
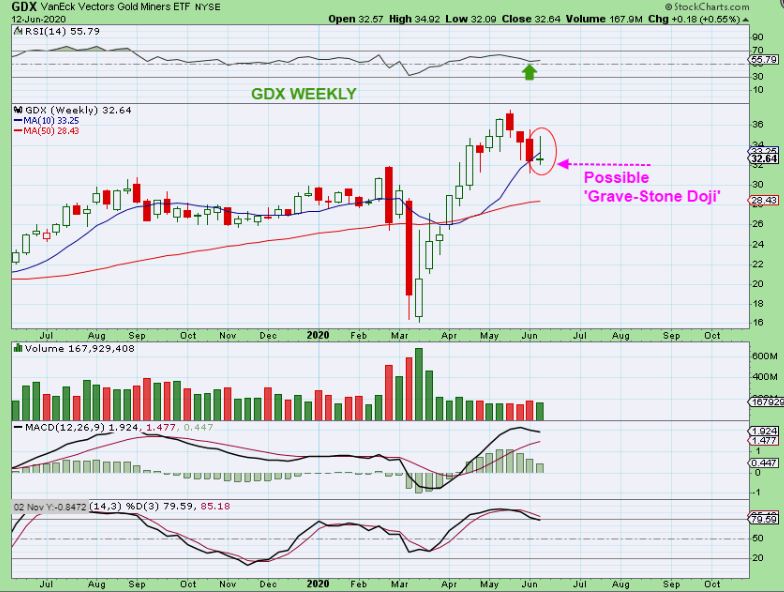
FROM THE WEEKEND: GDX WEEKLY – My weekly chart of the GDX shows a weekly gravestone Doji. Also Miners should be close to a dcl, and we know that from our weekly week day observations of cycle count. A daily cycle for Miners tends to be roughly around 33 days long…
.
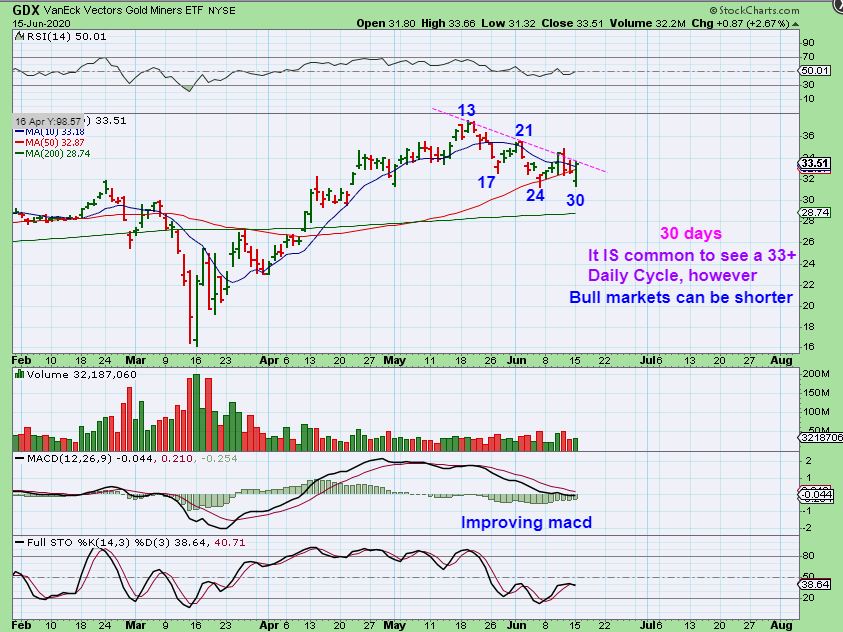
This would be day 30 for GDX – This could be the lows (dcl), because many Miners look to be reversing too. IF THIS ISN’T THE LOW, WE ARE CLOSE. The dips are being bought.
,
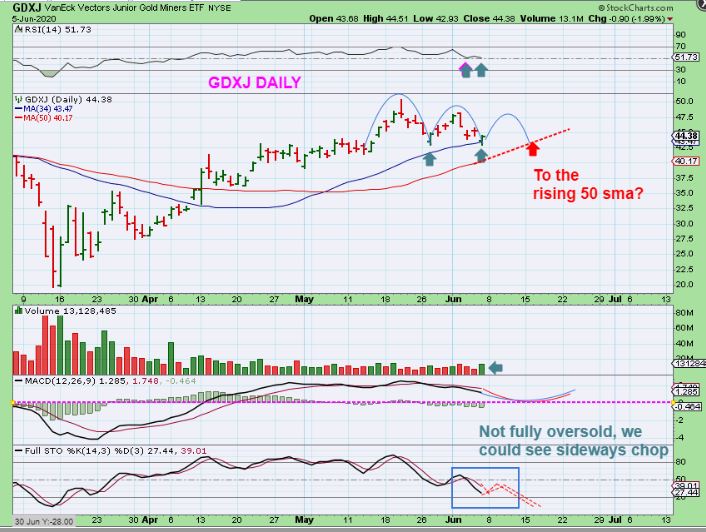
GDXJ : I have mentioned a few times that we could get a bounce & drop to the 50sma, because the cycle timing could use more time. I drew these charts on June 5th, showing tag of the 50 sma eventually …
,
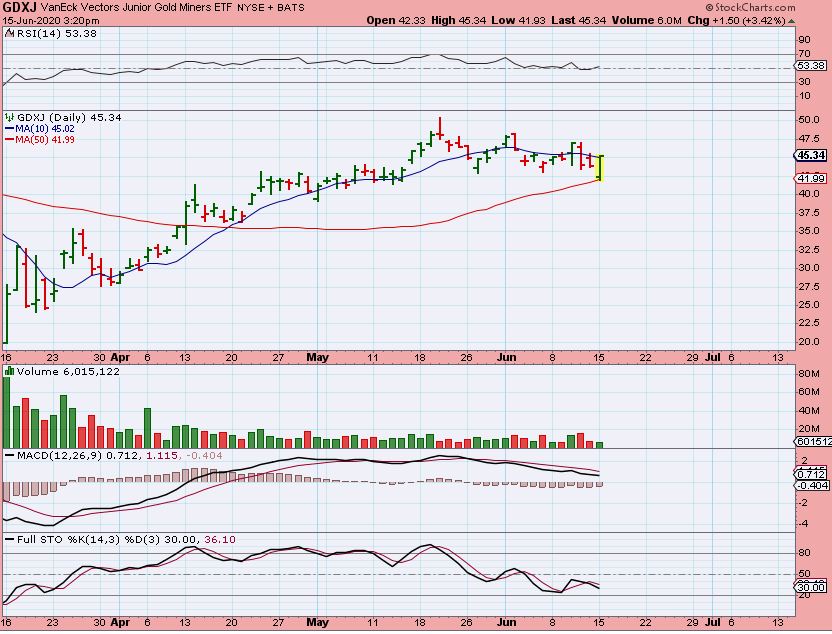
GDXJ did bounce from that low & on Monday it gapped down and reversed after tagging the 50sma. This is a buy, it has been reversing in this $45 area for 2 weeks actually.
.
Let’s take a look at a few Miners and see what we have there…
.
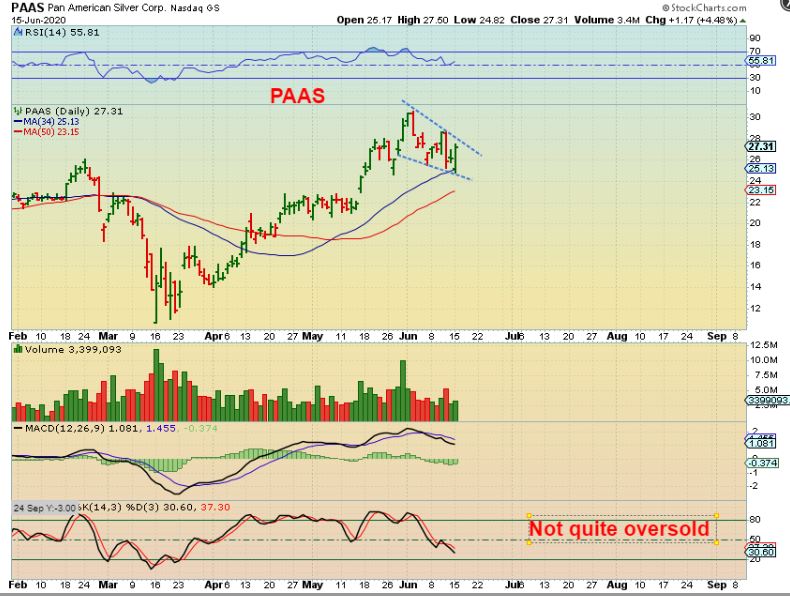
PAAS #1 – PAAS reversing at the 34 sma is bullish, though this does look like it could chop a bit more. PAAS also shows that with the gap down, buyers stepped in. Could it drop a bit more? Yes, but it may or may not…
,
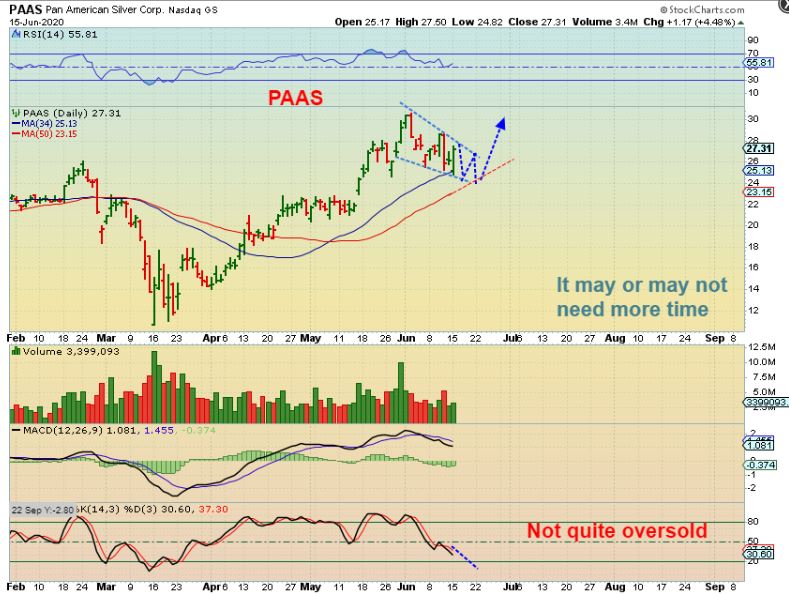
PAAS #2 – The stochastics is not fully oversold and the Pennant could fill to the 50sma, but a break higher above the pennant is a buy (or buy here, downside should be minimal).
,
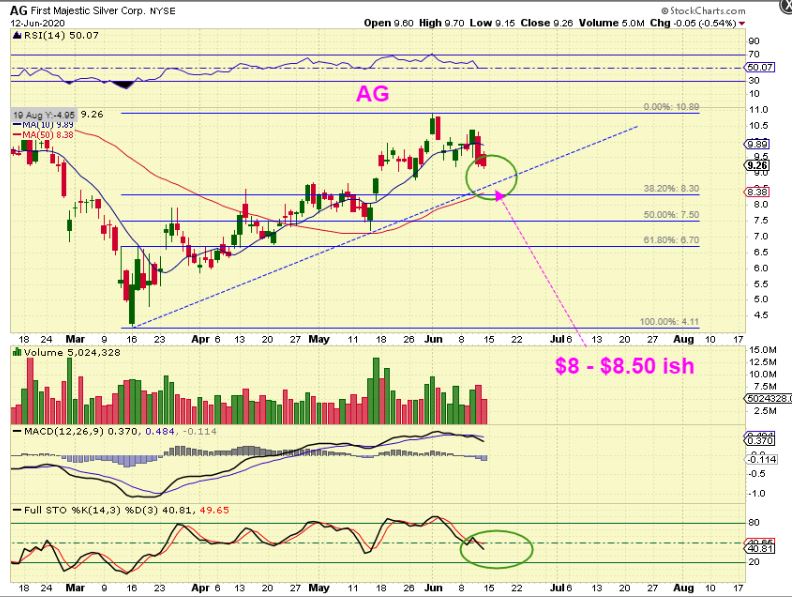
I was asked about AG premarket, so I drew this. I said to look for AG to drop to the blue trend line & 50sma.
,
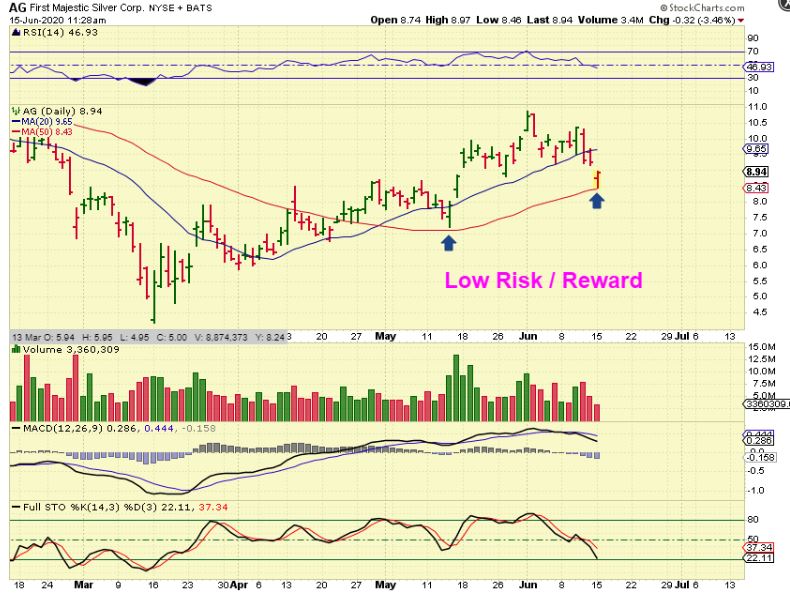
AG dropped there in the morning & Turned higher. That is a buy as a low risk / higher reward entry.
,
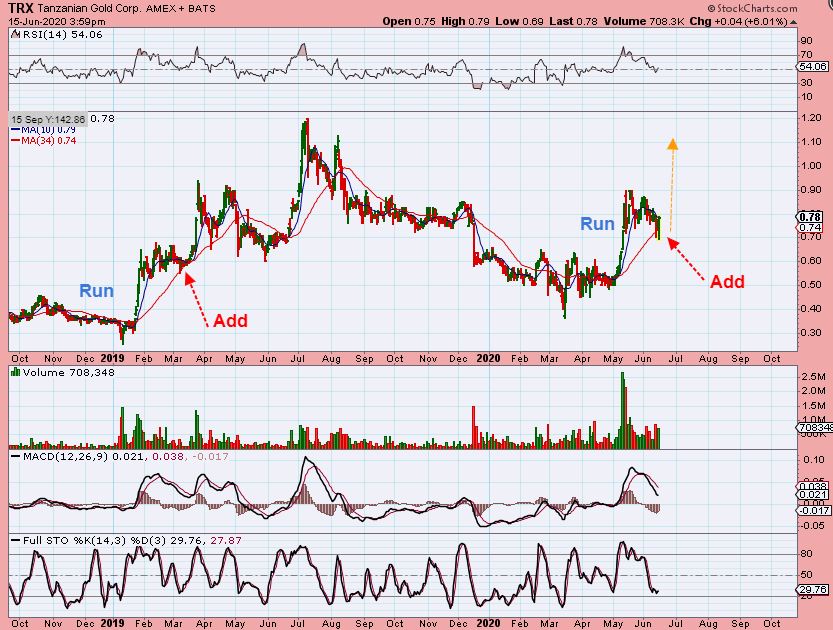
TRX looks ready to make another move higher. It dropped to the 34 sma and reversed too. I did buy this one Monday, because a pop to prior highs is a nice % Gain.
,
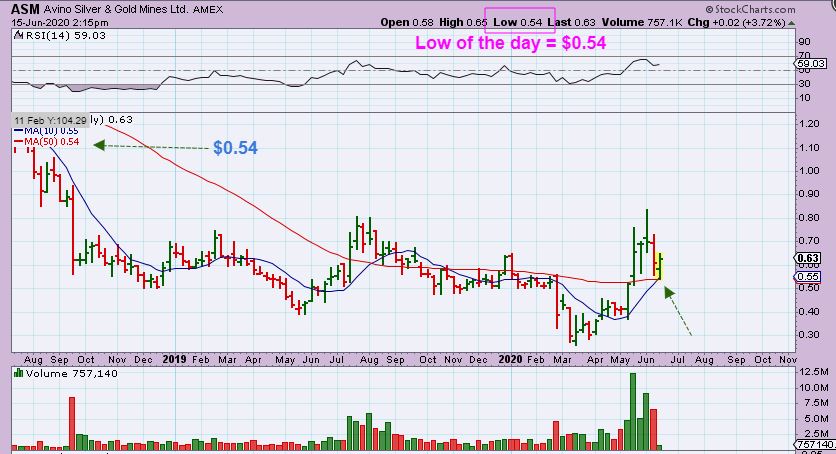
ASM WEEKLY had price reverse right off of the weekly 50 ma. So ASM seems to be bouncing off of support.
.
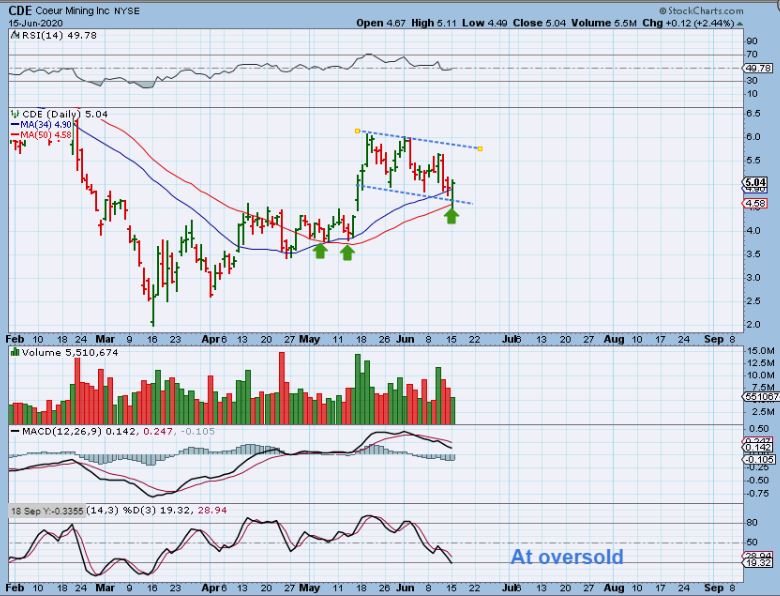
CDE – I already own CDE from the lows and I watched it drop to the 50 sma and reverse yesterday. Buyers stepped in and it closed green, up 12 cents. You can see that MANY MINERS are acting bullishly, even on a gap down sell off.
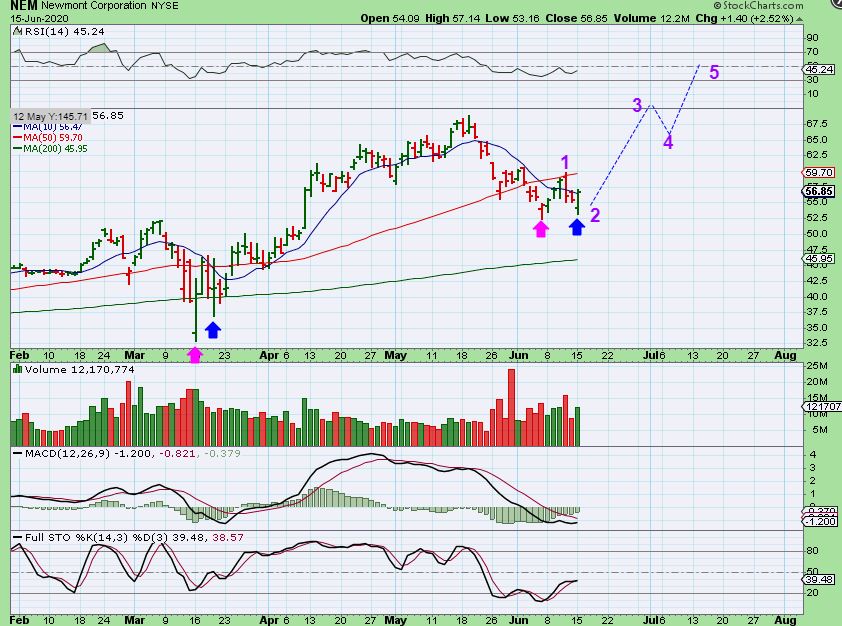
NEM came close to breaking recent lows ( blue arrow), but did you notice that it did that in March too. It eventually took off and made a nice run higher.
.
If you re-read the weekend report ( I did before I wrote this one), it said that we would look for these reversals as clues on Monday. Clues to help us to see if that drop to the 34 sma in the General Markets was a just a quick 1/2 cycle low and not the start of a crash like many others have been calling for. Are Oil stocks (we used the XOP & XLE in the weekend report) ready to give us another run too? They do look that way after Friday and Mondays trading. And what about the Miners? The weekend report pointed out Gravestone Dojis- did you remember that? They show up often near or at the lows of a sell down. Monday saw Miners gap down and put in reversals too.
.
Conclusion: We saw a gap down and a lot of RED on Monday morning, but by midday and into the close we saw reversals and Green across the board. The Miners are on day 30, so they COULD chop a bit further, but in my experience, I’ve found that Bull market cycles in Miners can run shorter than in a bear market. Buyers step in sooner. At this point, the downside seems very minimal to none, so I added to a few Miners positions. Please understand that I am a regular trader of the Markets, and if trading is good or hot in other sectors, I may be busy there too. Some may wonder why I didn’t LOAD UP on Miners? I’ve mentioned that I am trading in other sectors now, where I have found Big short term gains lately. Even though I am trading many other areas, I do think that the Miners are ready to make the run higher for the 3rd daily cycle Now or very soon. It is a low risk entry if you can take some chop.
.
Enjoy your Tuesday trading, things do look good in many areas. I will discuss some additional trade set ups below.
.
~ALEX
.
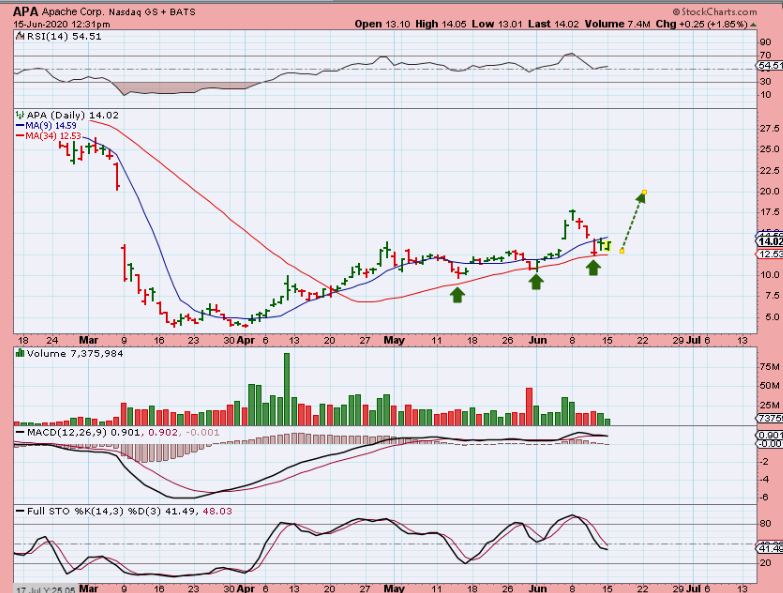
FROM THE WEEKEND REPORT I WROTE : APA – Apache Energy actually dropped to the 20 sma and put in a gravestone doji. It then popped 7 % on a reversal Friday. Is this ready to go higher? IT can at least be bought with a tight stop, but that is not all…
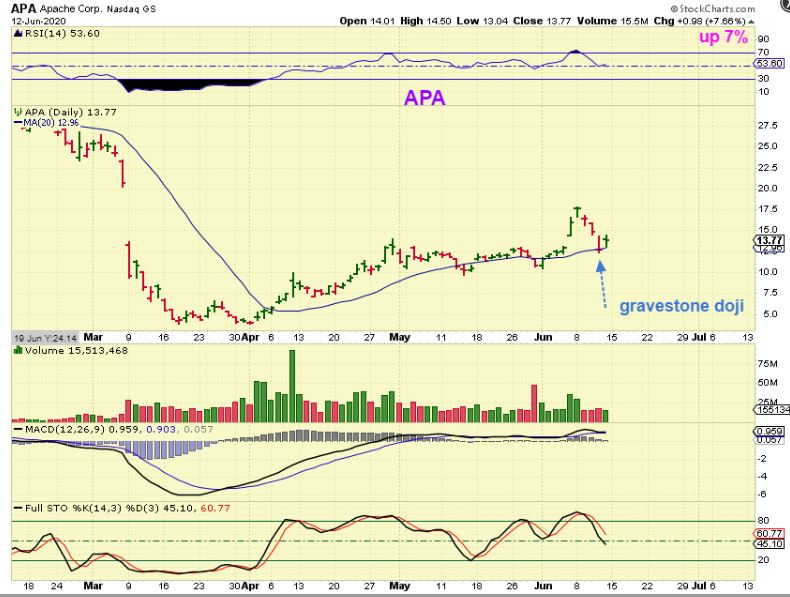
APA is still sitting down there, and that still makes it a low risk entry (with a stop).
.
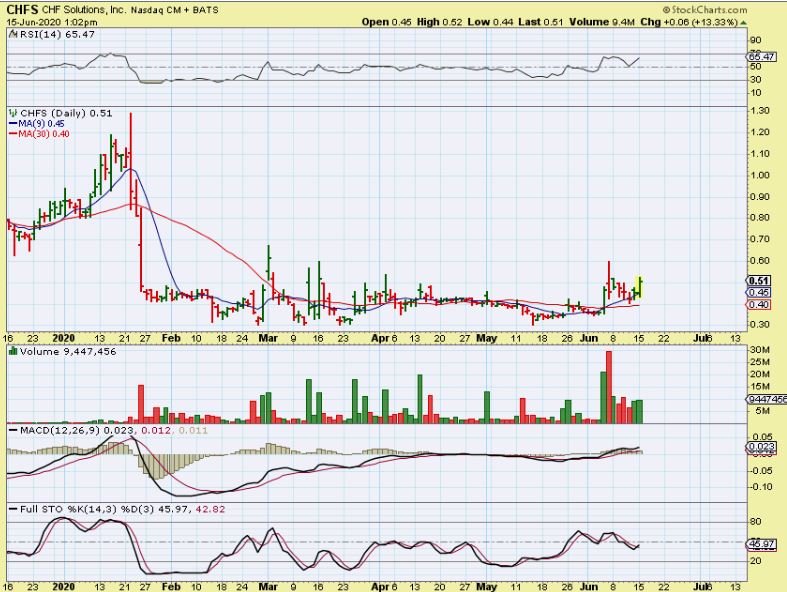
I saw this while doing research Sunday night: HEADLINES FOR CHF Solutions (Nasdaq: CHFS), a medical device company dedicated to changing the lives of patients suffering from fluid overload, today announced that it has sold Aquadex SmartFlow(TM) consoles and disposables to a critical care hospital for use in the treatment of COVID-19 patients in Central Florida.
.
CHFS started to rise Monday so I bought this for maybe a quick trade ( 3 day?). This was the volume at 1/2 day as it pushes up from that base. That base has many volume pops and the MACD is rising. PLUS…
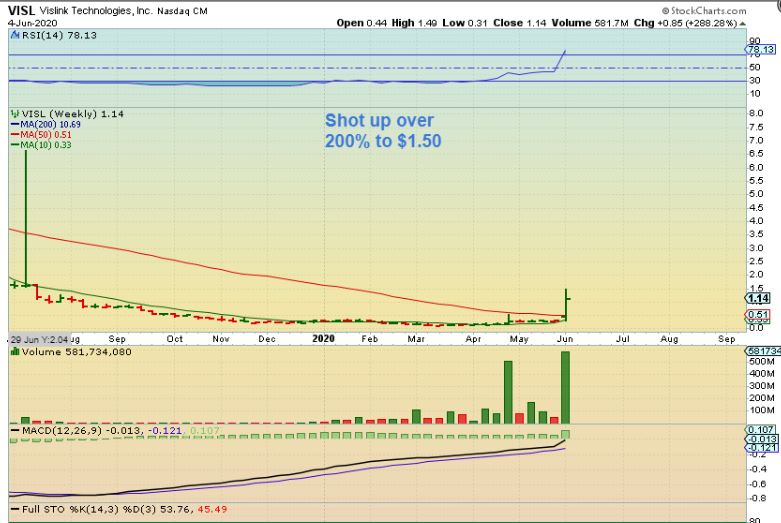
CHFS WEEKLY is pushing on a major moving average. Do you REMEMBER WHEN VISL DID THIS PINCH UNDER THE 50 WKLY MA? Next chart…
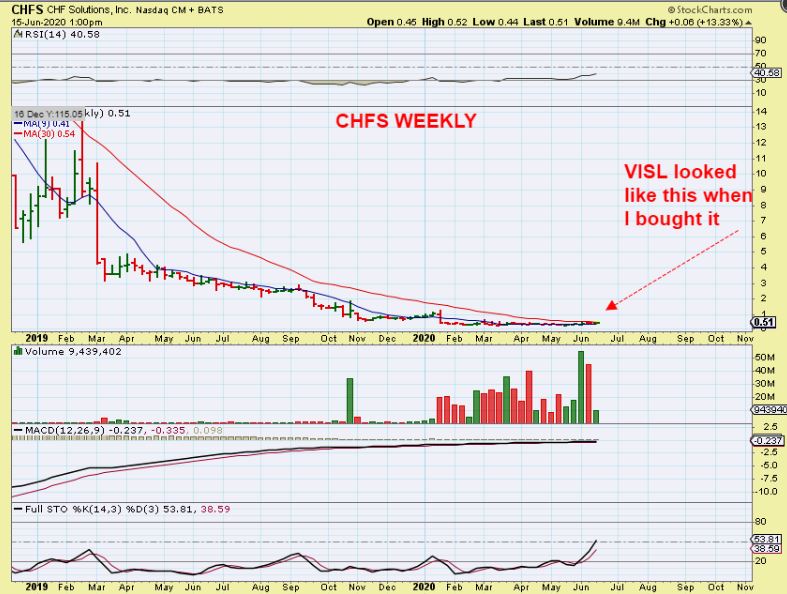
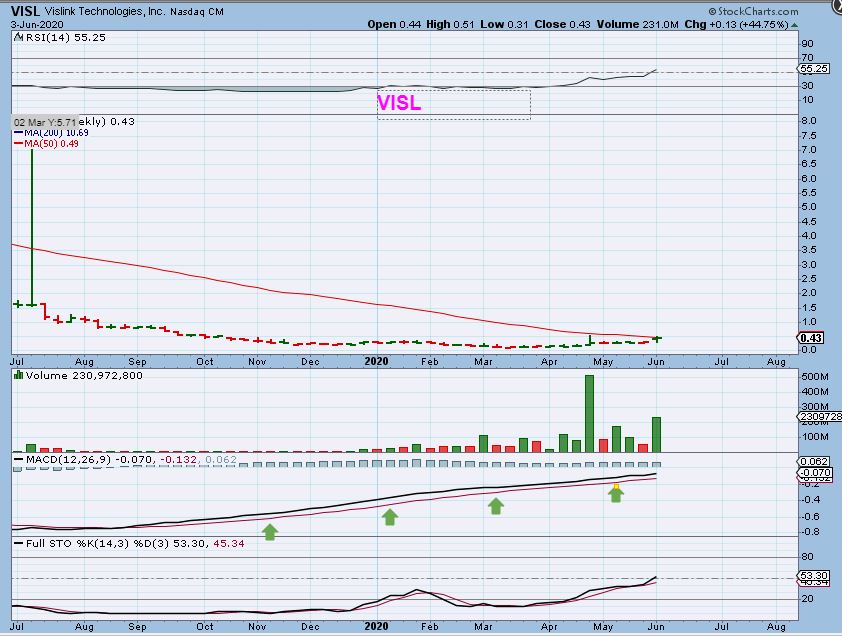
VISL on JUNE 3 – I bought it strictly for the chart set up & this long base where price pushed on that 50 week ma with increasing volume, and …
Boom! VISL suddenly popped 1 day later 200%. These chart patterns can be extremely explosive and CHFS has a seminar on March 17, so I am cautiously optimistic. Hopefully that seminar goes well…
THE LATEST NEWS RELEASED FRIDAY: CHF Solutions (Nasdaq: CHFS) today announced the company will host an interactive, physician-led webinar to discuss the recent publication: SARS-CoV-2 (COVID-19) and intravascular volume management strategies in the critically ill. and the role of ultrafiltration in the treatment of patients with COVID-19. The webinar, which will feature perspectives from Italy to the United States, takes place on June 17 at 9 a.m. EDT.
.
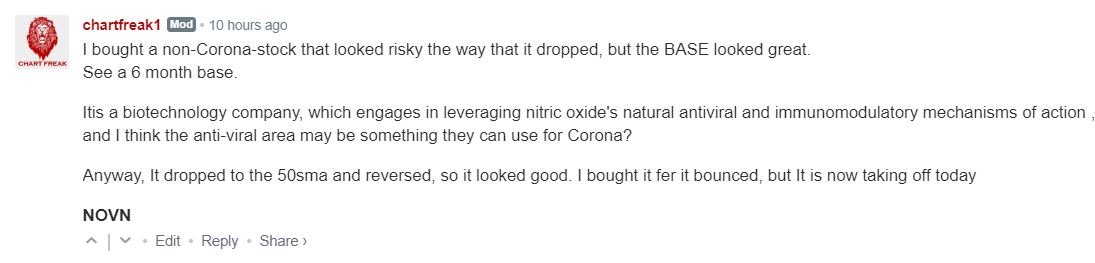
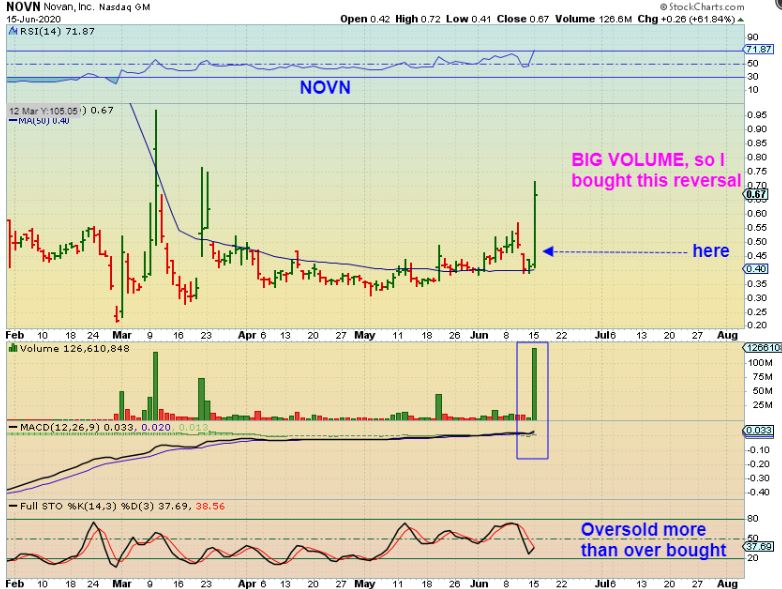
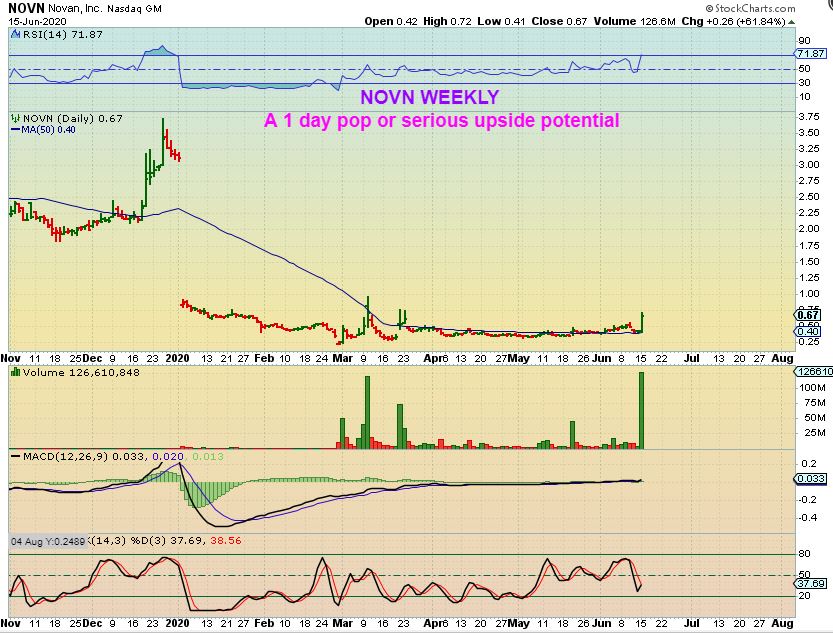
Again, I have liked Biotech & Pharma chart set ups lately, and I mentioned buying NOVN Monday morning in the live area with this post. It dropped to the 50 sma & reversed:
NOVN closed up 62% and it honestly looks like it can keep going. Why?…
THE BIGGER PICTURE OF NOVN WEEKLY shows todays 60% pop as small & it remains oversold on the weekly, so my plan is to always sell a little on the way up and let it ride with a trailing stop. Then eventually I am out & hopefully as it rises and leaves me with gains.
.
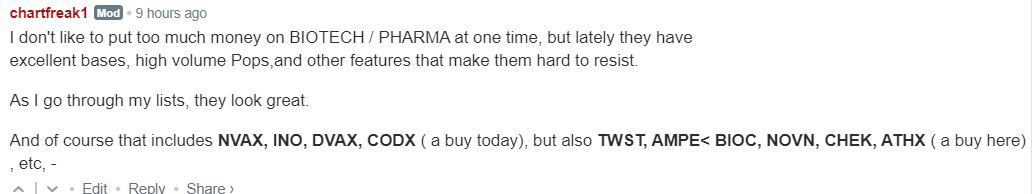
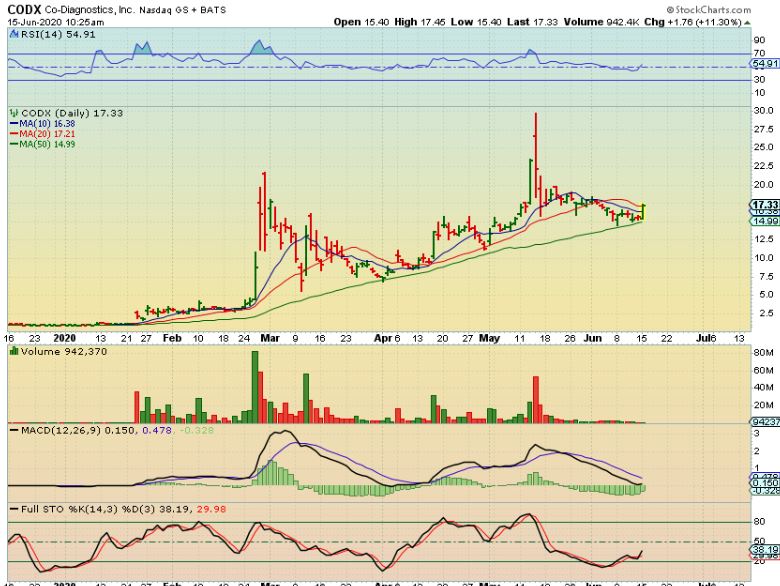
SO BIOTECHS ARE STILL ON FIRE WITH BIG MOVES FROM NICE BASES. I WROTE YESTERDAY THE COMMENT BELOW Stating also that CODX & ATHX were buys . All of these other charts look good, you should look them up if the sector interests you.
CODX after 1 hr of trading. This is still a buy, it is right on support and actually closed here. It is oversold. These are choppy at times, and they FLY at times.
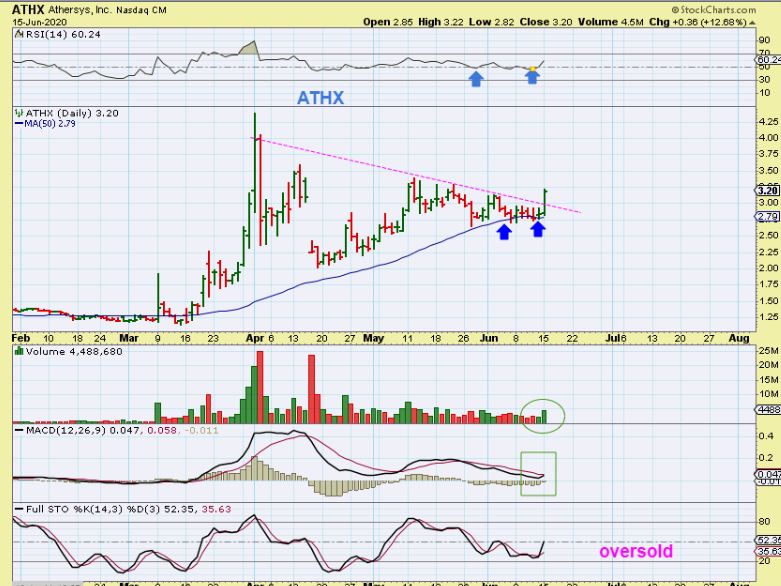
ATHX was only up 5% when I mentioned it, but closed up 12% and also looks like it has further to go. This is a break out buy.
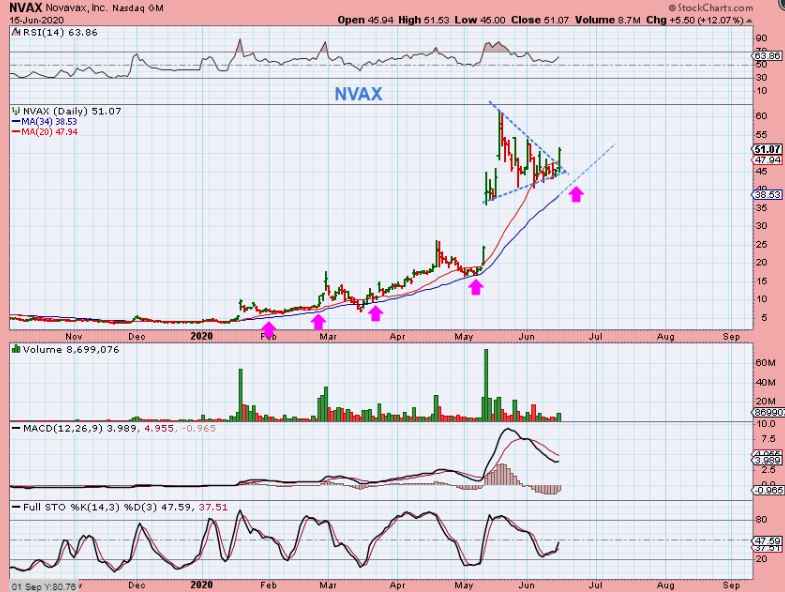
NVAX is breaking out, but I’m not buying this at this point. This MIGHT be getting a bit steep, but it surely has done well since we bought it here below $10!! ( I sold a long time ago, near $14-$15, I think?). It got pretty choppy on the Bull Run.
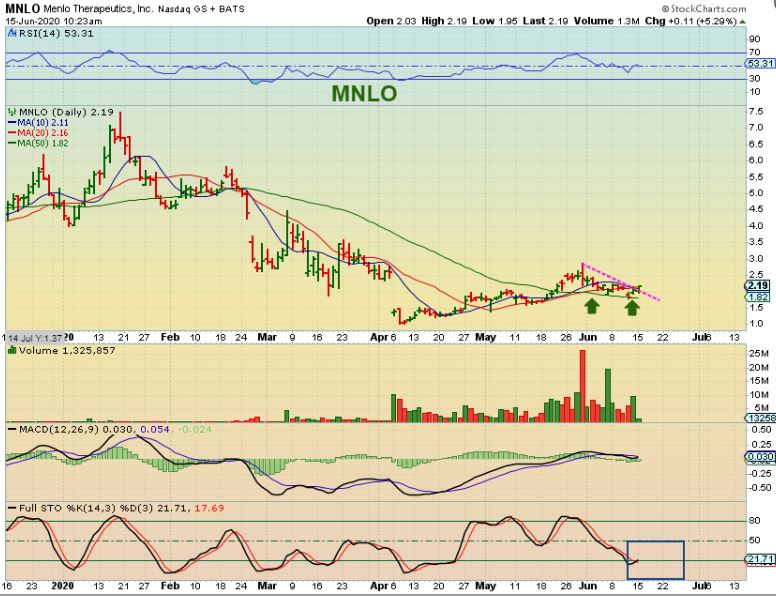
MNLO is breaking out and I grabbed this after 1 hr trading, the volume was pretty good too. I still own it, but some of these are just 3 day trades? 5 day trades? 7 days? I wont know until it unfolds really, this might start running and I’ll just sell 20% a day until I’m out.
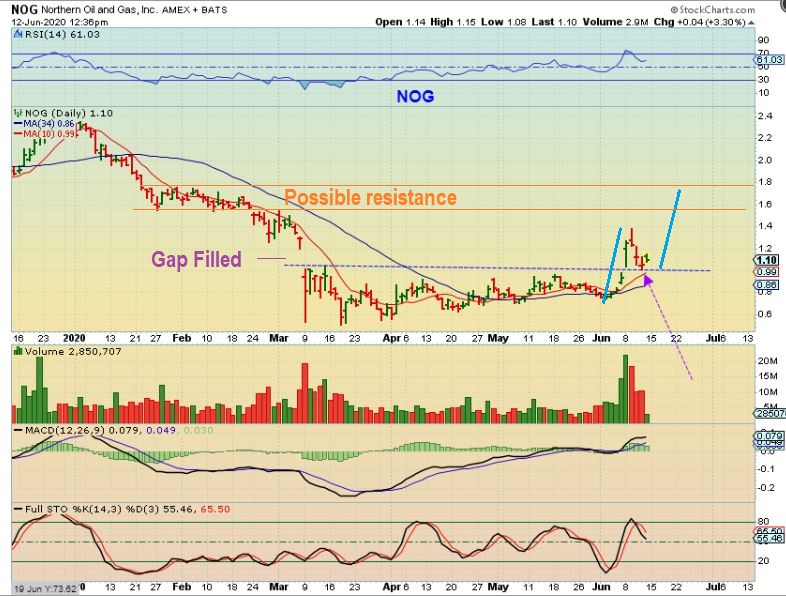
NOG was a buy a week or 2 ago, but it Popped to the initial target immediately and then stalled. Now what?
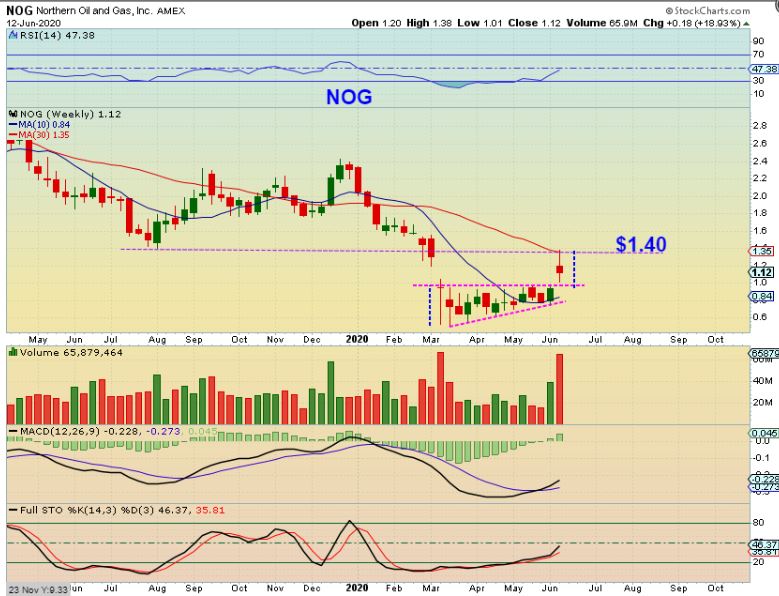
NOG ran to $1.40 and already back tested that break out, so it could be all set & ready to move higher again. There is resistance in the $1.60-$1.80 area, where a measured move leads us.
.
LET ME EXPLAIN THIS ONE: BUY & HOLD for me as it climbs? Maybe.
I bought RGLS chart #1 and I then added, and now I am down 2 cents on my new addition. I may or may not hold this, but it is a steady climber and I was bored with the chop in Miners 🙂 If it gets to former highs, it is a great % -gainer ( $0.88 cents to a double). . Let me show you a better view as to why I bought it…
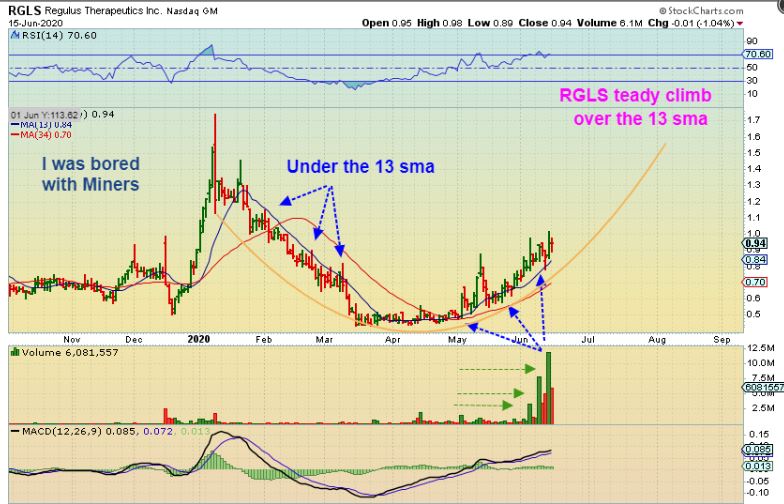
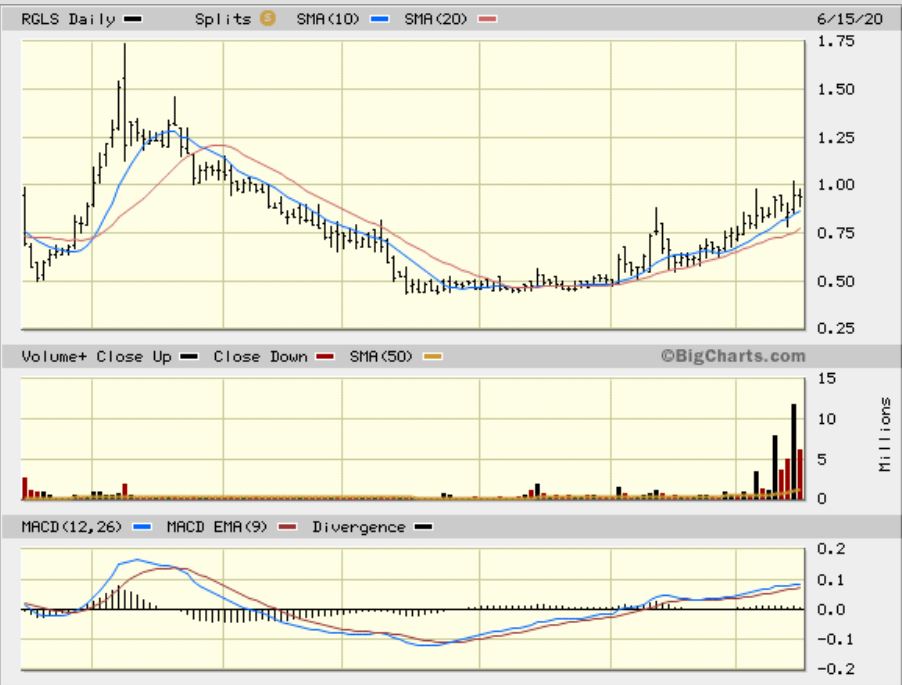
RGLS #2 here you can see a steady climb up 100% now. It based at 50 cents and as it rises, volume is increasing. It looks to be being accumulated on the way up. So what, right? Well…
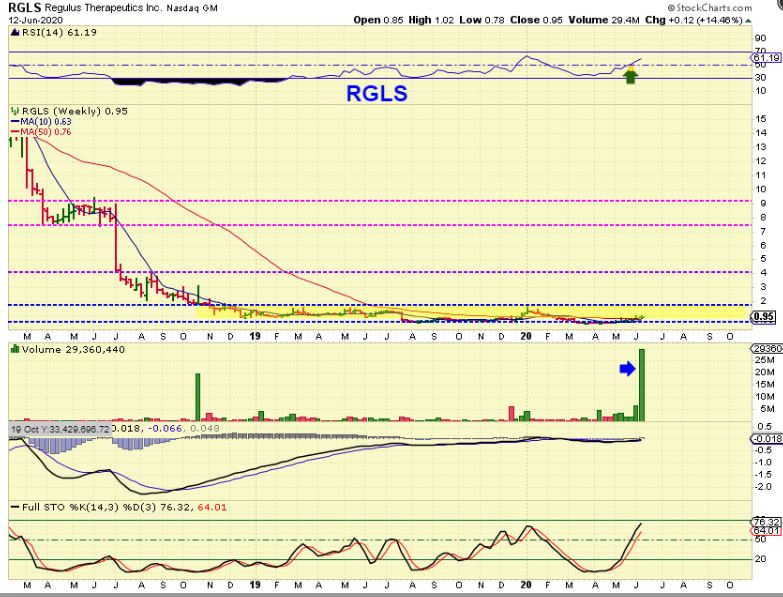
RGLS chart #3 (Weekly) that accumulation is now volume that is starting to look like ‘someone knows something’ about their clinical trials? I view this as a RISKY stock though, because they are in clinical trials that can fail. The upside on this chart is very good though. I’m just not sure how long I want to hold this, I may sell some above $1 .
SXTC a few of us own this. The Chinese stocks have been ON FIRE ( See CGA, SEED, CHNR, JD, JRJC, and many more). It briefly dipped under the 50sma & a few asked if I sold it, I said “No, I’m holding this in the base”. It then reversed and looks like it MIGHT be ready to finally run. Watch it today.
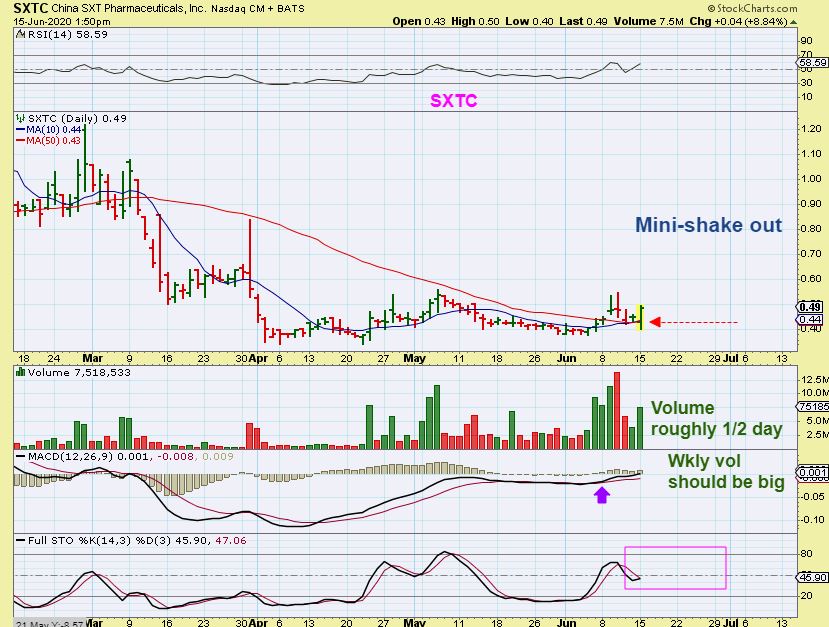
SXTC AT THE CLOSE – Volume came in strong, I’d like to see strong follow through next .
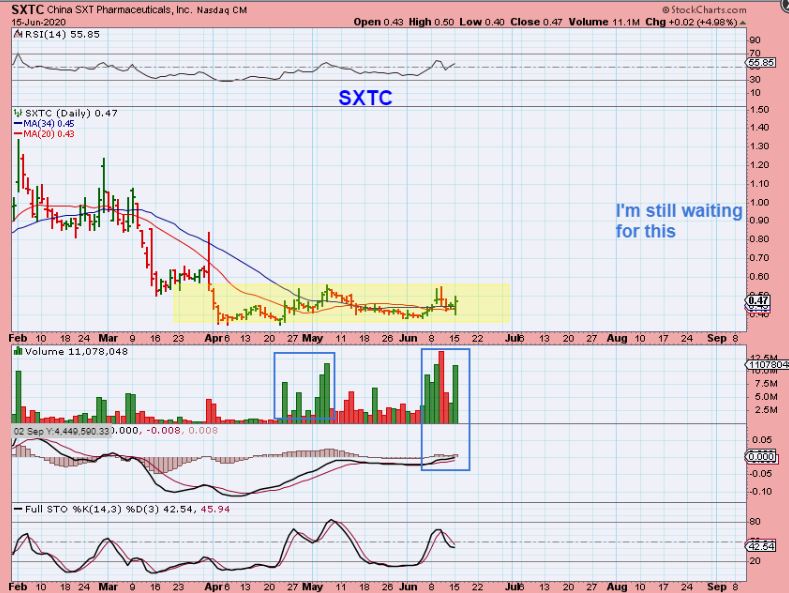
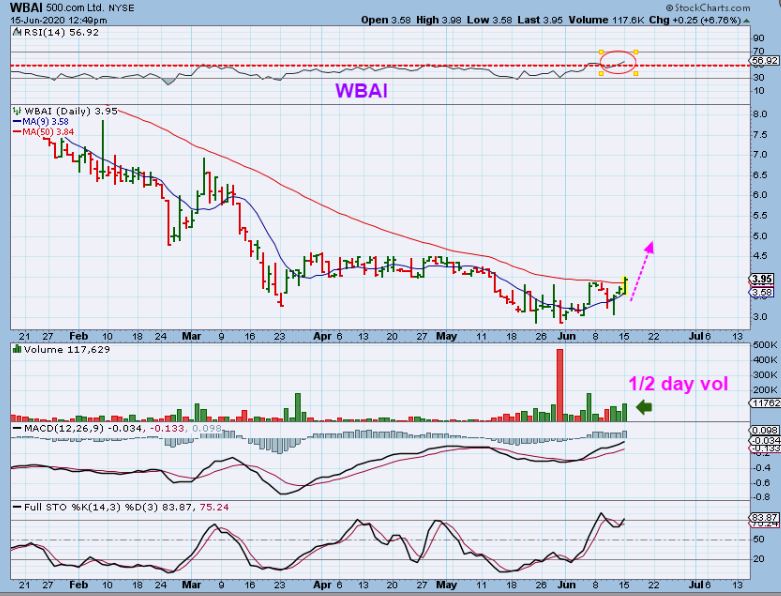
WBAI is trying to break above that 50sma. It did close here, so if you see what CGA, SEED, CHNR, JD, etc have done & want a Chinese set up? I like SXTC and WBAI, because they are near the lows, and in a base that could break higher.
But for most of my readers, I would think that BUYING MINERS in preparation for the next leg higher is what is being done. Miners can be explosive too. I will put more BUY set ups of Miners in the next report if things continue to play out bullishly there ( It should).
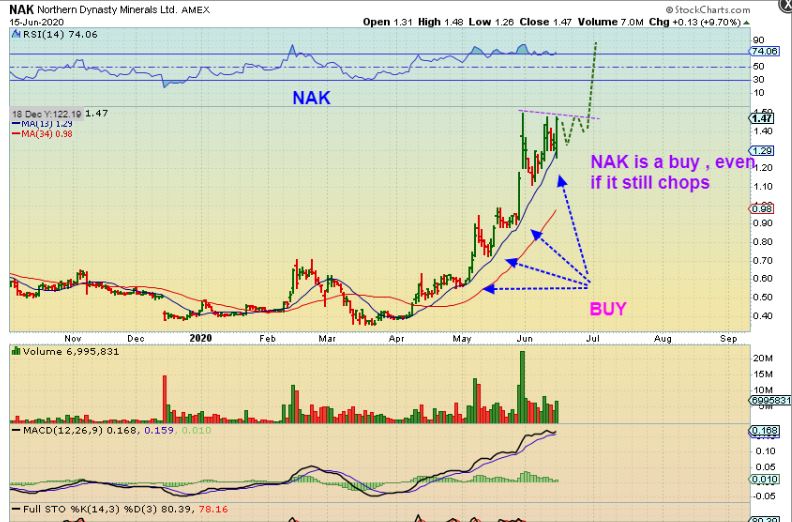
NAK JUNE 4 – I said to buy it at the 13 ma- it was also bullishly climbing that 13 sma in the 2016 rally.
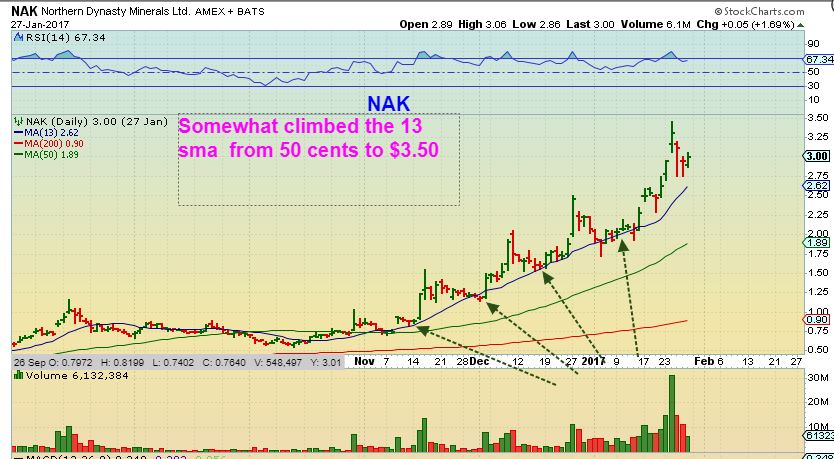
NAK JUNE 4 – so I said to keep buying it here…
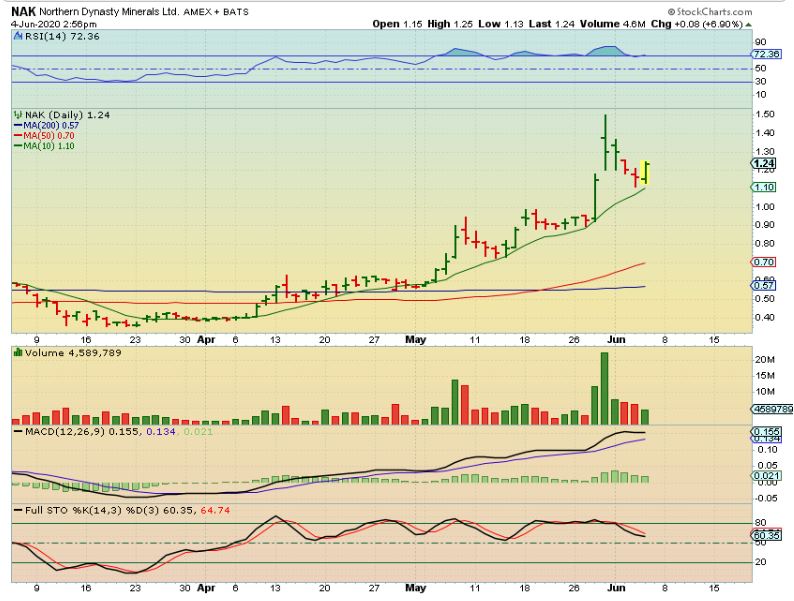
NAK – And that has been a good call. Even if it chops around, it is bullish until it breaks down.