Thursday June 18th
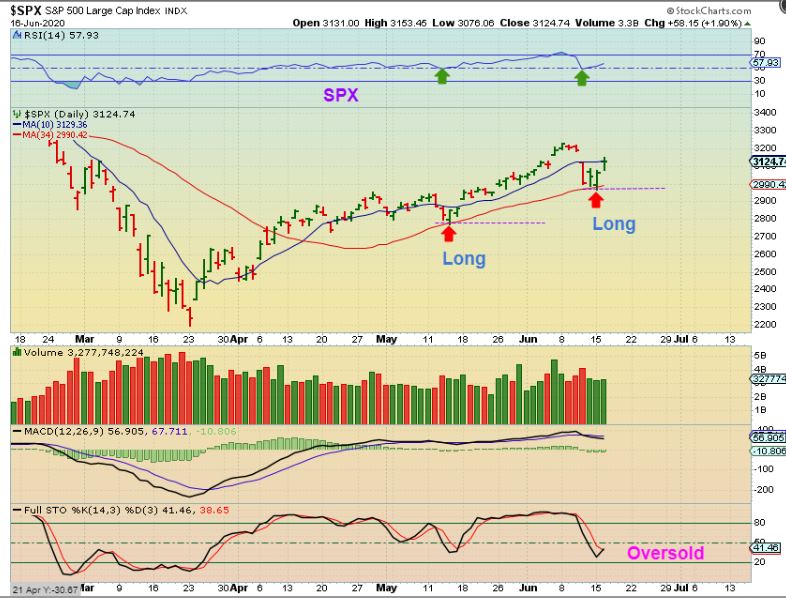
FROM YESTERDAY : SPX – With some upside gains, we are getting confirmation that the long trade is on track.
.
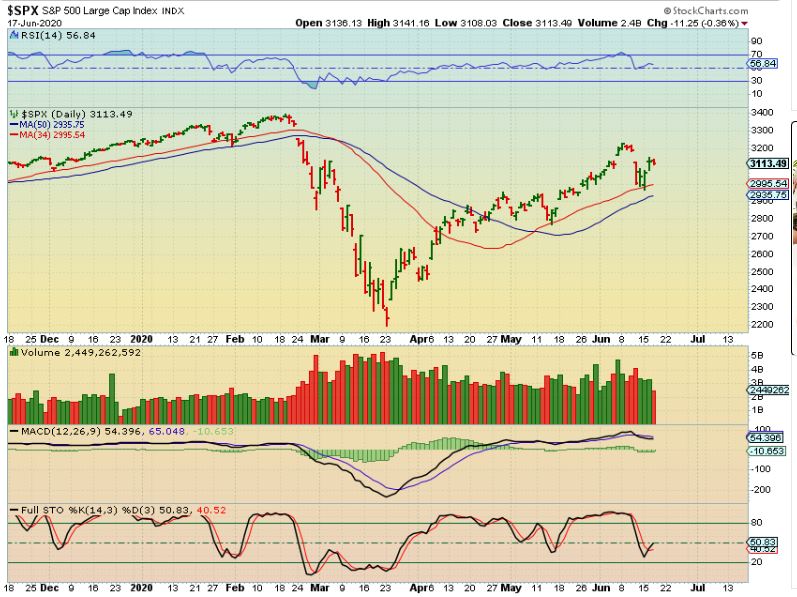
SPX – No real change from yesterday.
.
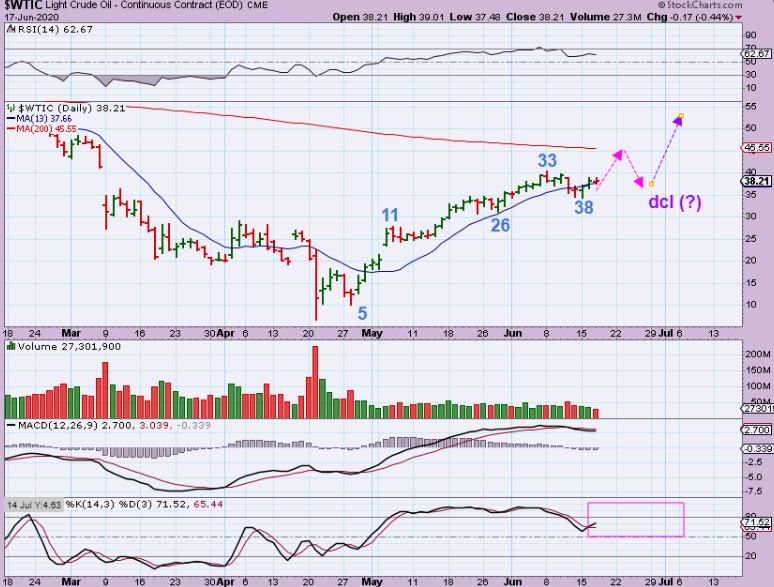
WTIC – Oil can have 50 plus day daily cycles, so there is still time for this to pop, tag the 200 sma, and then quickly drop to a dcl. That isn’t a guarantee obviously, it is just likely based on the current set up.
,
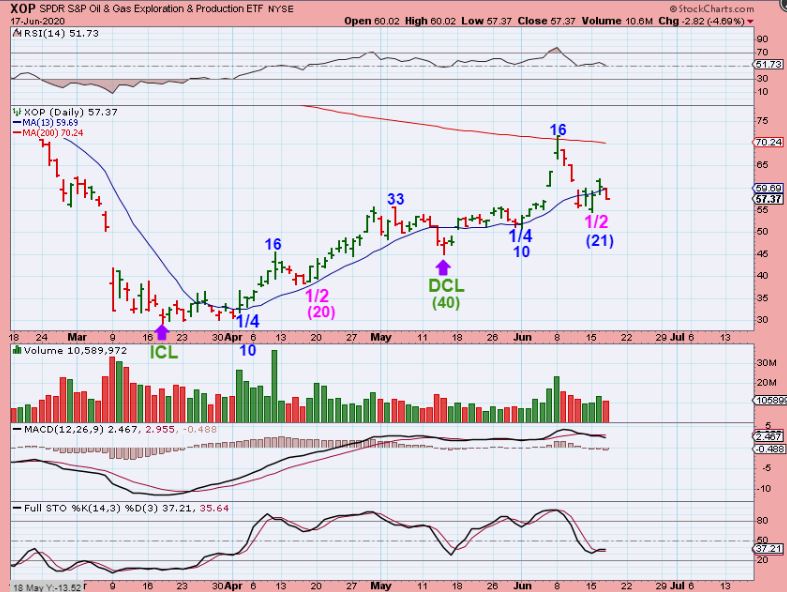
XOP #1 – This lost the 13 sma and that can be a sign of weakness. I drew the first daily cycle & compared it to this 2nd one. They are almost identical, but we need price to rise sooner than later. So…
.
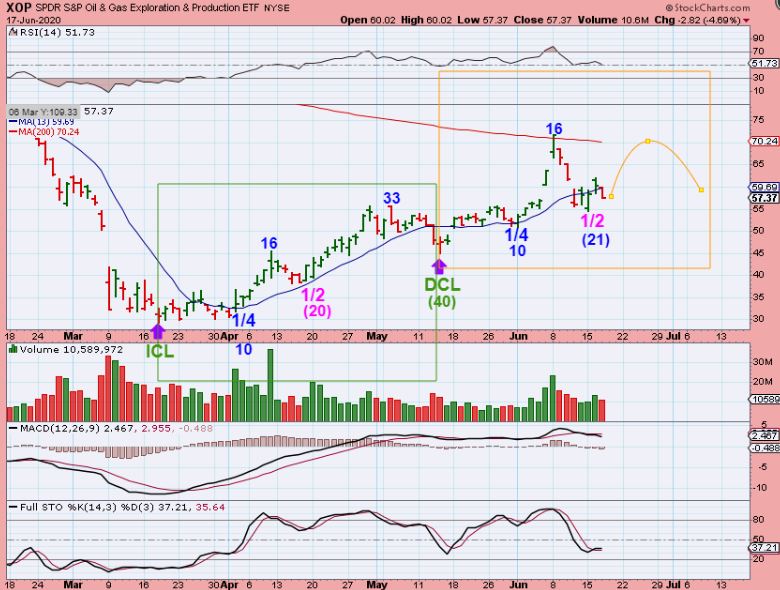
XOP #2 – I put a box around the first daily cycle & added one to the current run…
1. I see a 1/4 cycle low on both daily cycles near day 10
2. Then a run to day 16 high
3. That was followed by a drop to a 1/2 cycle low on day 20 & 21
4. That is where we are now, so what happened next in the first daily cycle? It ran higher.
.
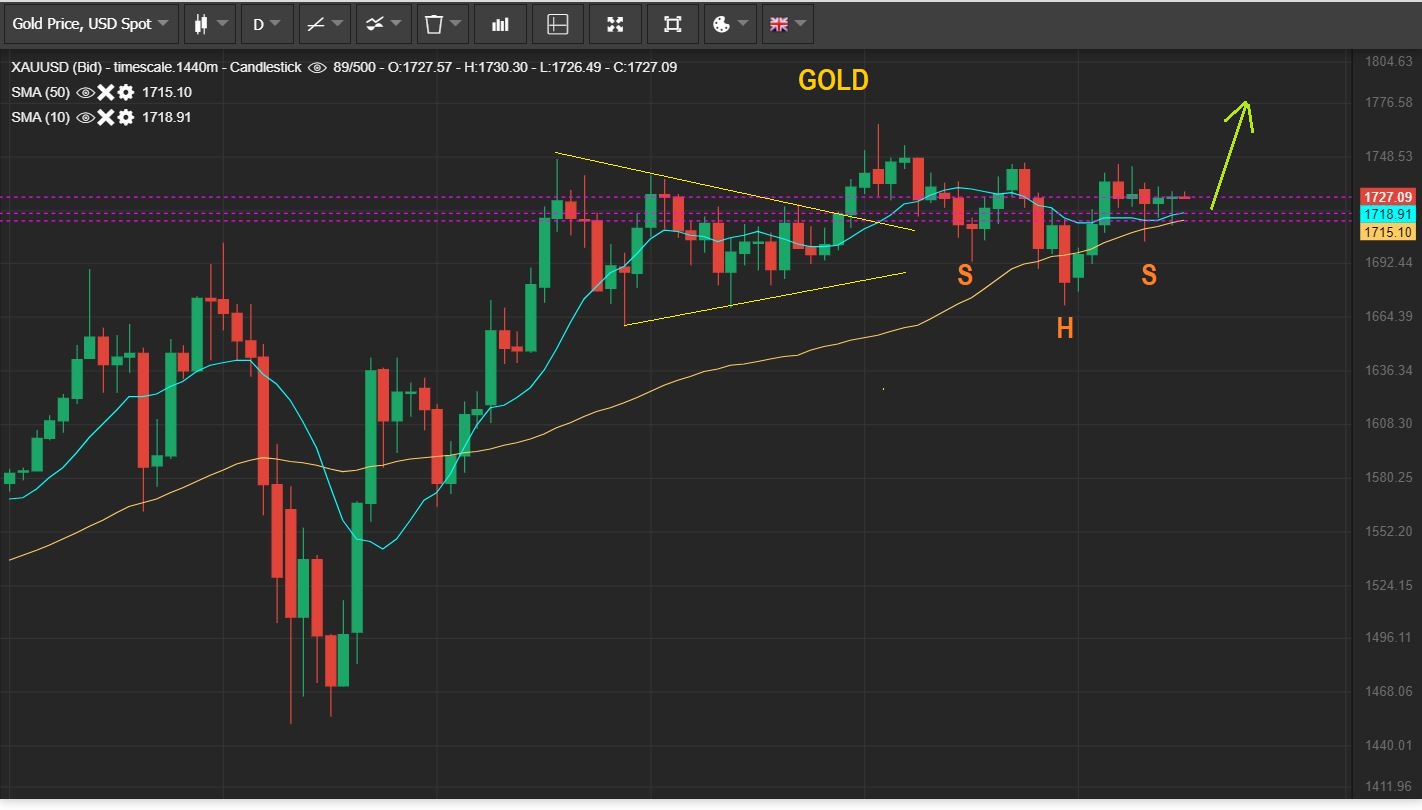
GOLD – Another day of sideways chop, but this can lead to a bullish pop. I still see a possible inverse H&S.
.
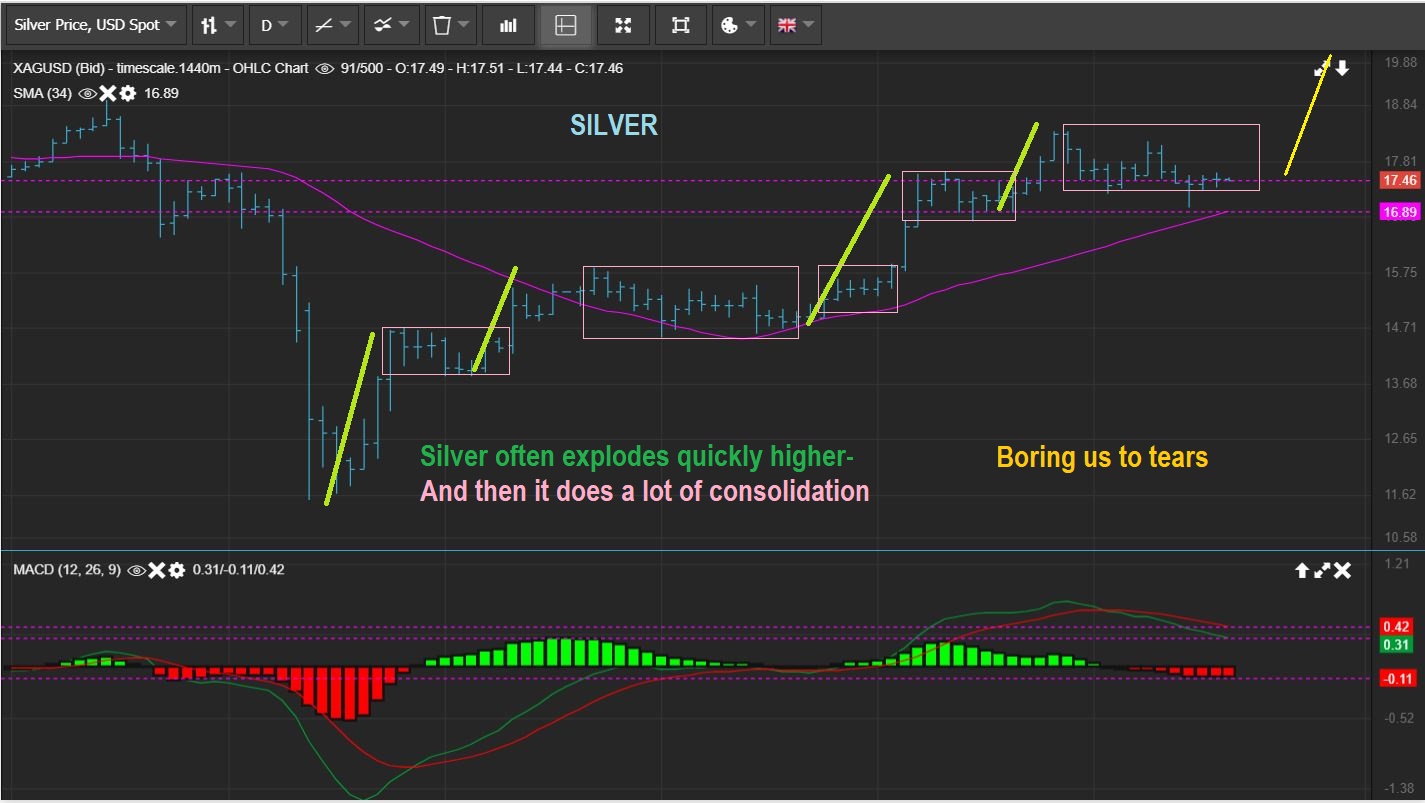
SILVER has also continued to chop sideways, but it does that often, right before a nice quick run higher.
.
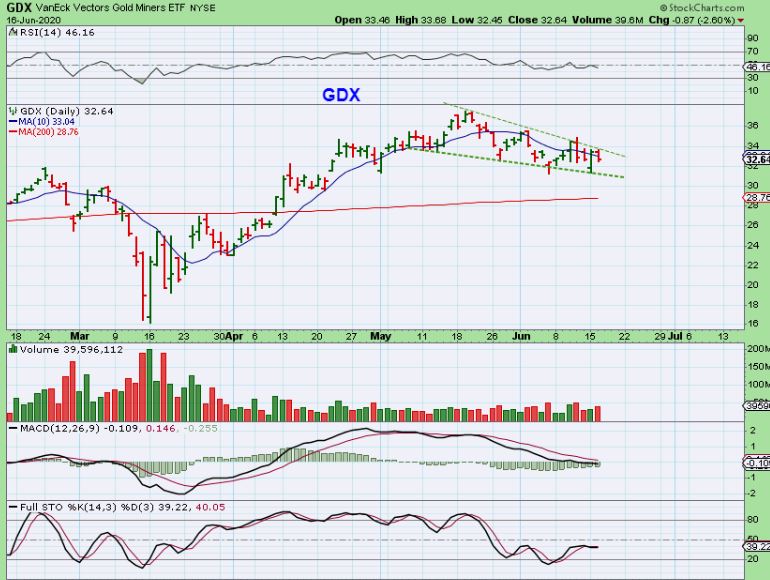
GDX YESTERDAY: has a downward sloping wedge. This is wearing people out, boring people to tears. A break higher is a Buy.
.
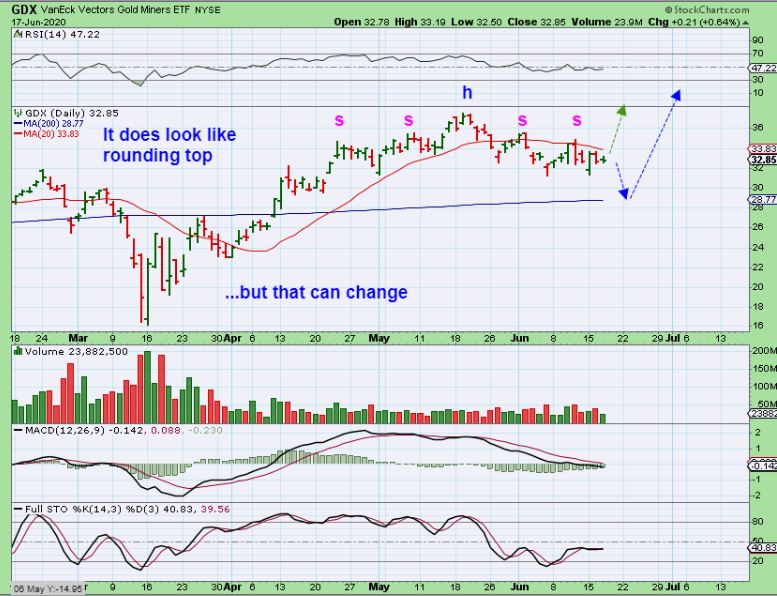
GDX #1 – The Metals look ready to break higher, so this could also, but read the chart. It really does also have the look of a rounding top with a drop to the 200 sma coming up. IF THE METALS BREAK HIGHER, I say this just follows, However….
.
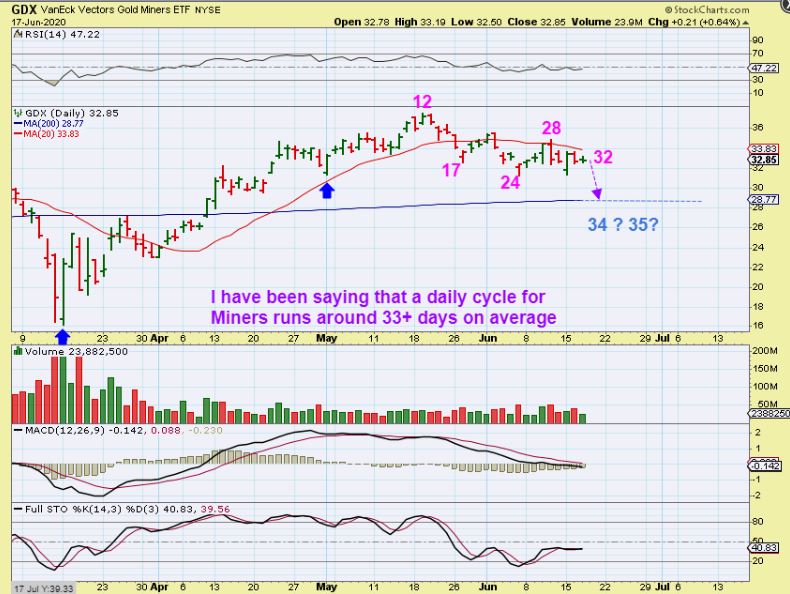
GDX #2 – I have been saying all along that Daily cycle counts often last 33+ days , and we are just getting there. I use them as a guide for ‘timing’, so at least we know that we are at that timing for a dcl.
.
Things are still playing out as expected, and we are not seeing a market crash or big sell offs anywhere. That said, this week has just been mostly choppy sideways action, and that is often frustrating until we get the Break Out that we are waiting for. We’ll see what Thursday brings our way…
.
Enjoy your Thursday trading!
.
~ALEX
.
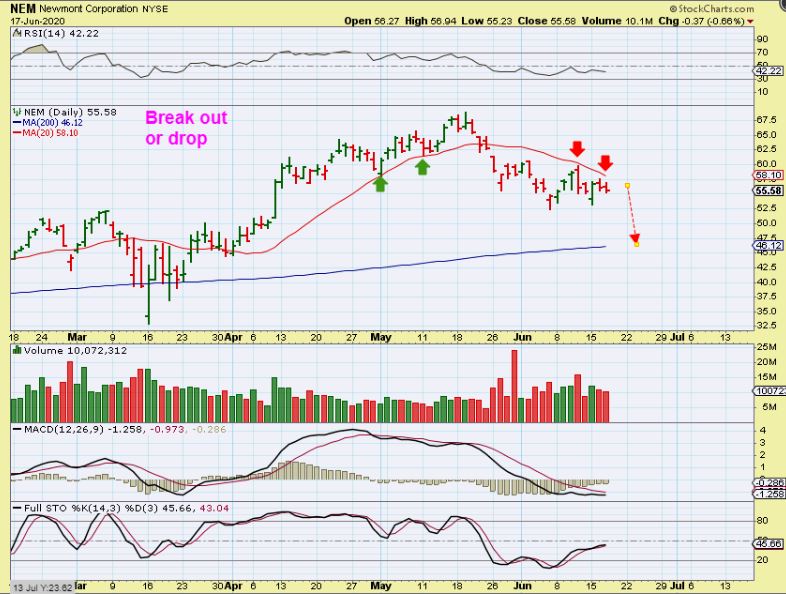
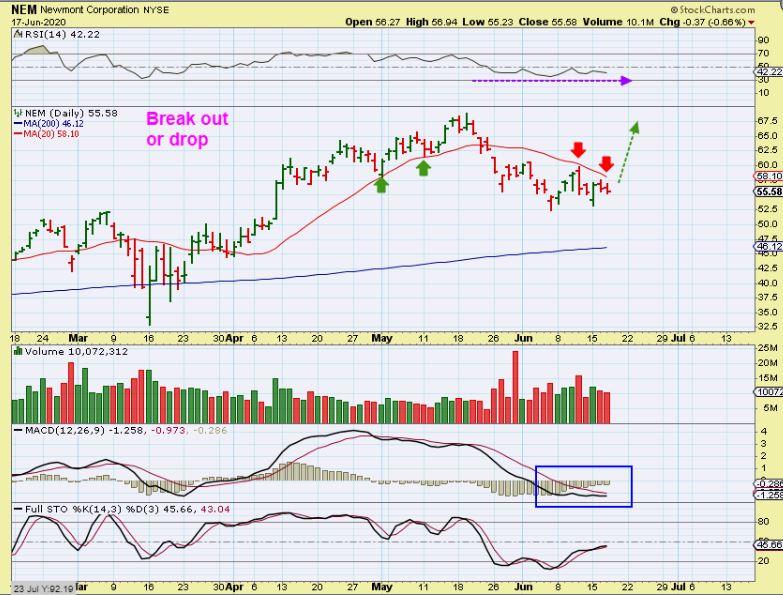
NEM – When I look at some of the larger Miners they still do look as though they are experiencing weakness, but the MACD has flattened and the rsi is above 30.
,
NEM : If the metals break out, I would expect these to just follow and find Buyers eager to get position.
,
TRX – I used these 2 charts below recently to show that some of the juniors, like TRX, looked bullish, and i mentioned that I bought TRX Monday and Tuesday.
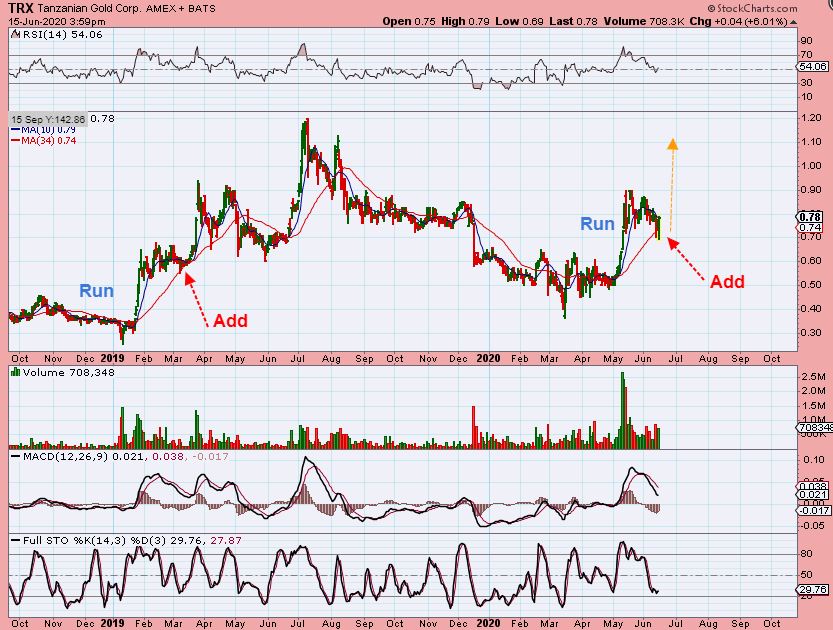
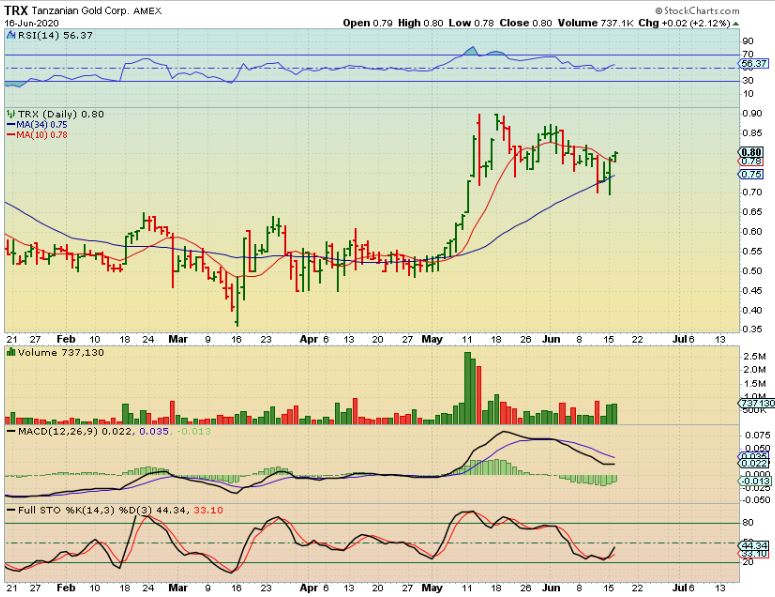
.
TRX came out with some positive news and the stock jumped, sold down a bit, jumped again, etc, but basically it closed higher and this really does look ready on a weekly chart to make a run to 2019 Highs. That volume is as of a 1/2 week trading.
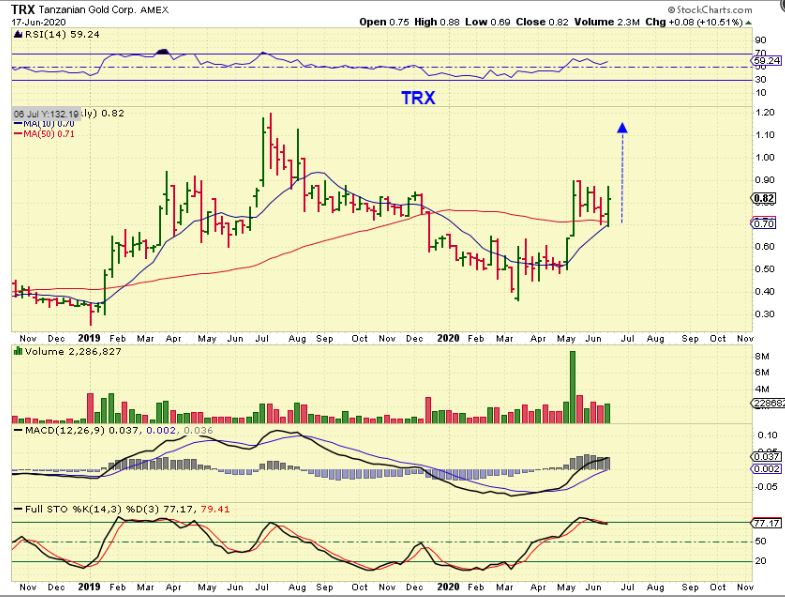
.
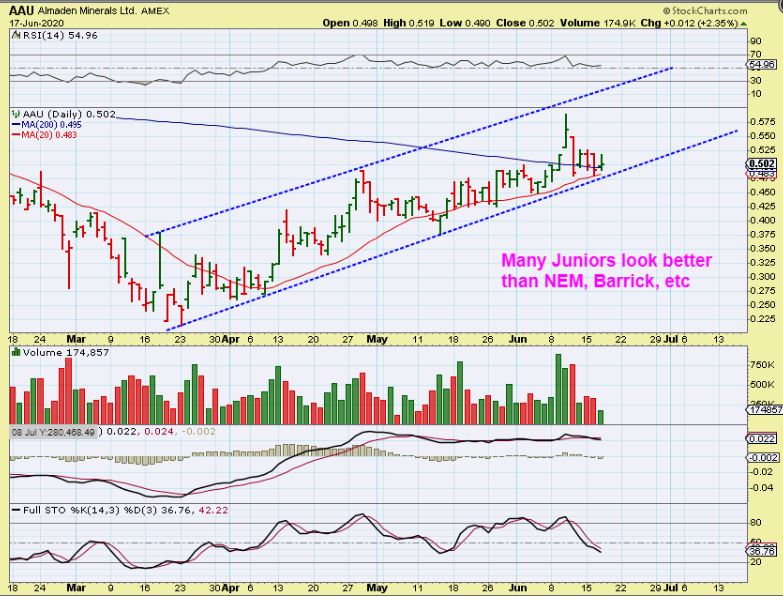
AAU DAILY is steadily climbing and this also has a bullish look (unlike GDX & NEM), so some of these juniors still look very good, we are just waiting for a catalyst. AAU went from $0.22 to $0.58 since March with out a Major pull back ( just choppiness). Doesn’t that make this a buy to you, if you don’t mind a low priced Miner?
.
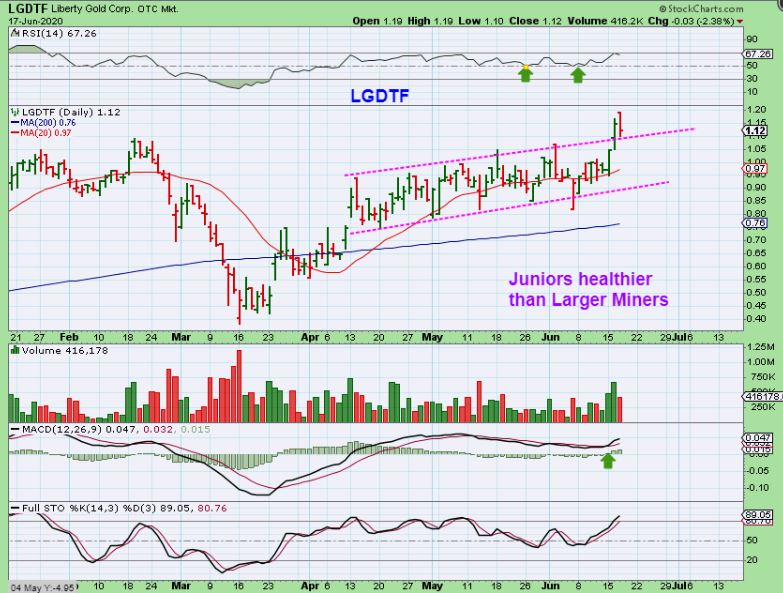
After a nice break out on Tuesday, LGDTF back tested that break. This break out took place without Gold advancing, so this may be an opportunity to buy it before it continues higher. Read the chart.
.
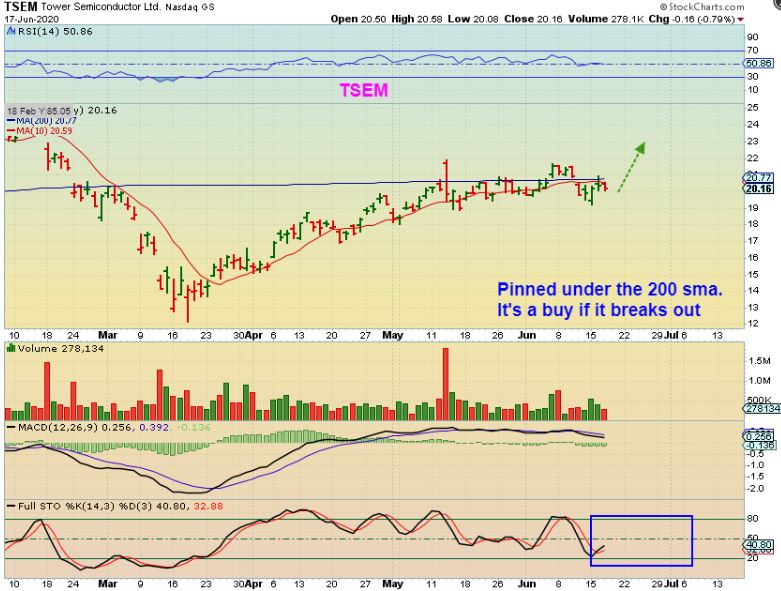
In the past we discussed TWTR, UBER, TSEM and other Tech Stocks as possible BUY & HOLD from the march lows…
.
TSEM – Our General Markets trades are still set up bullishly, and may be ready for a break higher. We discussed AMD, MU, etc.
.
IS IT YOUR TURN NOW SWING TRADERS? MAYBE. Some of the bases that broke out are back testing support area, and they may make good short to medium term trades. Let’s take a look…
.
I want to discuss the after effects of ‘Bases popping’ set ups, because after the pop & drop from a base, these set ups can also start to shape up and even begin to trend higher. IT SHOULD BE SAID THAT THIS IS IF THE MARKETS STAY BULLISH. The markets will eventually correct into a dcl, so we want to be mindful of that, A 3rd daily cycle may show weakness too, but some of these set ups could make nice 1 -2 week trades now. Does that mean that it is now the swing traders turn, and not just fast scalpers? It might mean that, for as long as the markets stay bullish.
.
Let’s take a look at something here and now, and then we can keep an eye on things as they play out.
.
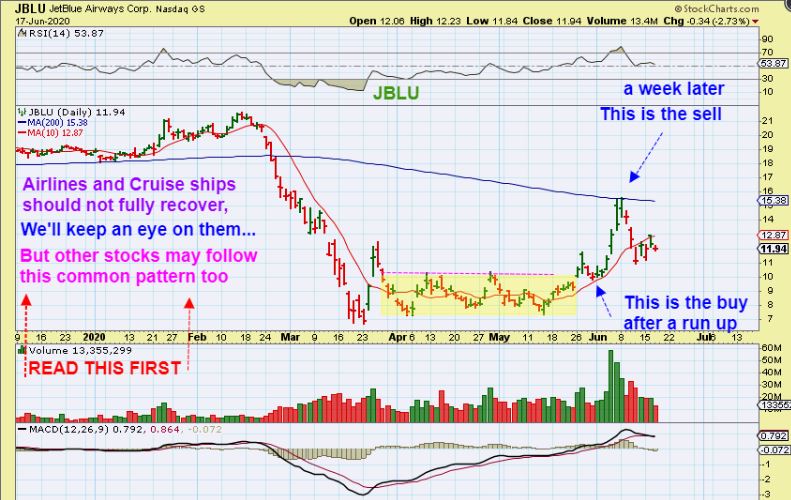
You may remember when airlines & cruise ships broke out? Well, honestly, I didn’t think that stocks like JBLU,AAL, etc would do anything more than a short covering pop, then drop back into the base. They shouldn’t really be in recovery mode, right? Well, after a little short covering, they still set up properly. This means the Energy Stocks may do this too. Also some of the other General Market stocks may do this with the re-opening of businesses (we are talking shorter term, like over the next month or so). It is something to trade while aiting for the Miners.
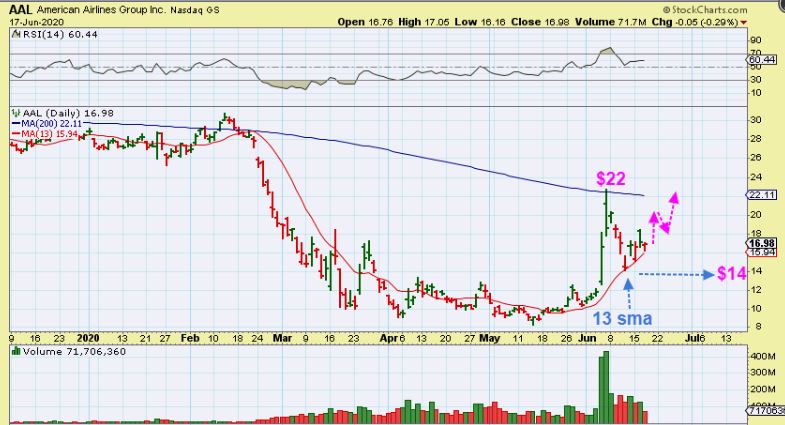
Look at JBLU and see how after the pop from the base, it then back tested the 10sma ( a buy) and ran to the 200sma. That was $10 to $15. Next…
AAL popped & dropped to the 13 sma in May and then ran to the 200 sma at $22. Now it dropped to that 13 sma again. Buying it there (13sma) , you’d be at $17 now, and this looks like it wants to get back to the $22 area. $13 to $22 is big, and these are stocks that shouldn’t be recovering , but they are. OTHER STOCKS may do this too…
,
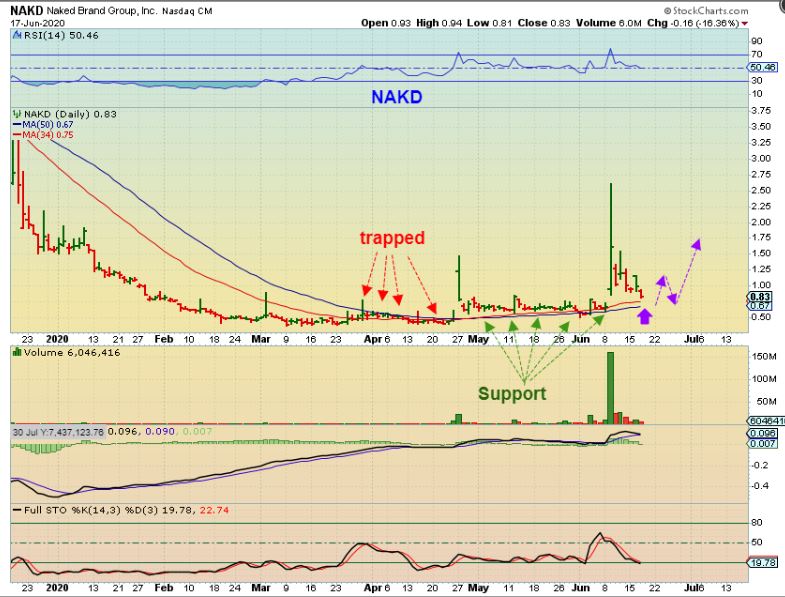
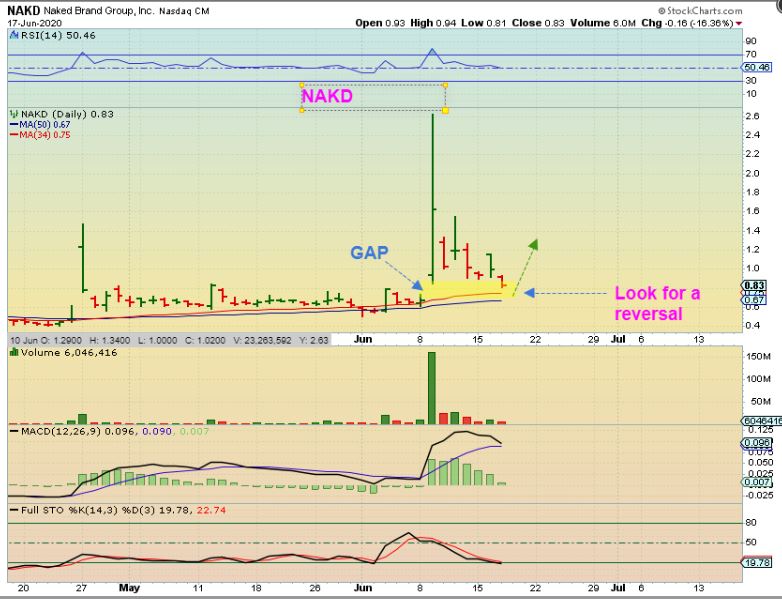
NAKD for example is working its way back to the 34 & 50 sma which should offer support. Lets zoom in…
.
NAKD seems to be filling a gap and I am going to watch for a reversal. If it reverses, it may become ready to move higher again (as long as the markets stay healthy). I am keeping my eyes on NAKD again.
.
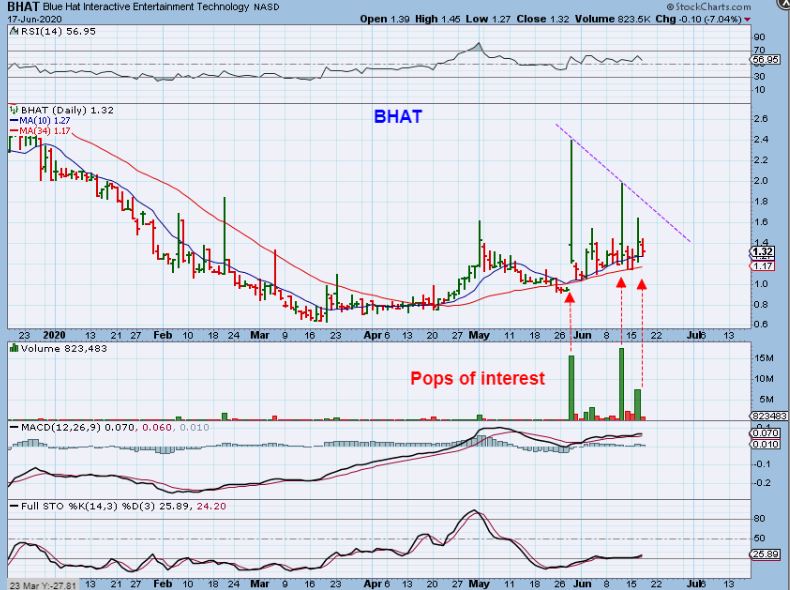
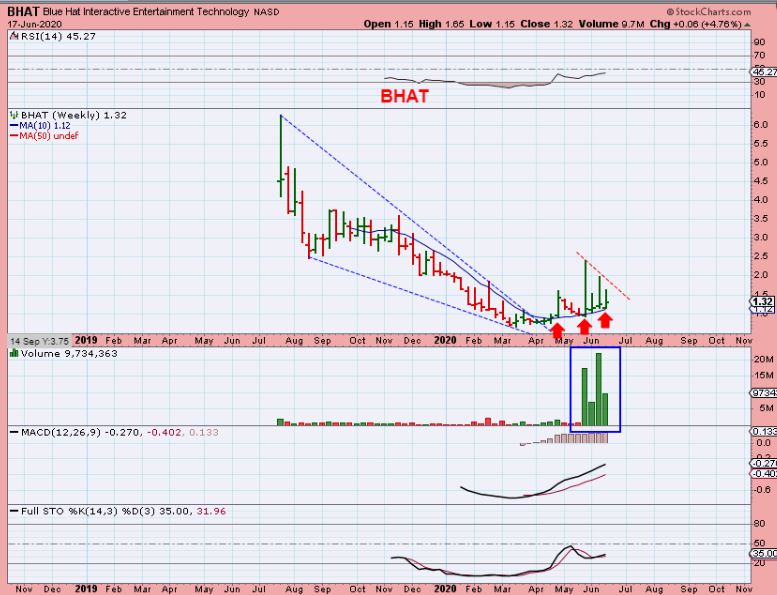
BHAT is very choppy, but these are big moves from the 0 sma (&34sma), which are acting as support. These pops have been from that 10sma ( $1.20) to $2 and it may eventually break out from the purple line, because…
.
This BHAT WEEKLY CHART is also showing strong volume out of the lows. This is a very interesting chart to me, and on the daily chart it does rest near that 10sma. I also have my eyes & a small position on this one.
.
I have mentioned that I bought BIOC as it was being pinched here under the 50 week ma. Bioc actually broke out above that 50 week ma. So far it broke out and dropped back, but it remains quite bullish with the volume this week (as of Wednesday) , so go to the daily chart…
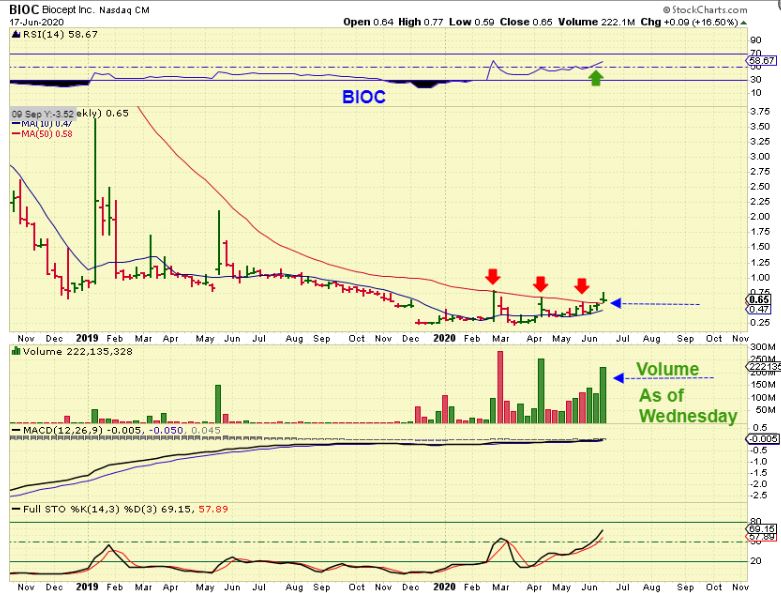
.
BIOCs Daily Chart shows the break out Gapped open, so BIOC may be trying to fill that gap, but it actually already is tagging that 10sma. This is where it can move higher. You can see that it has been bouncing into the close after each day of selling. I sold 1/2 on the pop & re-bought it , due to that weekly chart 50 week ma, and the bounce into the close after each drop.
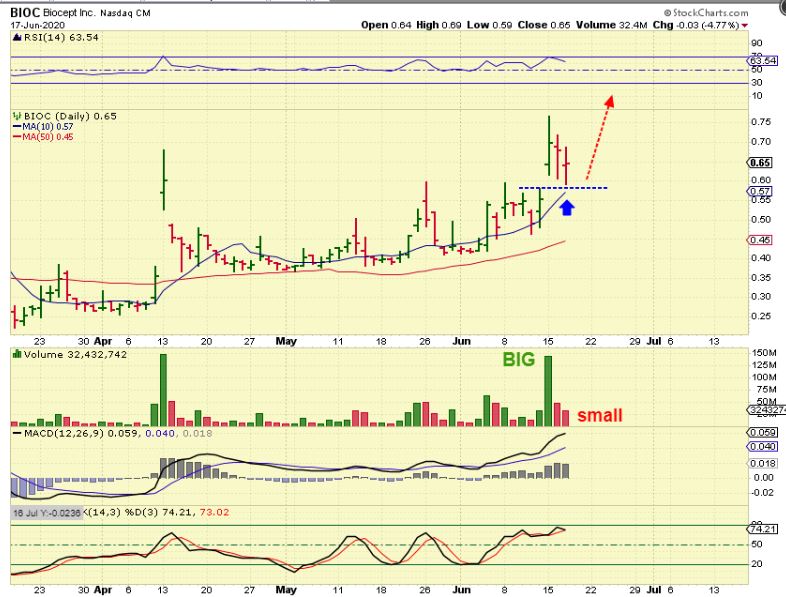
,
,
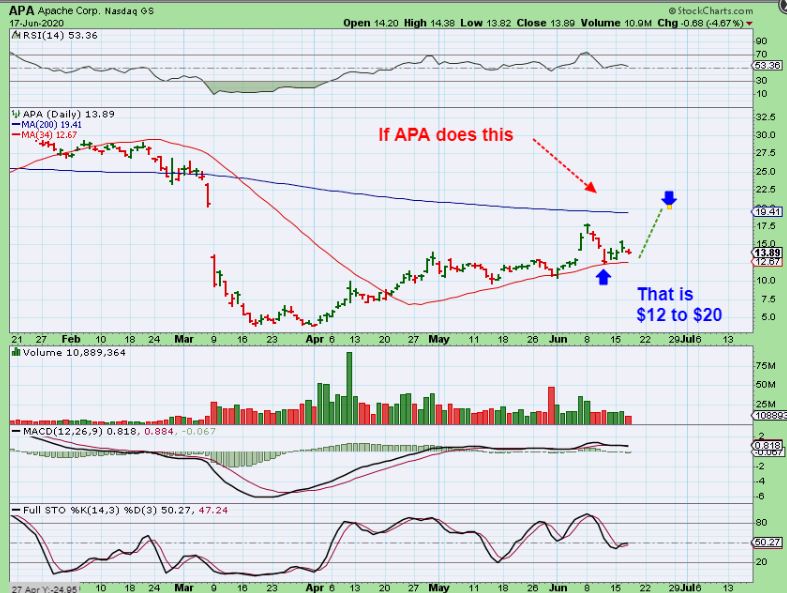
So our Energy Stocks like APA have popped and made a run , but are now back at the 10sma. I have had these in the reports as a place to enter ( low risk entries). I do not own these, but I do like them as a bullish set up with good potential upside.
.
BTE is also at that point of the pull back where it looks to be trying to find support and reverse. ( 20 sma). This is similar to that JBLU chart. Pop, dip to support, and hopefully run to the 200sma.
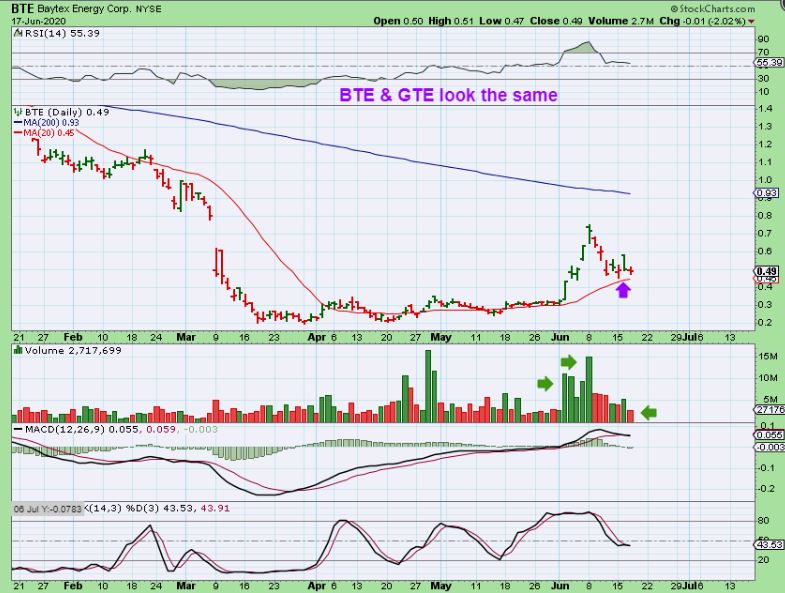
.
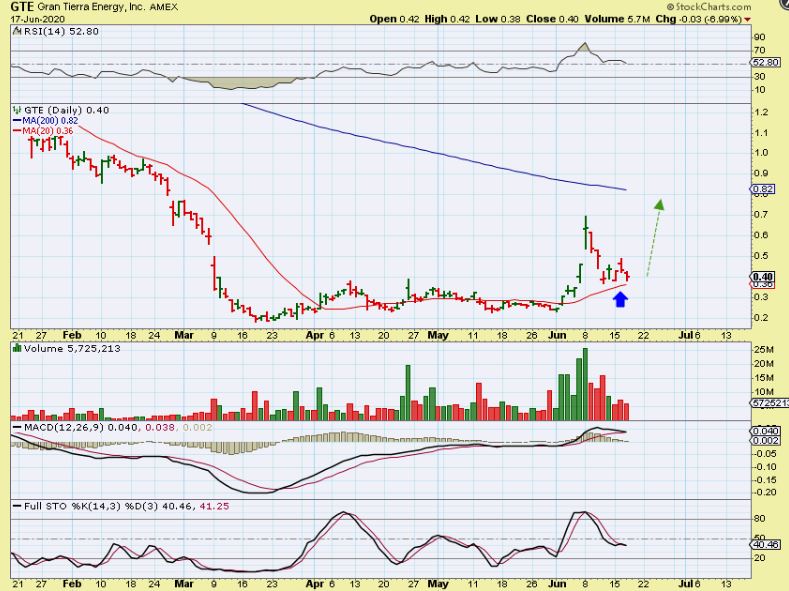
GTE looks just like BTE, looking at a support area, however GTE popped up 40% after hrs.