
6-6-2020 – The Weekend Review – Step By Step
This is an older Picture taken of a beach in New England a year or 2 ago. They just started opening up the beaches where I live, so I thought I would post this older picture anyway ( I didn’t make it down there this weekend). Step By Step they are trying to get things slowly back to normal. We still have social distancing rules with no crowded beaches, only outdoor dining, etc , so it will take some getting used to, but Summer here in New England is rather short. It just wouldn’t have felt like Summer without an open Beach.
As a side-point, My wife took this picture and yes that was me in the Orange shorts after saying good bye to our friends down by the water. I will Never take little things like a walk on the beach with family & friends for granted again! 🙂 Baby Steps back to normal! And that leads to our report. Step By Step the Markets continue to do their things too, so lets see what happened last week.
,
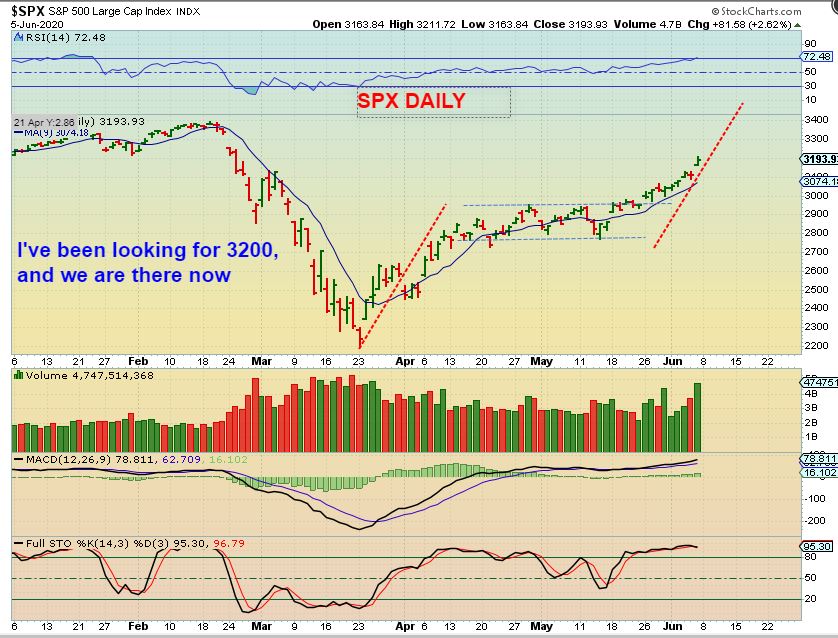
SPX DAILY – Well, for weeks I’ve been looking for the SPX 3200, and we are there. Honestly this doesn’t look like the final stop yet viewing a measured move and increasing volume. There is a gap, but this can just continue higher next week. We’ll see, but lets discuss the weekly charts..
,
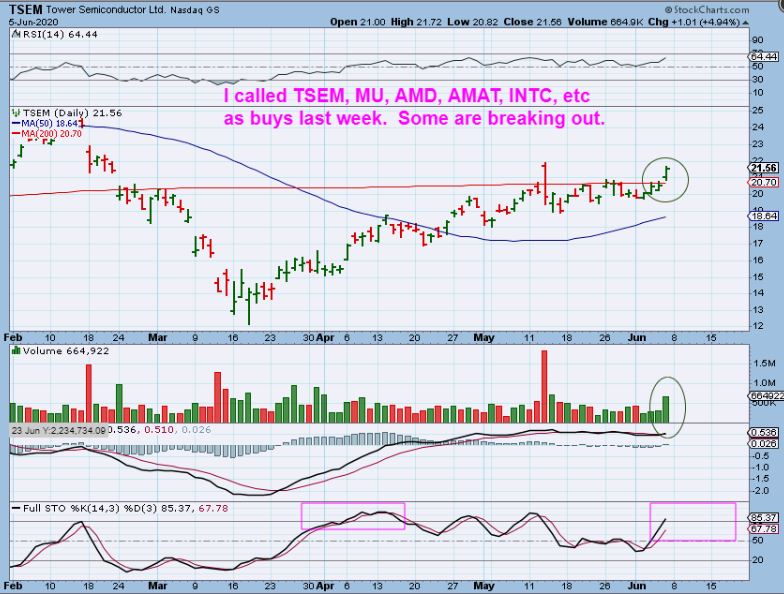
NOTE: TSEM – One of the main reasons why I think the markets will continue higher is that after some consolidation, I started seeing ‘Buy Set Ups ‘ in the semiconductor and other tech Stocks. I put those set ups in Thursday and fridays report. Friday they did break out ( these were buys and should run higher). ROCKY- You should be in a few 🙂
.
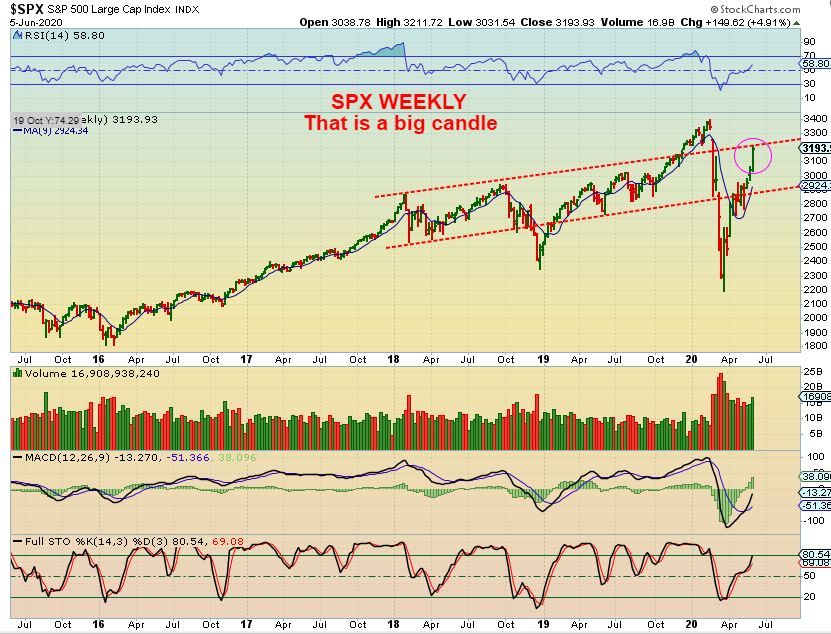
SPX WEEKLY – This is where I got my 3200 target. It puts us at the top of the long term channel. One thing that stands out is the Large Candle last week alone. Wow. I don’t see another candle even close to being that big in the normal run (except for that V-Bottom low). If we move higher next week, we move above this channel. THEN we could be setting up for a blow off top!
.
NASDAQ – We have the tech Sector back at all time highs. That was a Swift v-bottom recovery with all kinds of bad news and economic concerns popping up along the way. I do see Big Volume and I see large divergence in a big way, so we may get a false break out, but it could become a blow off top first. For now you have to view this as Bullish, even with the strong divergence.
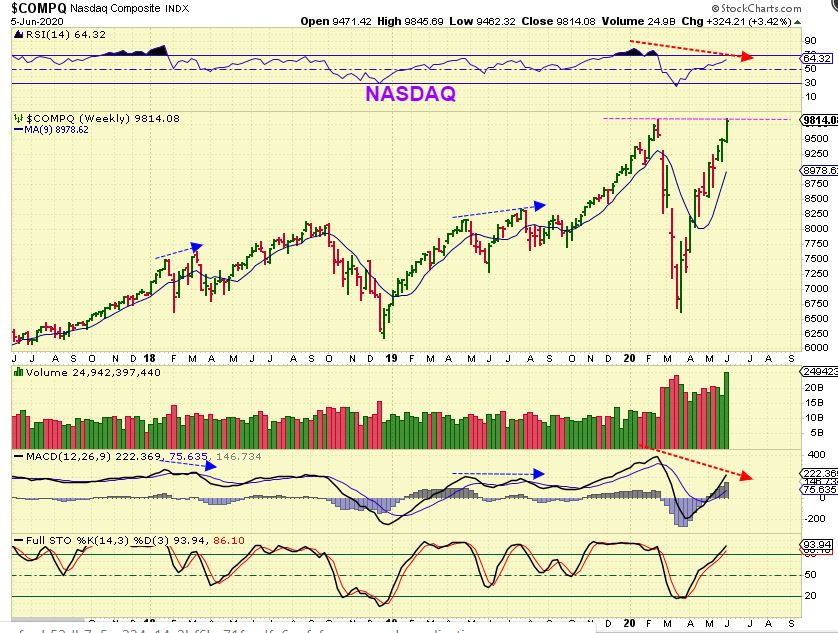
I wonder with this Big Volume and large weekly candles if we are going to see a BIG BLOW OFF TOP, and then the reality of a slower economy sets in and markets begin to drop? Time will tell, but big money is made in a blow off tops too, you just need to remember to sell before they take it all back. I will, of course, continue to keep an eye on things going forward.
.
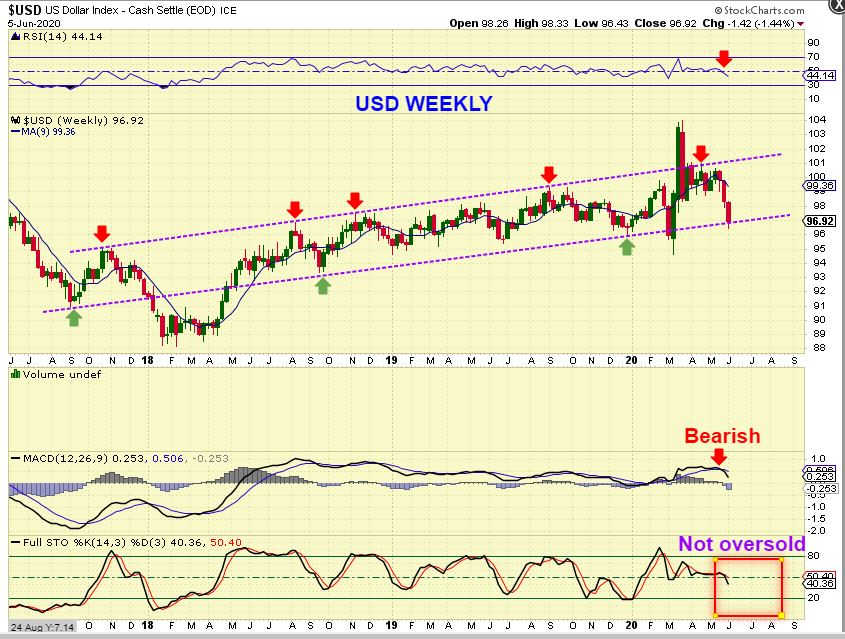
USD WEEKLY– The USD is coming due for a dcl in the daily cycle timing, but right now it is at the lows of this channel. It is looking like the USD wants to break down in this big Picture. We are At the lows, The weekly RSI broke down, The MACD is crossing down, and we aren’t close to oversold. That may help Gold.
.
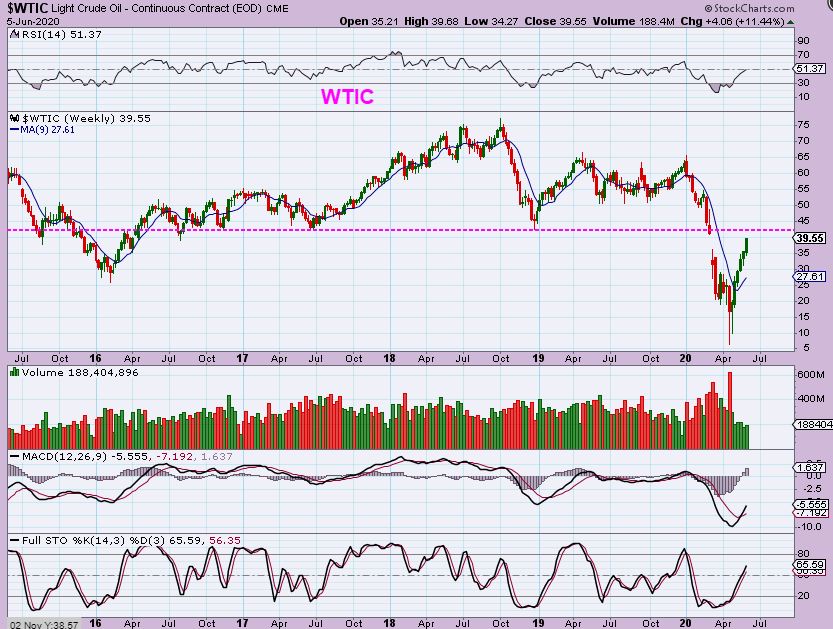
WTIC – Oil has rallied nicely out of the lows, and this was expected by us. We have successfully trades Oil / Energy stocks when they bottomed well before Oil in March. Oil is now a V-Bottom stretching toward a resistance area. It may then stall for a daily cycle low in that area in a week or two.
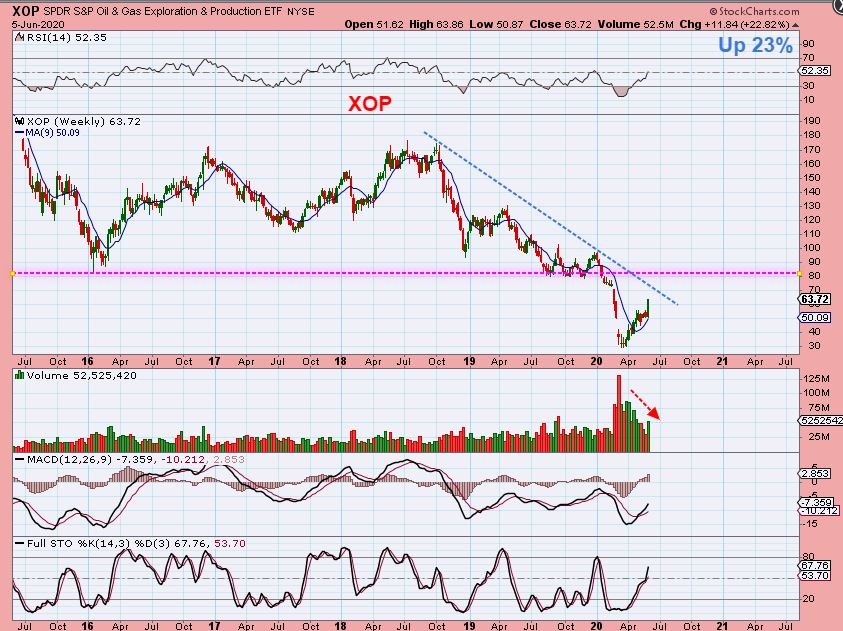
XOP WEEKLY -The Energy ETFs were rising nicely last week after a small sideways consolidation. They can quickly run in this 2nd leg right up to resistance ( or upside targets). Resistance would be 70 or 80 for the XOP. Our Oil / Energy stocks are making Big Gains, finding a few laggers may be the next best buy.
.
.
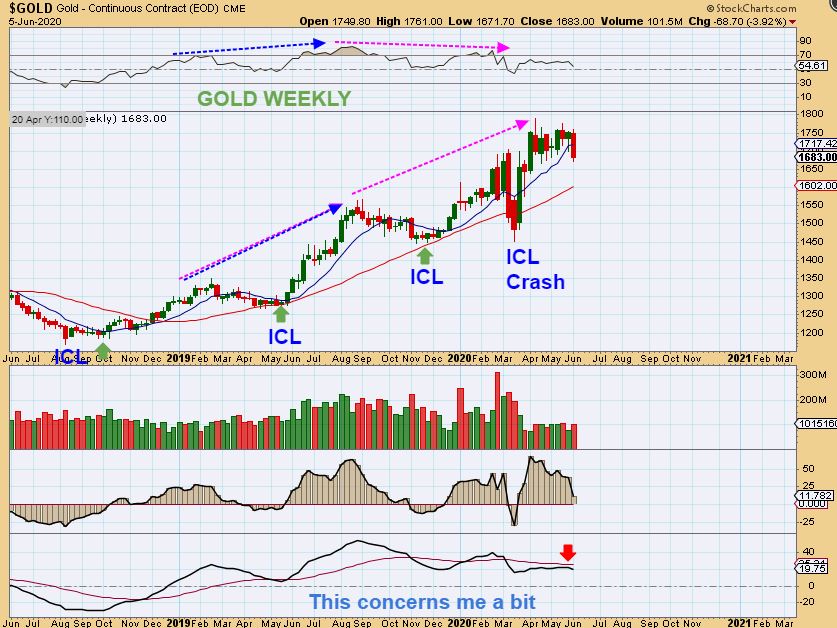
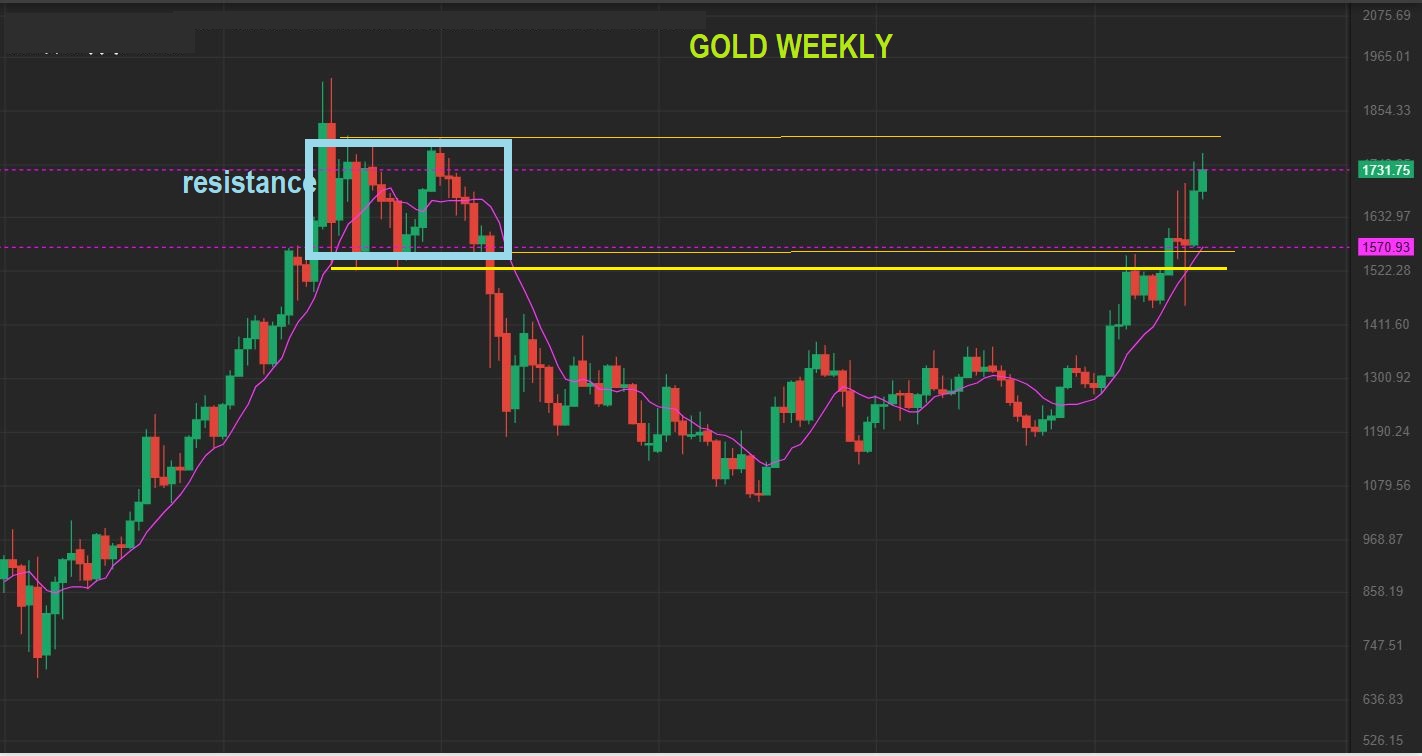
GOLD WEEKLY – I have to be honest here: I do not love the choppy sloppiness at the highs . It looked fine right up to last week, and it is still “ok”, but this week Gold lost the 10 week MA and about 75 points. It does NOT hurt the big picture, but it may call for consolidation , so…
.
GOLD WEEKLY -That call for consolidation makes sense. Last week I showed on the following WEEKLY and MONTHLY CHARTS that we have room to get to upper resistance near $1750-$1775. Price can stall in this resistance area, or break out and back test…
.
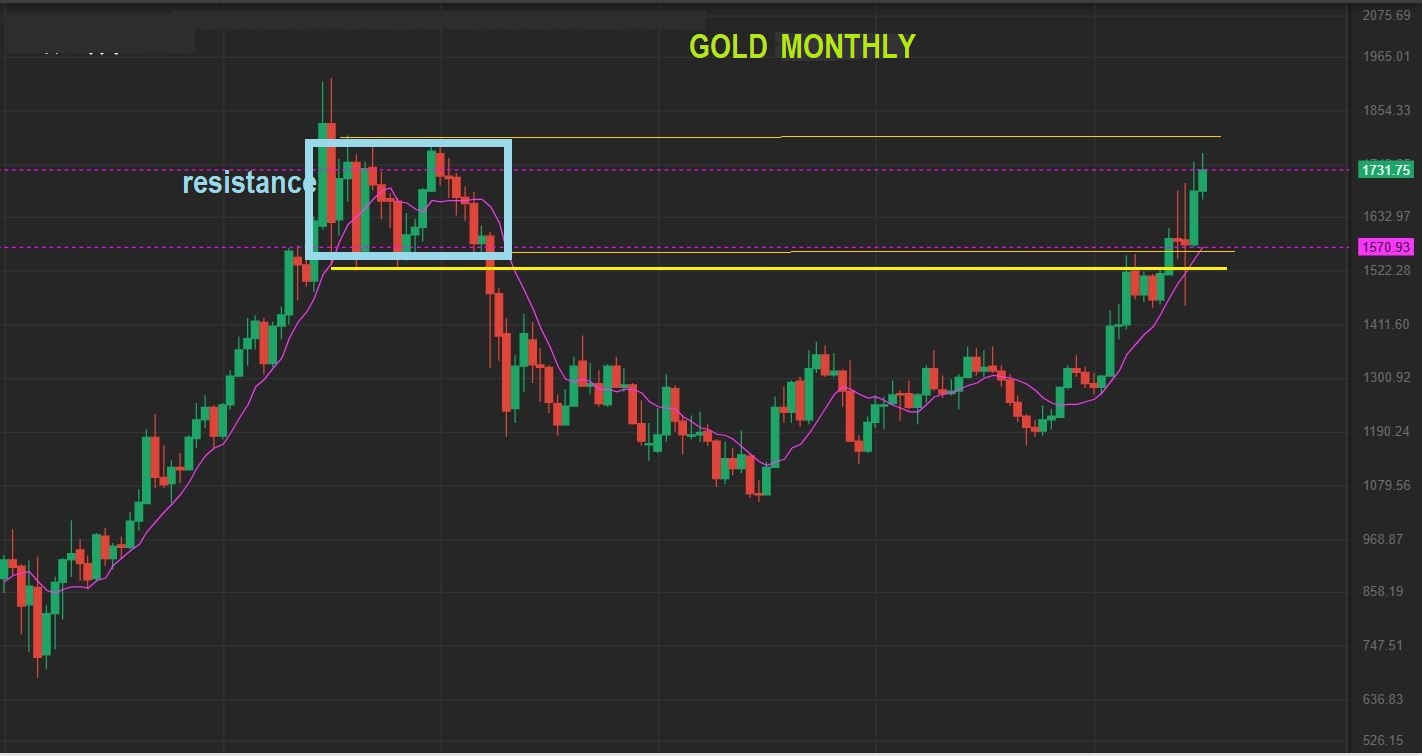
MAY MONTHLY CHART – The same view, it can rise or chop in resistance. Monthly though, it should reach those highs.
\
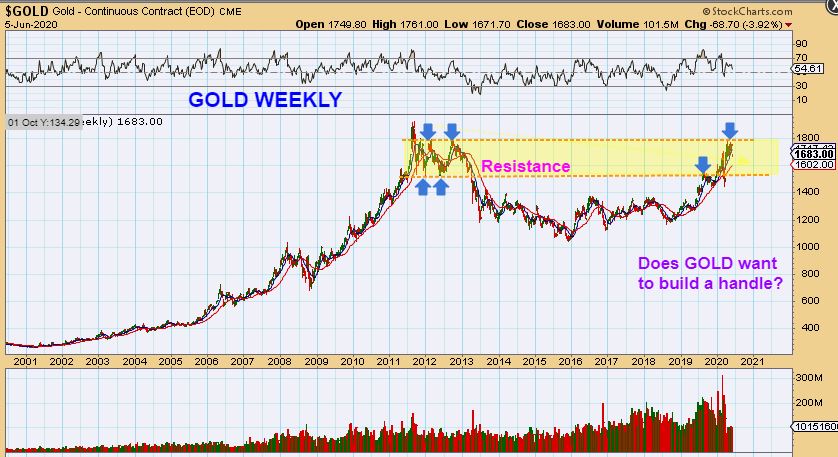
GOLD WEEKLY NOW : We are in that upper area and have dropped this week by $75. DOES THIS WANT TO CHOP FOR THE NEXT DAILY CYCLE AND BUILD A HANDLE, INSTEAD OF BREAKING OUT? Read the chart…It is possible.
.
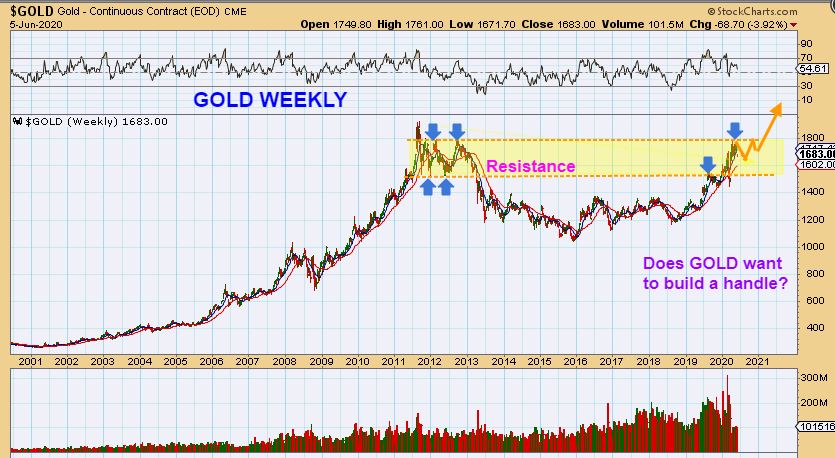
GOLD WEEKLY – That would look like what I drew here, and it would still be Very Bullish. The problem is that daily cycle 3 would include the chop and it would probably last into our next ICL if this can’t break out. IT IS STILL BULLISH. Let me just say that at this point, some individual Miners can still rally on their own.
.
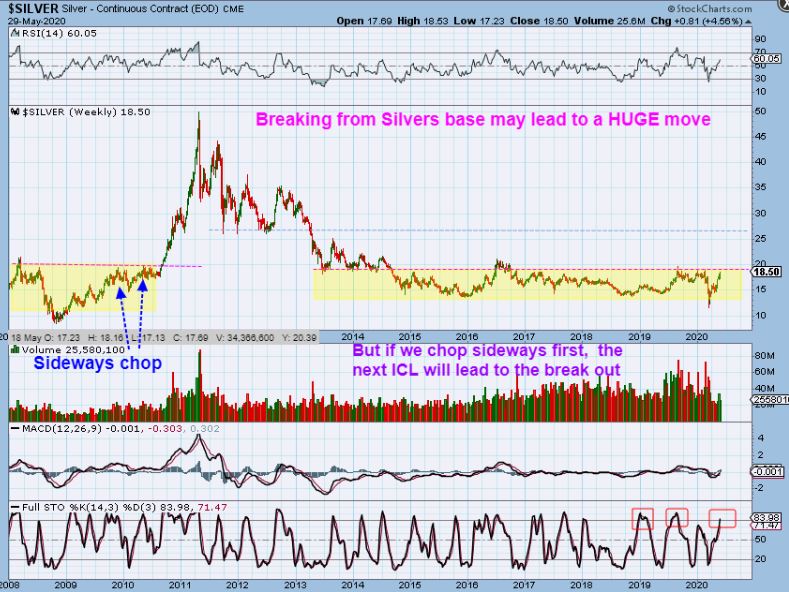
SILVER WEEKLY LAST WEEK – This would give us more upside to the trend line
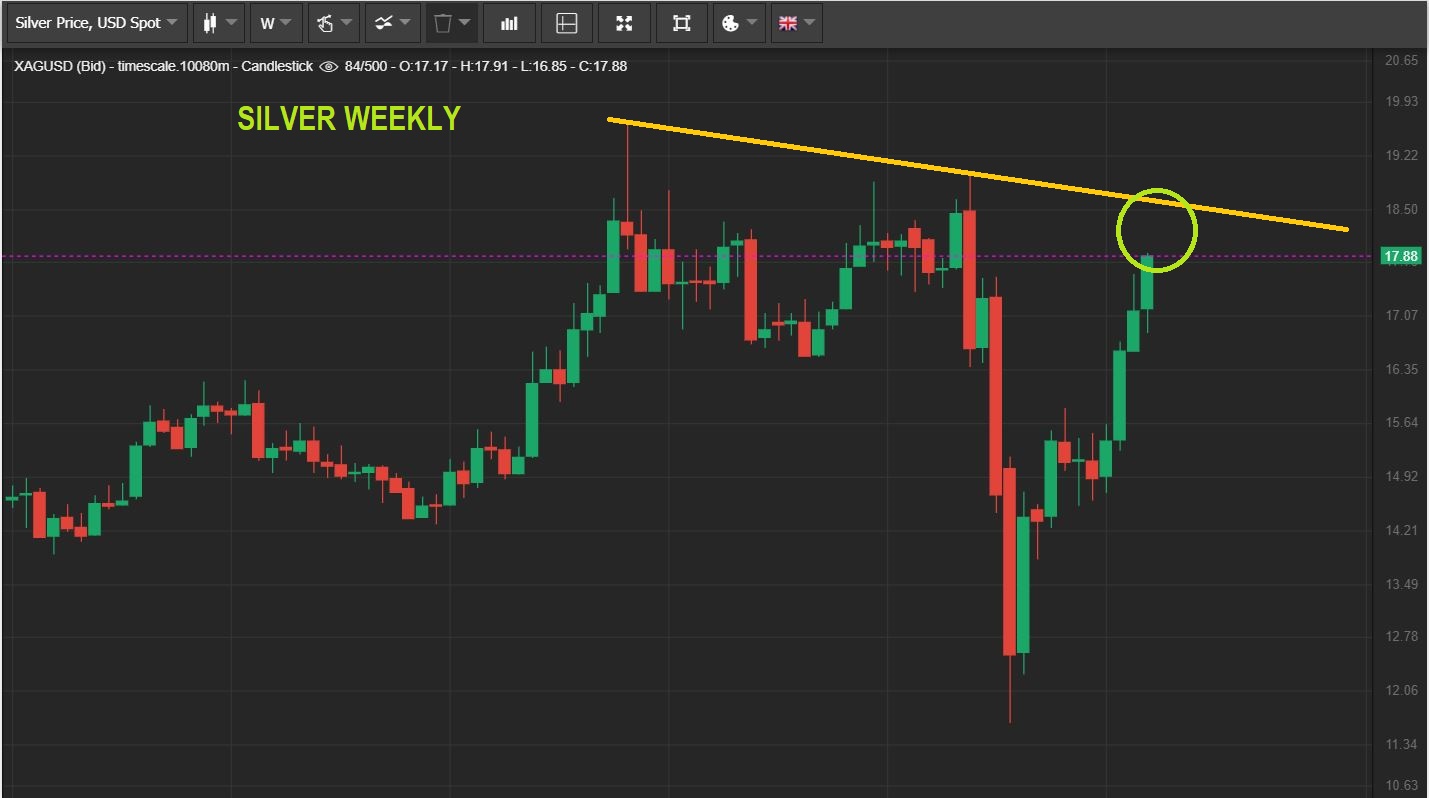
.
SILVER WEEKLY – We are at that trend line & Then Silver pulled back. Now Silver stalled.
.
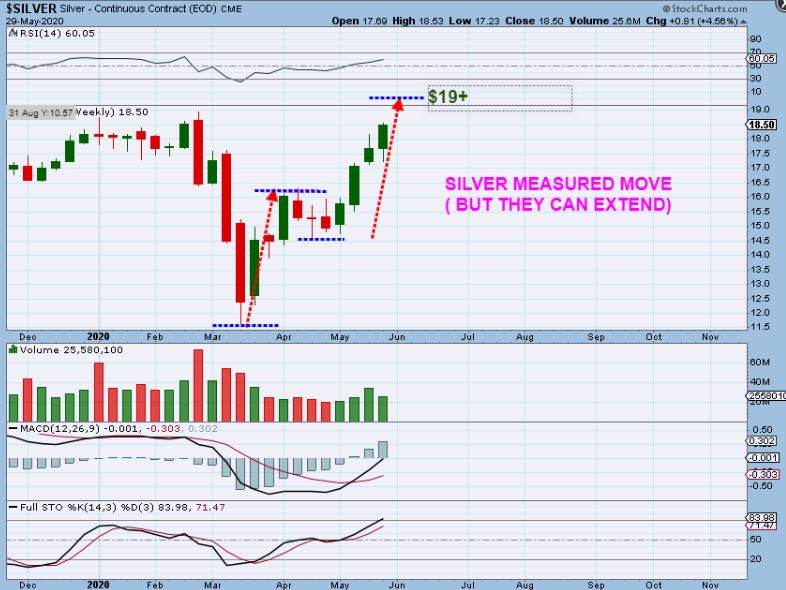
SILVER WEEKLY FROM LAST WEEKS REPORT – ON STOCKCHARTS I was looking at the $19+ area as a next price target area to complete the measured move, So I was thinking that Silver could run their last week.
.
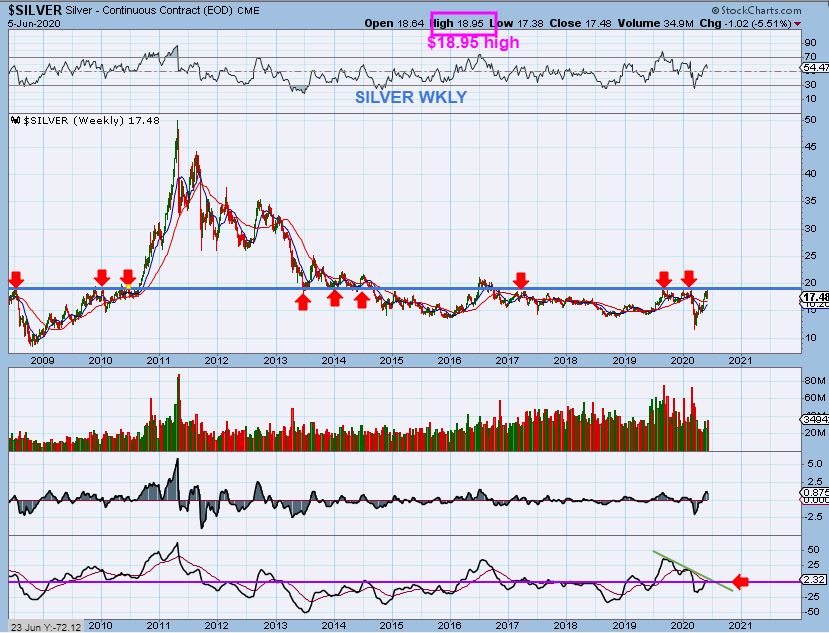
SILVER WEEKLY ( On STOCKCHARTS) – The high last week was $18.95, not quite my $19+ and then Silver turned down, closing this at week $17.48. You can see that this is the resistance area that I was pointing out last week too.
.
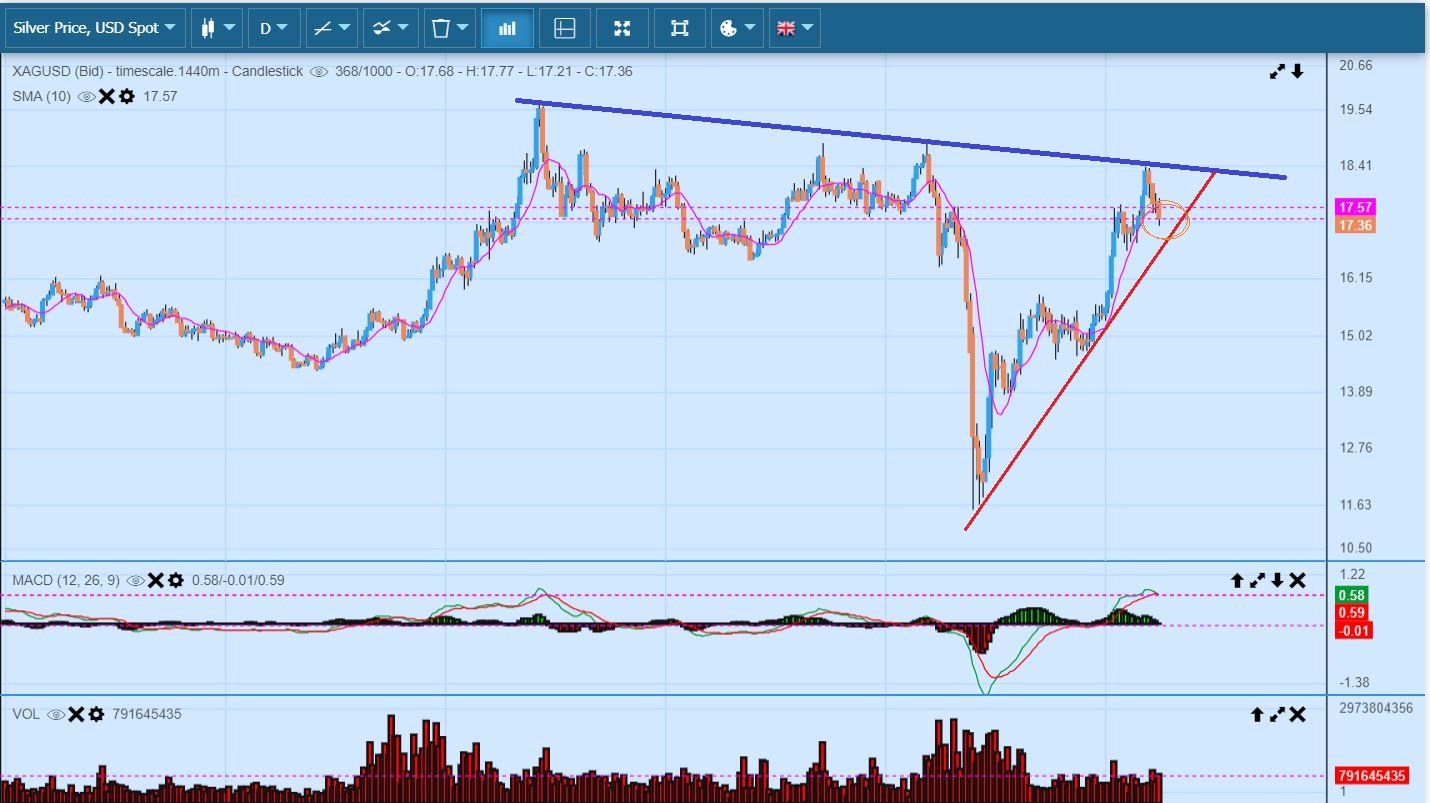
SILVER WEEKLY BIG PICTURE MAY 29 – Last week I showed this Base in Yellow and the top is resistance. We did not break out yet. If you read this chart, I mentioned that at this area in 2010 – we chopped sideways first, so we COULD chop sideways here too. Read the chart.
.
Back to this weeks chart. Yes, it could get choppy, but IF THIS BREAKS OUT, It could run like a Cheetah! So we will keep an eye on Silver and our silver stocks. Even if GOLD chops sideways and builds a handle, Silver can break & run. It is a better set up at this point.
.
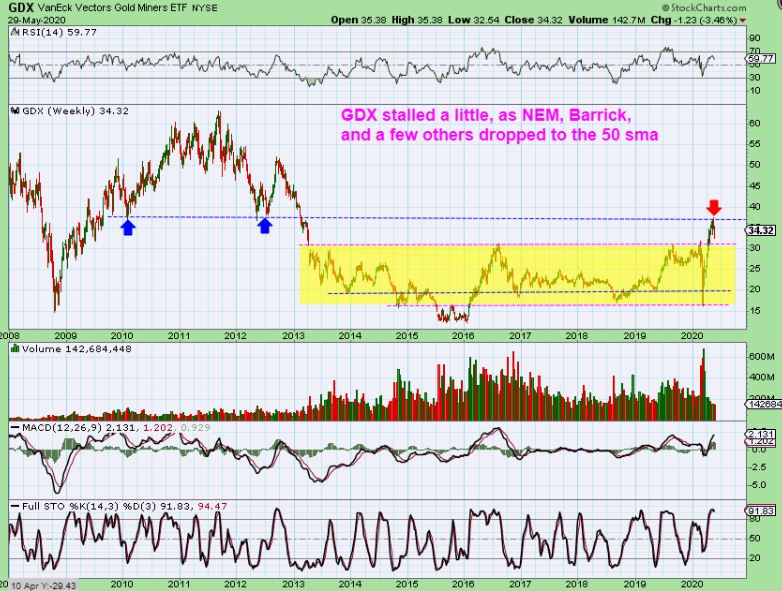
GDX WEEKLY MAY 29 – On this chart Last weekend we tagged a resistance area and started to drop. It looked like we would back test that yellow base area.
.
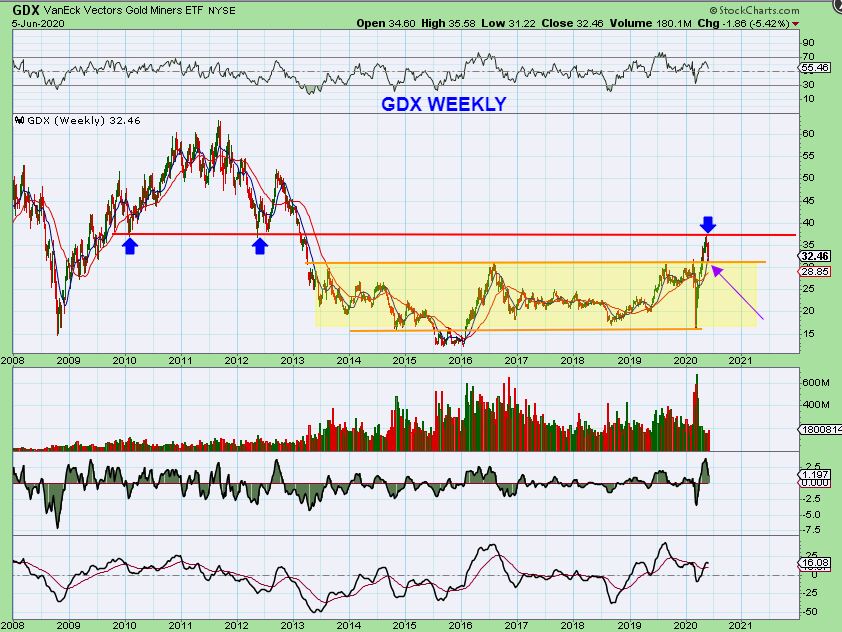
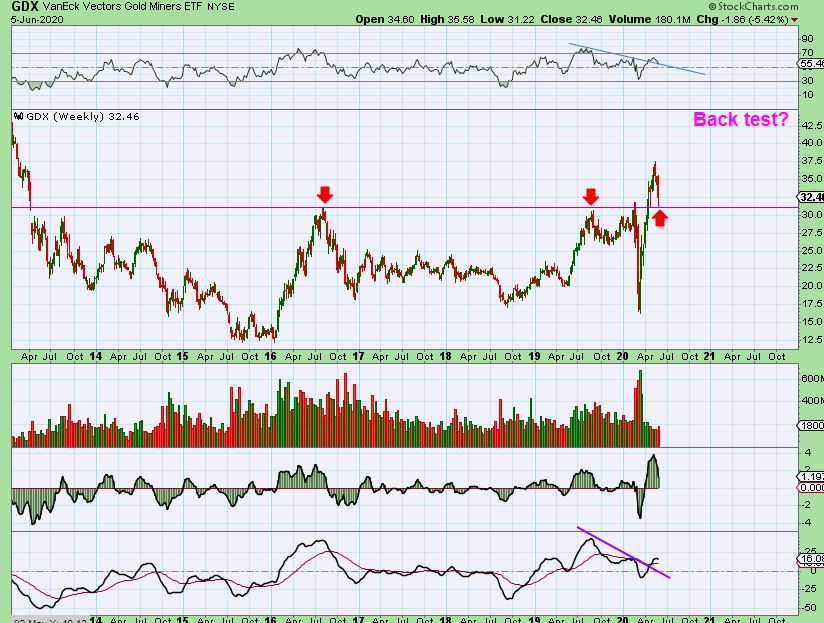
GDX WEEKLY – This past week Miners continued to drop and they did back test that yellow base area. We want to see this act as support, by having Buyers step in. Friday we did see reversals in many Miners, so buyers may be stepping in.
.
GDX WEEKLY BIG PICTURE – This is a close up of the above chart. It looks like a back test and a DCL (daily Cycle Low) may form. Then we’d see miners move higher. The chart is bullish.
.
GDXJ – I grabbed a daily chart of GDXJ to show a small reversal that took place Friday. It reversed at the 34 sma, and is in line with a reversal from the week before too. This is good, buyers stepped in. So we have now had 2 weeks of bounce – drop – bounce – drop, yet we may get 1 more week of that, because this is not oversold. Let me show you how that MIGHT look too …
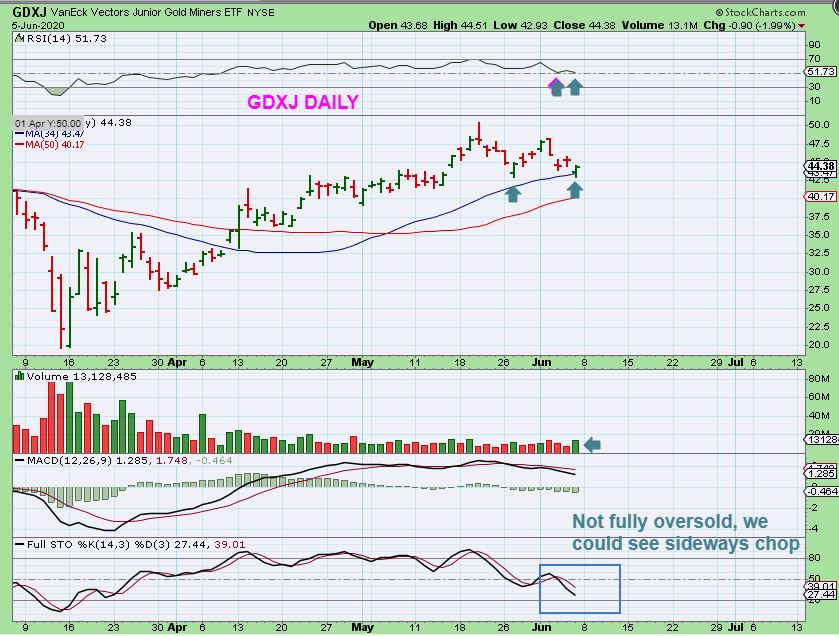
.
GDXJ – Another week of sideways chop may look like this step by step :
1. That bounce would get the GDXJ PRICE over to the 50sma,
2. The stochastics becomes oversold on another bounce and
3. The bounce also MACD back to the zero line.
.
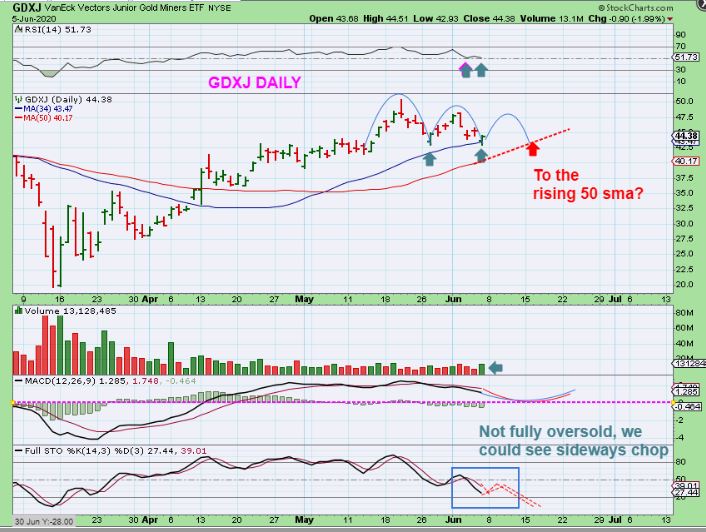
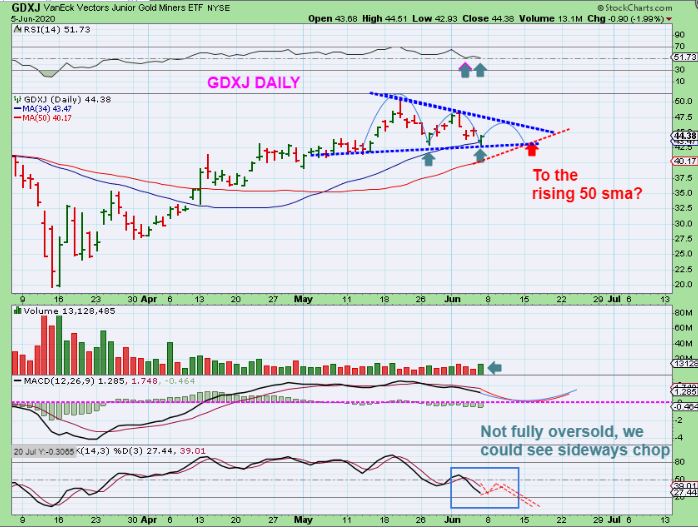
GDXJ – And that leads to a normal Pattern found in trading consolidations, right over to the 50 sma.
.
We saw the General Markets chopping sideways from April through May, but have started to break higher and even the Tech Stocks that we have been following look ready for another leg higher. All of this despite the closing of business, Corona virus stay at home orders, Government bail outs, etc? Well, it doesn’t always seem to make a lot of sense, but we follow the markets lead and try to profit. STEP – BY – STEP , it is possible that The General Markets MIGHT be setting up for a blow off top. Interesting.
Oil has continued the V-Bottom recovery, and we expected a nice run out of that ICL. Oil and Energy stocks ( XOP, XLE, OIH) are doing well.
Precious Metals. Gold was looking ready to break to new all time highs, Silver is bullishly set up, and Miners were on fire. Now we are back into a little choppy, consolidation phase near the highs, and yes, that can be frustrating day to day. Fridays close did bring us some reversals in several Miners, but does it leads to a break out or a bounce? That remains to be seen, but GDX looks like it’ll bounce.
This is an example of what we saw at the close, and remember, some individual Miners will surprise to the upside despite the choppiness that may come.
.
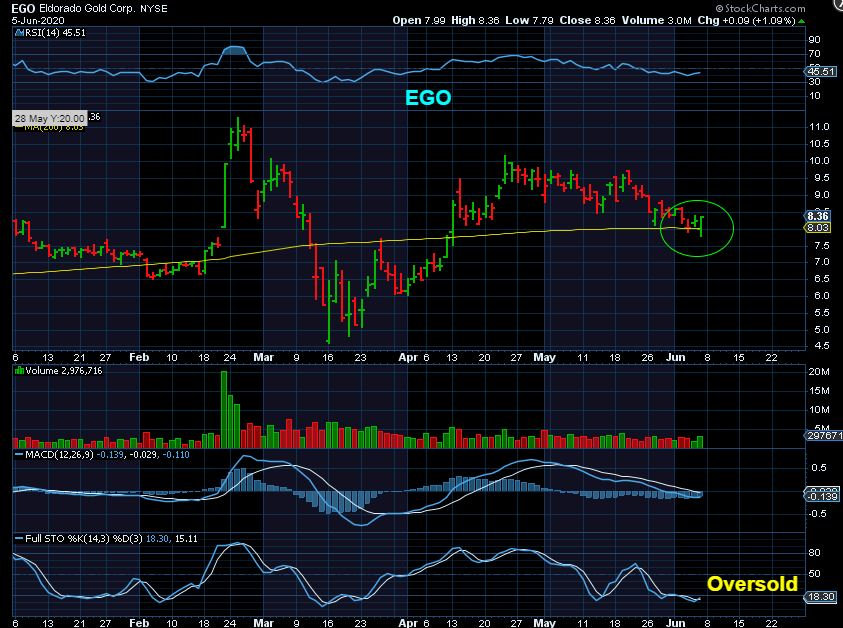
EGO regained the 200sma on a big Gold down day . Gold was down $30, EGO reversed.
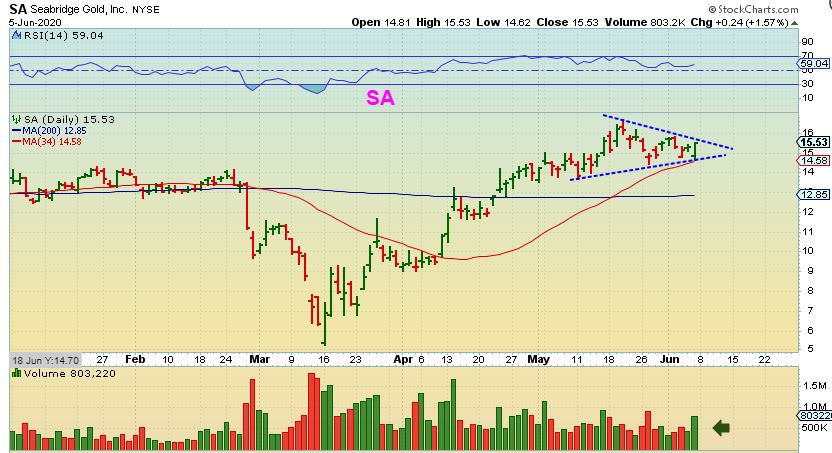
m
SA reversed right at the 34 sma and could be forming a bullish triangle on support. This actually looks very good, and again, GOLD was down $30 Friday .
.
That is your weekend in review, next week should be very interesting for all sectors. Below I am going to throw in a bit more ( by request) , Enjoy your weekend and stay safe!
.
~ALEX
.
As a trader, I enjoy trading good bullish set ups when one of my favorite sectors starts to get choppy and looks like it may pull back ( Miners). I do this for a living day by day, but I don’t always post those trades, because I am in front of the screens all day and I can trade quicker than most. That said: I do at times, post a few set ups that I really like, if they look rather safe and profitable, without the need to stay right with them. We have seen that in Energy recently where I was calling out APA, OAS, OKE, CLB, MRO, PVAC, DNR, etc etc . We have been trading these since March! I want to review those trades now , because with good gains coming in, I am getting a lot of questions about “When do I sell?”
.
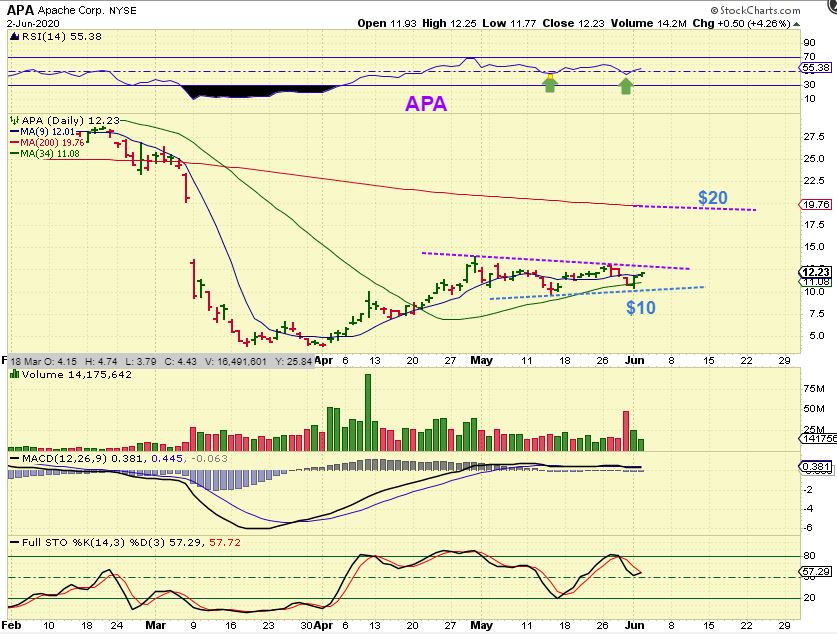
I LOVE the set ups in APA, OKE, MRO, CLB, etc , because for those not in front of the screen all day, they are still solid set ups. You can buy them with a stop. For example; APA
.
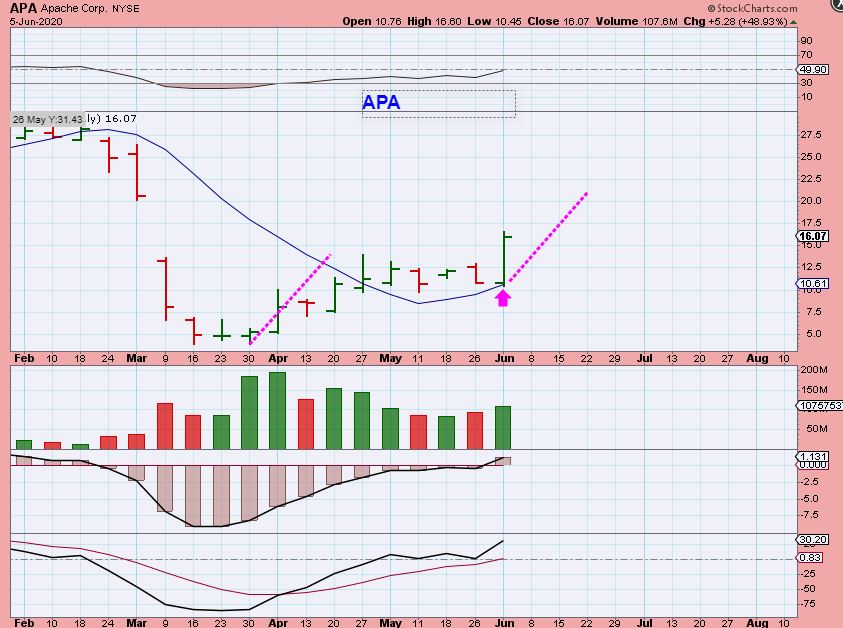
APA – This is Bullish and was in my reports. It was rather orderly consolidation above the 34 sma , triangle forming, price into the apex was great. We already bought it in March and made good gains, it looked ready for leg up #2. I posted it in a few reports last week actually with OKE, MRO, OAS, CPE, HLX, etc etc . This was a possible $10 to $20.
,
APA – Boom, it popped 23% Friday alone. “Where do I sell?” Honestly, this can run to fill the gap. This can drop & back test the break out and then run. This can run (over time) to the recent Feb highs of $30 ( another 100%). So for me, I often sell a little of a Big Pop on the way up to lock in gains, but I then let it run. I don’t like to tell people where to sell, we all need to learn where to sell. So consider this …
Are 23 % gains enough for you? If so, Sell this pop.
Maybe sell 20% and ride it to the gap fill?
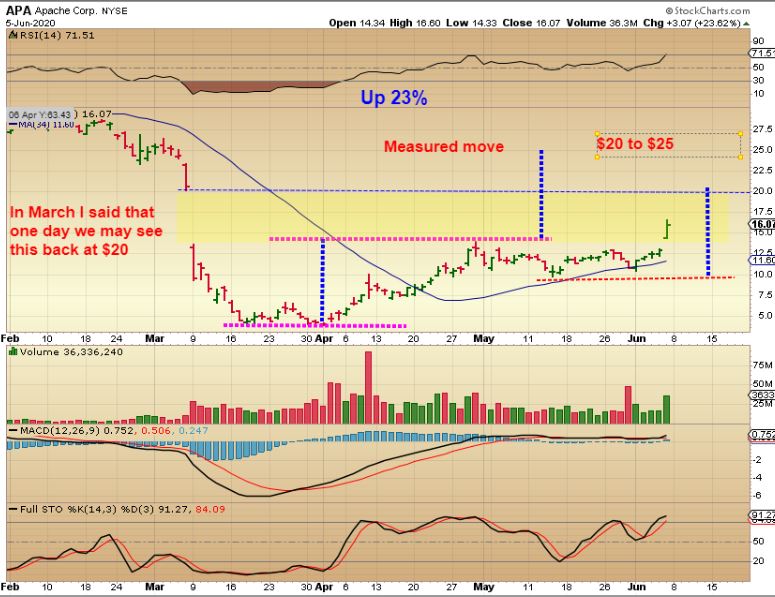
Maybe just let it run with a raised stop , and see if it gets to $30, since it is a solid break out. A measured move is…
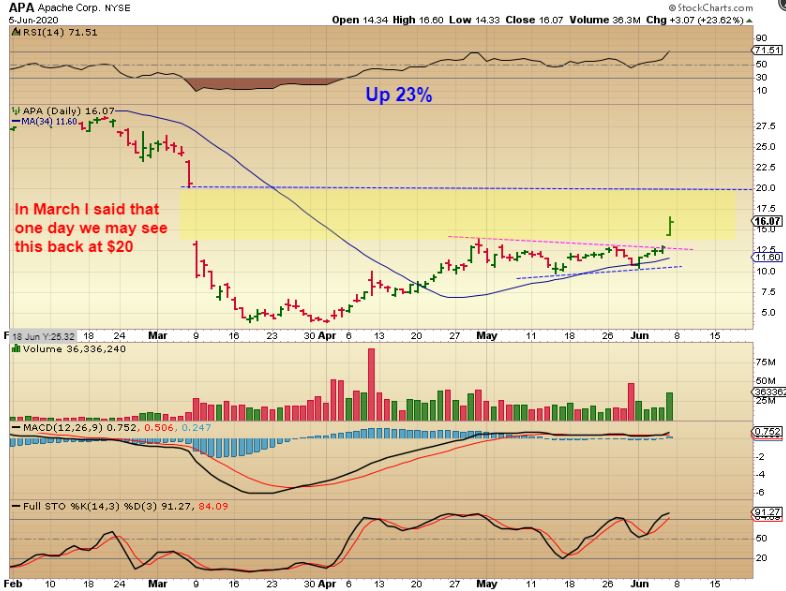
A measured move is $20 conservative, $25 also a normal target, but it CAN even run higher. If I tell you to ” Sell the 23% POP to $16 Friday, and don’t be greedy” , and it then runs to $30, are you happy with me ? 🙂 Sell when you are happy, use a stop along the way so you don’t give it back. Maybe sell a portion as it rises every $5. That is a plan.
.
APA WEEKLY – That was a great 48% Pop in a $10 stock this week alone, congrats if you got it. NOW you must manage it to keep the gains, but maybe even get more.
Sell it all?
Let it ride with a stop?
Sell some & let some ride.? 🙂
.
OK, that was easy 🙂 Now Let’s get right into the amazing stuff.
.
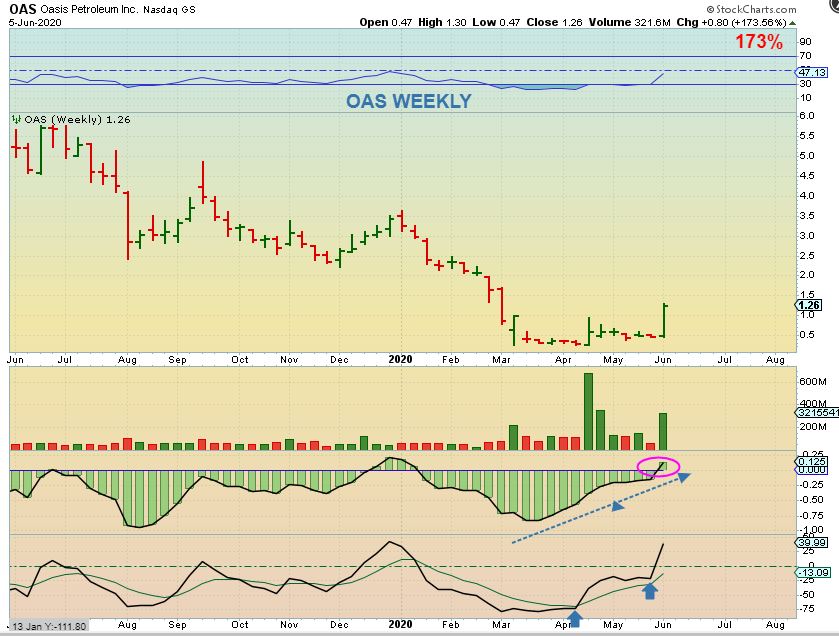
OAS – If you have been here for a while, you know I love flat tight bases like OAS had in March and again in May. Last week I said that I liked this flat base, riding the 50sma, and I bought it. I bought it & you can Buy it with a stop under the 50sma somewhere. SO…
OAS WKLY- IT POPPED Up 100% FRDAY, 173% for the week!! “Where do I sell?” Yes, I know, I am wondering the same thing. I have seen bases like this POP & RUN, or Pop & Drop & chop & Pop & Chop , etc . Well, I usually sell ‘something’- maybe 20% if my position is fairly big. I like to then let some run for a while. That said…. I am just going to discuss this quickly. Let me show you something about these POPS .
,
GNUS DAILY – We saw GNUS run from 30 cents to $1.00 (similar to OAS?) in May, It then dropped & chopped for 4 days and then ran again, to $2.00 That is HUGE gains. Then you ask me, “Should I sell?” and I say 30 cents to $2? Sure. Then it went sideways for weeks and RAN TO $12? This just happened over the past month. So I always say that with these moves you have choices, and I DO NOT KNOW how it will play out for sure.
1. Sell it all and take your 100% gains?
2. Sell 25% and let it ride for a while?
3. Sell 50% and let it ride?
ALSO … 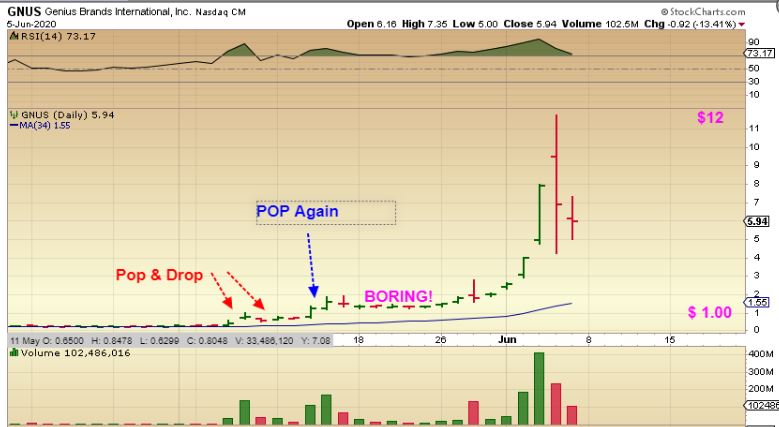
I can definitely tell you if the chart looks ok along the way, THAT is what I did with OAS. The chart was chopping sideways and still looked Bullish, if you owned from the first pop, you could now add even lower. Next…
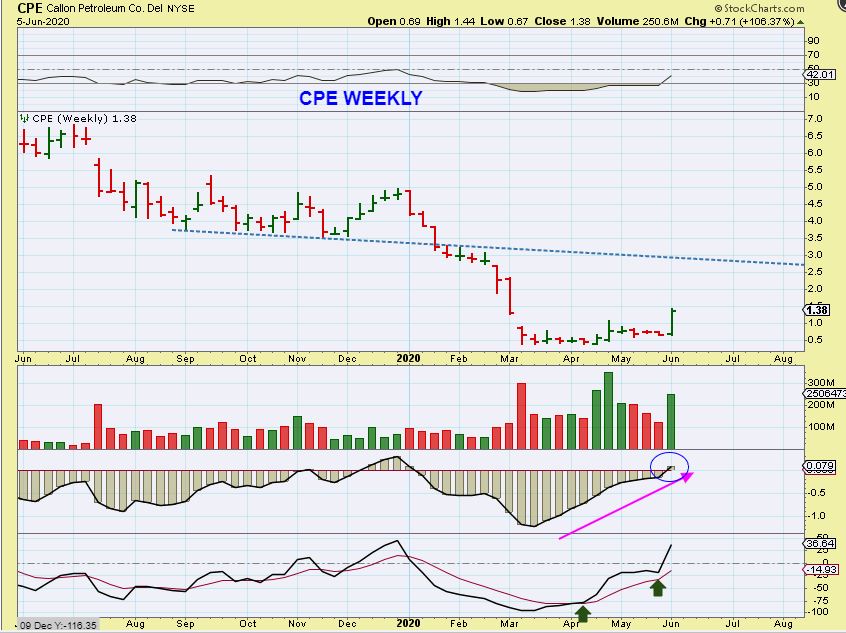
CPE -I also said that I liked this long flat base and I bought CPE. Others did too. This was acting exactly like OAS ( And APA, MRO, PVAC (in early May) etc. *** Notice that this was also a POP in April, and more chop…
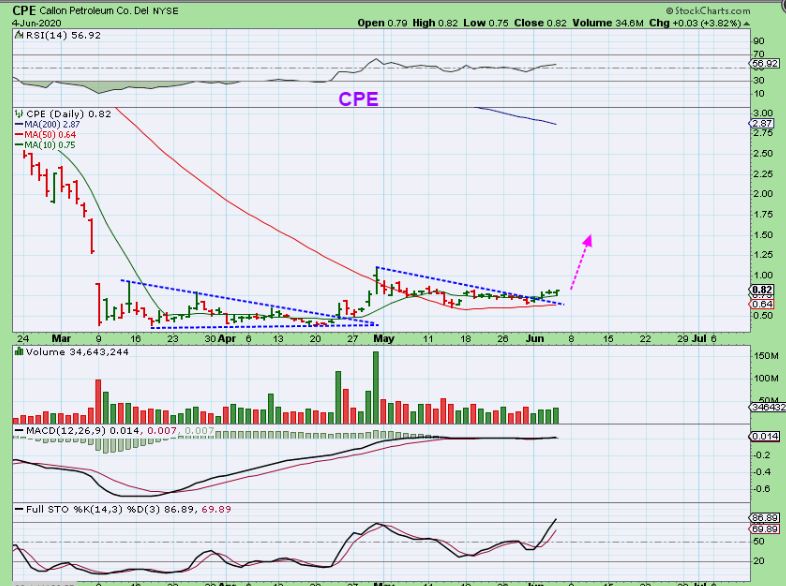
CPE WEEKLY – so there is the POP and Chop and now Friday a Big Pop, giving us 100% gains for the week. “Where do I sell?” Well, I think it can run higher. It might chop after this pop first, or it may just run straight up, so
1. Maybe let it ride?
2. Take 20% off and let it go?
3. See if it runs higher and trail a stop?
Those are all valid ways to ride this bullish set up, just don’t give it back. This could run to $2.50 to $3.00 and that would be a run from our recent buy near 80 cents to $3.
,
.
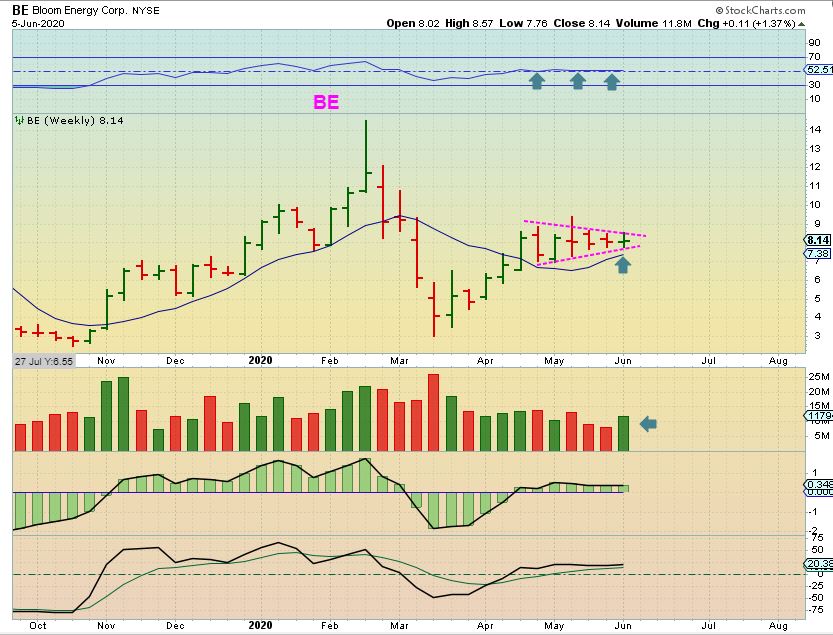
MRO & BE were laggers – MRO then popped 37% last week, BE did not (yet). THIS IS BE RIGHT NOW AS A LAGGER, and this is another bullish set up. It is a buy with a stop under $7. THAT is a big risk, but the reward is a run to $14, almost 100%.
,
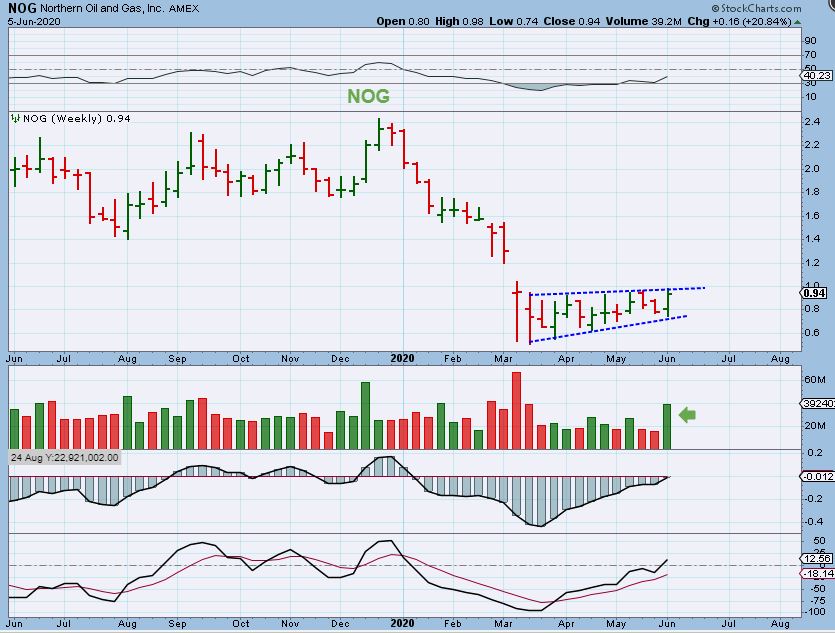
NOG – I scalped 20% of my CPE gains and 20% of my OAS gains Friday and entered those gains NOG, which I think is a lagger too. I also added to that position with additional funds from my VISL trade earlier in the week. This is also a nice base setting up. That volume may be saying that it is ready to go. It is a $0.90 cent stock.
,
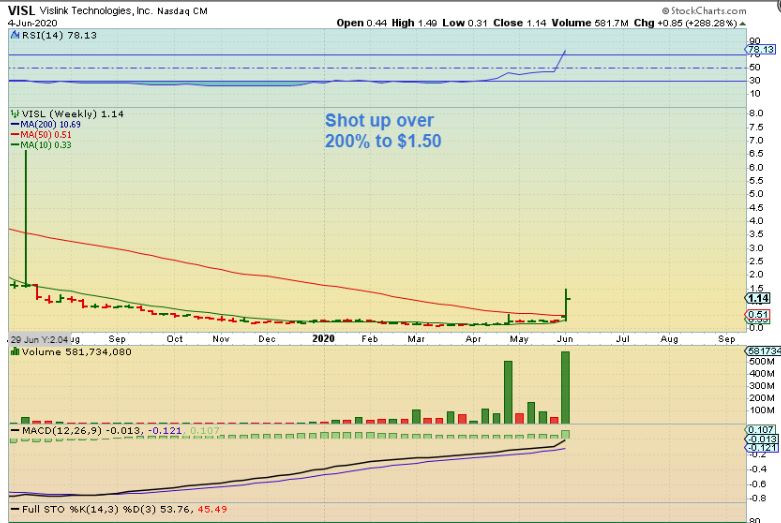
REMINDER ABOUT LONG BASES – I WROTE ABOUT ABOUT VISL THIS WEEK, A QUIK TRADE IDEA, and then it popped too. I said in part… There is something going on here and I have often seen long bases like this just POP and run strongly. This is an exceptionally strong looking set up.
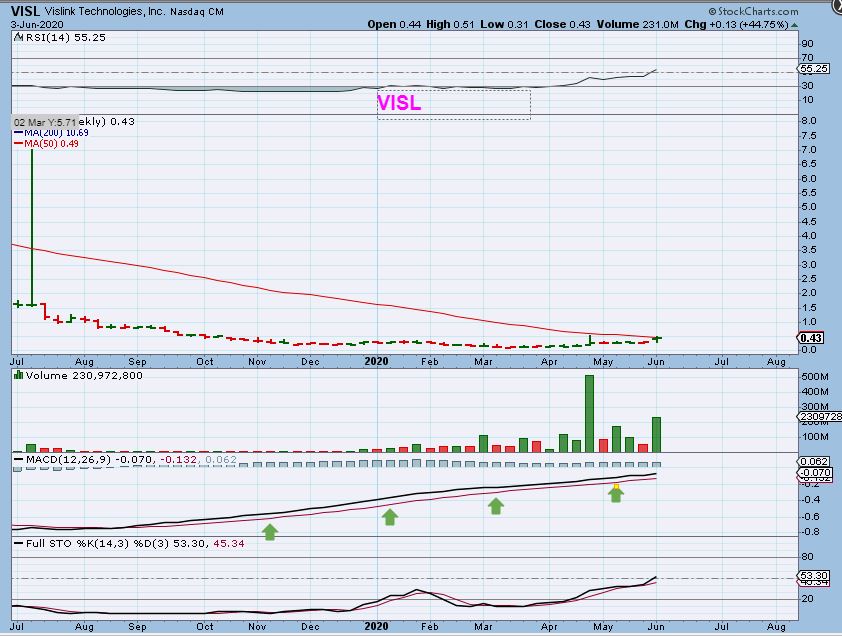
VISL popped over 200%. I caught that one just on time. EDIT: Can it keep going? Yes, but it may be choppy for a while, I’m actually out. I bought NOG with some of the gains, and gains from OAS & CPE.
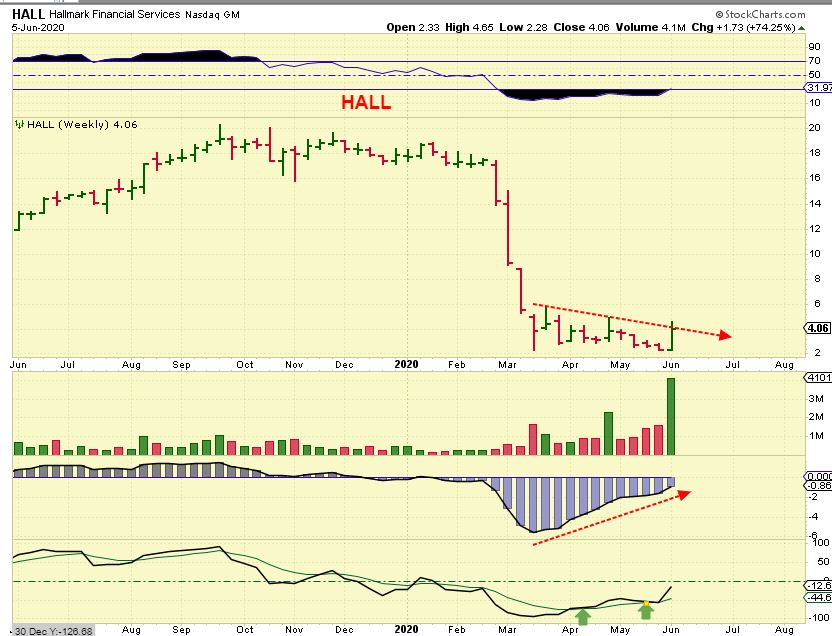
SO THEN I MENTIONED THIS THURSDAY : HALL is another that I entered ‘AS A TRADER’. These can chop sideways for weeks, so I don’t always recommend them here, but while I wait for Miners to run again, I do some side trading. If you have been here for a while, you know how much I love LONG TIGHT BASES with increasing volume on the Pops.
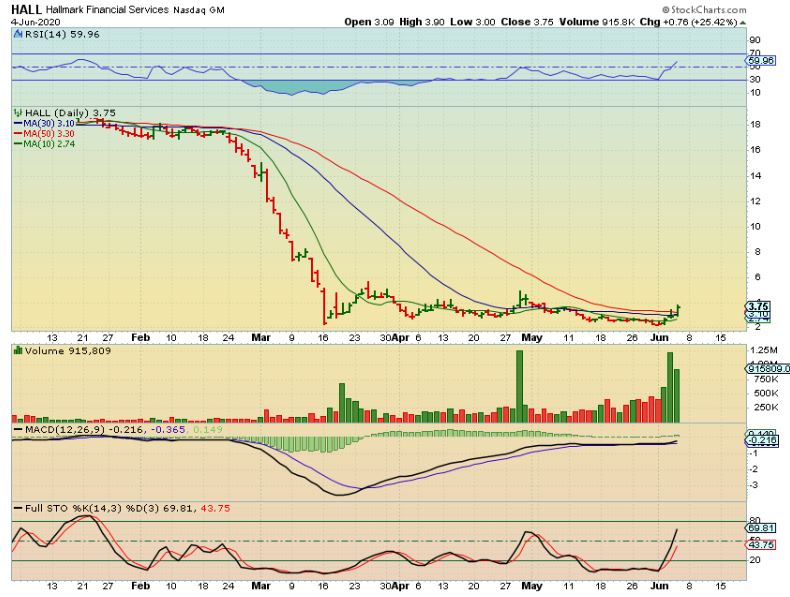
HALL may or may not be ready to go, but if it gets over this line, it might have a nice run. ALONG WITH THAT THEME ON BASES & VOLUME, GUESS WHAT?
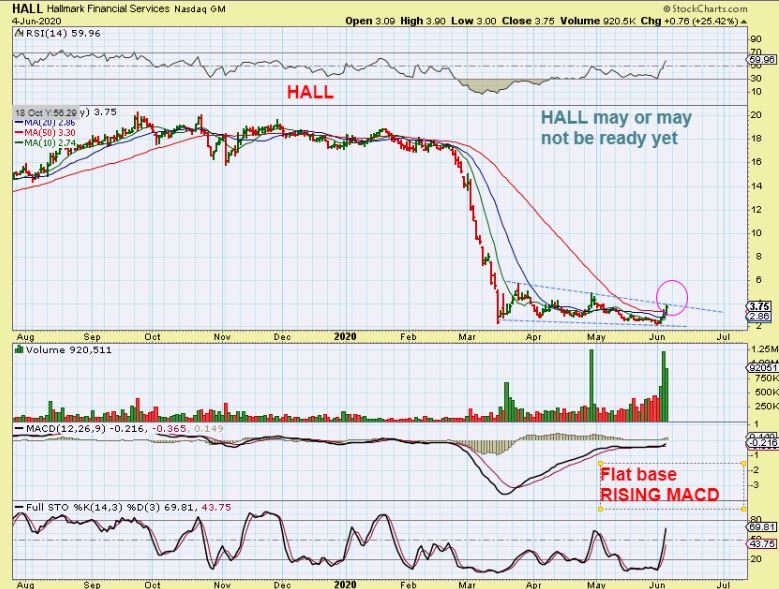
HALL is now above $4, it was up 75% for the week, but you see how these trade. It can POP & run, or get choppy again.
,
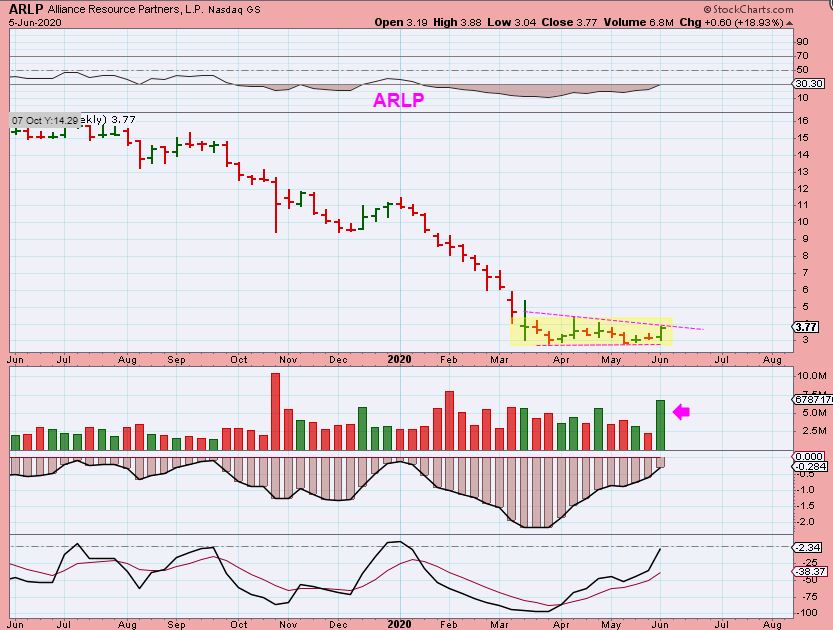
ARLP – THOMAS Y. mentioned this and asked me to look at it in the Chat area early Friday, so I looked it up and told him that I LIKED IT. I then bought it as a trade and it suddenly started to run. I actually think that this may be just starting to go, so I bought it at the open and added midday. THAT IS ALSO A NICE BASE. Thanks Thomas Y. Great volume for the week.
.
LESSON: LETS TALK ABOUT THESE BIG BASES
.
Many of us have been trading these energy stocks and they have Doubled, Tripled, and Quadrupled, but IS IT REALLY THAT EASY? Not really, but IT MIGHT BE EASIER IF YOU KNOW WHAT TO EXPECT. That is what I want to help you with here.
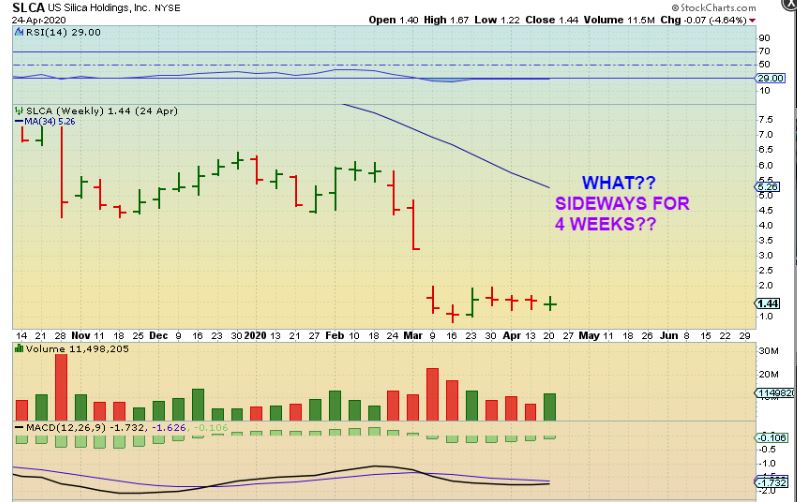
SLCA 1 MARCH 27– We had our first POP in this sector. We caught some of these right off of the lows. DO WE SELL? RIDE THEM? It was hard to know.
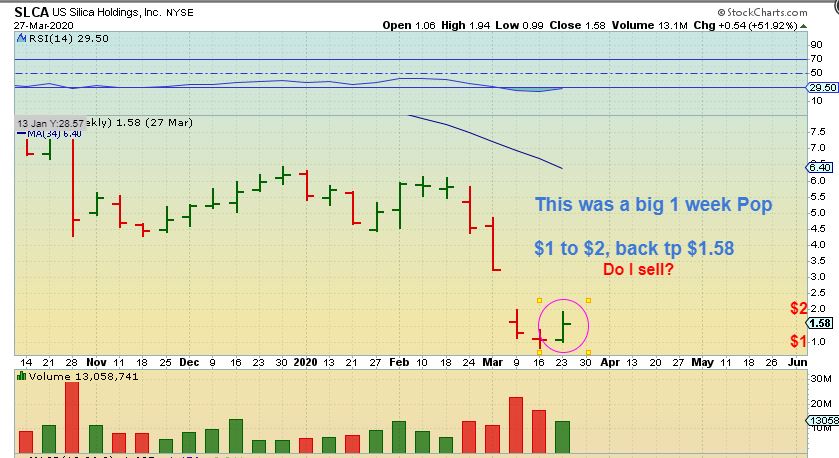
SLCA 2– It went sideways , so after a good pop, these can chop.
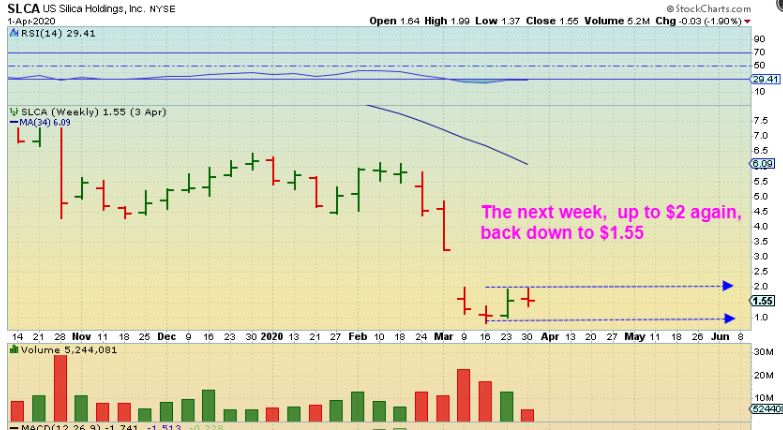
SLCA 3– Oh no. Look how boring this got. After the big pop, it chopped all over the place. People would be saying” I wish I sold that pop ! THIS IS BORING, 4 weeks sideways! ” (I’m thinking, “look at that base with a volume popping . Hmmmm”)
SLCA 4– Whoa, up 62% the next week! A POP after the POP & CHOP.
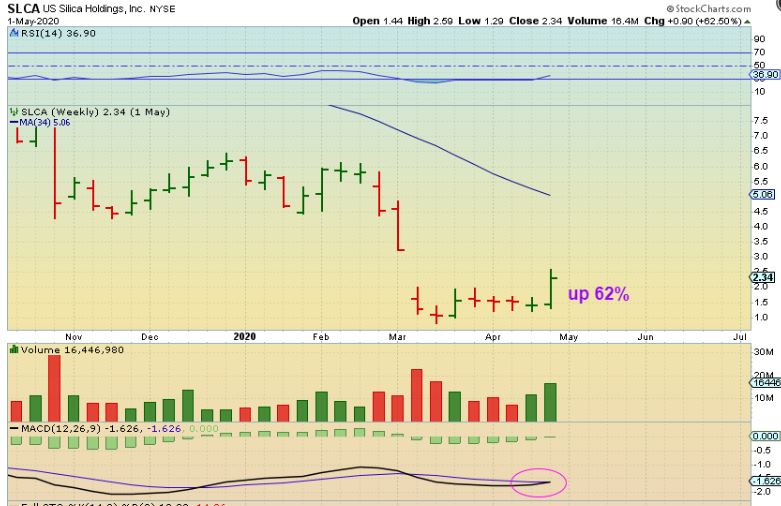
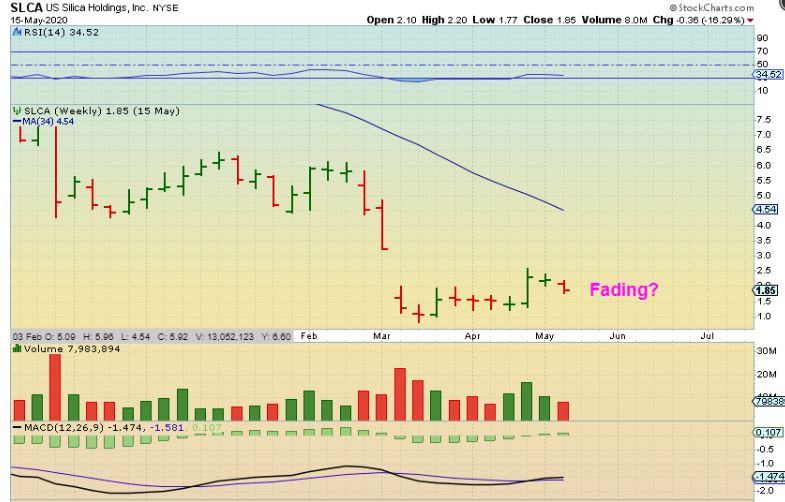
SLCA 5– Oh no, More chop? This stinks! BORING! I should have sold that…
SLCA 6 – Boom Boom Boom, this was one of our energy stocks and it overall from $1 to $4. That was all in Mid-March to early June. Not bad for 2.5 months , but you have to admit, that was NOT an easy ride. That chop would have me second guessing myself for holding too. That is why I try to take some off of the top, and let some ride. That said…
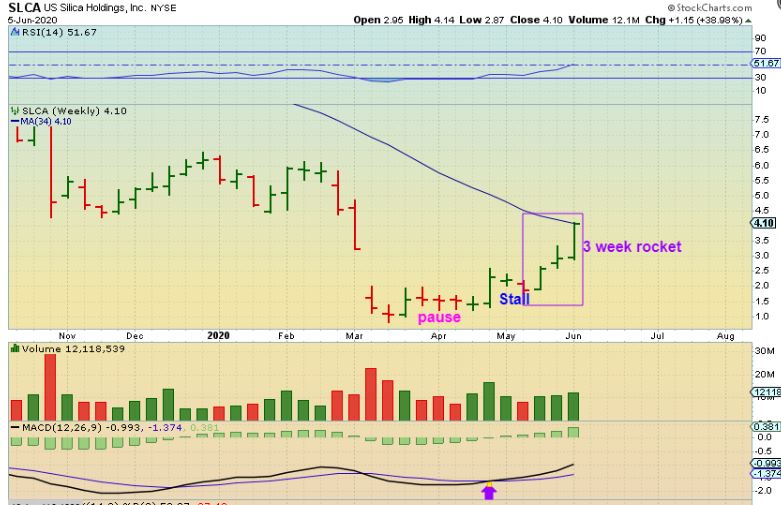
SLCA 7 – We might be right here (where the blue arrow is) in OAS, CPE, and a few others. That was the second Big Pop out of the lows…
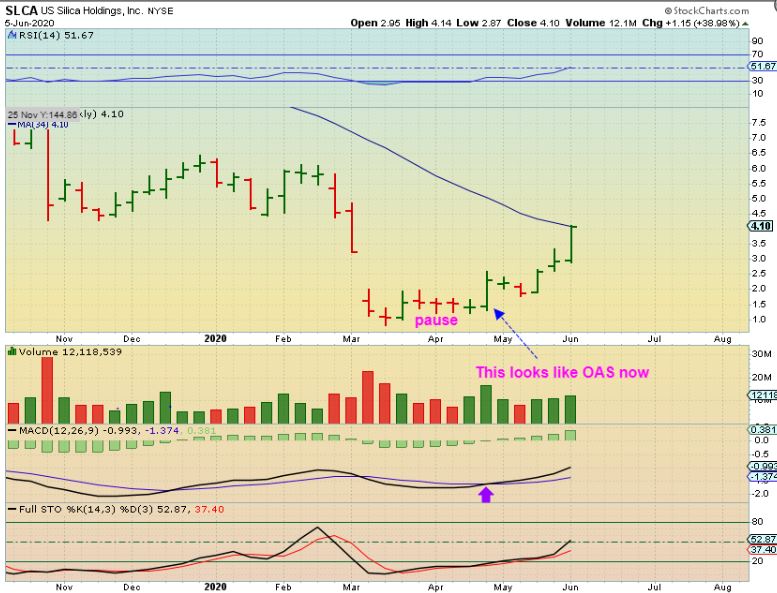
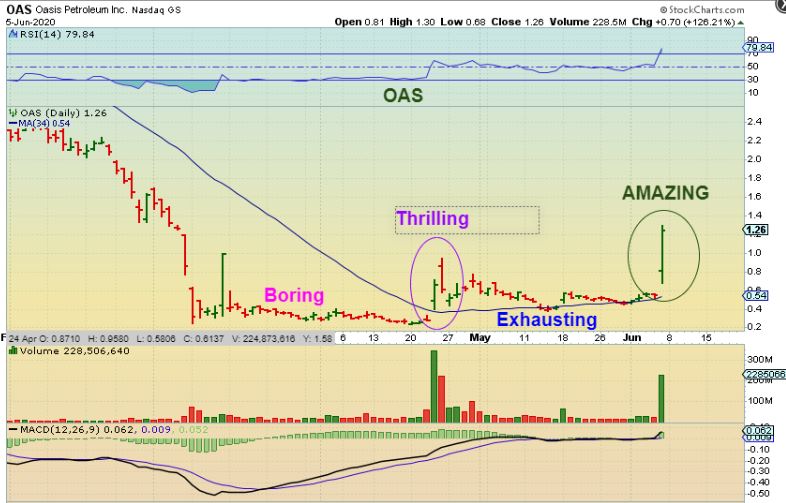
OAS COMPARED TO SLCA ABOVE – OAS and the 2nd big pop out of the lows. So…
.
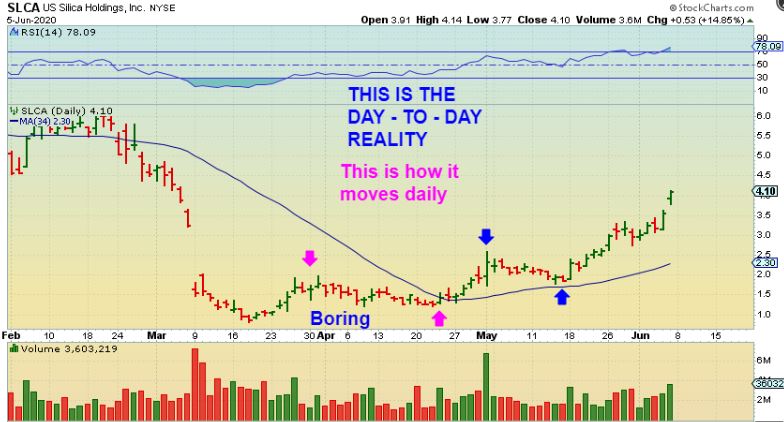
SLCA 8 – DAY TO DAY, it can be boring, choppy , and tough to hold. Even SLCA was very choppy and boring.
.
OAS DAILY – OAS was very choppy and boring.
THIS LESSON IS HERE FOR A REASON. STUDY THOSE CHARTS AND WHAT I SAID. BUY SELL HOLD? Should you sell or hold? That is up to you, I hope this ‘lesson’ was helpful for you in your selling decision making. 🙂

