Tuesday June 30th
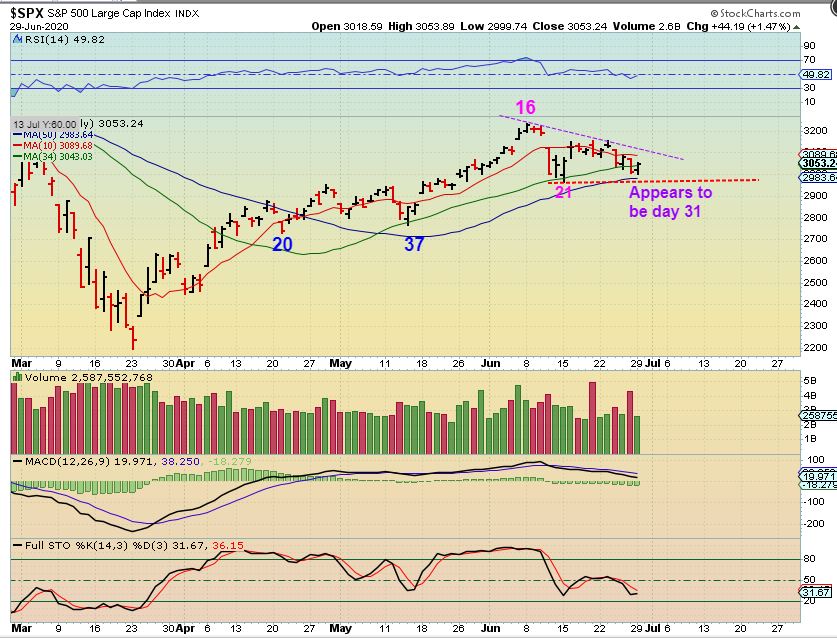
SPX – Even though this looks like a bullish reversal, we still may have a little more chop & drop.
For example: Take a look at the last 4 days of trading.
– Wednesday was a drop to the 34 sma (green line),
– Thursday was a reversal higher off of it,
– Friday was another drop, this time through the 34sma,
– Monday was a reversal higher – each day made a lower low, but it is not a selling frenzy.
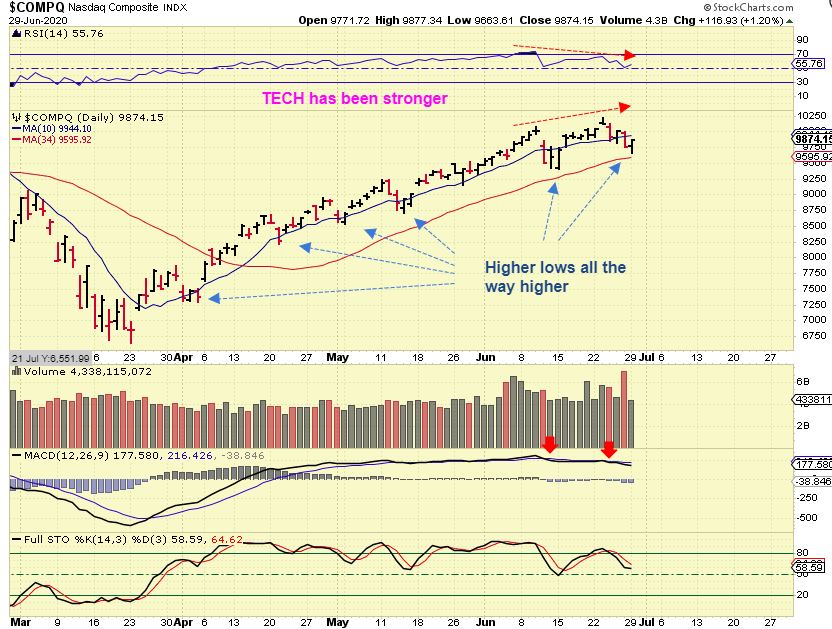
The NASDAQ has actually been climbing along in bullish fashion too. I do see divergence, but it has been a pattern of higher lows.
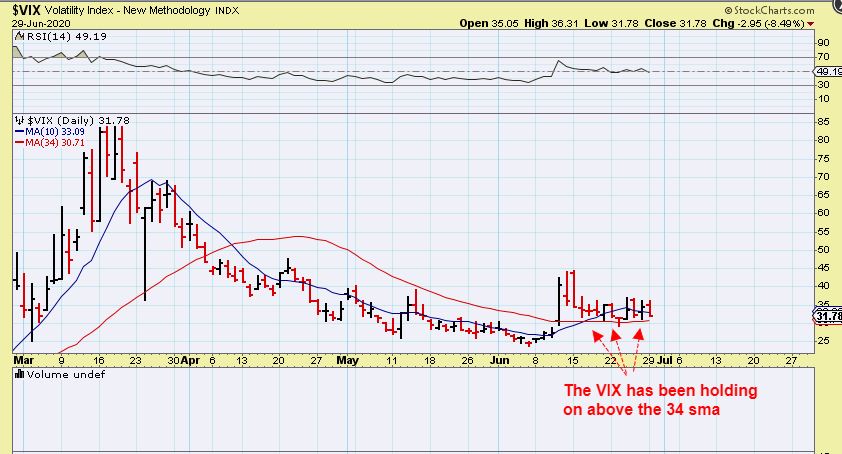
I pointed out that the VIX looks bullish, but now it is doing the same chop too. It is holding up above support, but I guess that it could do this for a while longer. A rally by the Vix often sells of the general Markets, so we will remain aware of or keep an eye on this set up.
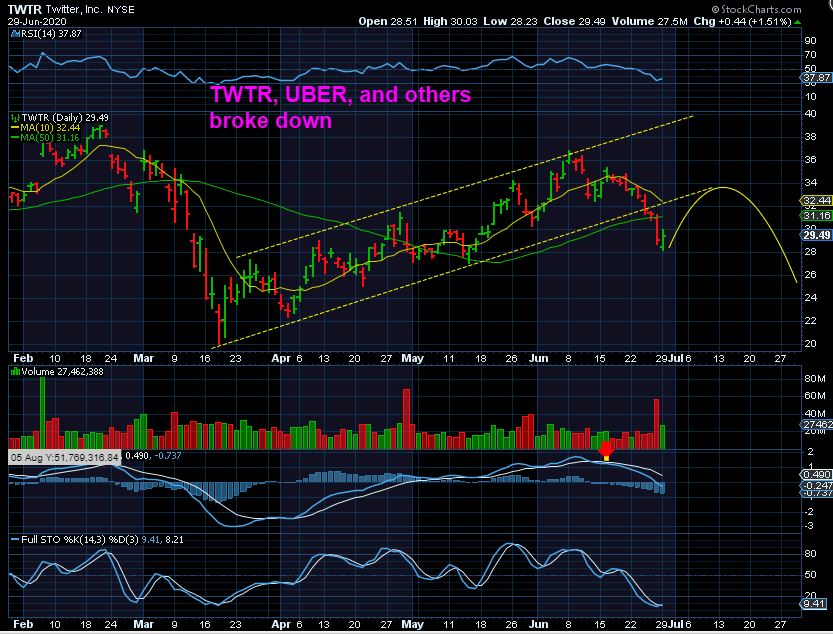
VARIETY : With the variety of Tech stocks that I was covering, I am also noticing a variety results as we come due for a dcl. Some are breaking down ( like AMD, TSEM, TWTR) and others have held up. It remains a mixed bag of results.
.
TWTR – We can see a break down below the channel, and a reversal on Monday. So the ones that dropped like this could recover over time, or it may just back test that break down and roll over (as drawn here).
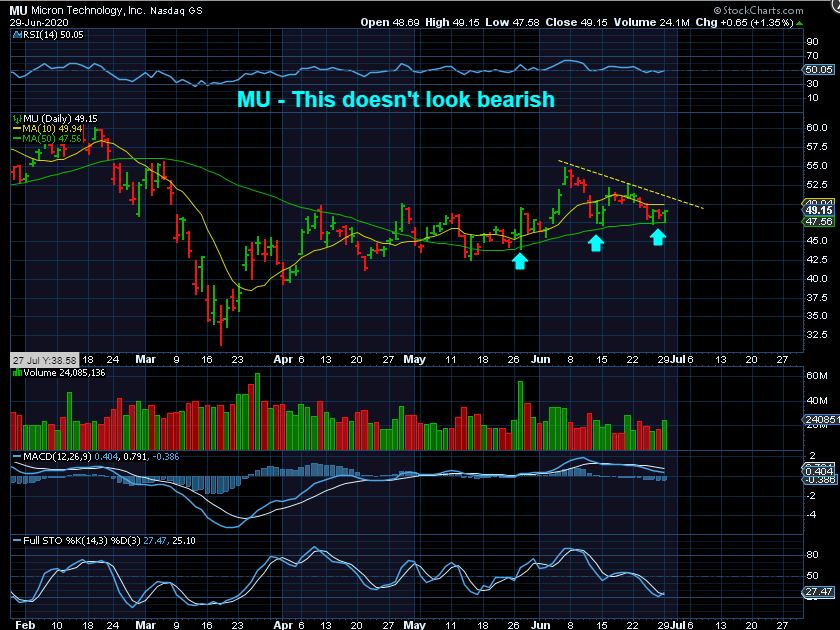
MU (& a few others) remained Bullish so far and actually looks like it wants to break higher and rally out of a long consolidation. That gives us a mixed bag and I’ll have to continue to monitor things, especially as the Markets finish up the 2nd daily cycle.
So FAR: The drop for the General Markets is a bit milder than I expected, but a daily cycle can last for around 40 days, so we still have a dcl ahead.
.
WTIC – Last week I was thinking that Oil might do 1 last POP to tag the 200 sma and then drop to a quick, mild DCL, as drawn by me here. Well…
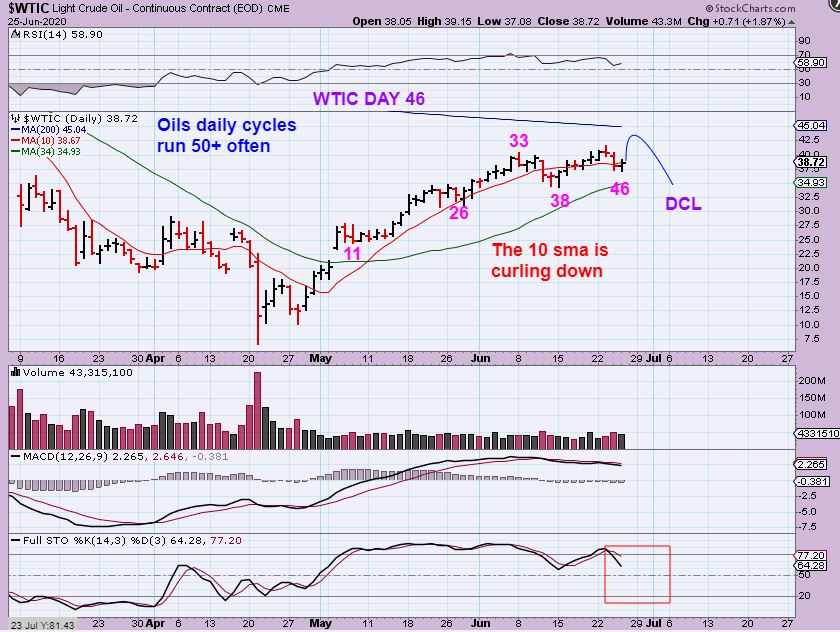
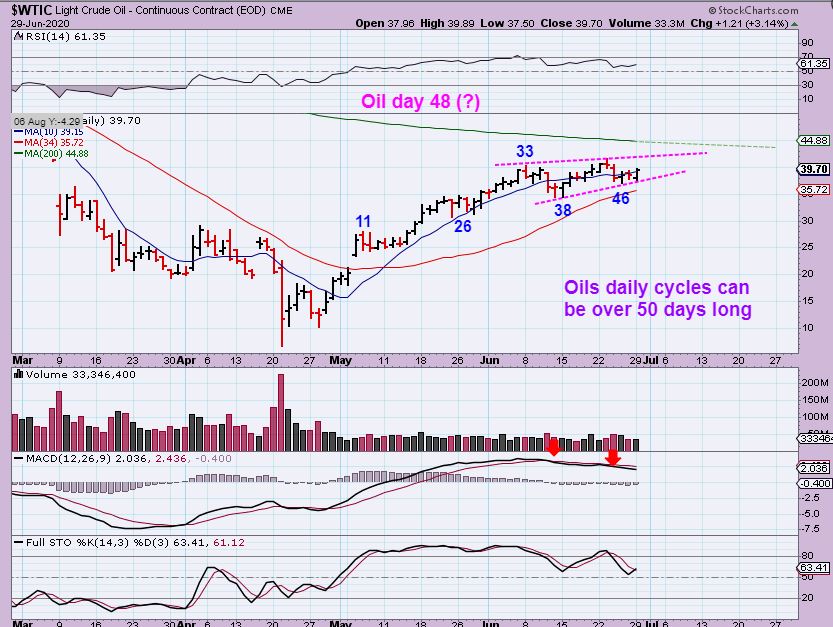
WTIC DAY 48 -As time goes on I would think that we need larger moves during each day. To me this looks kind of bullish right now. Was that a short day 38 dcl? I DON’T THINK SO, but this looks like it is preparing to break out above the 200sma. The XOP has had a deeper pull back…
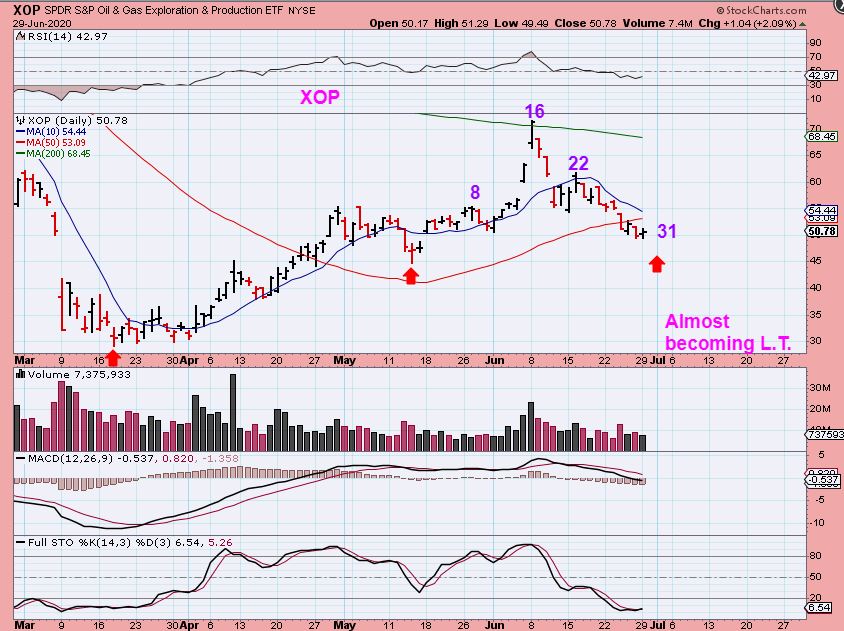
XOP – After a false break out through the overhead 200 sma, that became a day 16 peak in the 2nd daily cycle. The XOP dropped and we are almost at a point where we view it as L.T. ( left translated) and that indicates a weakening set up. That could affect the overall strength of the 3rd daily cycle.
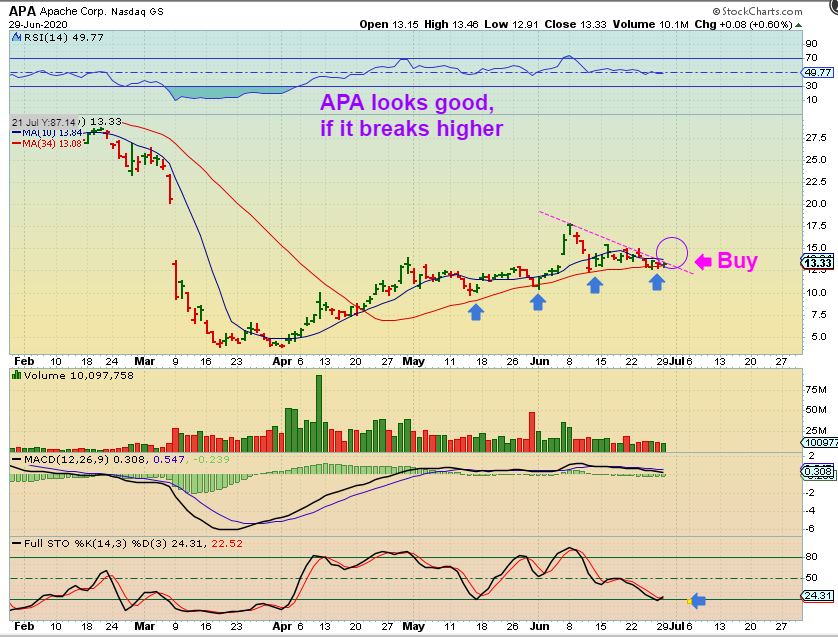
I looked up APA, CPE, OAS, CLB, and a few others and it is a bit mixed there too, but they do, for the most part, look like they’ll make another run higher.
APA sits on support here & would be a buy as it breaks higher. If the sector still needs a dcl, it might break out and back test (choppy).
.,
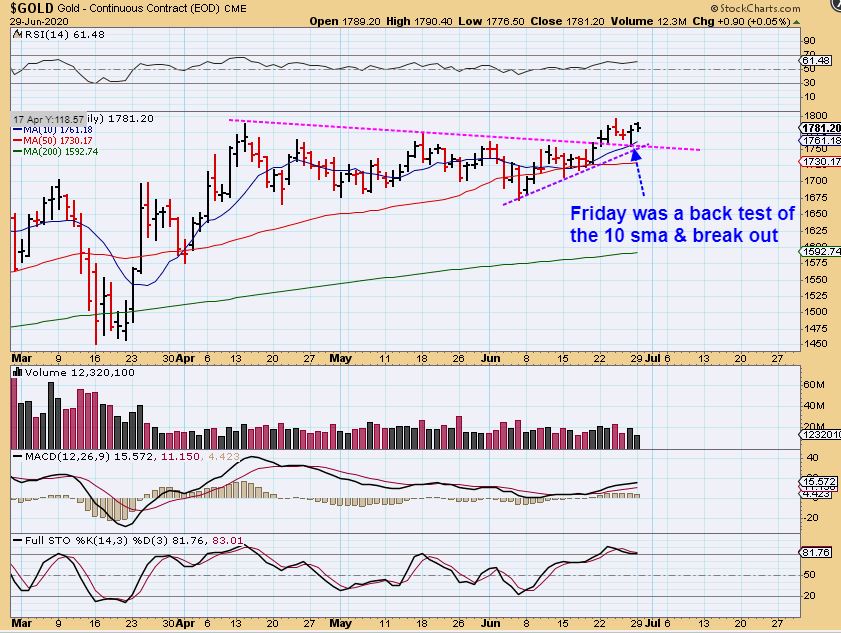
IN the weekend report I mentioned that 14 weeks from the ICL is within the timing for us to think about a dip starting. That said, These daily charts for Gold & Silver remain very bullish, as you’ll see. I have to view this as a bullish set up right now, and simply using a stop as mentioned below will protect funds deployed here if things change. Who knows, maybe we’ll see a 15 or 16 week Intermediate cycle, but this looks like it wants to go higher.
.
On Friday GOLD dropped, back tested the upper trend line & the 10sma, and then flipped higher. That actually looked perfect and this really looks like a bullish set up. We can now raise a stop under Fridays lows. Monday saw very little progress, but I’d like to really see this take off higher.
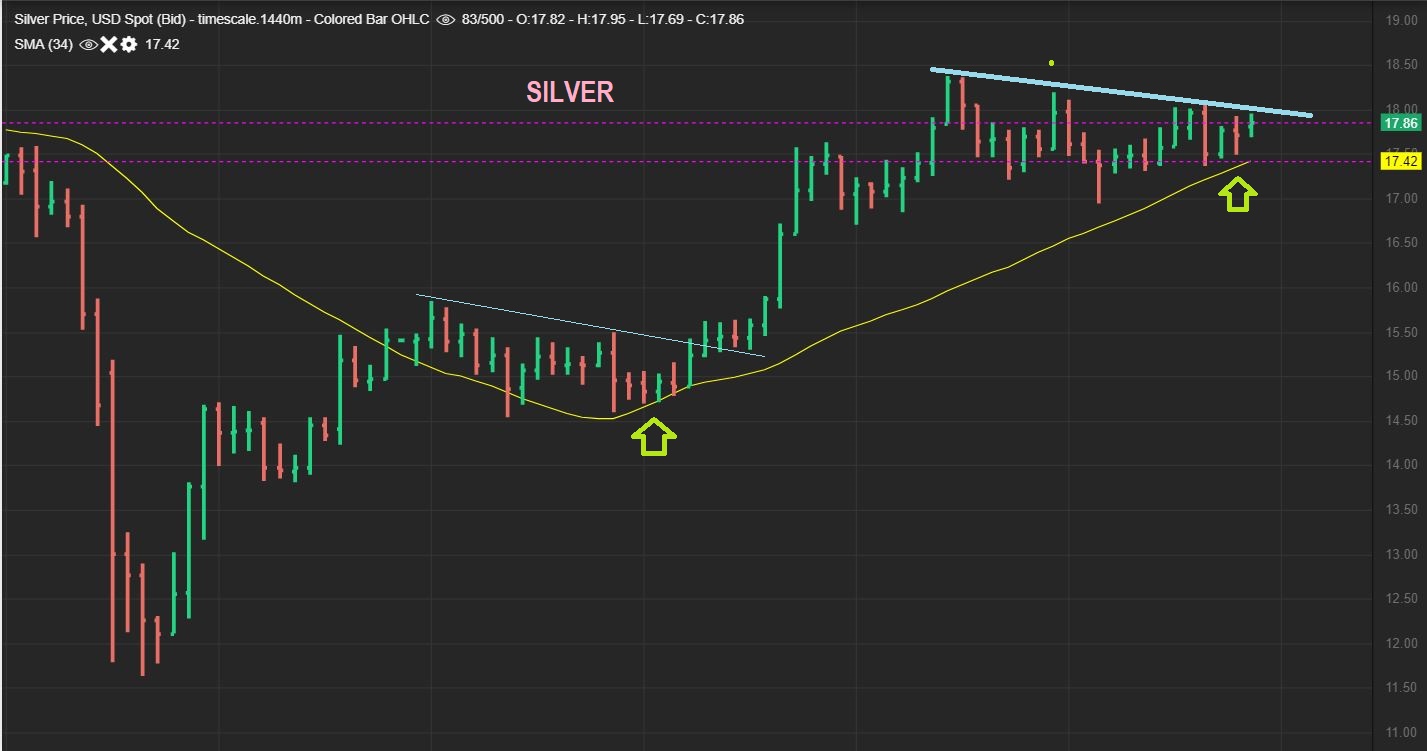
SILVER is still a Bullish set up too. It has been a multi-week consolidation moving price over to the 34 sma. That is where it landed before the last Rally. I would think that a stop below the 34 sma would be enough protection. Price shouldn’t go there.
.
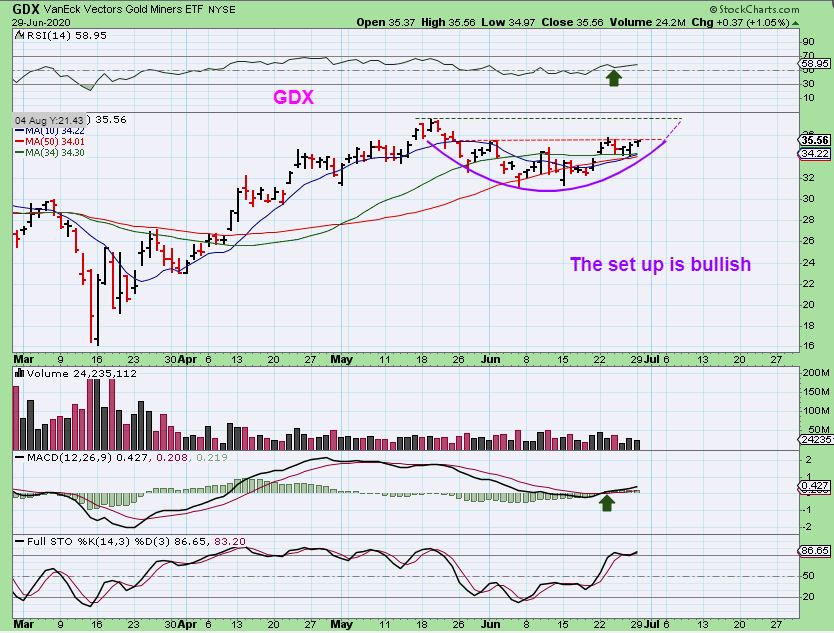
GDX – This is also a bullish consolidation that I would expect to break out higher, so now a stop under the red 50sma should be a place where I would not expect price to go for this to be acting the way we are expecting it to.
.
Nothing really changed from the weekend report, but it was good to review the daily charts and see how things look after Mondays trading. The Covid related stocks ( BNTX, HTBX, SXTC, COCP, NVAX, etc ) started out doing very well Monday morning, but then some sold off a bit. I still like the set ups in that area. Miners started off red, but reversed higher as the day went on, so we’ll see if Tuesday gives us some upside in the Precious Metals, and I’ll do a little review of some Miners below.
.
Enjoy your Tuesday trading, (though things have been a bit choppy and sideways).
.
~ALEX
.
At this point, I do see Biotech Covid Companies and Miners as the most likely to break higher and possibly trend for a little while. There are also a couple of Clean energy stocks that I will point out, but a lot of other stocks are still chopping sideways. I have already pointed out BNTX, COCP, HTBX, MTNA, NOVN, BIOC, and a few other Covi companies, so let me mostly cover a few set ups with Miners below for now.
.
BTG – This is a bullish set up, and if it breaks out, it really should run. Please read the chart.
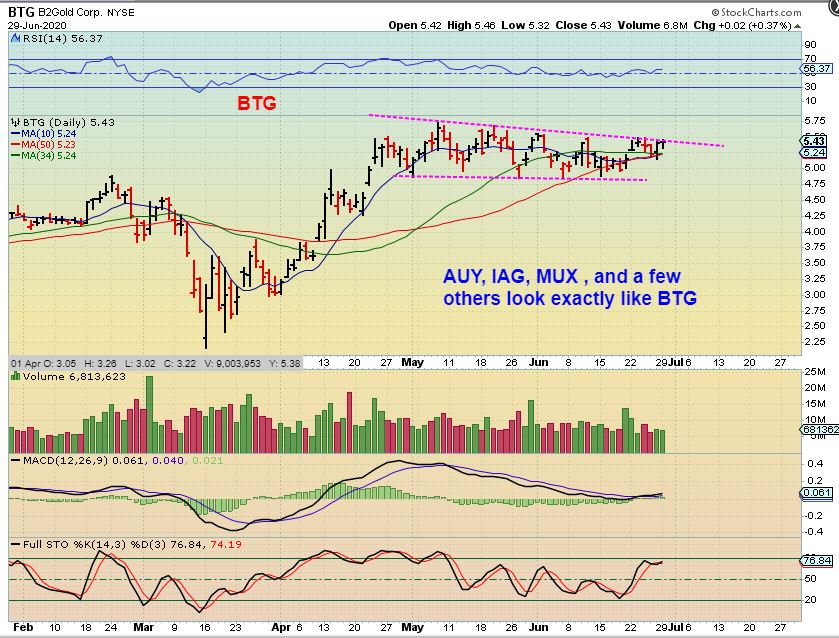
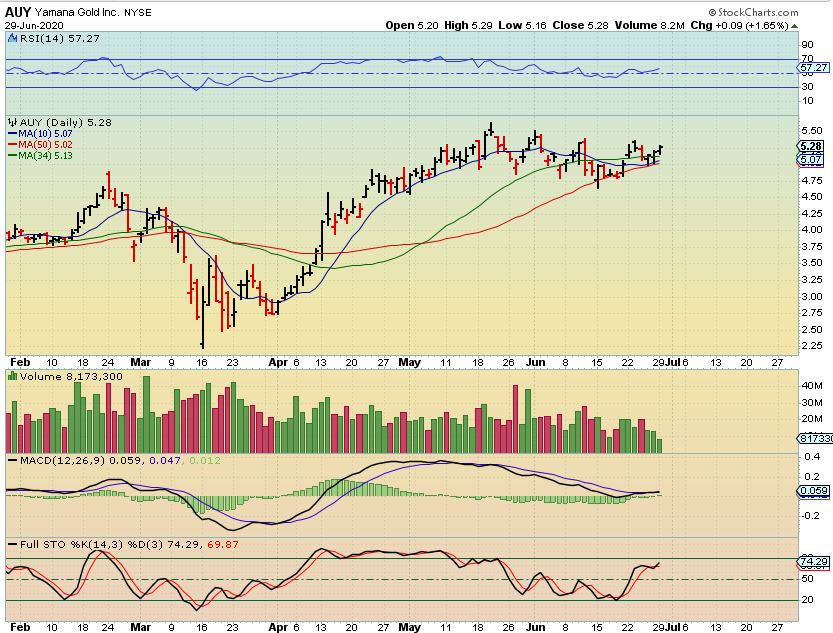
AUY – Many of these look very much like BTG. They are Bullish and a stop under the red 50 sma line should be a protection.
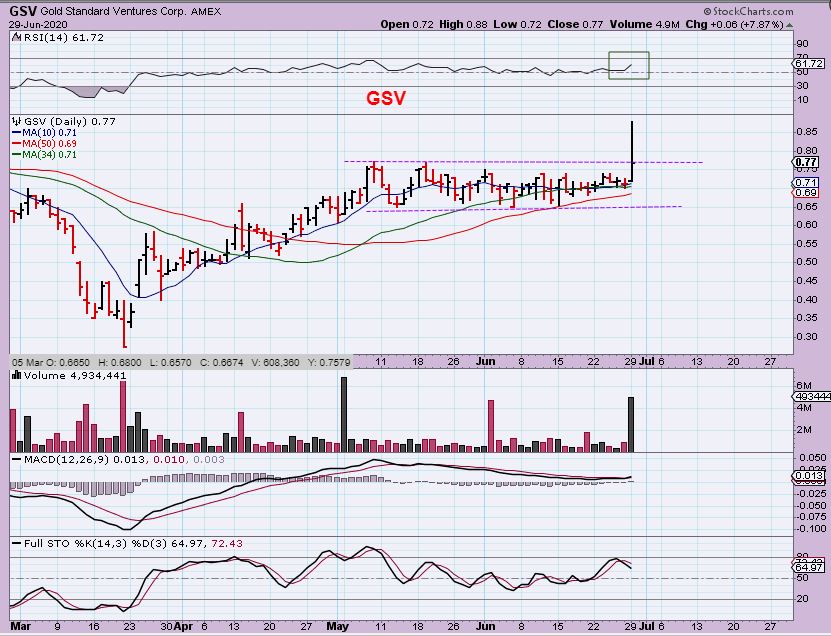
GSV looked similar to BTG, AUY, IAG, etc , with a long sideways consolidation, but it broke out. It then sold off, but it is still bullish. This gives us a lower entry all over again. If it ran up and pulled back, can it get follow through Tuesday or Wednesday?…
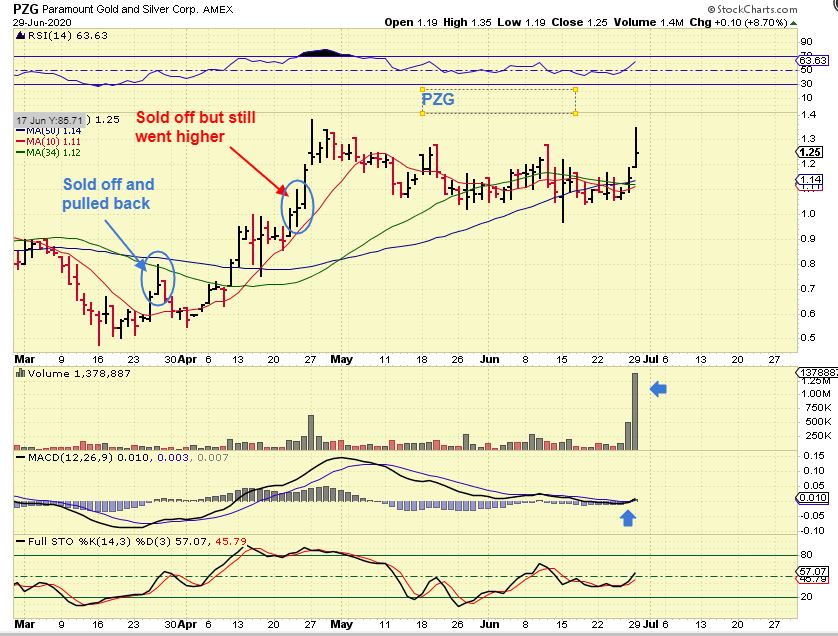
PZG also broke out from a long consolidation and pulled back too, but notice that it had done that before and it DID continue higher in April.
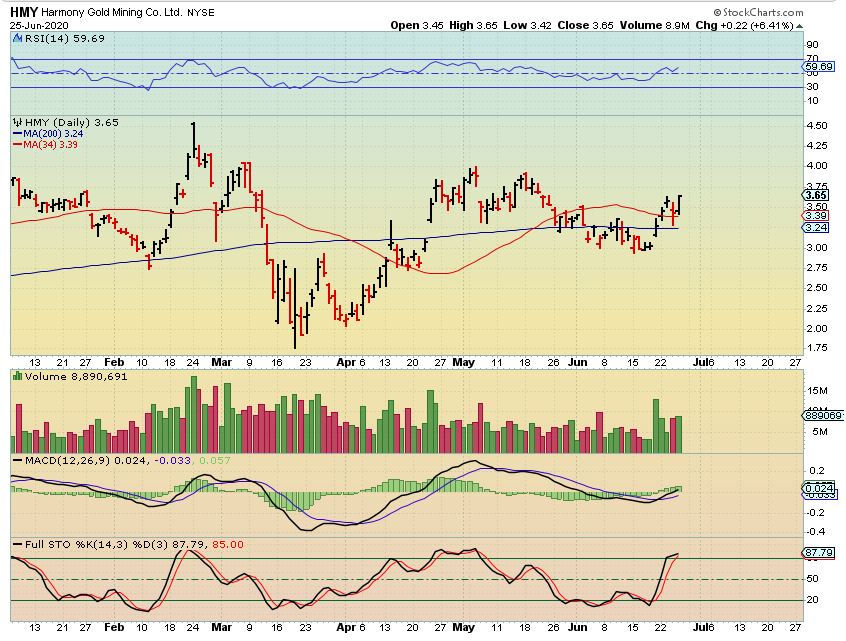
HMY June 25th – Recently I pointed out HMY as a buy – a lagger of African Miners. I showed how DRD, AU, GFI ( African Miners) were running well and HMY was lagging.
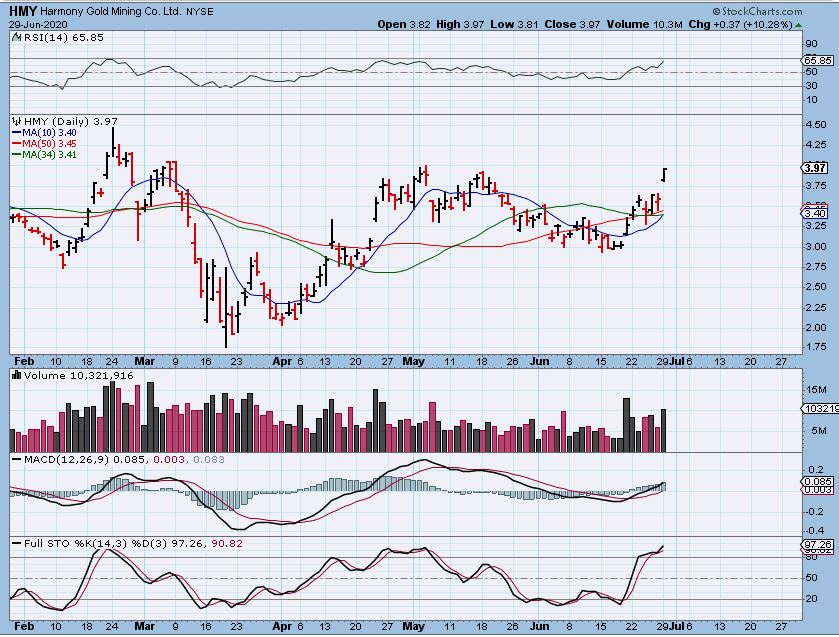
HMY – Gapped open and closed near the highs, so it does look like HMY will play catch up. It had increased volume too.
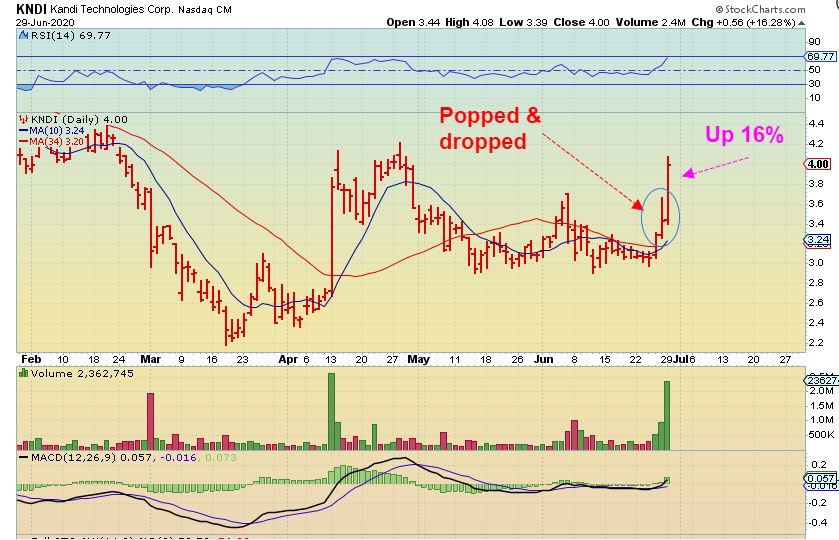
KNDI – I Just wanted to stick this chart in here too, to show the same ‘rally that sells off candle‘, followed by a nice day higher the following day.
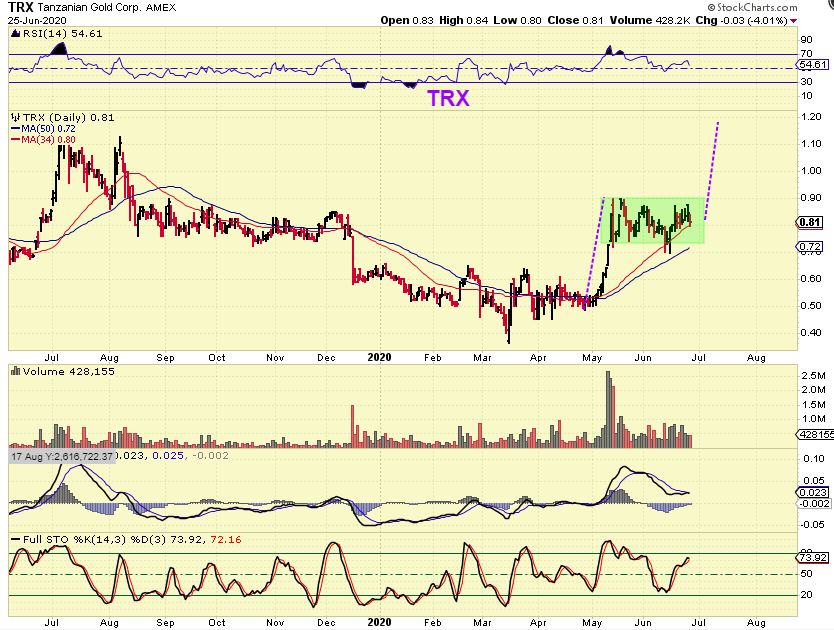
TRX dropped Monday morning and then recovered. This is still a bullish set up and I used the next chart to point that out…
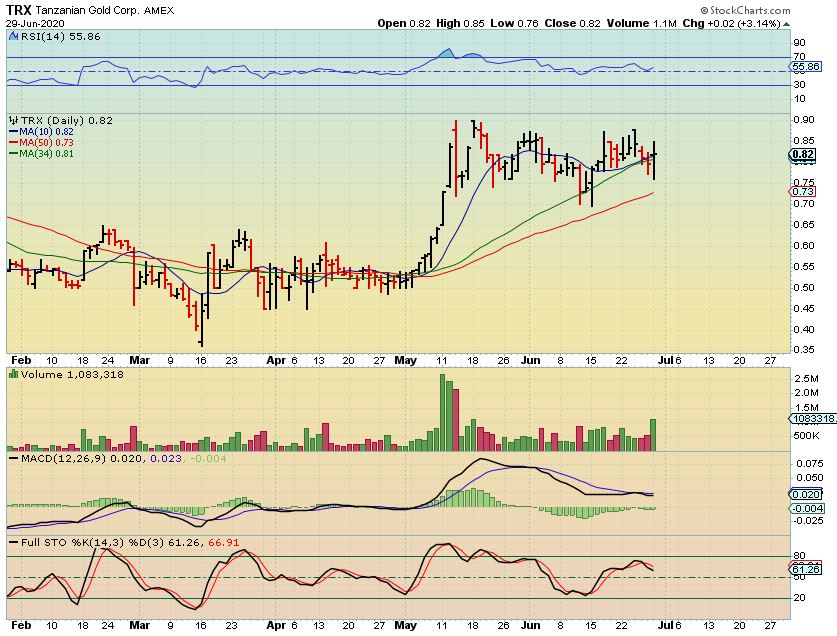
TRX – If it gets going, it could do a quick 50% move if it runs to $1.20.
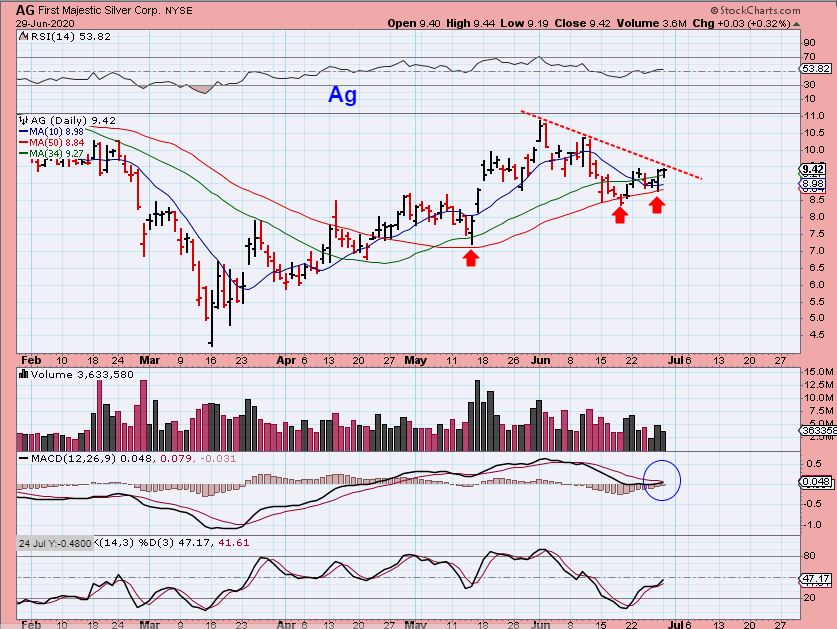
AG -I own it, I’m slightly disappointed at the lack luster move so far, but a quick run to $11 is possible and would be rewarding as a trade.
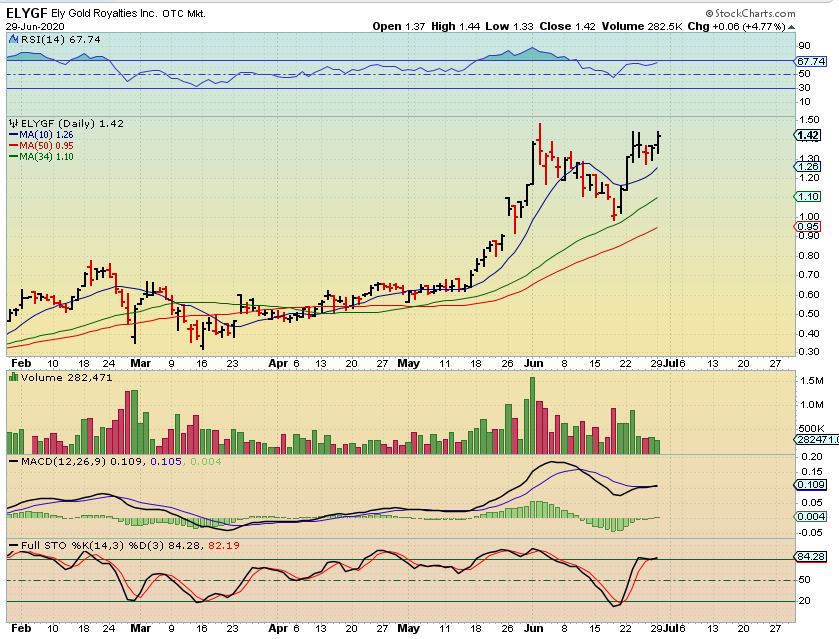
ELYGF – I own ELYGF and it was up another 5% Monday. You could call this a mini daily cup & handle, and it looks ready to break out. I really want to see more volume on the break out than I saw on Monday, to indicate that buyers are piling in. The MACD & RSI are not confirming this push higher at this point.
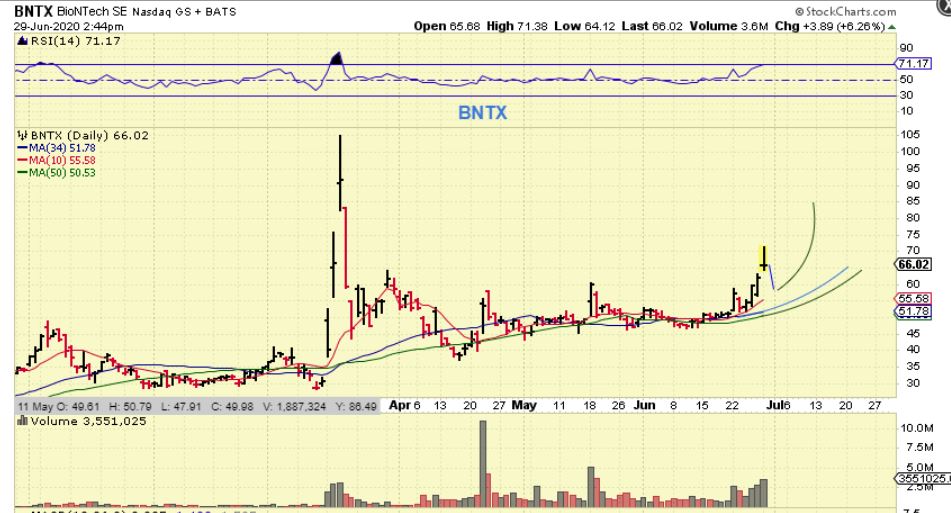
BNTX was up nicely Monday morning, but it sold off as the day went on. That move was basically $50 to $70 and I dont think that it is finished yet, so if it pulls back & fills that gap, I may look for a reversal to add to my position.
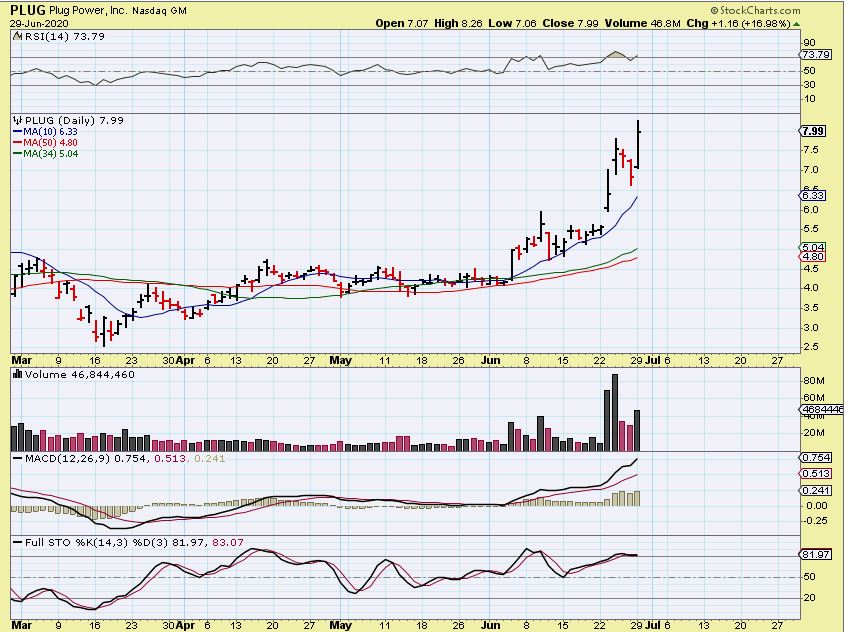
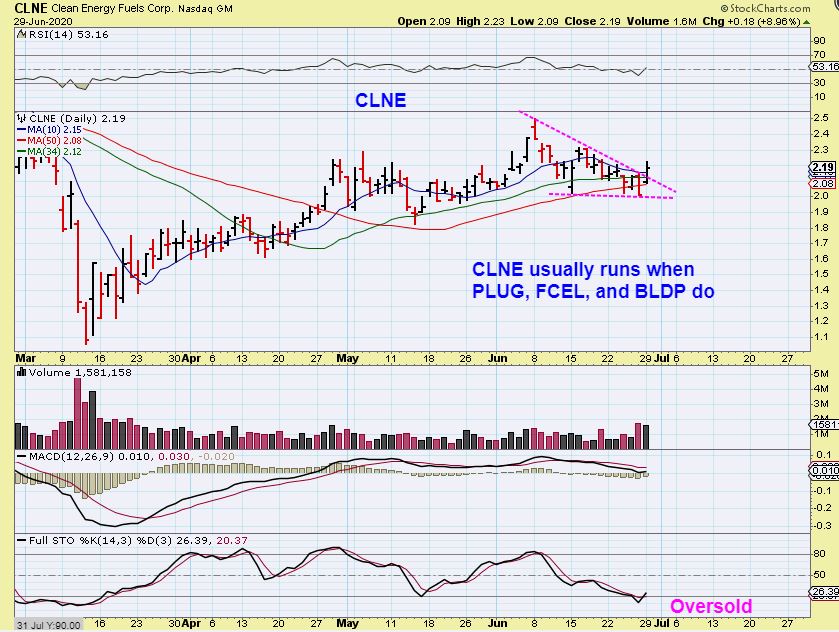
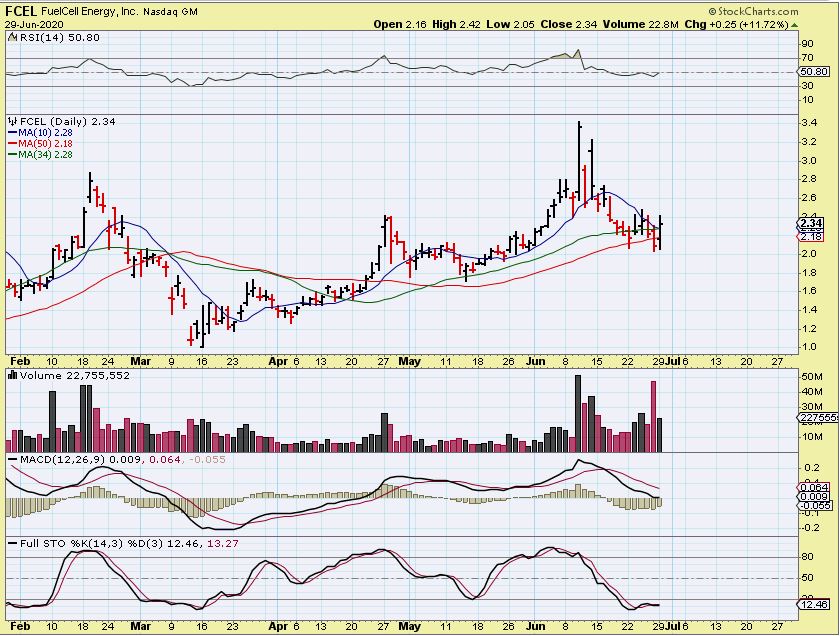
There are 4 stocks that I have under ‘Clean Energy’ in my watch list, and they almost always run together. They are PLUG, BLDP, CLNE, and FCEL. Well here we see that PLUG AND BLDP have been ramping higher, so what do CLNE & FCEL look like?…
.
PLUG has been running strongly out of a consolidation in June.
CLNE -Looks set up to start moving higher too. It lost the 50 sma Friday but recovered it Monday with a 9% Pop and break of the down trend. This is a low risk, higher reward buy with a stop under the Apex.
FCEL – did the same . It closed under the 50 sma and then flipped higher Monday.
SXTC – I mentioned that I rebought SXTC, and I was looking for a pop and run again…
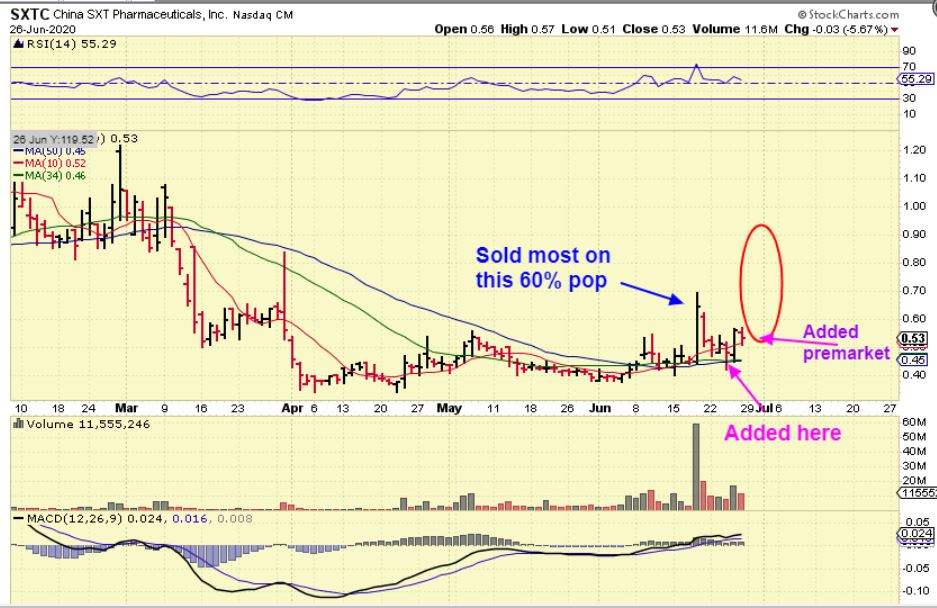
SXTC – It popped and dropped, but it still looks like a bullish base set up , I still own it.
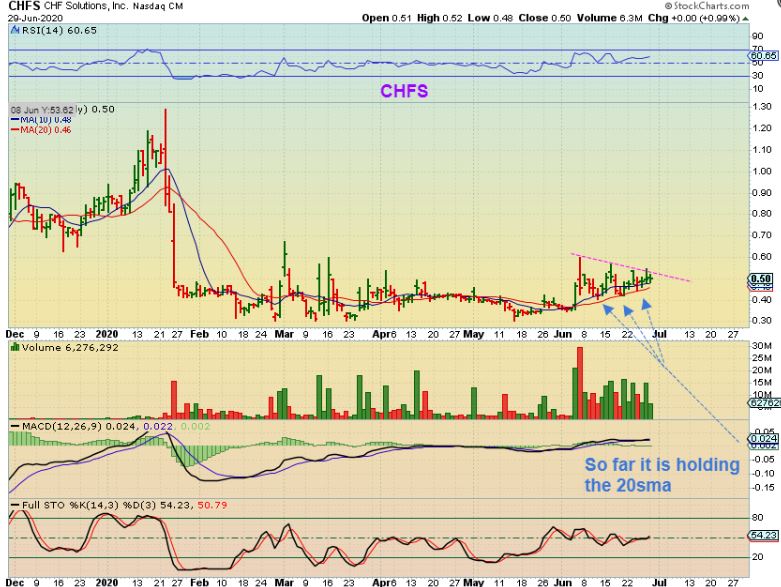
CHFS – I’ve been pointing out the constructive set up in CHFS last week, and a drop this week to that green 50sma line might be the final low, before it breaks out & takes off. On Monday…
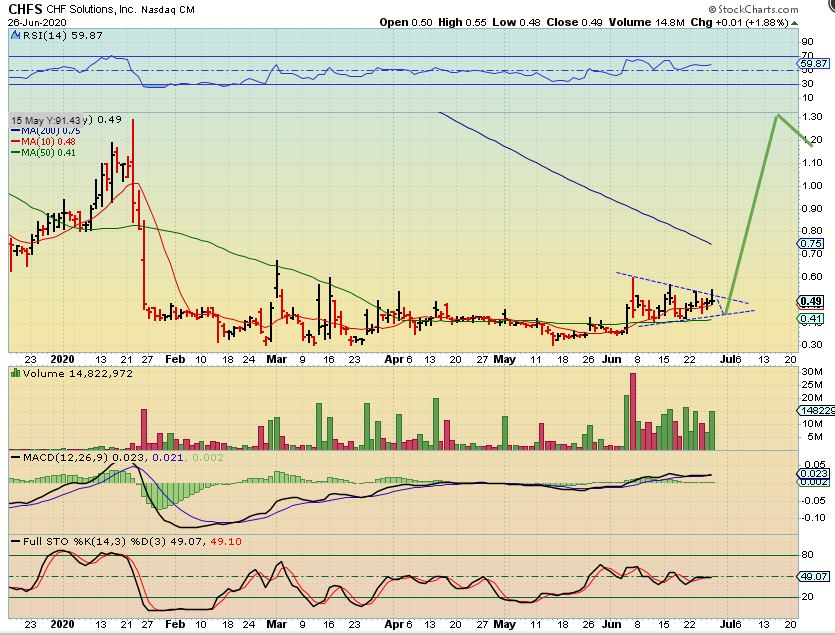
CHFS – On Monday it did not drop to the 50sma, but it has been holding above the 20sma. It looks quite close to a break out & still looks to be bullishly under accumulation.