June 20 Weekend Review
We had a good week of trading outside of the precious metals sector, and as of this week, they look like they may be set up to move higher too. Let’s review our charts…
.
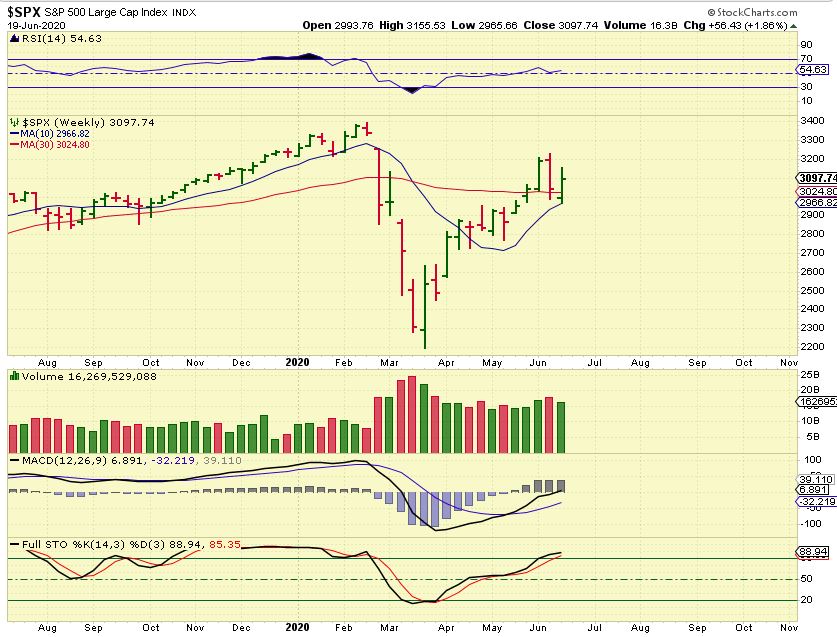
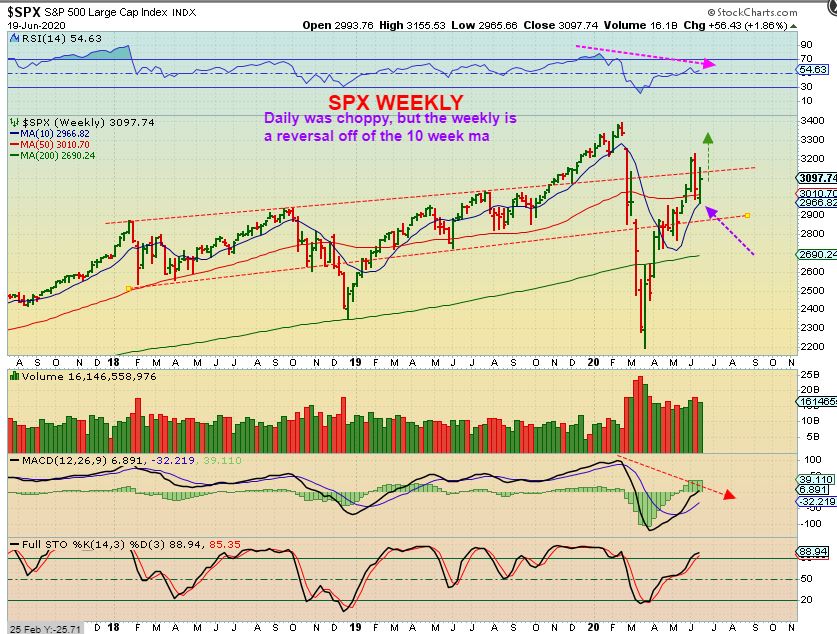
SPX WEEKLY- Plain and simple: This is a bullish chart set up with a reversal off of the 10 week ma. We just had a quick ‘crash’ into a 1/2 cycle low and are in the 2nd half of the 2nd daily cycle, so I would expect this to run to the prior highs.
,
SPX WEEKLY– So that would push us above my first target of 3200, discussed as we came out of the ICL (March lows). Along the way I said we would hit that area and “Then I want to take a look and see how things look from there. Are they Bullish or Bearish?”. Well, I thought that we might see weakness by now, but this remains bullish. The crash on Thursday over a week ago is a dim memory now. Just another dip where many people began ‘Shorting for a big crash’.
.
So let me share my thoughts on this again. I posted this chart in March. This was the 1929 crash compared to our Feb May crash in yellow. We saw the bounce in 1929 rally for 6 months, and then a bear market crash & downtrend started. My thinking now is this …

.
My thinking is this Possibility ( We’ll still watch this closely as it plays out, but this is what I am envisioning now) :
What is usually the month that most market Crashes happen in? October. For some reason, October can be harsh on the General Markets. A 6 month rally from the March lows brings us to … October. A long bullish intermediate cycle out of those March lows may bring us to a (2nd wave Covid?) sell off late September/October.
This is just me looking ahead and trying to see what the possibilities are, and THAT scenario does match our 1929 crash/rally/downtrend. NOTHING REALLY SAYS that this WILL play out exactly the same as 1929, I am just thinking of these possibilities help us STAY ALERT, and STAY FROSTY during a rally out of a Pretty severe Crash this past Feb-March. Most of you know me well by now, and you know that I am not biased as a trader. For example: I LOVE the Precious Metals sector, but I’m not ALWAYS pushing people to buy every dip in that sector, I am often patient. With OIL: We saw Oil crash to ridiculous levels, it was scary for many (CNBC included), but we were buying at the very lows (unbiased to ideas that Oil was too plentiful & wouldn’t recover) . So with the General Markets it is the same. They crashed and we bought the ICL area and I’ll continue to take things step by step to guide us through this time period, unbiased even though I feel a bear market is coming later. 🙂
.
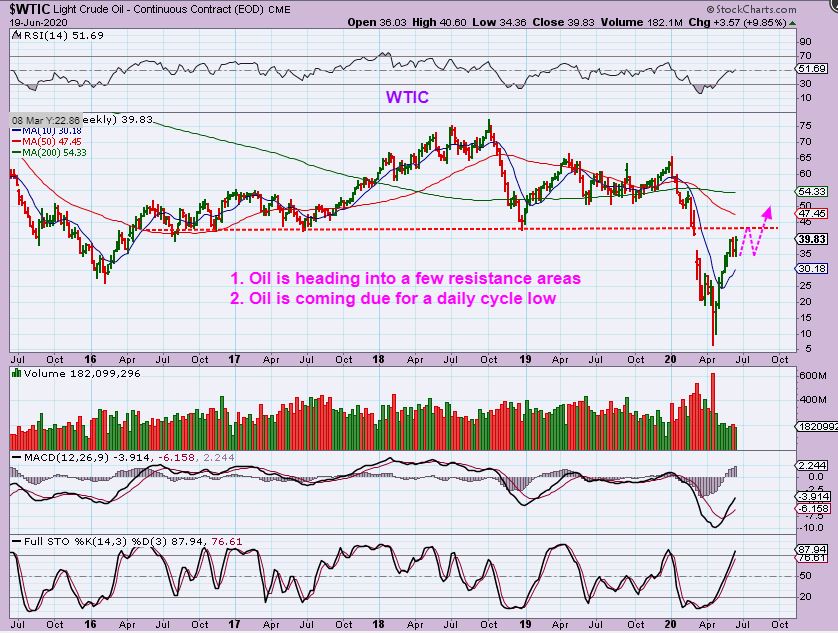
WTIC WEEKLY – Oil has made it back to $40. I expect a push higher to resistance near $44 -$45 as drawn. Please read the chart.
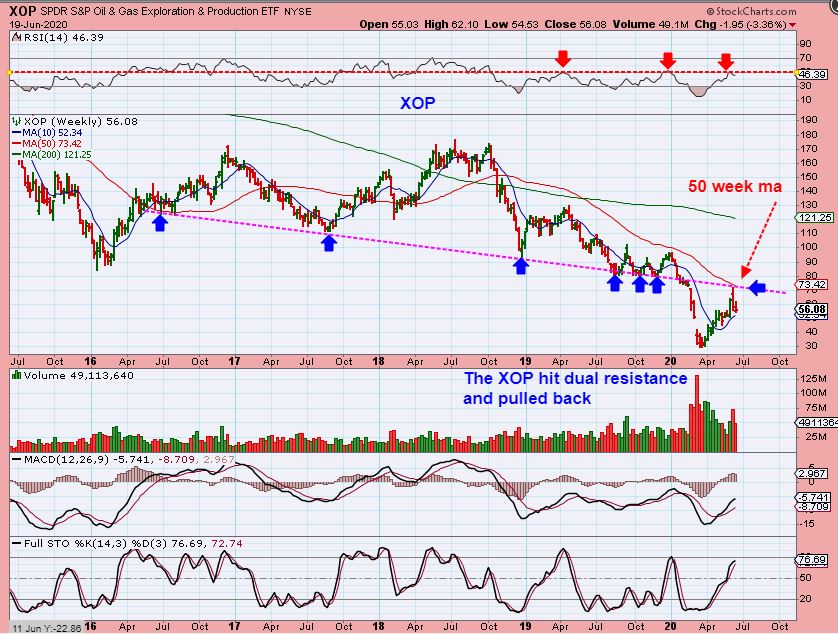
XOP WEEKLY – We bought the lows in Energy stocks and this has been a rewarding ride, but very choppy. I have traded in and out of this sector, but it could have been buy & hold if you could take the deep dips. We now hit resistance ( 50 week MA & trend line – see chart) , pulled back and near the 10 week ma. This could eventually pop above resistance and Oil stocks would continue their ‘recovery run’.
,
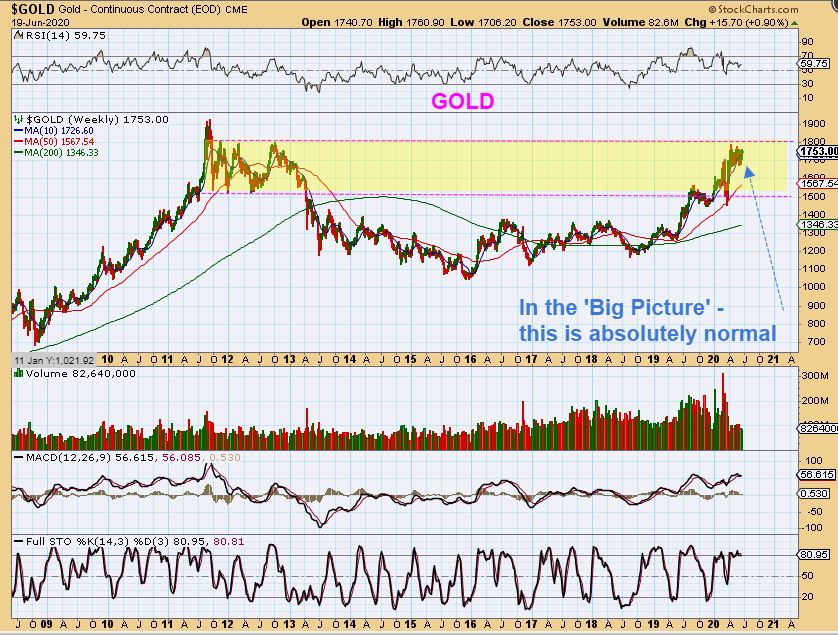
GOLD WEEKLY – When we look at the Big Picture, this is exactly what I thought could happen months ago. It is a sideways chop at resistance and it is not bearish. Even though it is bullish consolidation at resistance, the day to day to day price action can cause some to feel that ‘This is too weak to go higher.” I think that we could see a break out soon, but this also can just continue. In Fact…
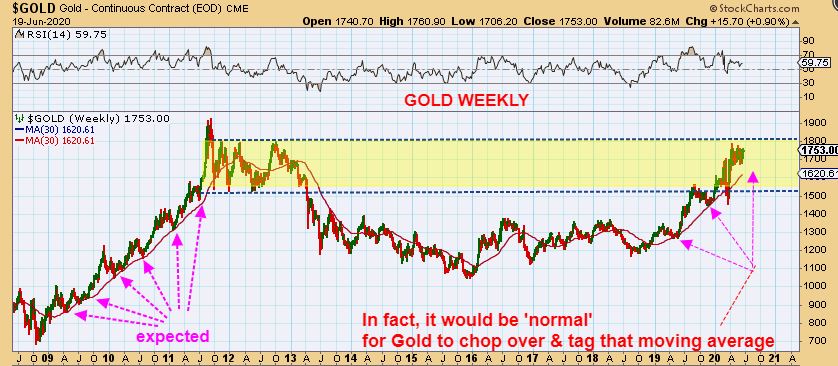
GOLD WEEKLY– Read the chart and see why the sideways consolidation continuing would be absolutely normal. See also the bull Run from 2008-2011 for proof. I HATE to say it, but Gold really could remain choppy as it breaks higher.
.
Let’s zoom in…
.
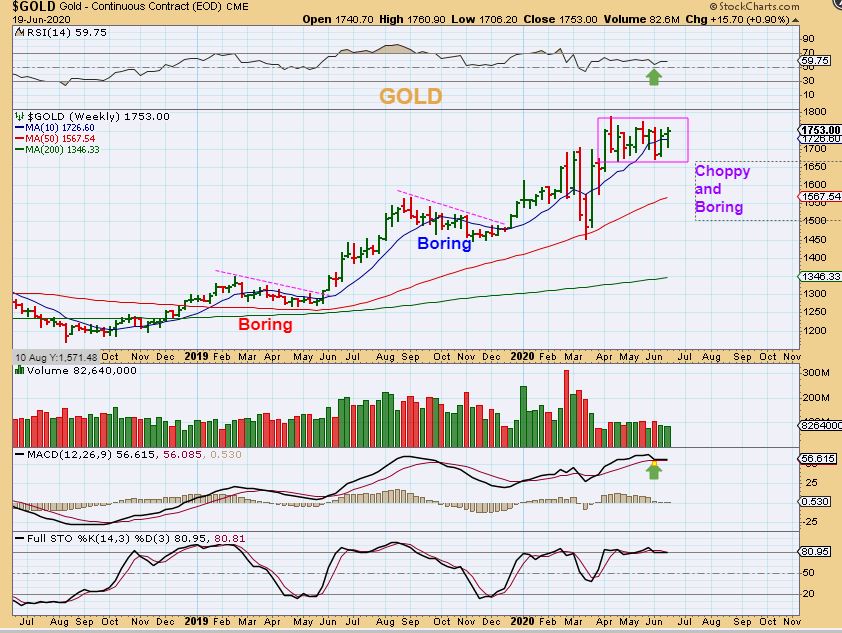
GOLD WEEKLY – Gold did push back above the 10 week ma last week when I thought we had a dcl, so it should finally be ready to go higher. It might push to former highs and chop out another box up there.
,
LET ME SHOW YOU THE DEFINITION OF BORING:
.
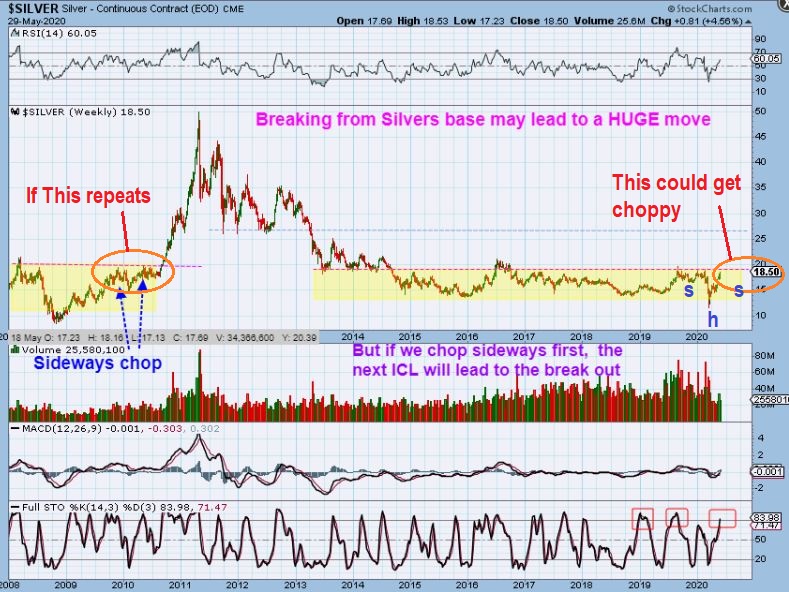
SILVER WEEKLY MAY 29th – Notice that back in May Silver is at $18.50 and I mentioned that price could chop sideways at this resistance level.
.
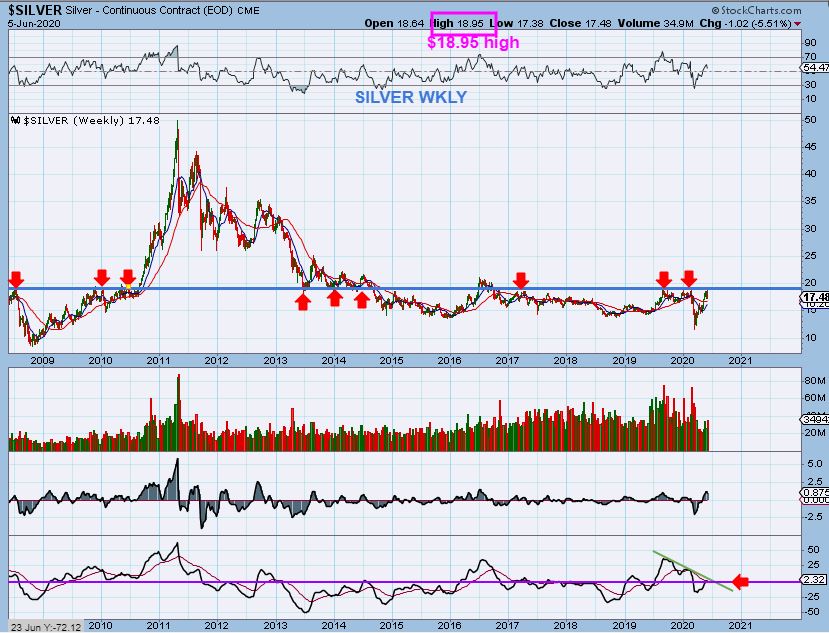
SILVER WEEKLY JUNE 5TH – Silver is still at $17.50- ish
,
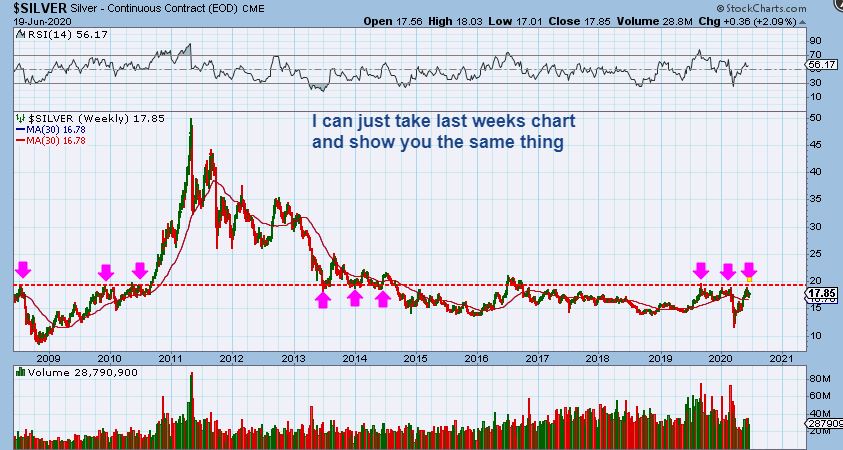
SILVER WEEKLY NOW, 2 weeks later – Silver is Still in the $17.85 area. SILVER is chopping sideways as expected, but if it has been doing this for a month, you can imagine how the Precious Metals crowd feels about the DAY – TO – DAY – TO DAY price action. Boring!! That said, it does remain bullish longer term.
.
On a sad note, this could continue to chop sideways too. If we formed a right shoulder on an inverse H&S, the break out wouldn’t come until the next ICL. I do want to say that this CAN break out now though too.
.
.
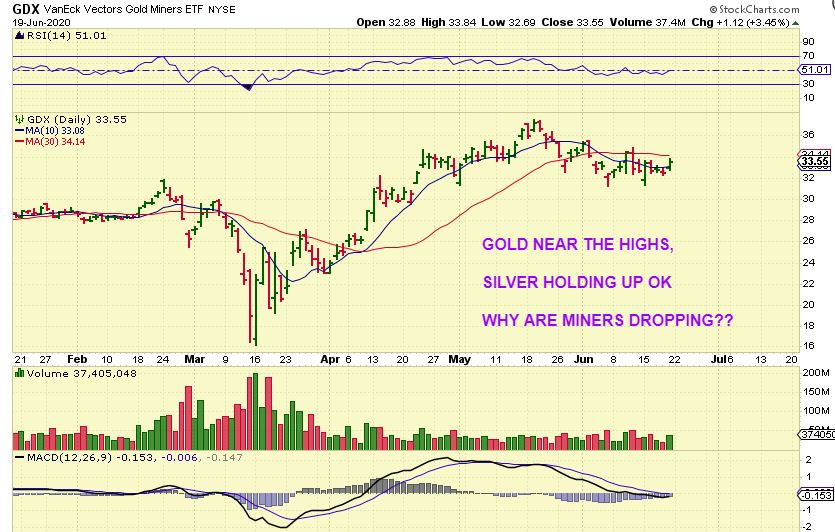
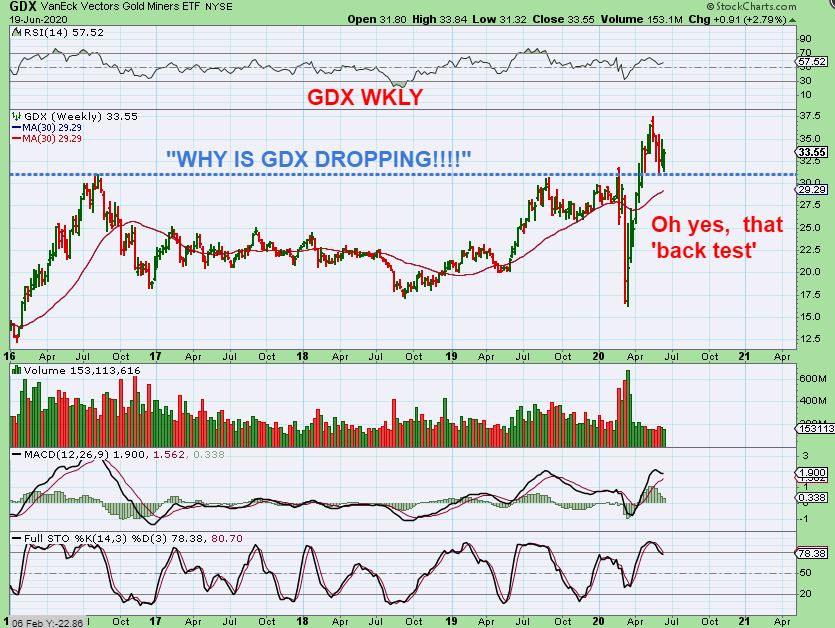
GDX DAILY – Last week many wondered what was written on this chart:
.
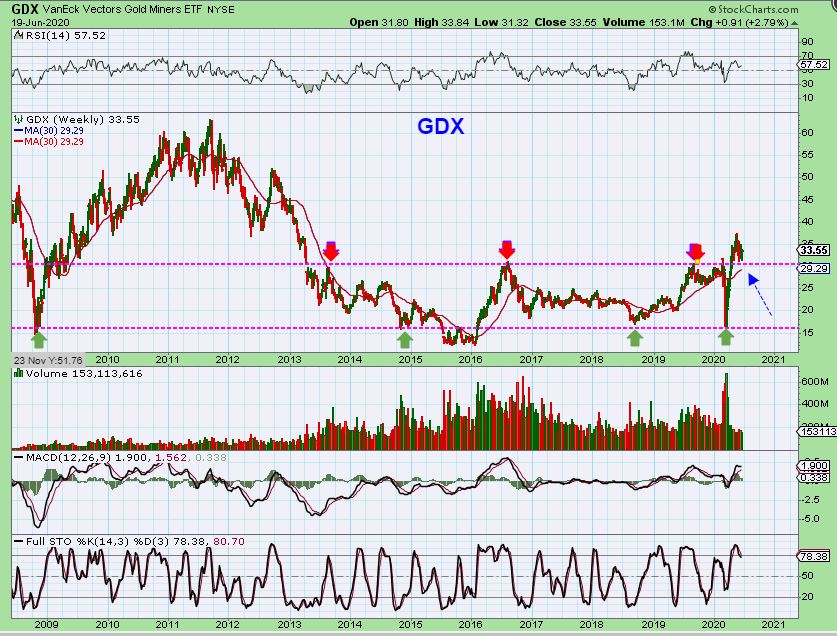
GDX WEEKLY – Well, The miners have been pulling back to do that back test of the break out. That is normal and we do have a solid reversal this week off of support. This looks bullish…
,
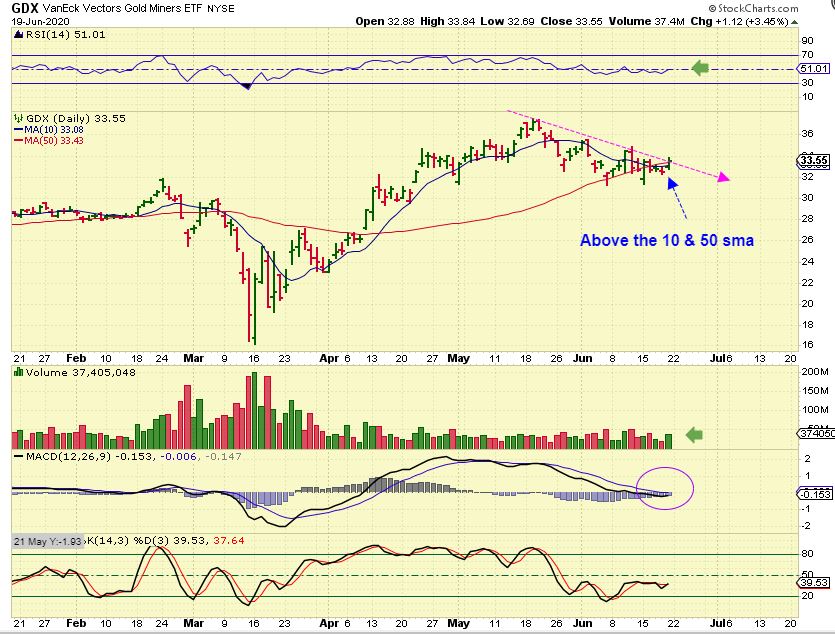
GDX DAILY – I just want to also say that this daily chart is bullish. Volume increased and price has regained both the 10 & 50sma Friday. One more day higher and that MACD will also probably cross upward and the trend line will be broken. Last week was a low risk buy in my opinion.
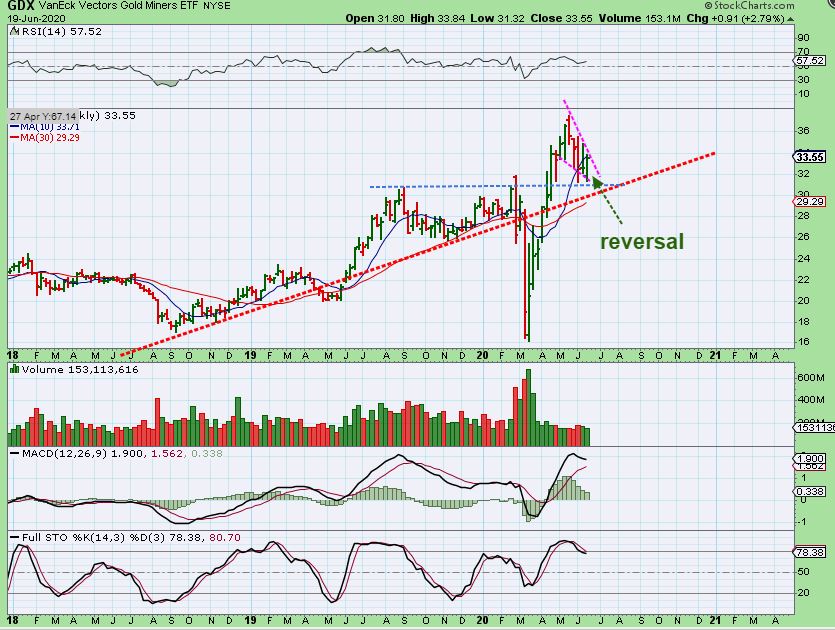
GDX WEEKLY – I see a nice reversal ready to break out of a possible descending wedge on the weekly chart too. It COULD drop 1 more week to that red uptrend line, but I don’t think that it will.
.
THE GDX WEEKLY shows us what has been a mild pull back actually. That 30 week ma is a normal target and that would have been a 38.2% Fib too. A push higher next week is a break out though, and this reversal looks ready to go higher.
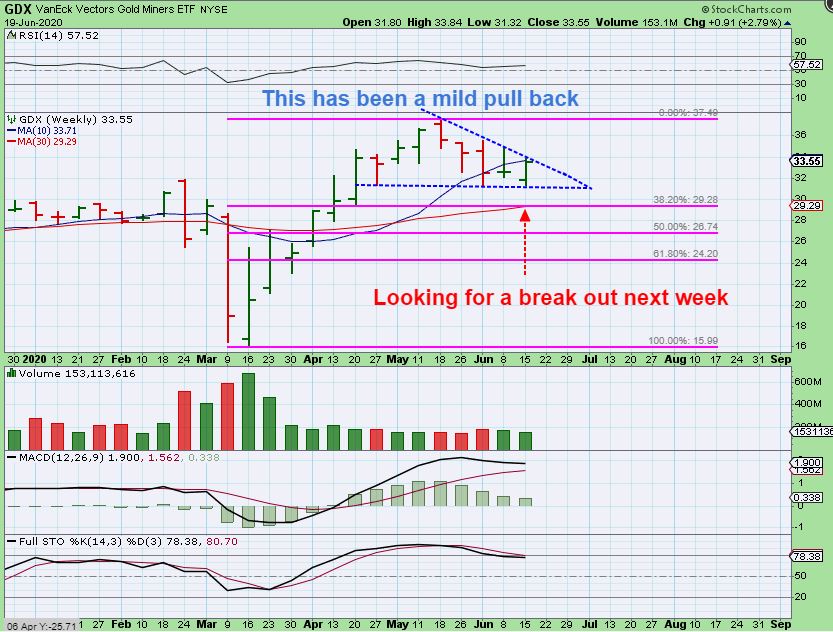
GDX WEEKLY – Back testing resistance to see it act as support.
.
Trading has been exceptionally good in the Biotech and Oil stocks, and the General Markets have had some good trade set ups too. I know that many readers are really just waiting for the next good move in the Miners. Well, the charts are showing nice reversals and the Cycle timing says that it might finally be the Miners turn to shine. They have bullishly pulled back & put in a reversal at support levels, so they look set up to go higher. Next week could prove to be one of profitable trading for all.
.
Enjoy your weekend and if you haven’t fully entered your position in Miners, next week might be the time to finish up on that. 🙂 Thanks for being here and for being a chartfreak with me !
.
~ALEX
.
INTERESTING DEVELOPMENTS BELOW: For everyone to read
.
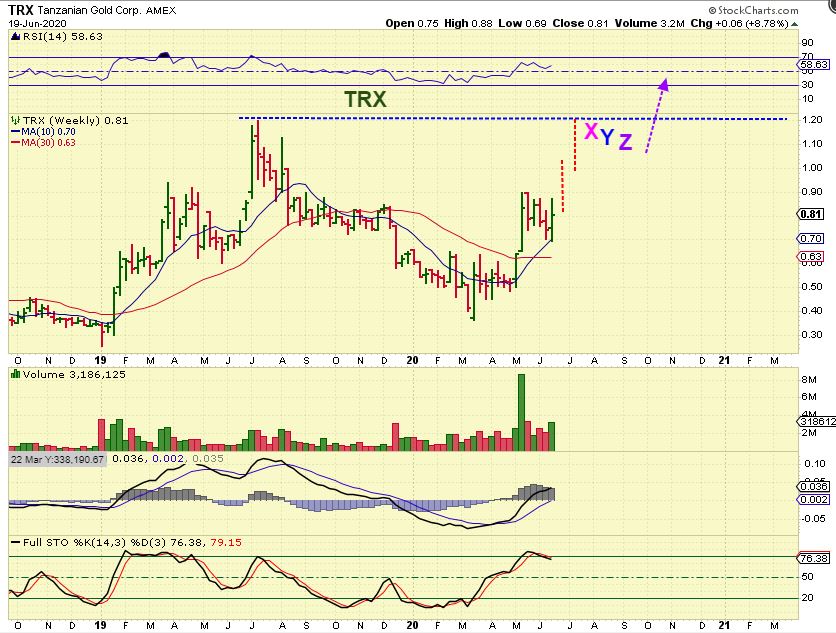
TRX WEEKLY – I just wanted to point out TRX again. They released good news last week and price has reversed off of the 10 week ma. This really looks ready to tack on at least another 50%. Wait, what? Really? Yes, a run from 80 cents to the recent highs at $1.20 is very likely and that is a 50% gain.
.
When I started pointing out charts with bases, I was using strictly Technical Analysis. For example, JBLUE, AAL, RCL, CCL, etc – those are airlines and cruise lines. Do I think they are fundamentally sound at this point? No, the charts were set up for big Pops/short cover, but the business in the long run is a bit questionable, right?
Then came a few other stocks – maybe they’d recover and seemed to have a technical set up and fundamental possibilities, like APA, OKE, PVAC, CPE, OAS, and other Energy. They could recover LONGER TERM too, with Oil prices rising to $40 again. Also I reviewed recently discussed solid bases in GNC, NAKD, IMH, along with some others like BIOC, LLIT, CHFS, SXTC, DYNT, and more, but there is an interesting development here. I want to briefly discuss this now.
.
When I have some extra time, I do like to review the fundamentals in some of these companies. Are these 1 time short covering ‘pops’? Or are they possibly recovery stories with longer term BUY & HOLD possibilities too? Is their product helpful during times of Covid and maybe even after Covid passes? Let me just show you a couple of these companies that I really like and Might be longer term holds for me. I might sell 50% if they pop 100%, but I may ride the rest or buy again on a pull back and this is why…
.
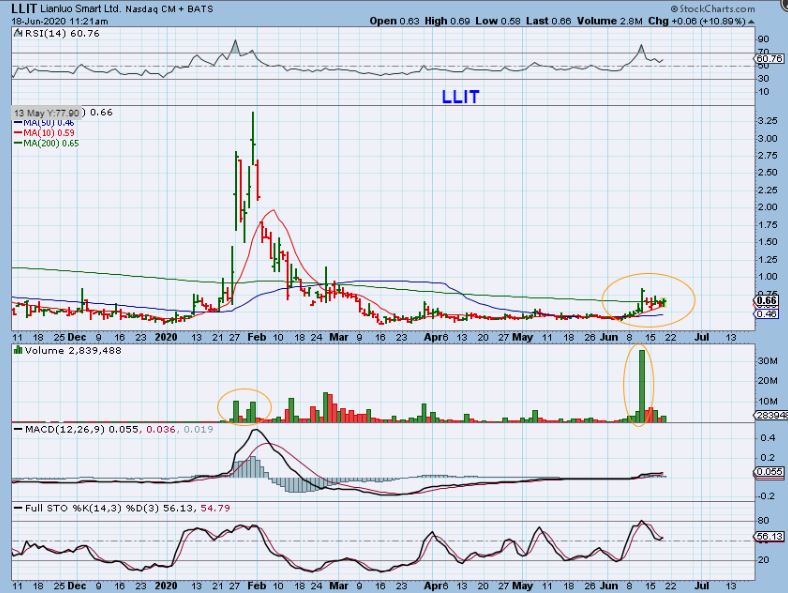
LLIT -I’ve been pointing out the bullish base and massive run in January. This looks ready to go again and at 60 cents, a run to Jan highs would be great gains, but what do they do?
LLIT COMPANY PROFILE : They develop and market
1. Medical wearable devices
2. Smart devices and
3. Ecosystem platform.
1. The medical wearable sector focuses on wearable sleep respiratory devices, focusing primarily on sleep respiratory solutions to obstructive sleep apnea syndrome. 2. The smart devices sector is specialized in operating easy-use smart devices for sports, social contact, entertainment, remote-control and family health management, which can connect things and humans in an intelligent way. 3. The smart ecosystem platform sector, intends to build an ecosystem to facilitate interconnection among smart products and between smart products and users
.
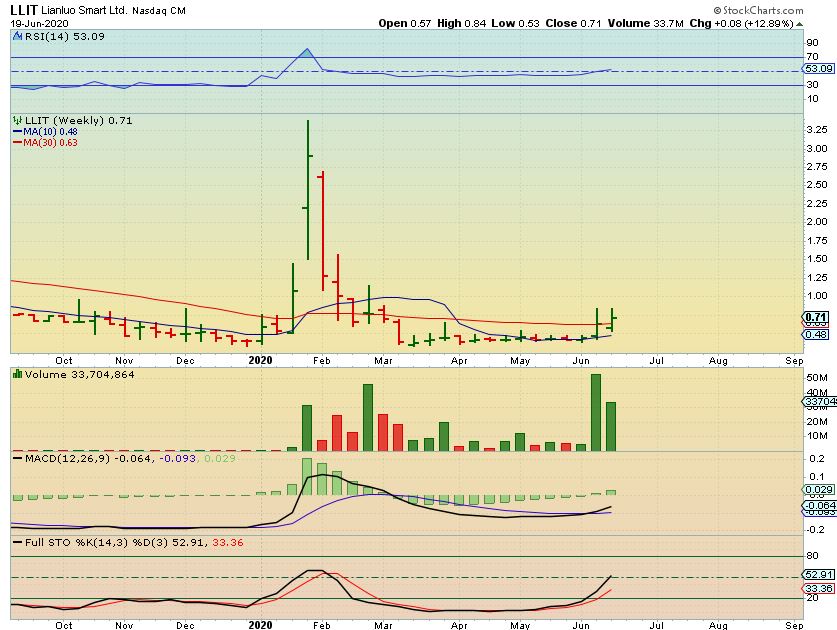
LLIT WEEKLY – This looks extremely Bullish to me, and I own it. Supposedly they did 3 price offerings in February, so I am hoping that that is behind them.
.
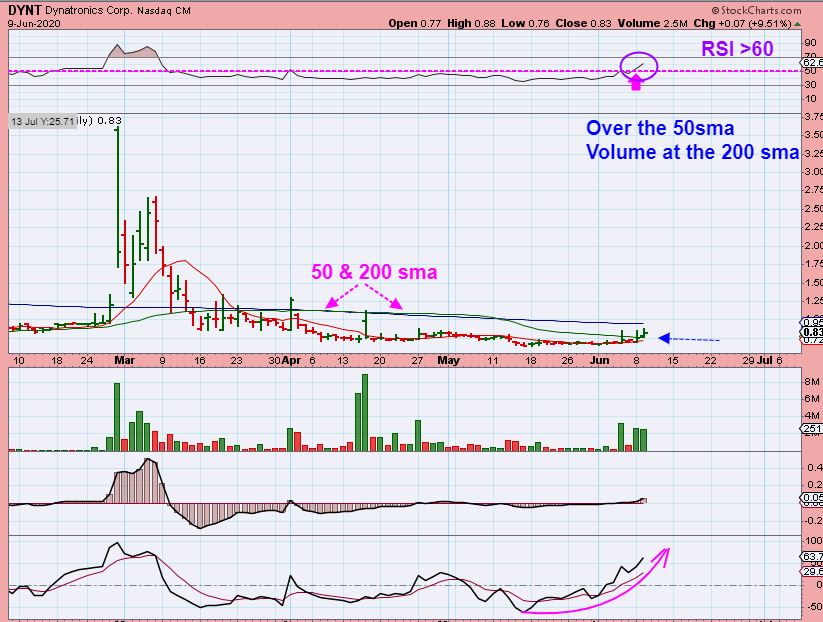
DYNT WEEKLY – June 9 I said I really liked this base in DYNT & outlined the bullish reasons why on this chart.
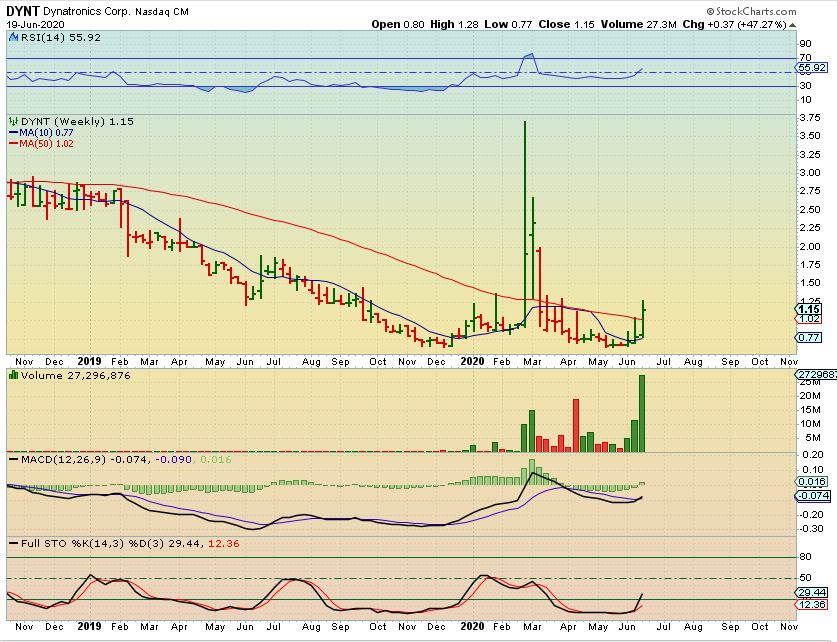
DYNT WEEKLY – Popped 47% this week. DYNT provides medical supplies and devices ( disinfectants too).
.
THE GOOD, THE BAD, THE UGLY, AND THE BEAUTIFUL
.
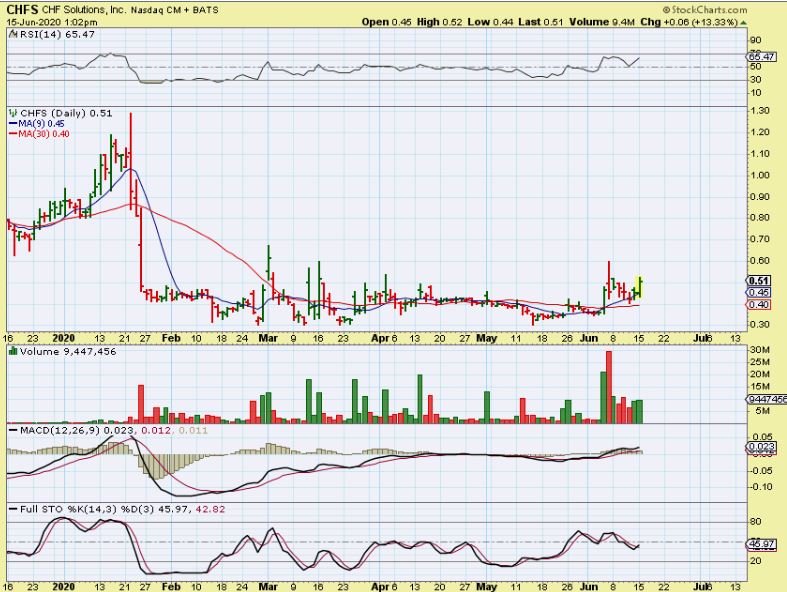
CHFS – On June 16 I liked this base and knew that they were a medical company working with Covid treatments for fluid build up. It has bigger green volume pops and this base plays out and the RSI is rising well above 50% and the MACD was rising too. I bought it under and at 50 cents and it is still there 4 days later. That gave me time to do a little research …
.
CHFS – These are just a couple of news headlines in June, I read these articles.

The June 11 Florida article stated, ” CHF Solutions today announced that it has sold Aquadex SmartFlow(TM) consoles and disposables to a critical care hospital for use in the treatment of COVID-19 patients in Central Florida.” This may lead to increased sales if they find it is helpful. Early reports are that it is helping. Now to a chart…
.
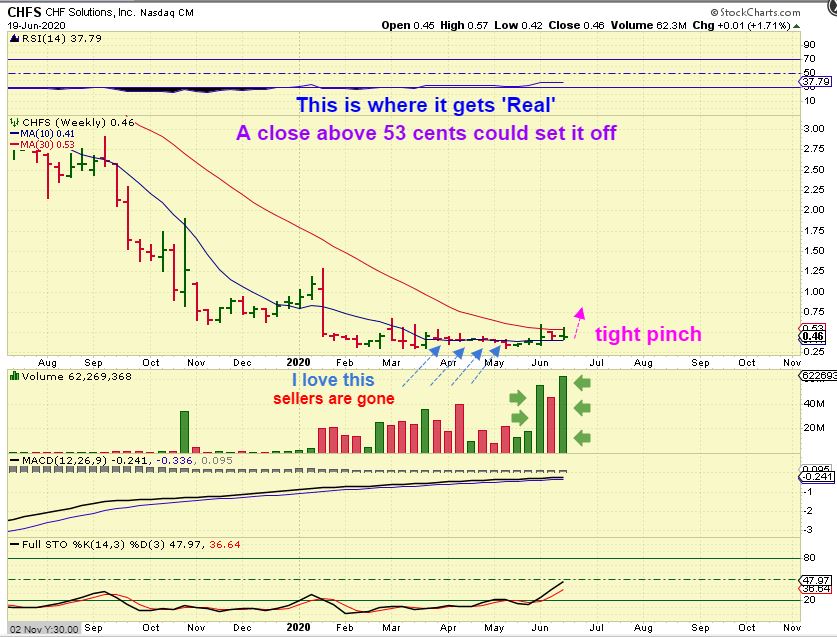
CHFS – LOOK AT THAT VOLUME AS CHFS PUSHES FROM THE BASE. Enough said here, I love this chart. The potential is big too. Let’s zoom in…
.
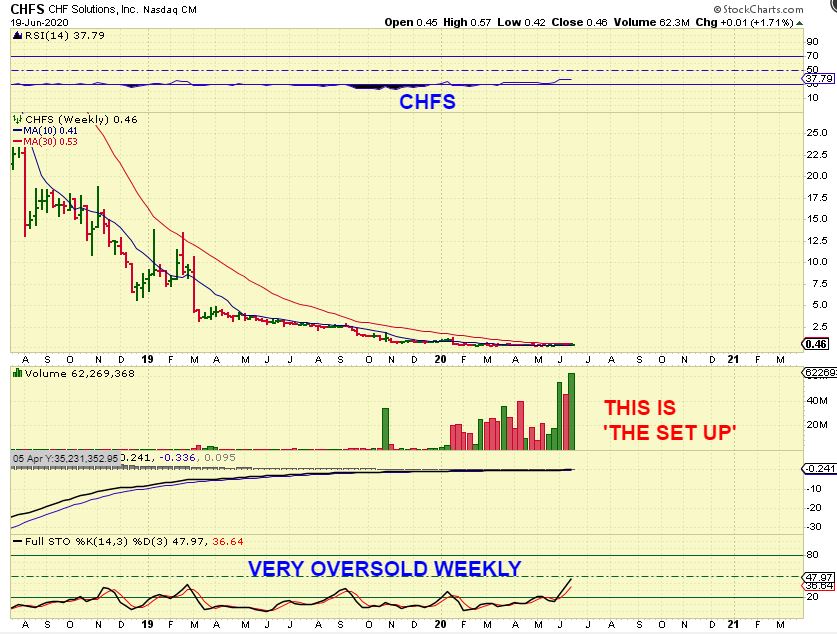
CHFS Weekly price is pinched or squeezed between the 10weekly ma & 30 weekly ma. In technical analysis alone, this can be explosive, but add to that the chance that good news comes out? This is very bullish looking.
,
This is what else I found in my research:
Yep, CHFS did the dreaded public offering in January to raise money, after running up from 60 cents to $1.20. My review of this chart is as follows ( and is written on the chart).
1. It had a lighter volume run higher and that public offering must have ‘Flushed’ those buyers out.
2. That means that the spike down erased resistance, all buyers probably already sold.
3. IF CHFS pops above the base, it could be one of those BIG pops that we have been seeing. Good news could come out at any time and cause that.
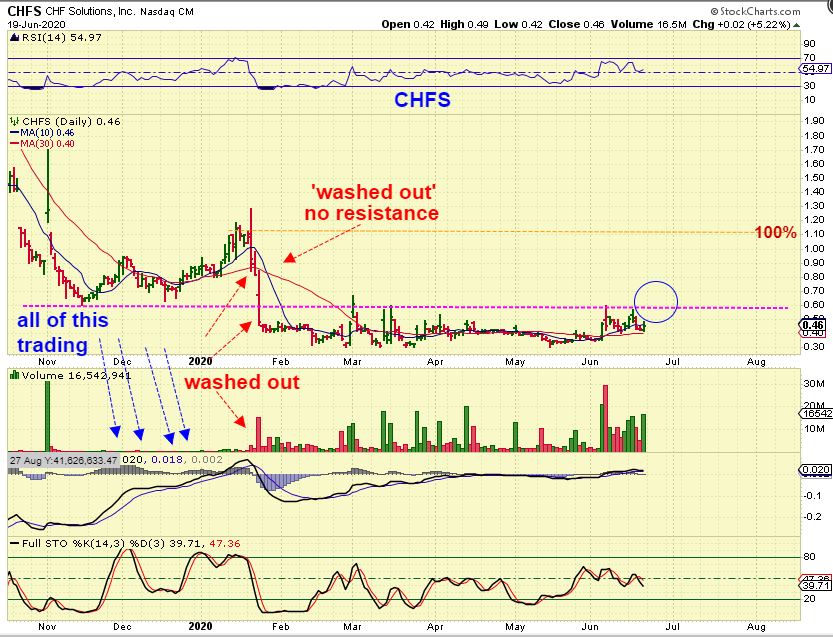
4. I found out that CHFS wanted to do a reverse stock split to raise price to $4.60 instead of $0.46 , and the share holders voted that down Friday after the bell. CHFS shot up to 50 cents after that news came out. Will that push it above the base Monday? Maybe / Maybe not, but it seems that Good News could trigger a Pop at anytime, so I want to be in it during this basing process.
5. Earnings came out in MAY, and that was the low of this base.
.
FINALLY…
.
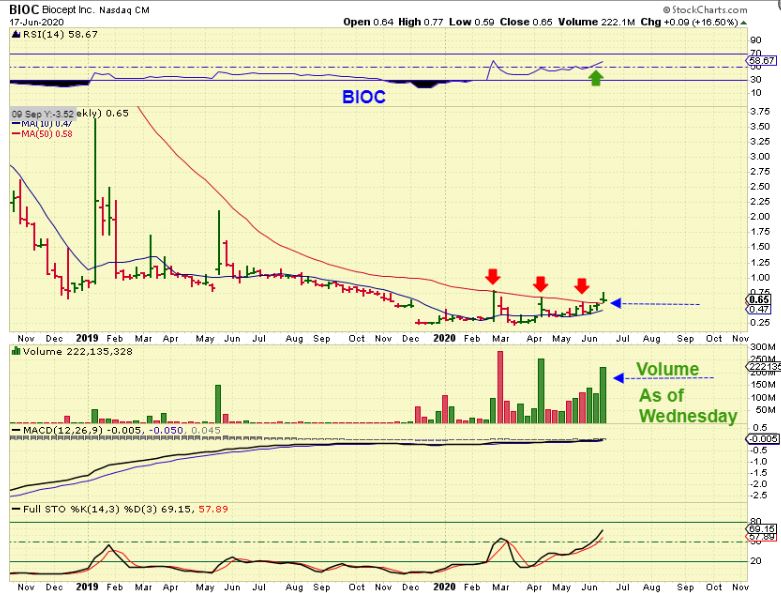
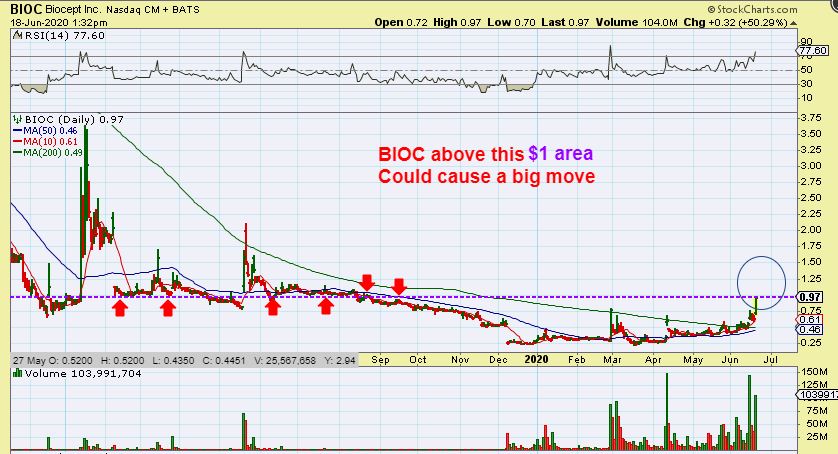
I liked BIOC as a Base with solid volume pops. Nothing was in the news, but this volume tells me that something is going on. It is an Oncology Lab Service Company, so it didn’t like Covid-helpful treatment, but the chart was definitely a bullish stand out. That price pinch is similar to what I see in CHFS. Volume was swelling as it as breaking out. I said that I added with this pull back…
Bioc and Boom, it was up big last week. I then mentioned resistance at the $1.oo level on my next chart
I then mentioned resistance at the $1.oo level, when BIOC hit 97 cents. I sold a good chunk , because it was up 50%, but I want to re-buy. Why? I do think this also has longer term potential…
.
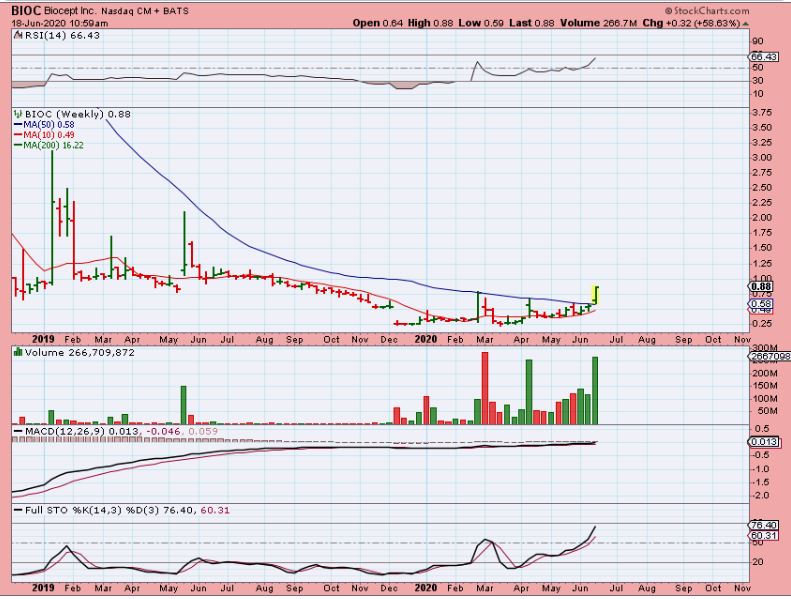
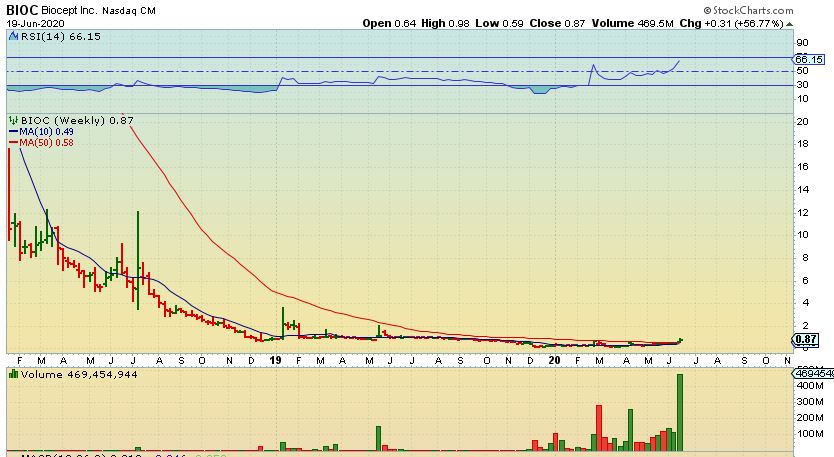
It pulled back to 87 cents already, but I do think this also has longer term potential. This weekly chart is showing that the break out is very real. That is a very long base with excellent volume.
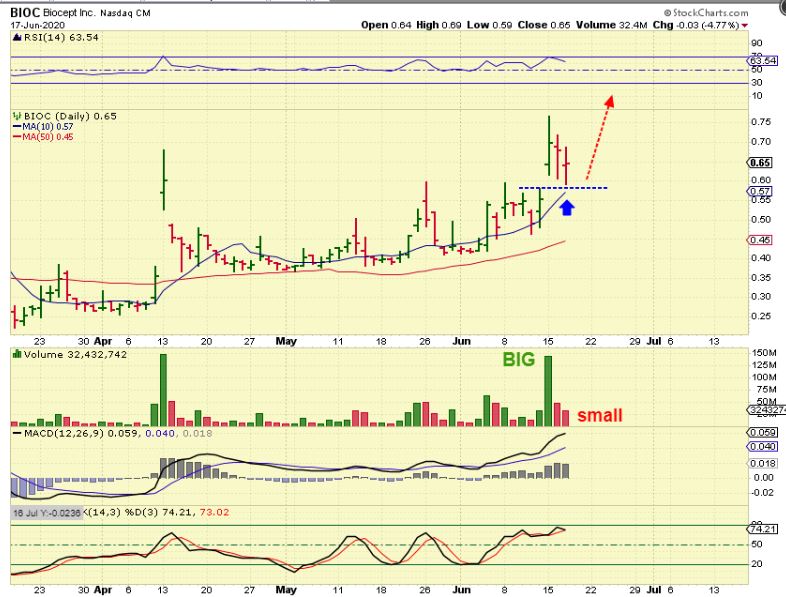
BIOC BUY BACK – I posted this chart and discussed buying a dip to the 10sma on the pull back before it exploded higher. Well…
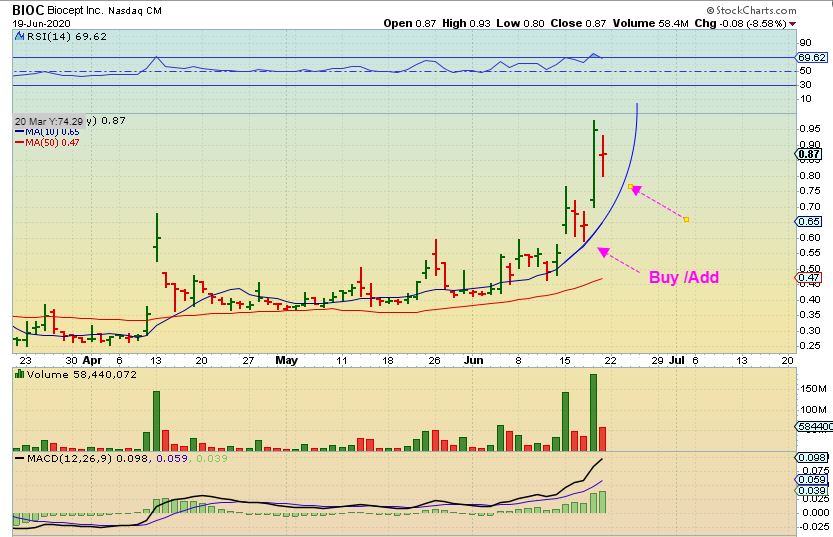
I’m hoping I’ll get that chance to add a bit lower again this week. If not I’ll have to find a way back in to full position, because that weekly break out chart looks very promising long term too.
.
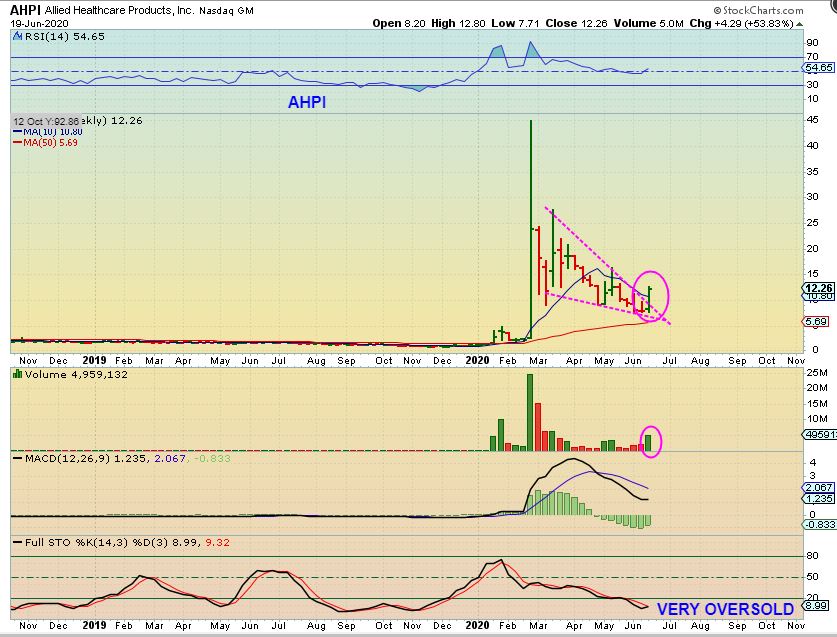
Friday I discussed buying AHPI- VERY FAST MOVING, SCARY AT TIMES. I showed how I bought it, it dropped, it rocketed higher, it crashed, and then rocketed higher again on this intraday chart.
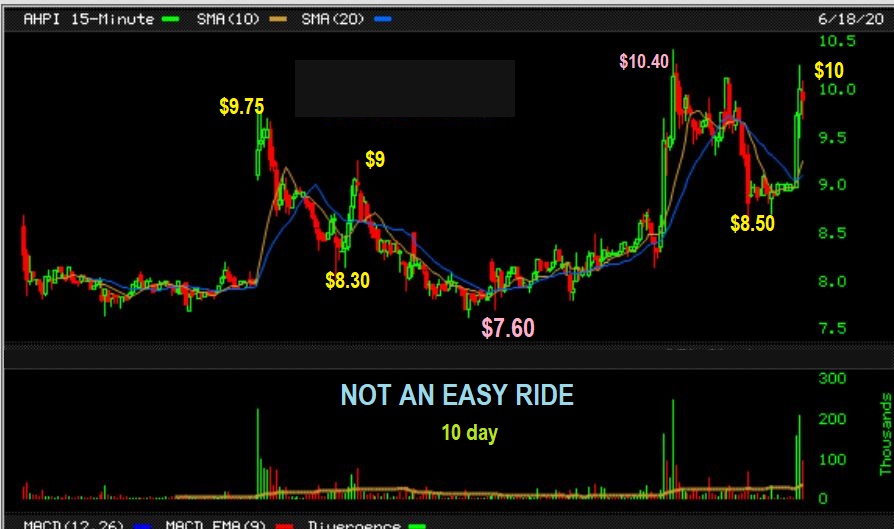
AHPI manufactures and distributes respiratory products and when COVID struck , it rocketed from $2 to $40+. I checked it out, It has done NO reverse splits, that was just a pure run up. Just an amazing rocket ride that has now consolidated for months into a somewhat tighter consolidation. Well…
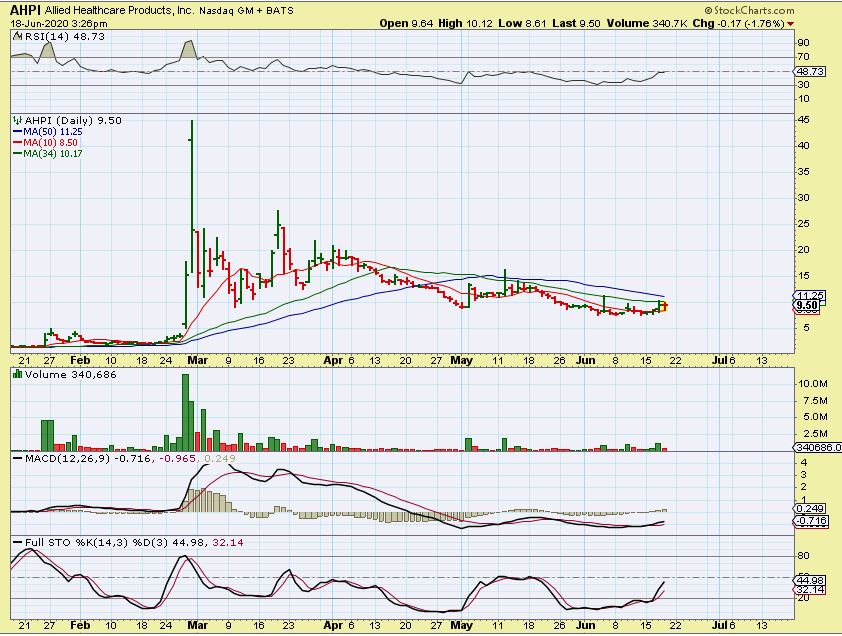
AHPI busted out from that consolidation Friday and was up over $12 with 24% Friday alone, and 53% for the week. With that, it remains extremely oversold on a weekly chart? With a possible Spike in Covid cases as the various US States open up and ease recommendations, I am now thinking that this may run to prior highs. It is still a VERY difficult ride.