IS THIS “IT” ?
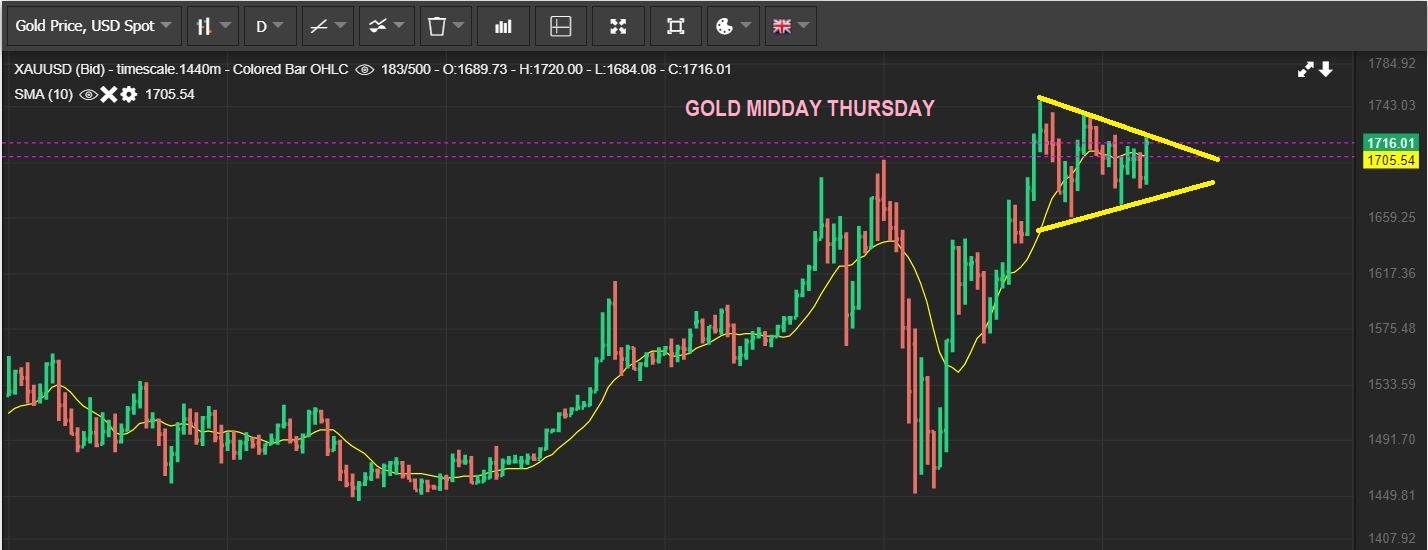
I captured this chart of GOLD midday. As mentioned in Yesterdays report, ‘Cycle counts are late and we are at the Apex, so it is just a matter of time‘…
.
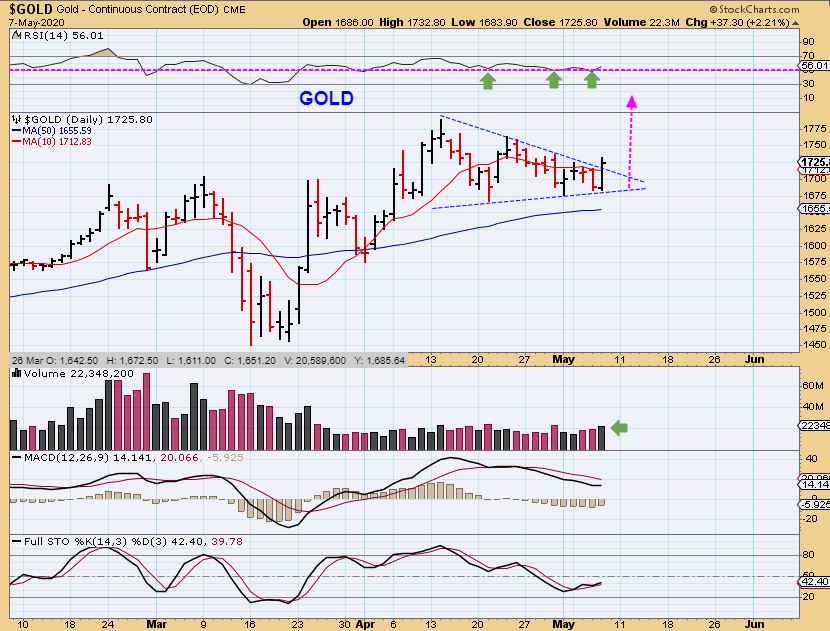
GOLD – So Stockcharts shows a break out and close above the 10 sma , other charting services don’t show the trend line break, but we’ll just say that this remains a very bullish set up. LETS GO TO THE TIE-BREAKER…
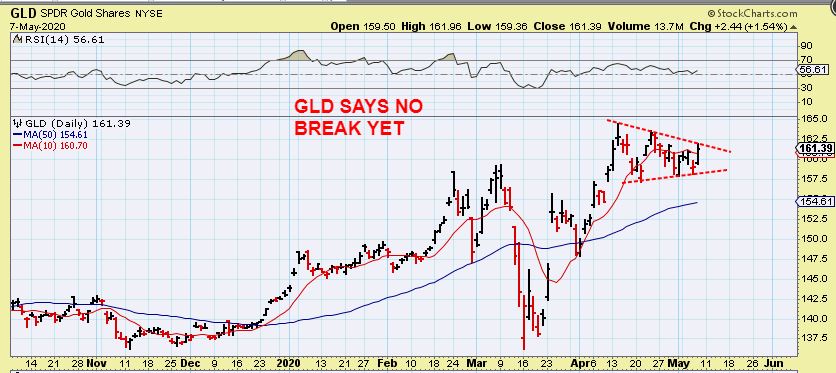
GLD – The tie breaker says no break yet, but this is a beautifully Bullish Chart.
.
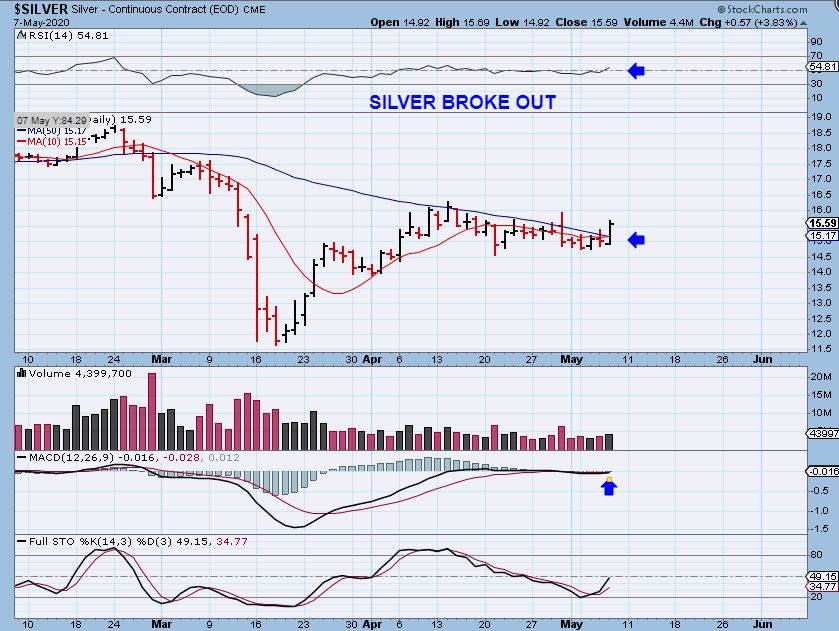
SLV I captured this break out midday, so Silver may be ready to take the lead. Look at the 1/2 day volume.
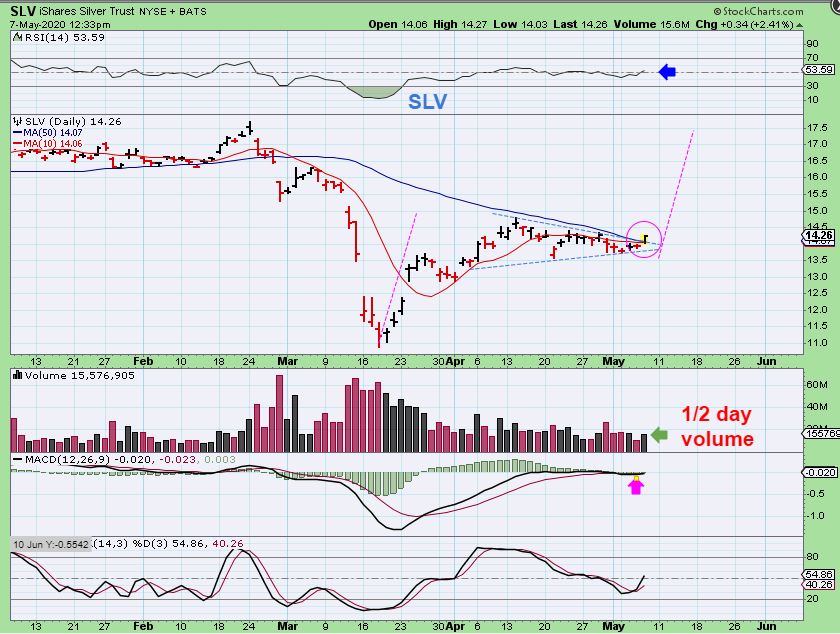
So obviously SILVER did break out. It closed above the 50 sma and that is what I said I was looking for. The price target from here is near $20, and this little move caused USLV to move up 11% . I mentioned in our live area that I sold some energy stocks and HL in the A.M. and added to USLV and JNUG. NOW WE JUST NEED SOME FOLLOW THROUGH.
.
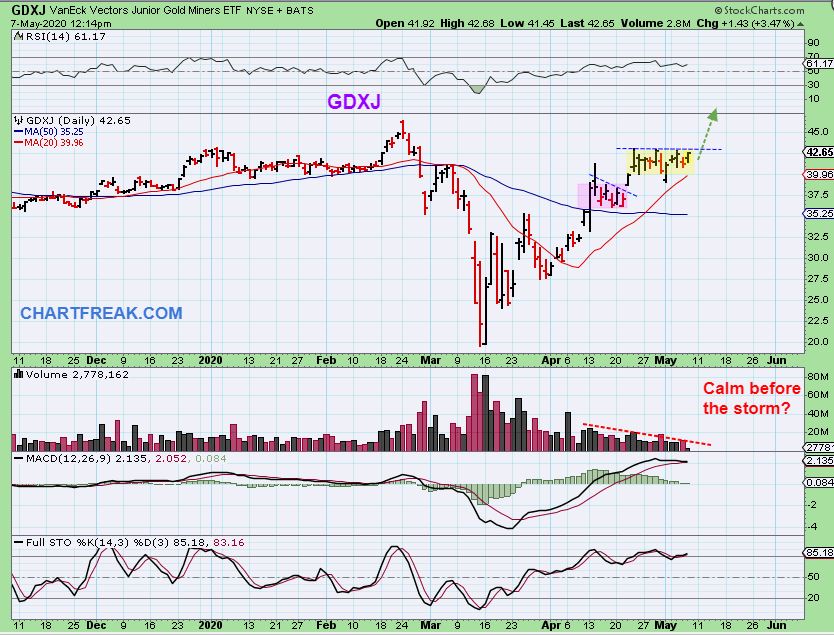
MIDDAY GDXJ – we were about to break out, so I tweeted this…
.
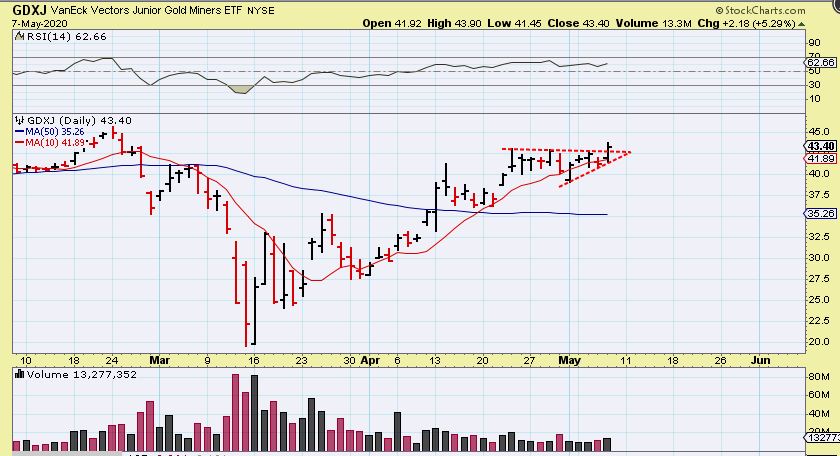
GDXJ – We do have a break out from what looks like a flat topped wedge. Bullish.
.
.
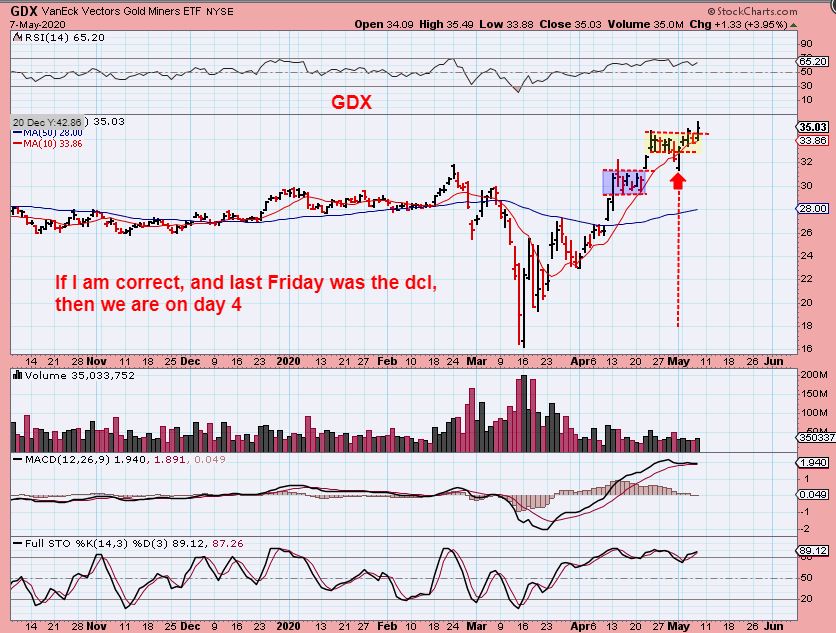
GDX broke out too. It CAN run higher from here after that consolidation, but I’ll discuss SEVERAL DIFFERENT IDEAS below. Before I discuss many things below, I just want to say that this is what I have been calling for, this is bullish, so this should be ‘IT’. We should be in the 2nd daily cycle for Miners. Now I need to discuss many other things…
.
If you were in the Live area yesterday, you saw that a few readers were doubting the action. Some mentioned that they sold the Pop. Others then followed and lightened up, and I then got emails where people were saying-
1. They also sold the pop too, in case its a false break out
2. They too are worried that things are ‘too extended’, and
3. They are selling to avoid giving up those gains, etc.
4. Some guy on twitter said that we need a much deeper pull back before we can go higher. (What?)
.
If you sold, That’s OK , as long as you lightened up and didn’t sell everything. You can always get back in later hopefully.
For me, I have been discussing this as probably DAY 4 of a new daily cycle for Miners. I have been waiting for Silver to break out so that I can go heavier into USLV. I am watching a Bull Flag/ Triangle in Gold to break that consolidation and start the next leg higher. So when I was asked if I sold on Thursdays pop? This is exactly what I have been saying that I am looking for to be Heavily invested. Because of that concern that had people selling, I now feel the need to discuss “Several Things”.
When we broke out yesterday I thought that Fridays report was going to be short, sweet, & simple, just basically all ‘stock picks’ and Buying opportunity for Miners , but its time to review where we are again and what to expect 🙂 So…
.
BY REQUEST AND ‘FOR EDUCATIONAL PURPOSES ONLY’: “WHAT IF THIS DROPS BACK DOWN FRIDAY? I SOLD THE POP BECAUSE OF THAT CONCERN.” Well, I DID EXTRA RESEARCH AND NOW I’M GOING TO SHOW YOU ‘MANY CHARTS’. THE GOOD, THE BAD, AND SO ON…
.
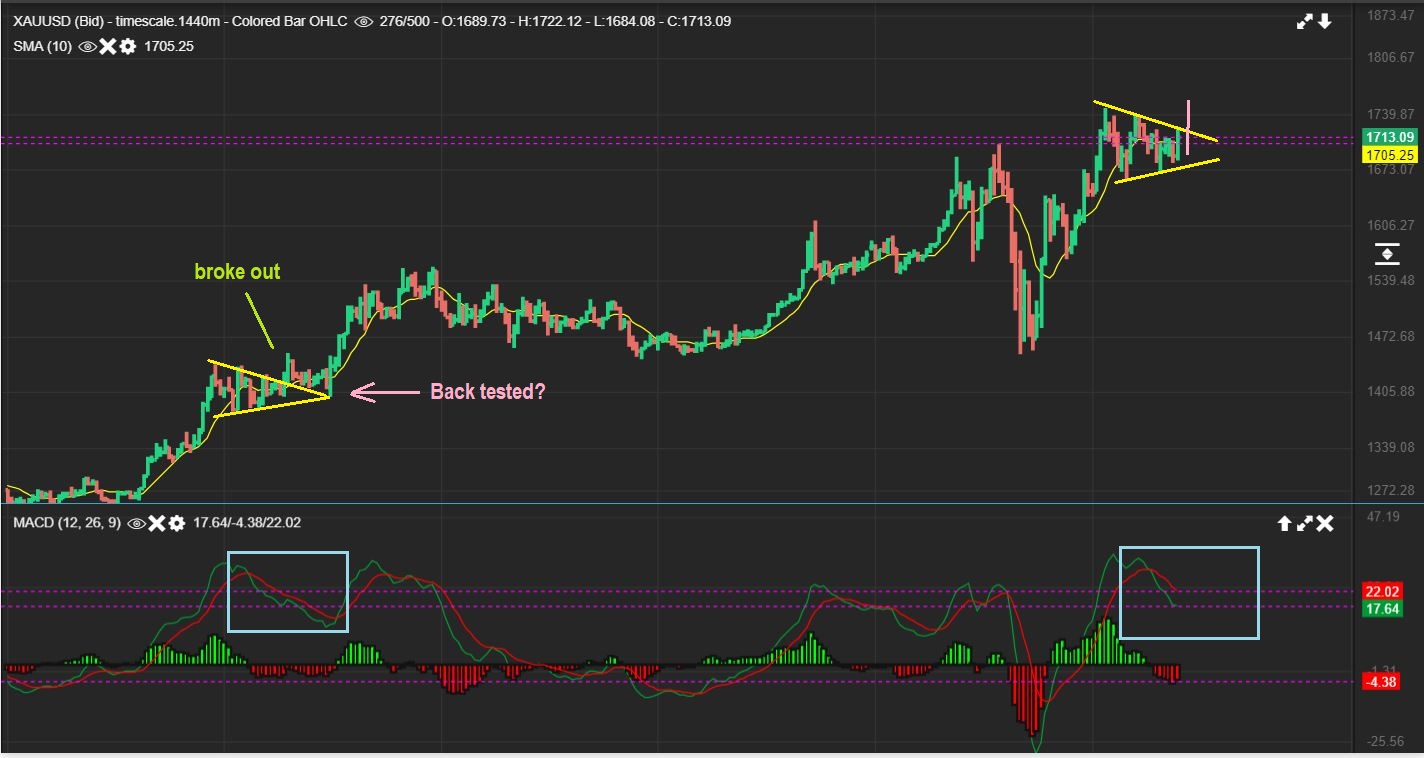
GOLD broke out in that 2019 run, and that is bullish, but notice that it
– Broke out, back tested and then ran higher. So if we stall here or dip on Friday or Monday, I am afraid that some will sell everything. I hope this helps everyone to see that a ‘pause’ after a break out is fine.
.
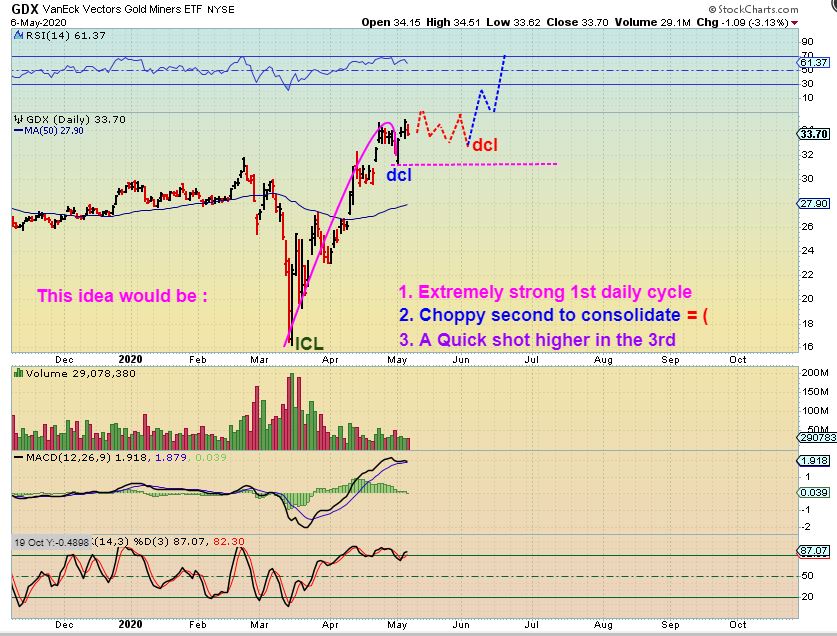
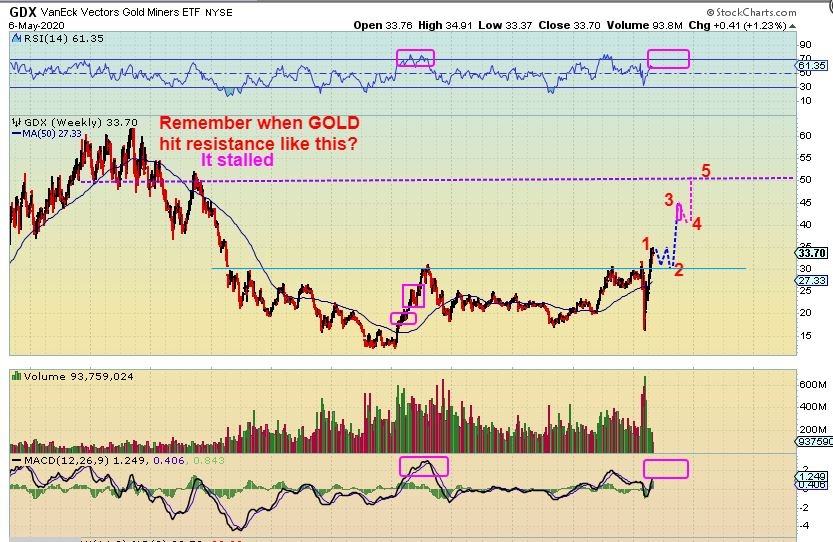
WHAT IF GOLD BREAKS OUT & STALLS? : Let me just say that it is possible that GDX chops sideways in the 2nd daily cycle. THAT isn’t bearish. I cannot say 100% that we will just rocket straight up higher, though we could. We could also have the 1-2-3 listed on this chart, so please read the chart. Yes, I can see this happening if we don’t rocket higher, but it isn’t bearish, and I’ll explain why…
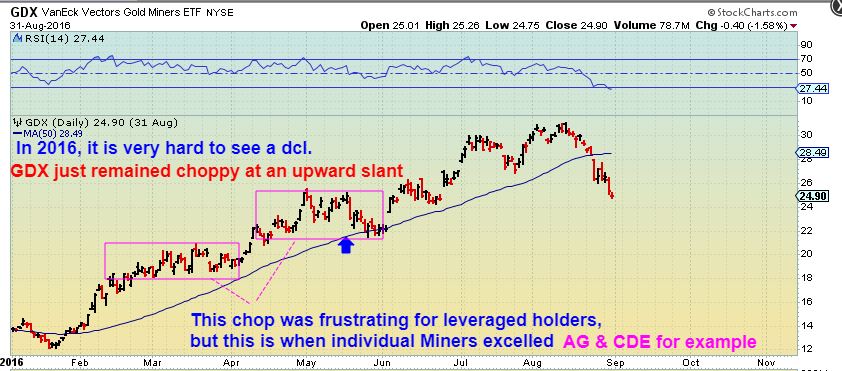
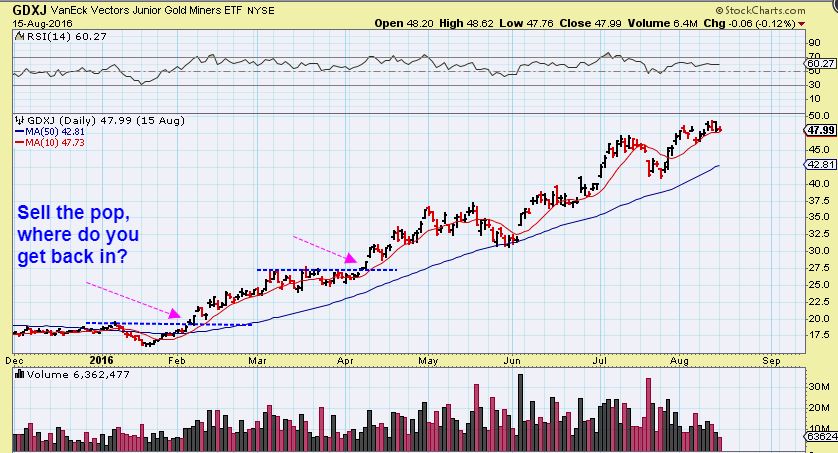
Did you love the 2016 run? Many missed it and sold out too early due to the choppiness, but here at Chartfreak, I kept saying “Do not sell out to wait for a pull back, these set ups can run and leave people behind.” We rode it all the way up. Why? I warned of ‘Short covering rallys, panic buying, etc, and I reviewed many charts and knew what was happening was Bullish, not bearish. Now I’ll do that here for you too. Lets look at 2016, and guess what?…
.
GDX spent a lot of time popping, dropping, popping, & dropping – basically going sideways yet it went gradually higher over time. Look at that first box of sideways chop Feb, March, and April 2016. WHAT IF WE JUST CHOP SIDEWAYS LIKE THAT IN THIS 2nd DAILY CYCLE? …
.
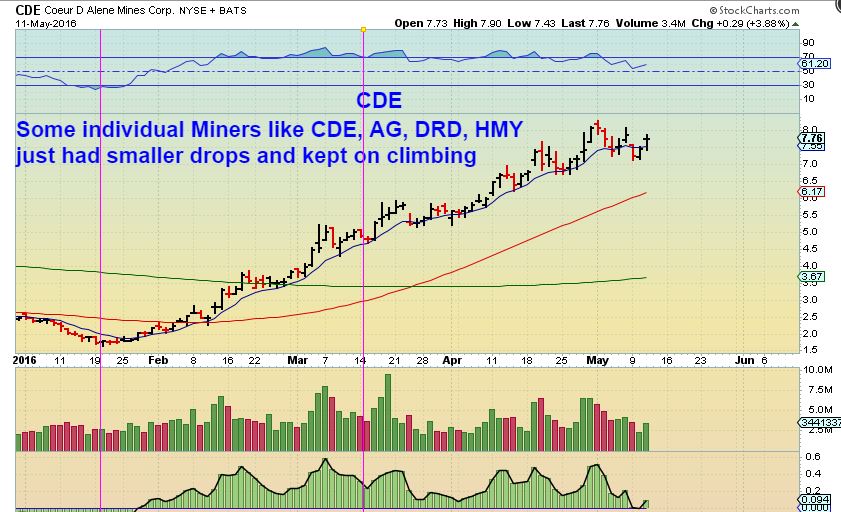
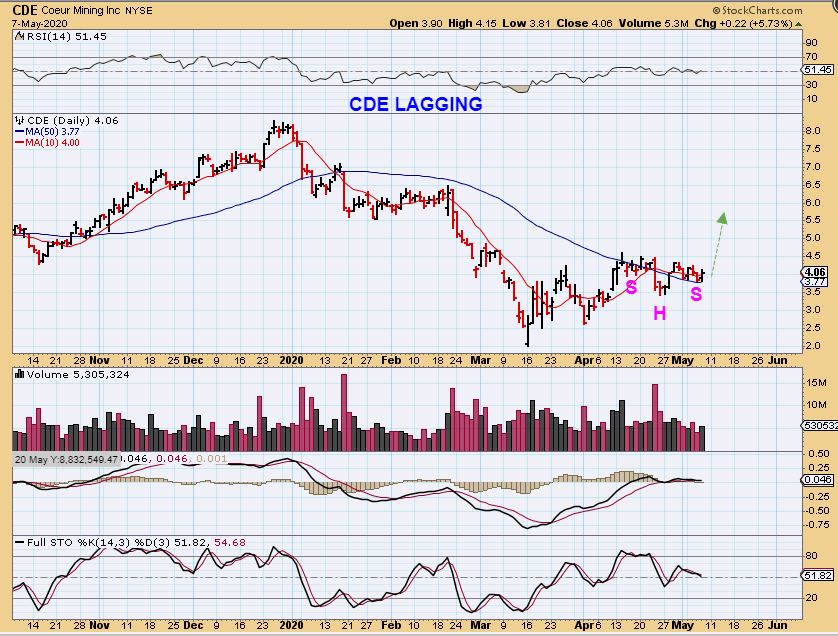
During that choppy box , Several Individual stocks (like CDE) ran away. They were strong during that choppy sideways GDX action. CDE barely broke the 10sma for months! I NOT WANT TO MISS THIS IF WE ARE ENTERING THIS PHASE. This was only 1/2 of that run ($1.5 to $8.00) , It then went on to $16!
.
MORE STUFF
.
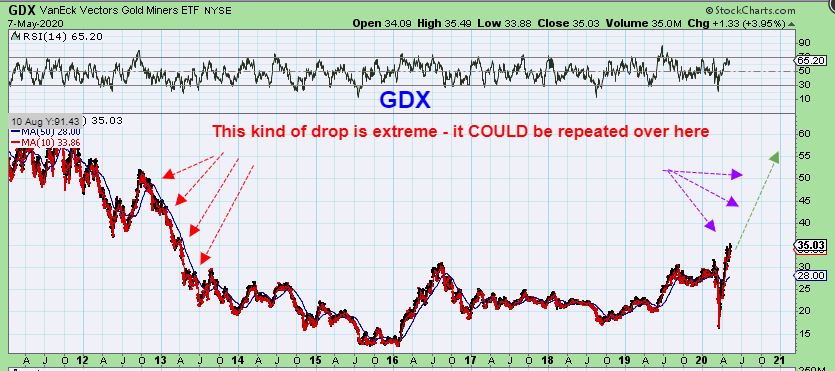
Even if we got a 2nd daily cycle of chop, look at the 2016 chop when you step back. It doesn’t show up in the big picture, the run looks straight up. I want to stay focused on the big picture, where over time we will still see GDX complete that big move higher.
.
LAST WEEKEND: GDX& GDXJ can still just tear higher as shown here in the chart that I put in the weekend report.
.
I did take a look at some technicals on that 2016 run and noticed that during those choppy sideways periods, GDX went sideways to the 50sma. We aren’t close to the 50sma here, but it may catch up over time. A chart that favors the quicker ramp up higher is the next one…
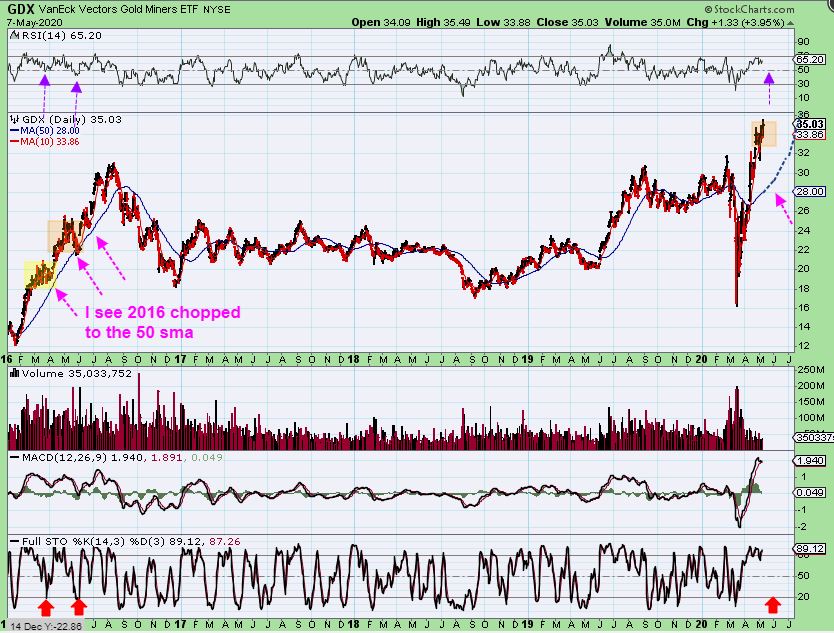
A chart that favors the quicker ramp up higher is the next one…
.
I have posted in past reports that once a LARGE BASE is broken, ‘shorts’ can cover and technical buyers can pile in and chase the move higher. That can cause a CUP to form in the same manner that the left side formed on the drop, rather steadily. LET ME SHOW YOU WHAT I POSTED YRS AGO IN A 2016 REPORT…
.
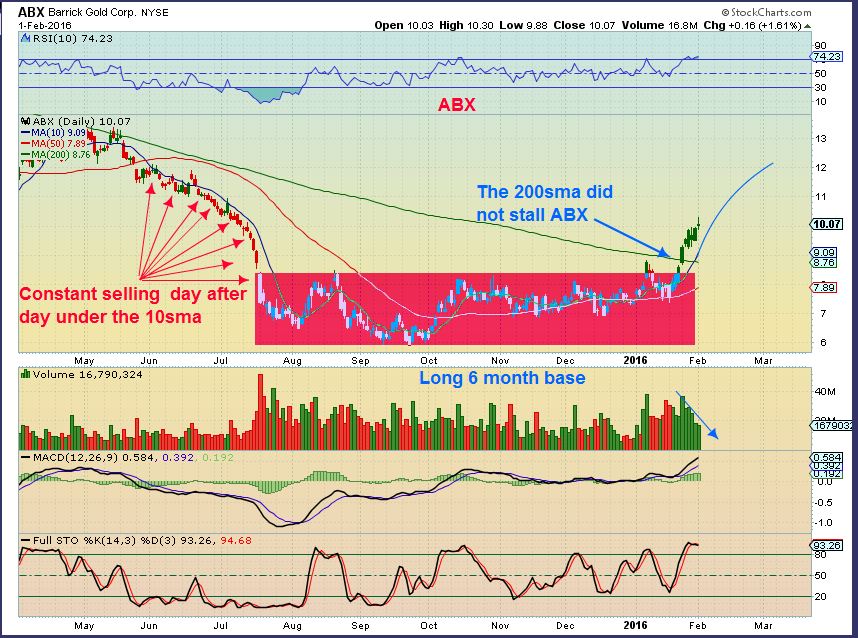
When I recommended ABX & A FEW OTHER STOCKS in 2016 , I said that it would be best not to sell it and try to get back in, because it could ramp up on the right side the same as it dropped on the left ( Steady). It was a BUY & HOLD.
.
Notice how ABX just quickly found buyers that chased it all the way up to the highs. It ran up in the same way that it dropped on the left side. Let’s go back to GDX now…
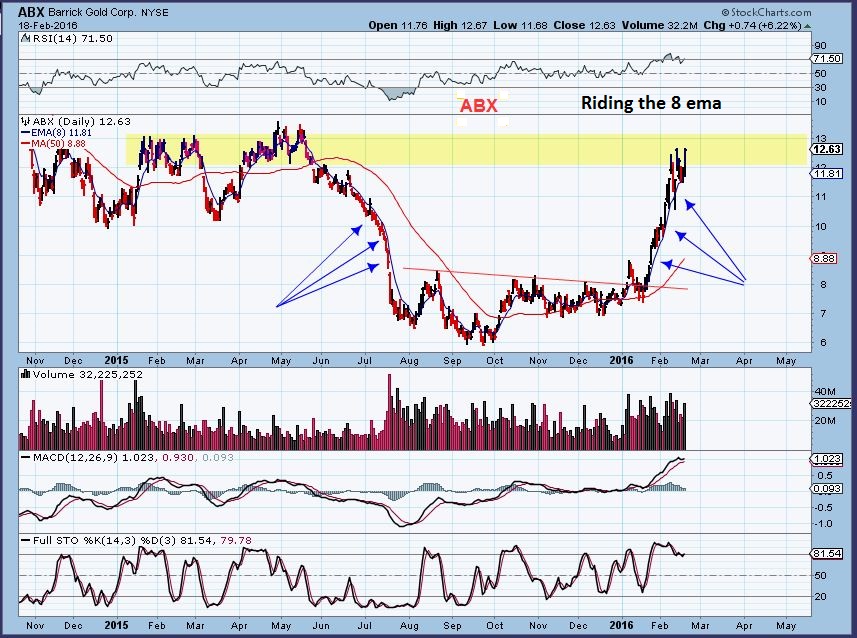
Scroll up to that ABX chart above again, and we can hope for something more like that. It happens at a point of recognition. Buyers see the Bullish break out and want to get in. THIS COULD RAMP UP RATHER STEADILY TOO .
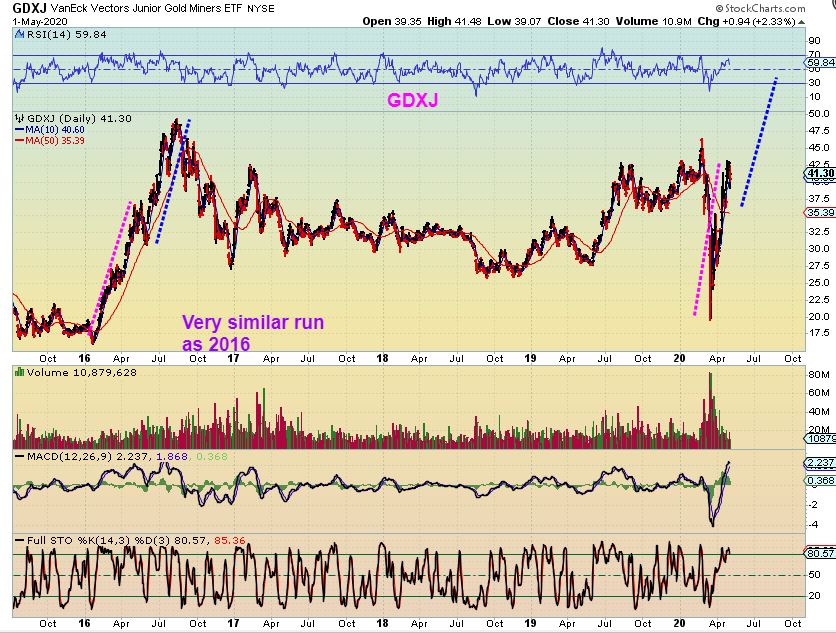
So above I have tried to show you several bullish scenarios that played out differently. In 2016, everyone seems to think that it was just a straight up rally, and it was in this GDXJ Big Picture Chart, and it ran to extremes as seen in the RSI. Most tops reach that 70+ level, but we aren’t there yet. Now as you look at this straight up rally in 2016, and compare it to now, let me zoom in on GDXJ too…
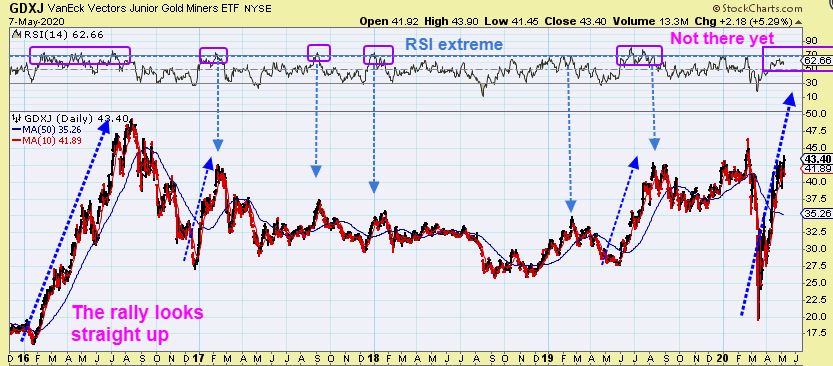
That doesn’t look as ‘straight up’, right? The Bull was choppy and shook people off as it ran away with out them. Trust me, I remember many waited to ‘buy that dip’, and that dip never came deep enough for them to get on. This run was just choppy and higher. Look where I drew arrows at break outs to new highs too. It was 2 days higher, and then a pull back above the break out, but no deeper than that.
.
So Yes, we could Pop and then drop, but it may just be a choppy path higher, and it may not be a deep enough dip to get back in comfortably. Our first daily cycle was straight up and that left many behind after that deep sell off. We got back in with some miners still near the lows with the railroad tracks signal, but honestly many got left behind. That is what Bull runs can do, they buck riders off and try to leave them chasing. As of Thursday, this looks like day 4 of a 2nd daily cycle to me for Miners, so I have to expect higher price from here. We could get a sudden flow of buyers pushing price higher once Gold breaks out, making it difficult to get back into position. And Silver broke out yesterday, we could see short cover or follow through buying.
.
We’ll see what Friday brings our way, but I thought that Thursdays action was exactly what I have been saying I’d like to see for at least the past 2 weeks. I like what I saw and I’m positioned for more upside. Enjoy your Friday trading!
…
~ALEX
.
I spent a lot of time gathering charts for the above portion of the report, trying to help readers to see that a pull back here or there , or choppiness is to be expected in a bull Run. I wont have time to post a lot of charts below, but I know that the majority of the readers have been loading up already and are even still holding Miners from the ICL, so we are ready for what comes our way. We should be on day 4 for the Miners, and Silver just now broke out, I expect Gold to do so too. I will just post a couple of ideas below and more in future reports.
.
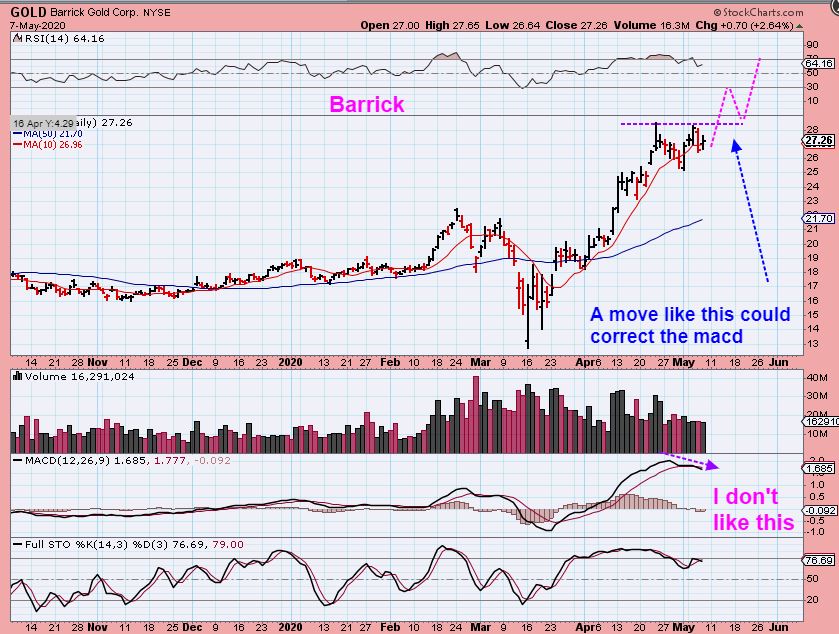
BARRICK GOLD – I will say that I don’t like to see a double top with negative divergence like Barrick, but …
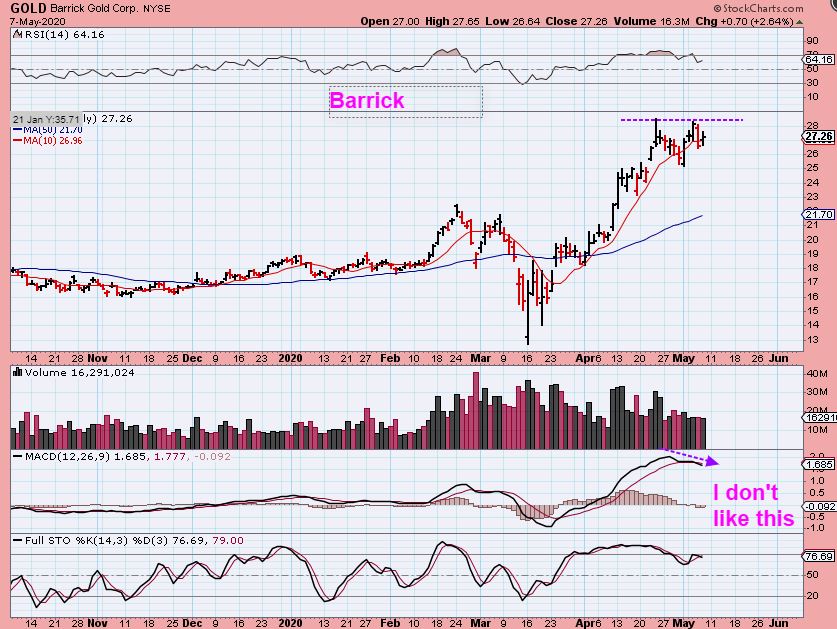
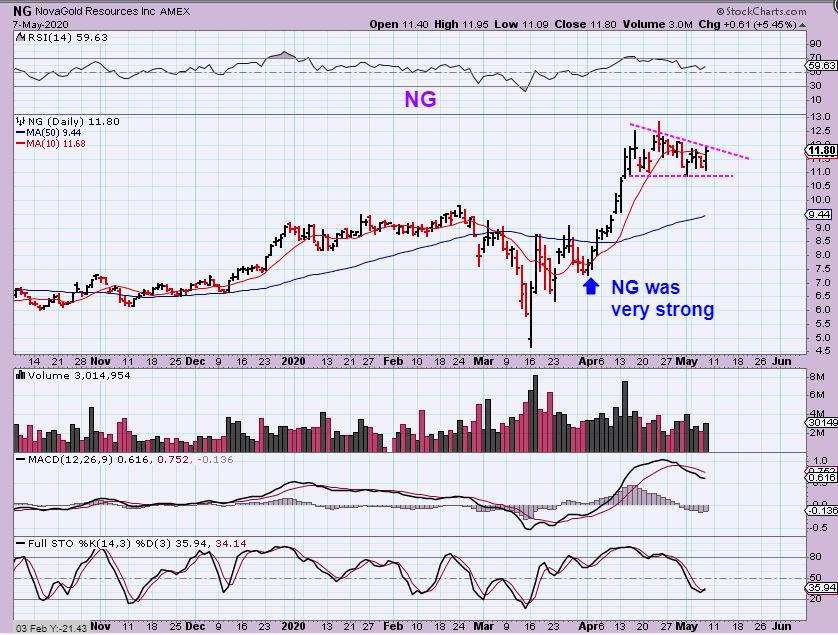
BARRICK GOLD – They can break out and back test to straighten that out, or just remain a bit choppy until it resolves. Barrick had a solid run, so a short rest here is still viewed as bullish. in fact, Barrick may be doing what Nova Gold just did…
.
NG formed a bull Flag after a strong run out of the lows. NG moved roughly 175% out of the ICL, roughly $4.50 to $12.50, and has now formed a bull flag. This has been strong and can make another run when it finishes this consolidation. it may break higher when Gold does. That’s a buy, or buy it here with a stop under recent lows.
.
Just the other day I was thinking that CDE could be the perfect Low risk entry, where you buy with a TIGHT Stop at the 50sma. If it breaks down, you are out with minimal loss. If it holds support, you got perfect entry…
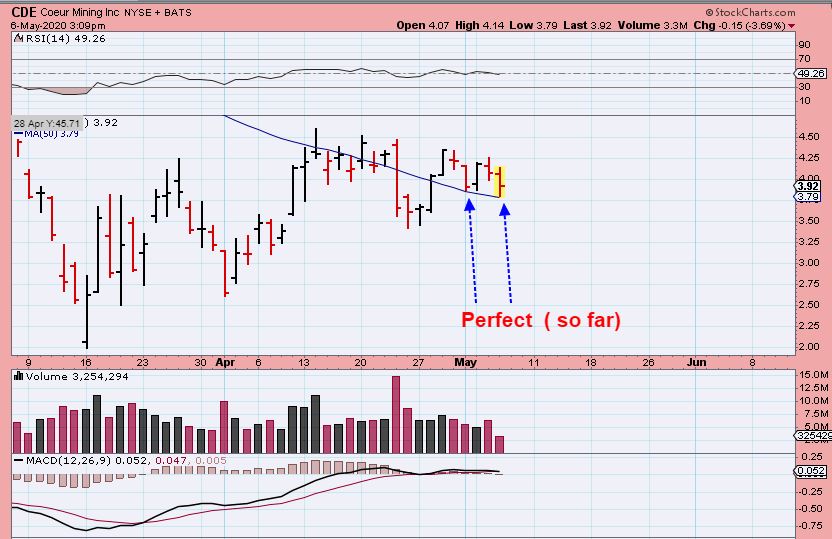
CDE reversed there again Thursday, and this time with Silver threatening to break out higher, I did add to my CDE position. That 50sma held as support so far several times now.

And it could be viewed as a small inverse H&S pattern too. As a lagger, it is still a lower risk entry.
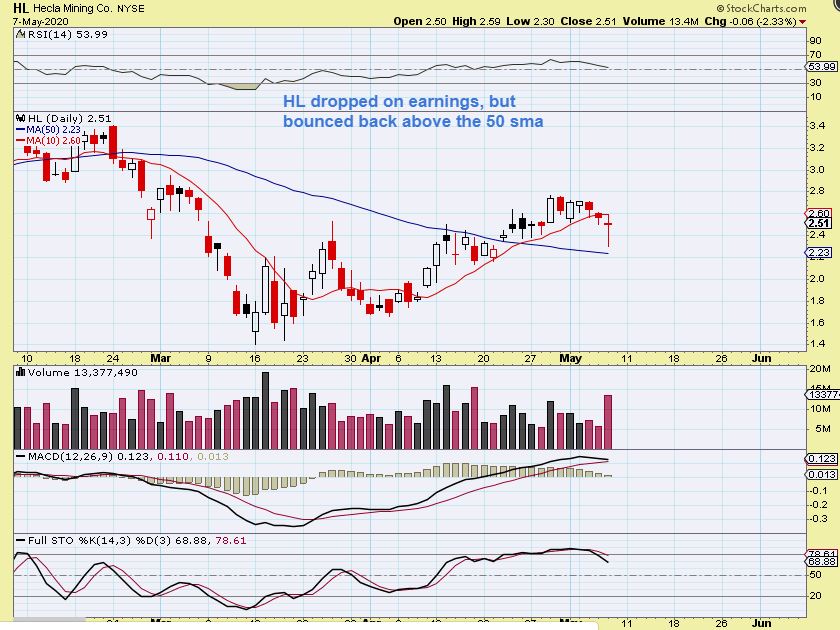
HL dropped and tried to recover. HL has been lagging, but maybe now it’ll play catch up? If it breaks to new recent highs with earnings already behind it, it could get running, and …
,
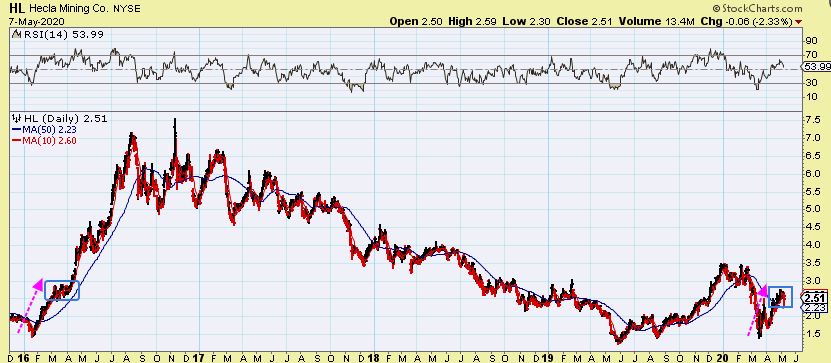
HL doesn’t really look too different from that rally and then sideways chop of the first run in 2016. I’d let it prove itself first though, just in case it remains choppy .
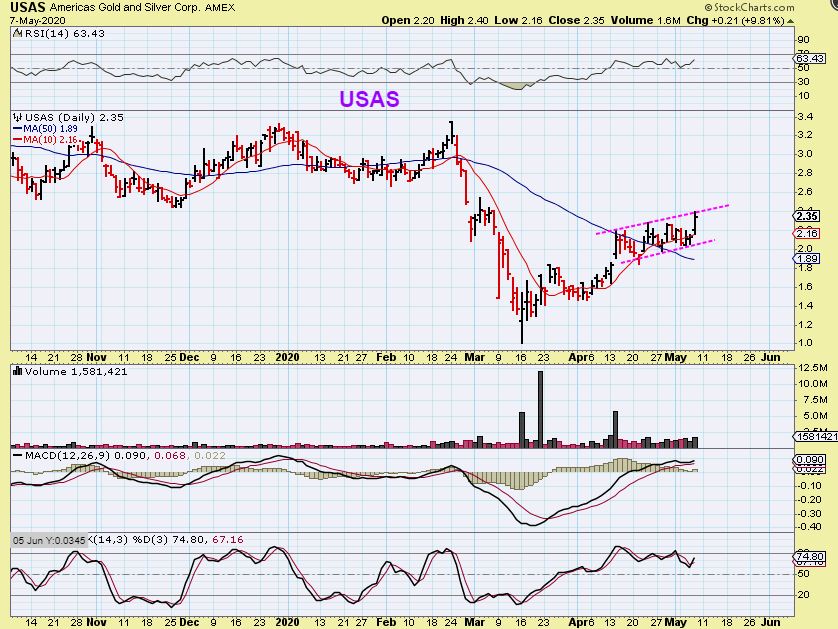
USAS had a nice 10% day, but it may just break higher and keep running. If we have a day of pause or pull back, this could drop to the lower area and be purchased there too.