
Friday May 29th
This is Friday, the last day of the week. I want to just point out what could POSSIBLY be weakness in the General Markets starting to develop. Is it just ‘short term’ weakness? Or could it be the start of a longer term change? We won’t know right away, but if this sector topped here, it would be L.T. ( left Translated). THAT would signal that the markets could be rolling over into a bear market sell off in the 3rd & 4th daily cycles.
For now, we’ll just discuss a few things that I am seeing now, with the thought that this may be either short term weakness or it may be the start of something more. Time will tell, but I personally like to be forewarned rather than blindsided. To the charts…
,
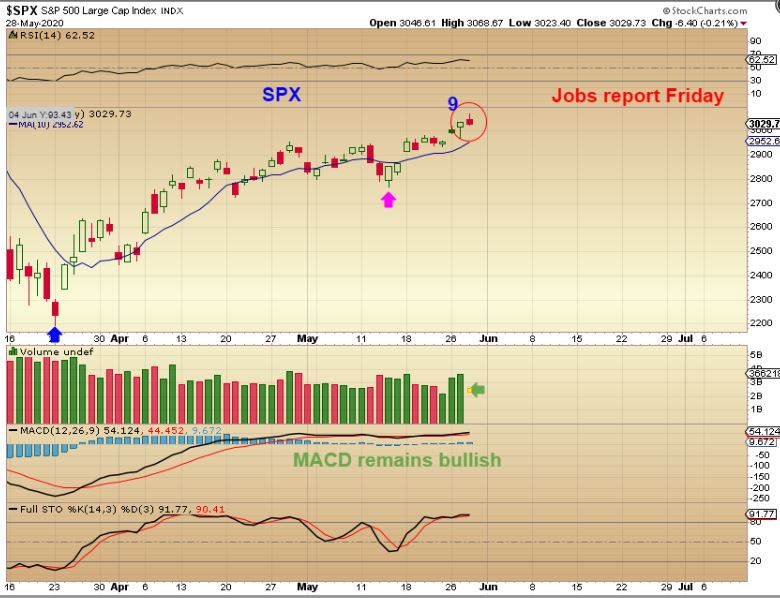
SPX – This is a day 9 pop and drop reversal. The markets actually looked pretty good Thursday, but the final part of the trading day saw a sell off. This is NOT really bearish by itself, so it is not concerning at this point, however…
,
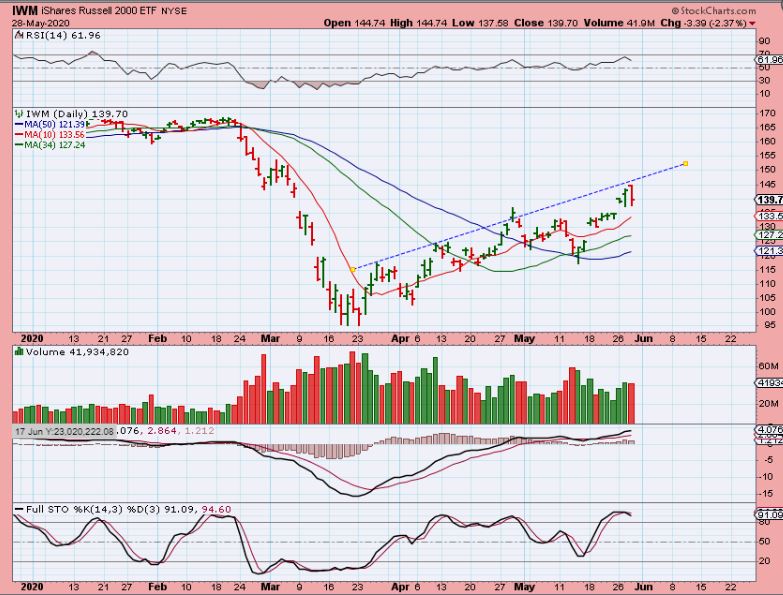
IWM – With the Russell 2000, it does look like a possible bearish engulfing at the top of the upper trend line, so we could get a pull back. Is this going to be a Big or Small dip? We can’t tell, so this alone is not overly concerning either.
,
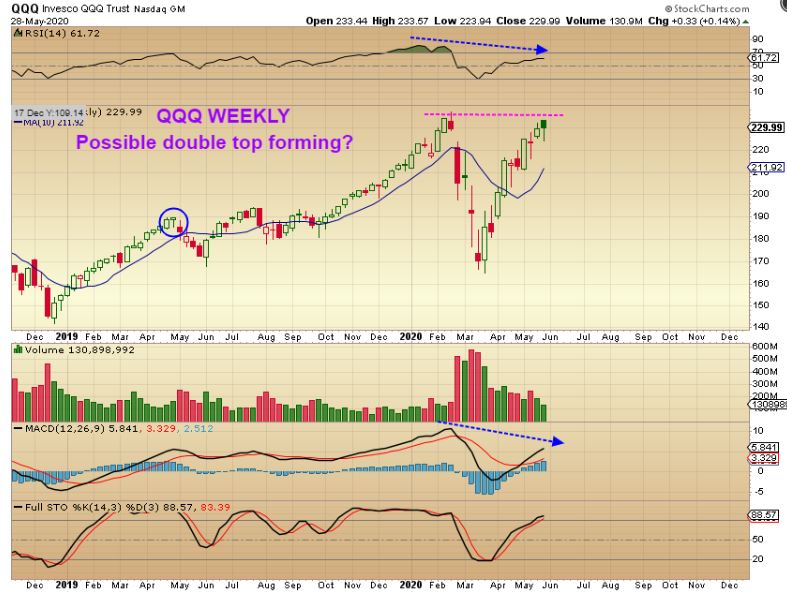
QQQ WEEKLY – Jumping to the weekly chart for the NASDAQ ( or QQQ) and we do see divergence. That looks like weakness in the RSI at the recent highs and a topping candle if the week closes out like this. Is this overly concerning? …
,
QQQ WEEKLY This is not overly concerning by itself either, because a ‘pause’ at the highs could become a handle on a large weekly cup & handle, but we should look at the RSI and consider that the Q’s may not be ready to break higher from here. 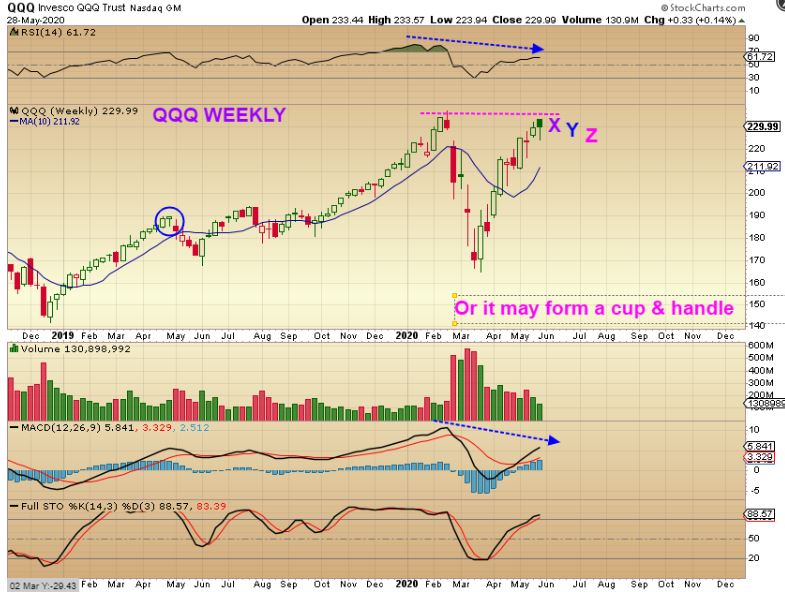
So I looked at a few of the big players…
.
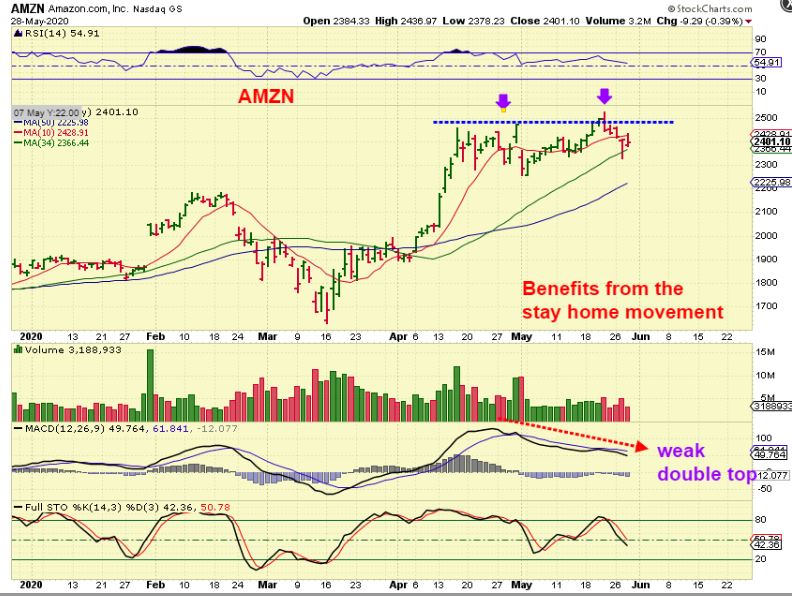
AMZN should benefit from online shopping during a stay at home time period, but this does look like a double top. That MACD is weak and the stochastics is not oversold here.
.
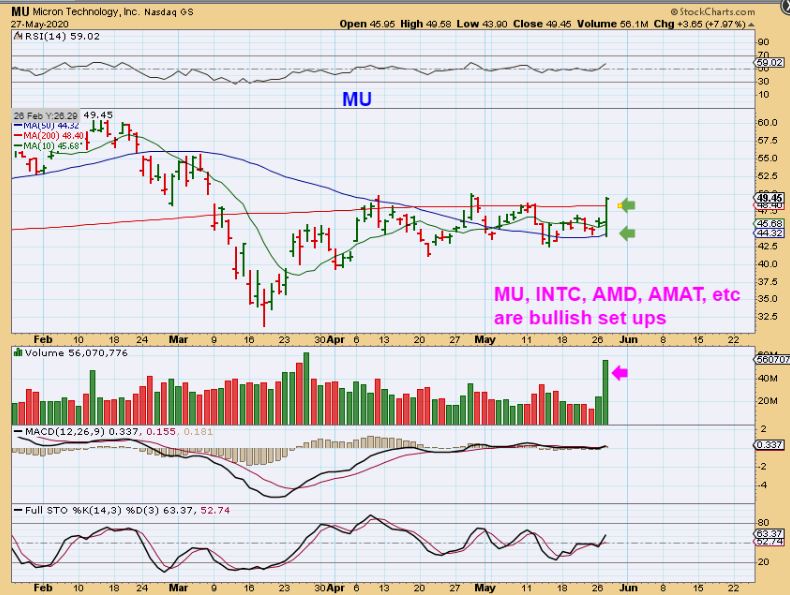
MU -I was pointing out the bullish set up in the Semiconductor sector recently too, ready to break out, but …
.
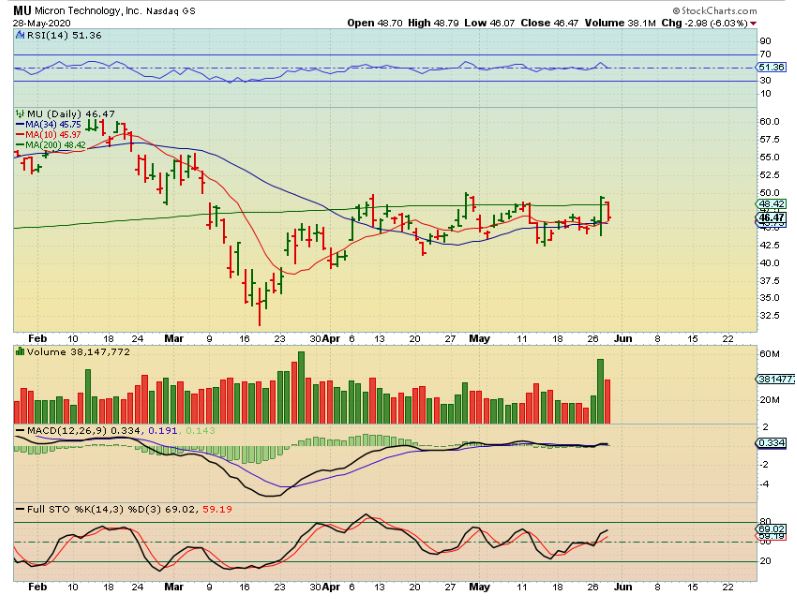
MU –suddenly 1 day later they started to break down instead of breaking out. This in itself is not ‘Ugly’ or bearish, but I’m starting to see weaknesses adding up little by little.
,
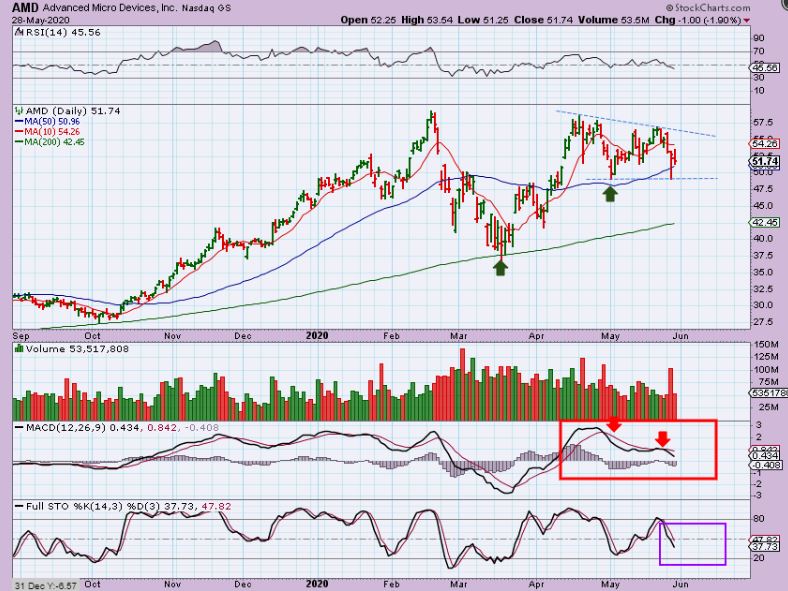
AMD was a cup and handle possibility, but now that MACD is looking weak too.
.
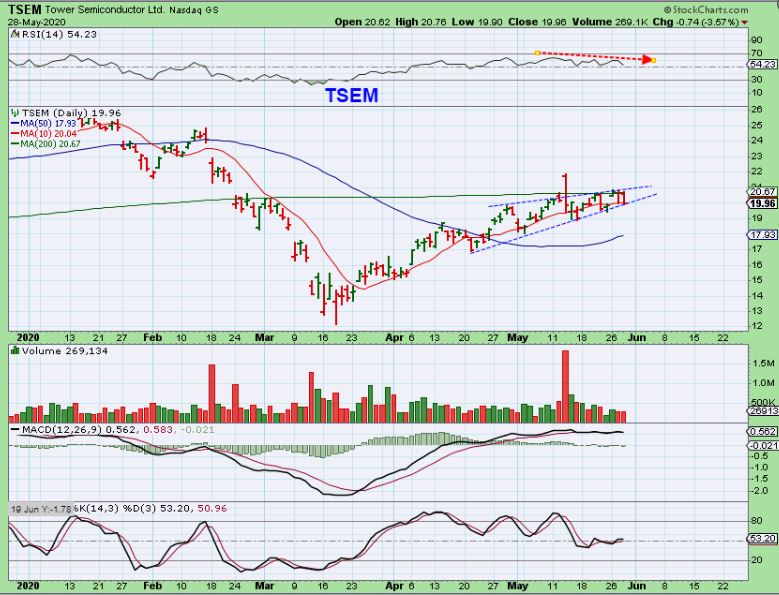
TSEM looks ok, but this could become a wedge that breaks either way too. With those semiconductor stocks unable to find follow through, I looked at the SOX and the bear etf SOXS…
,
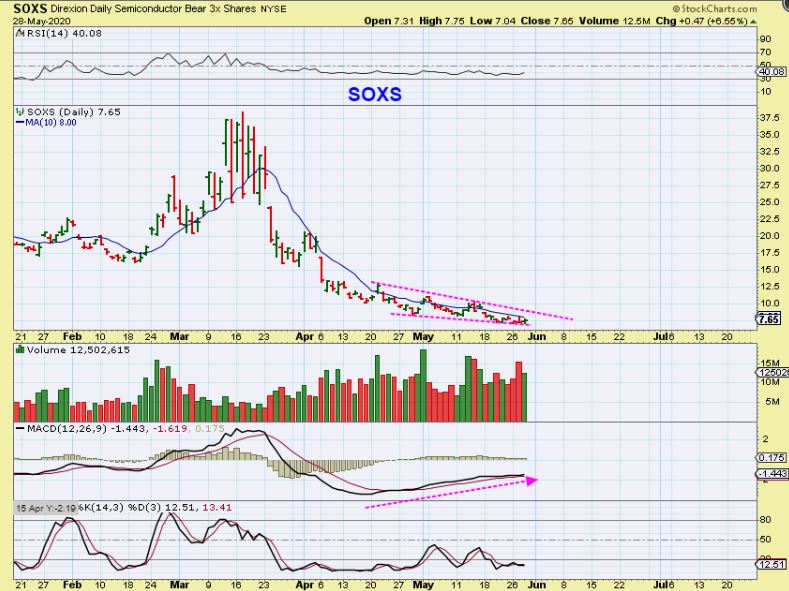
SOXS – This is the bear etf for semiconductors, and that MACD looks strong as price drops into what could be a bullish wedge. This may not be ready to break higher yet, but it looks to be slowly bottoming, and…
,
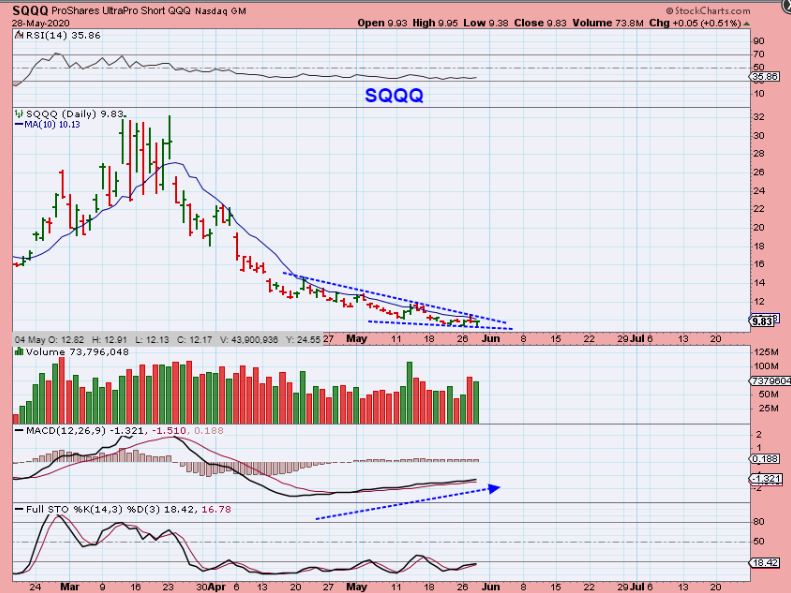
SQQQ -The bear ‘ proshares Ultra short for the QQQ also looks to be bottoming too. The MACD is rising and price is getting tighter in a possible descending bullish wedge. IF THIS POPS, the Q’s drop. Finally…
.
Finally we look at the VIX.
.
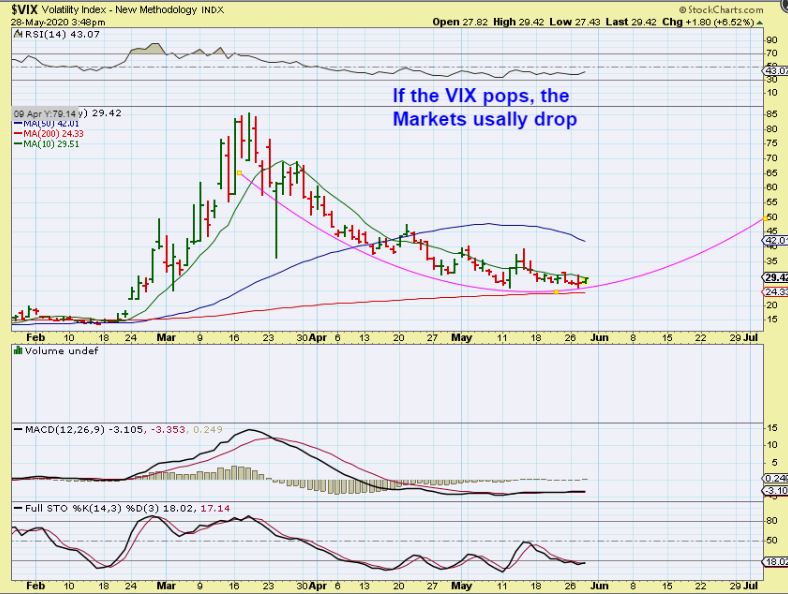
VIX – When the VIX moves higher, the markets usually sell off. The VIX looks to be forming a rounding bottom at the 200sma. It looks ready to rise up the right hand side. If this starts to rise over the next week or so, the General Markets could drop and become L.T. , so…
.
LITTLE PIECES OF THE PUZZLE: So at this point, I just wanted to share with you a few of the things that I am looking at as the 2nd daily cycle progresses. Is this Very Bearish right now? Not really at this point, but these are a few of the things that I start to take notice of as time goes on. If they continue to develop, caution is warranted for those long the General Market trades.
.
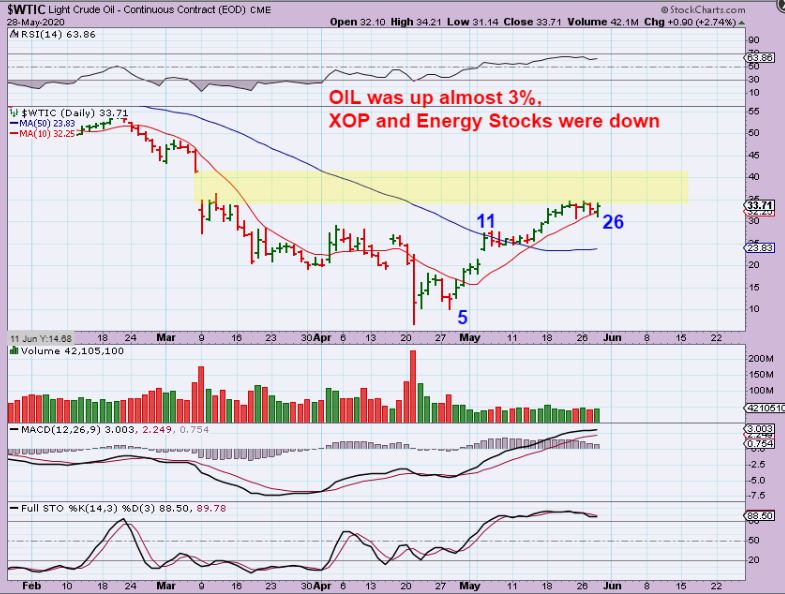
WTIC – Oil looked good Thursday, but Oil / Energy stocks dropped.
,
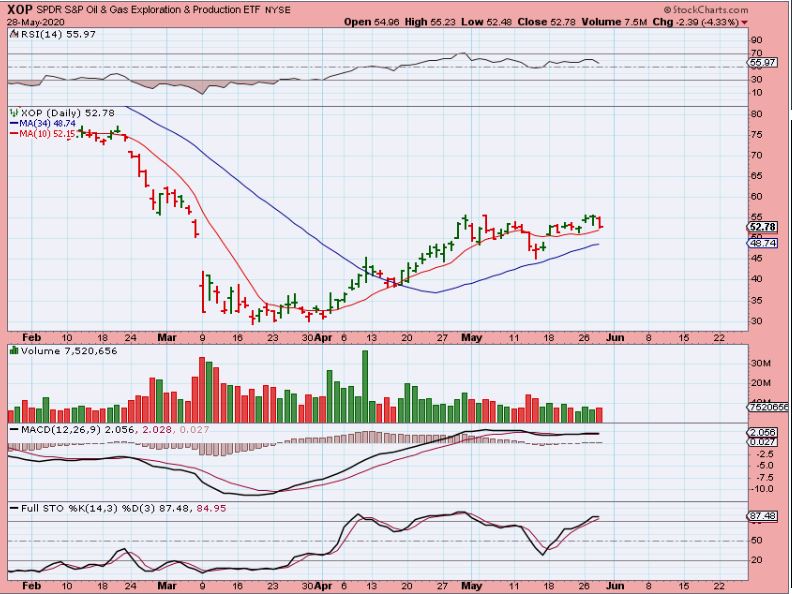
XOP it is possible that they followed the reversal in the markets.
,
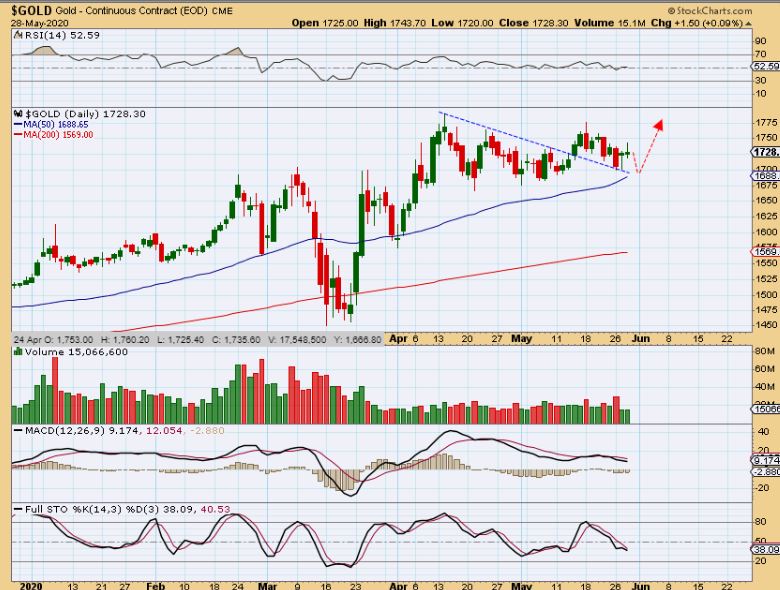
GOLD is holding up , but it didn’t get the upside follow through that we would hope for (yet). This is still Bullish. Do you see how this is bouncing off of the triangle in a 2 week downward sloping channel?…
,
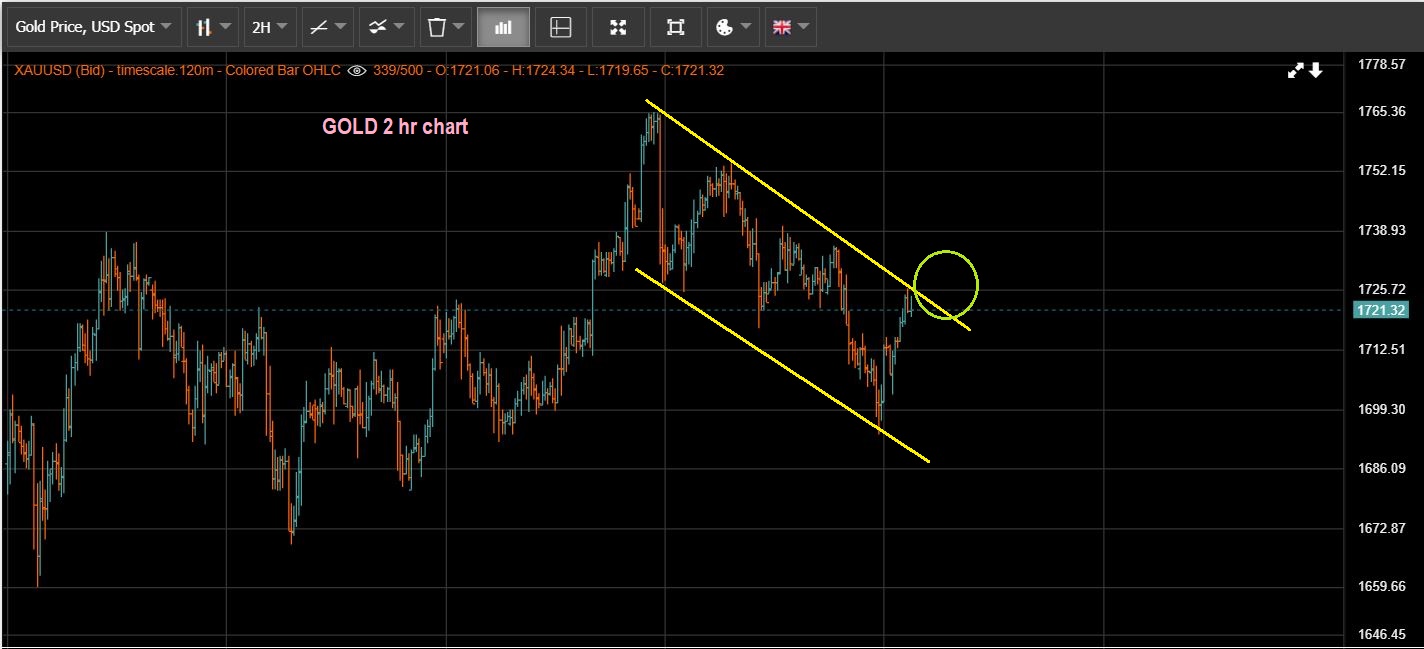
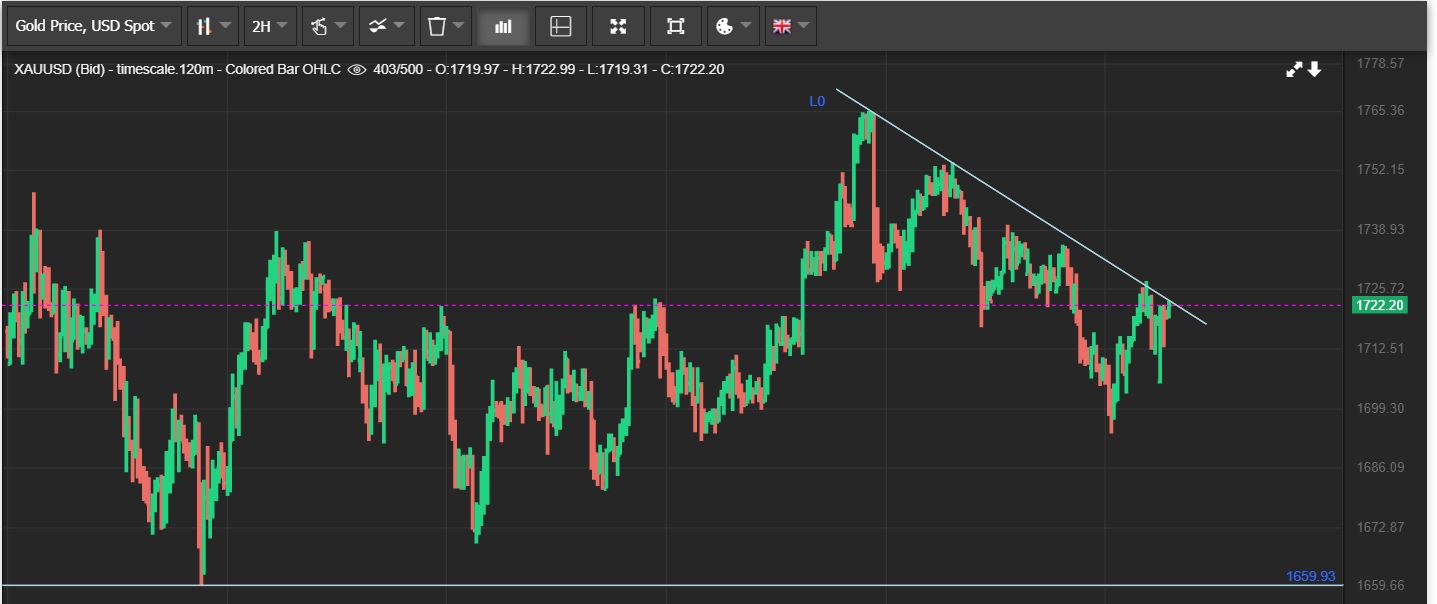
GOLD – On Thursday morning I used the 2 hr chart to show that channel close up. A break out from here would most likely gain follow through buying, but so far price sold off after hitting this upper channel.
.
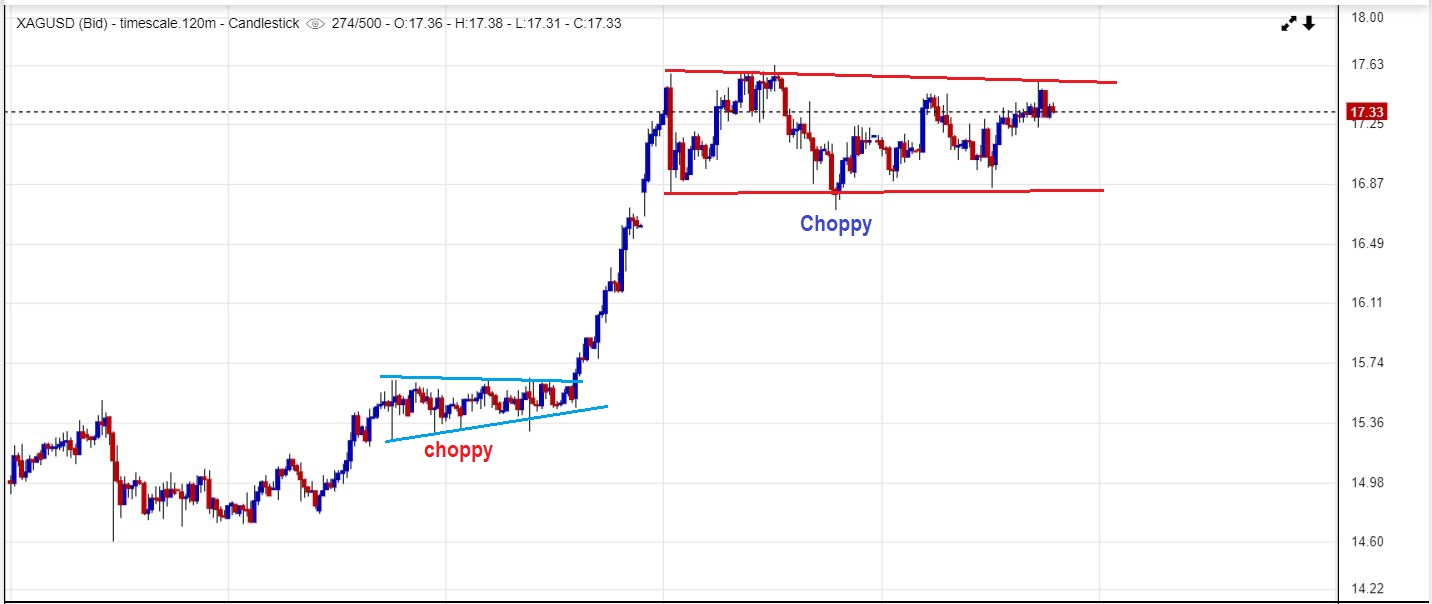
SILVER 2 hr chart – The bull flag in Silvers daily chart can be seen as a sideways consolidation in the Silver 2 hr chart.
.
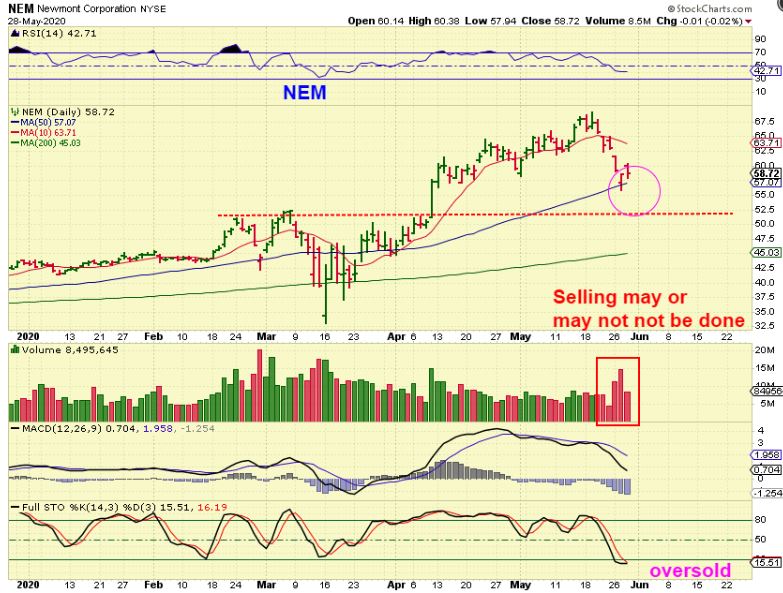
NEM found support at the 50 sma, but it can sell off further to back test the break out. If Gold just breaks out higher, NEM would likely do the same. Buying NEM at $52 would be nice.
,
AXU was breaking higher Thursday, but it sold off into the close. I still like these Silver Miners because…
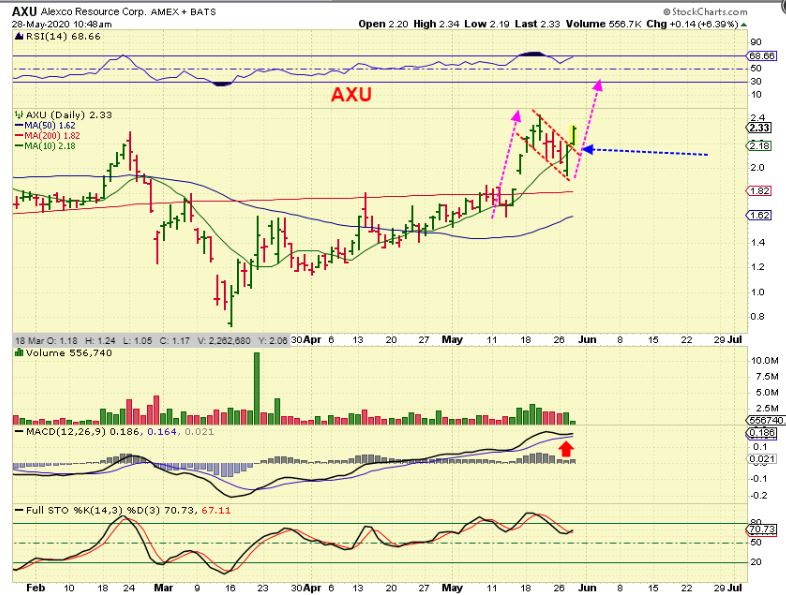
,
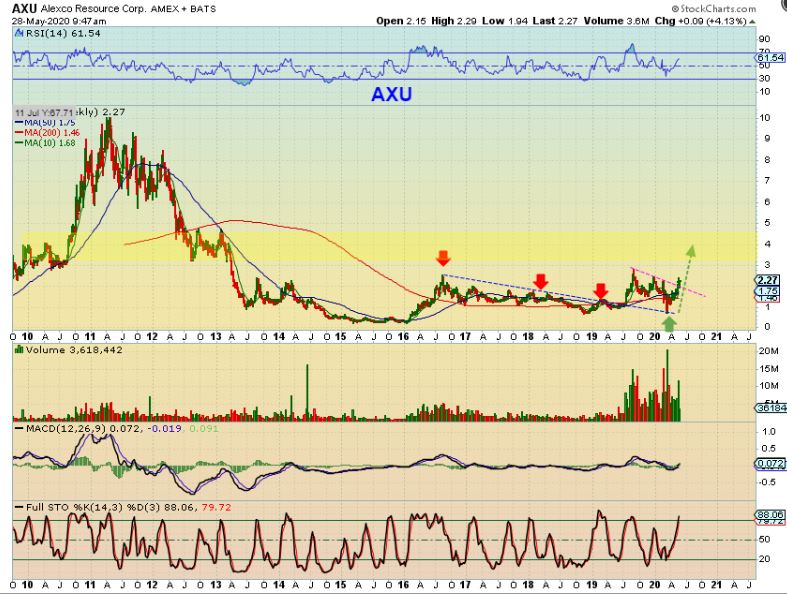
AXU Bigger Picture -The big picture has many of them still breaking from their multiyear bases and the upside potential is excellent. $2 to $10 over time ( several Months) would be very rewarding.
.
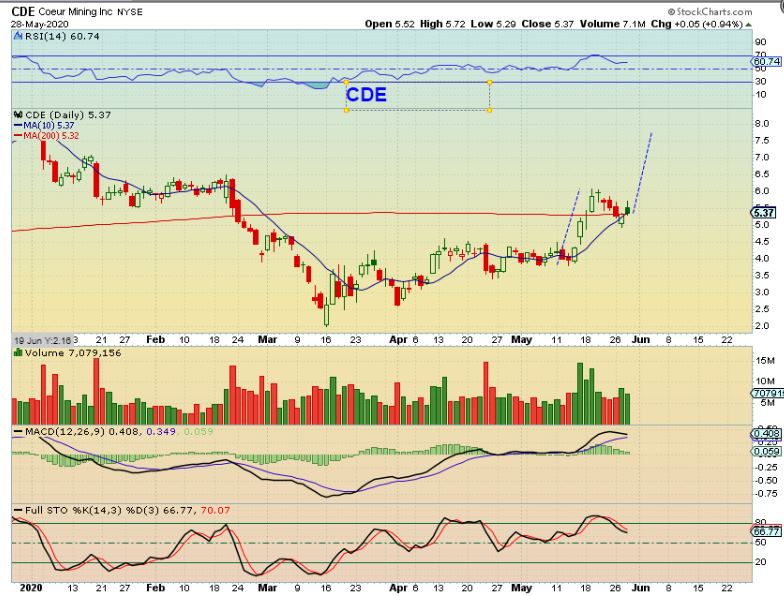
CDE regained the 200 sma, and it should run to the early 2020 highs.
m
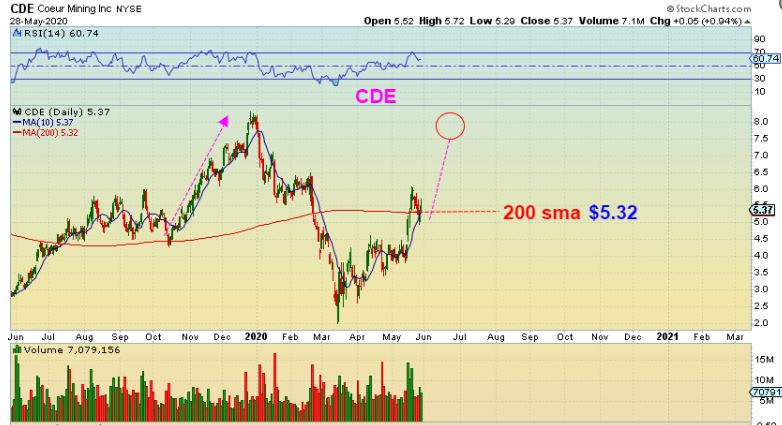
CDE Bigger Picture– The run to $8 would be a 100% move from our BUY POINT down at the 50sma when price was under $4.
,
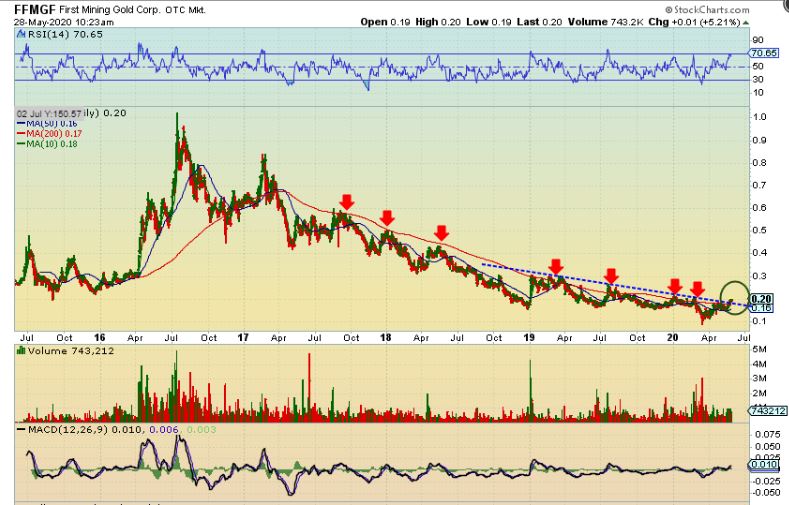
FFMGF – I mentioned this as a long term buy & hold weeks ago. It has climbed from 17 cents to 20 cents, but the potential is much higher if it continues higher. It looks to be breaking the down trend.
.
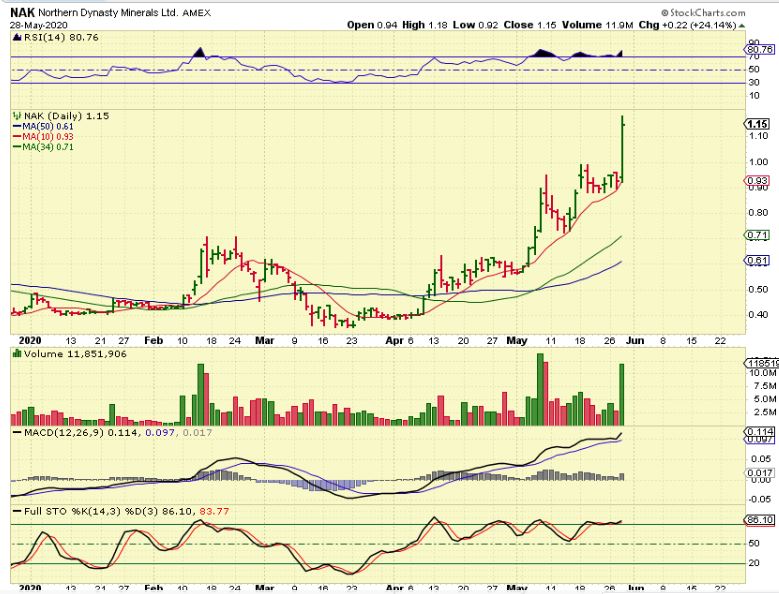
NAK – It is always encouraging to see that we are still seeing Miners with Surprises to the upside 🙂
.
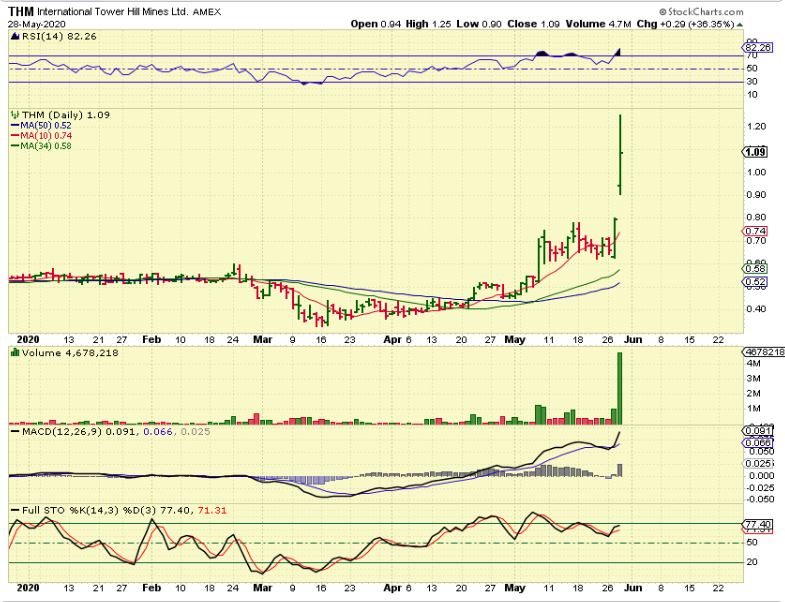
THM put in almost a 100% gain in 2 days. Another encouraging Surprise to the upside.
.
Today is the last trading day of the week, so I always remind everyone that if they want to make adjustments to their account before the weekend, now is the time to do so. I will be watching the General Markets today, looking for signs of weakness or strength, and I’m also interested in seeing if the Precious Metals can finally break higher out of the recent choppy consolidation.
.
As I prepare to release this report after 1 a.m. eastern time: GOLD dropped from that upper line into the close on Thursday, but now it has now worked its way back up to that upper channel line overnight. A break higher from $1722 (Kitco price) would be a bullish break out.
.
Enjoy your Friday trading!
.
~ALEX
.
HTBX – I love these bases and I recommended HTBX here above the 200 sma. This sector ( Corona treatment) was on fire ( NVAX, IBIO, INO, etc)
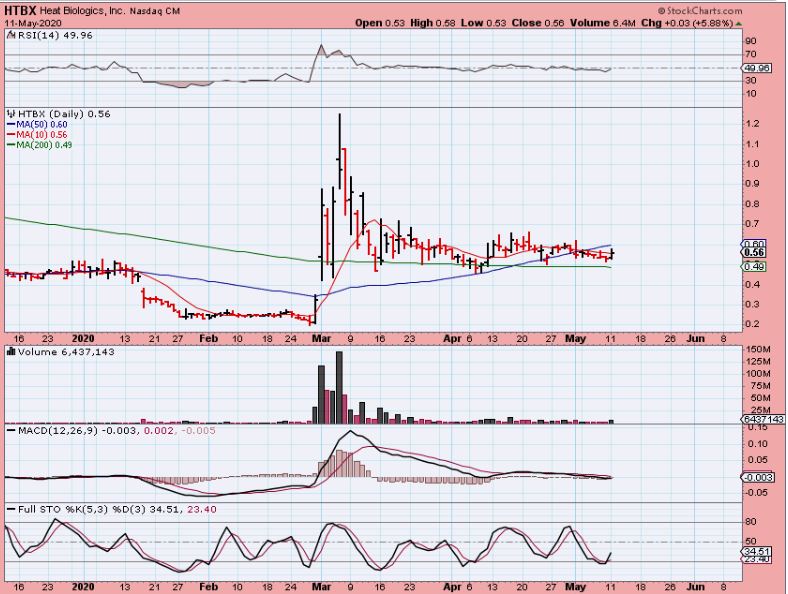
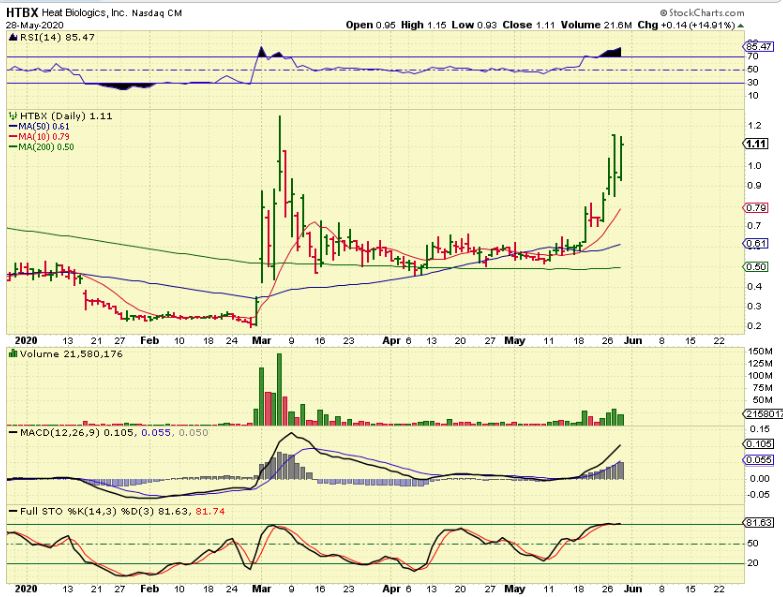
HTBX is now up over 100% from that buy ( I sold mine, but this can continue much higher). See NVAX or
.
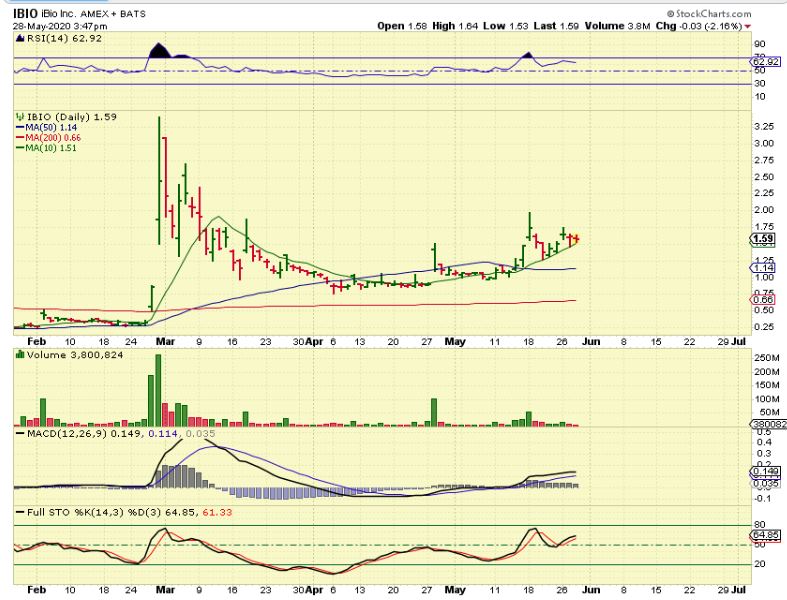
IBIO – So I wanted to point out that IBIO has been climbing and it actually looks ready to go again. It has held on the 10sma. THESE ARE RISKY, THEY ARE FAST MOVERS in both directions , so be careful and maybe start small.
.

