FRIDAY May 22
Today is Friday and it is not only the last day of the trading week, but in the U.S. it is the start of a 3 day weekend. This means that the markets are closed in the US on Monday and you may want to make any final adjustments to your TRADING portfolio with that in mind. Investors will just ride into the weekend with longer term trades in place. 🙂
Let’s look at the charts!…
.
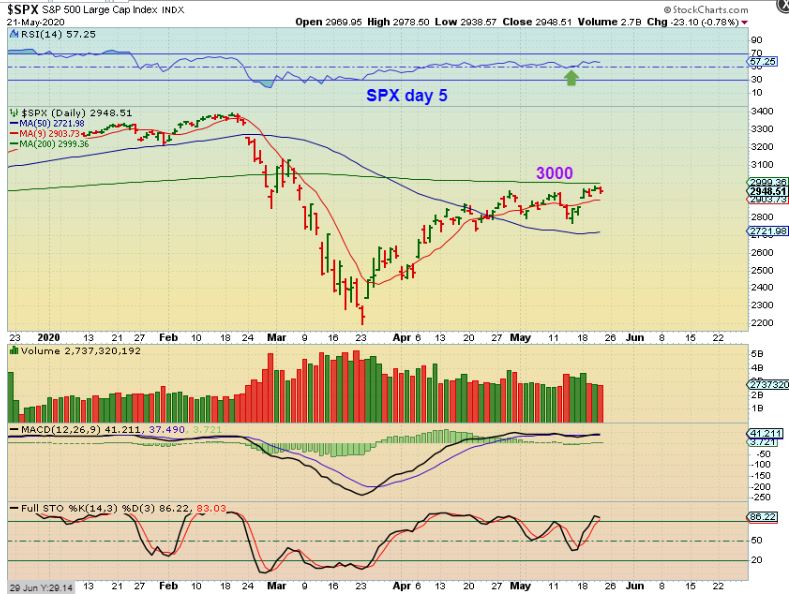
SPX – The S&P is trying to break above that nice round number 3000 ( also the 200 sma) . It is only day 5 of the 2nd daily cycle, so it should have plenty of chances to do that.
,
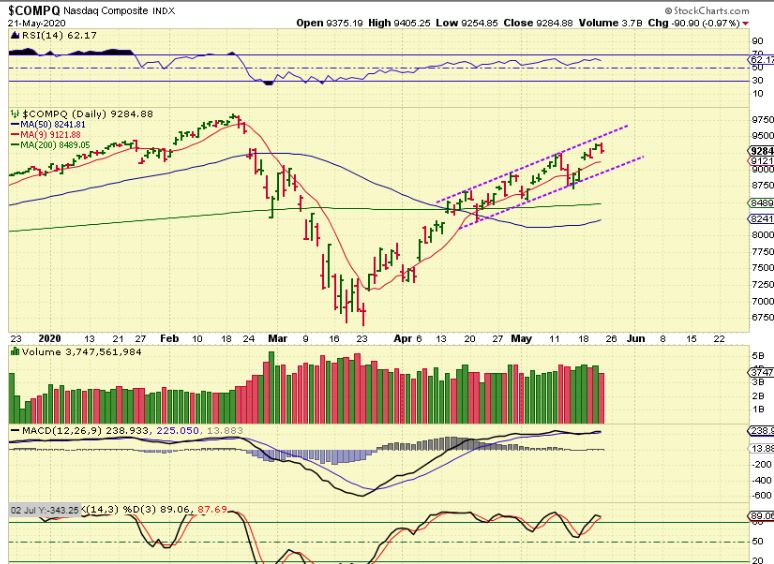
The NASDAQ is well above its 200sma and is in a rather tight up channel at this point. From the top of a channel comes a drop.
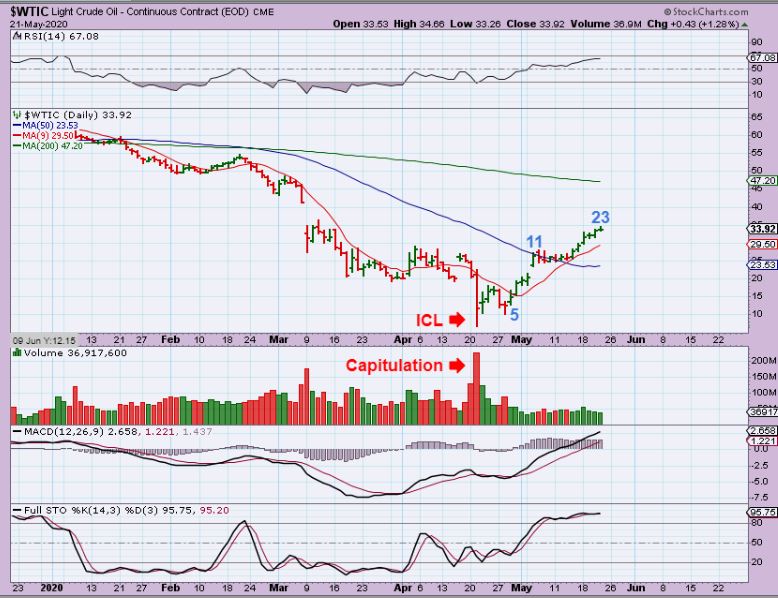
WTIC – Oil has continued higher as expected after putting in that absolute panic crash low. It has been green for 7 straight days ( 2 weeks of trading), so it is due for a pull back at any time. Watch the 10sma. I Noticed that many Oil Stocks had bottomed weeks before Oil, so we were already trading this sector in March, and…
,
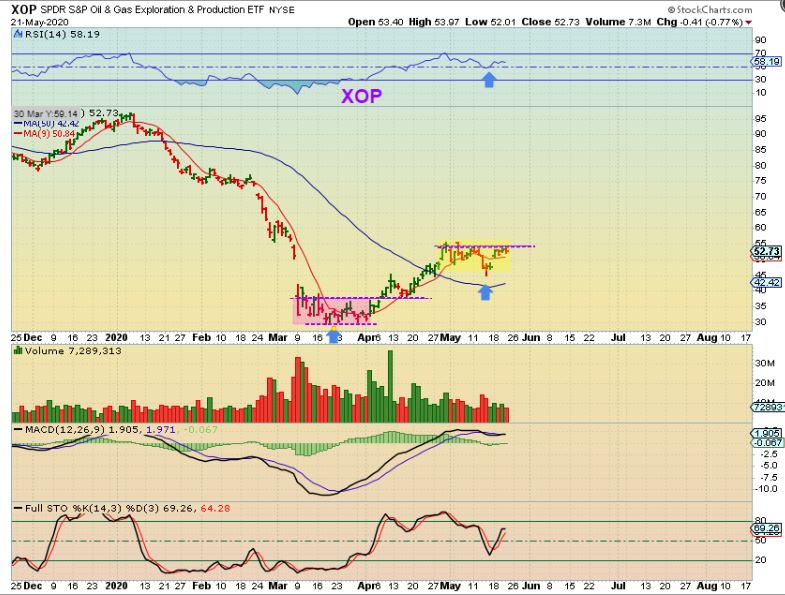
XOP – Oil stocks bottomed in March and are consolidating now, as Oil continued to climb. I would say that the XOP, XLE, and OIH put in a dcl last week. This needs to break higher or chop continues for now.
,
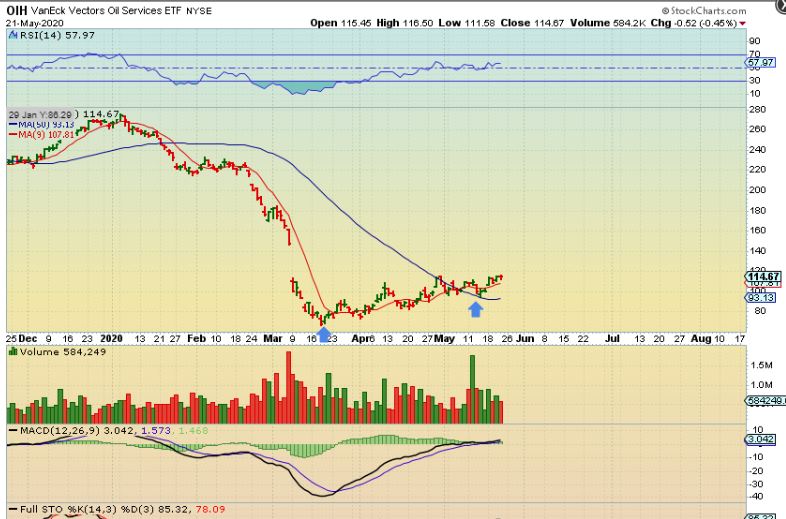
OIH & XLE also appear to have put in a dcl last week. They were and can still be a buy again after that dip.
,
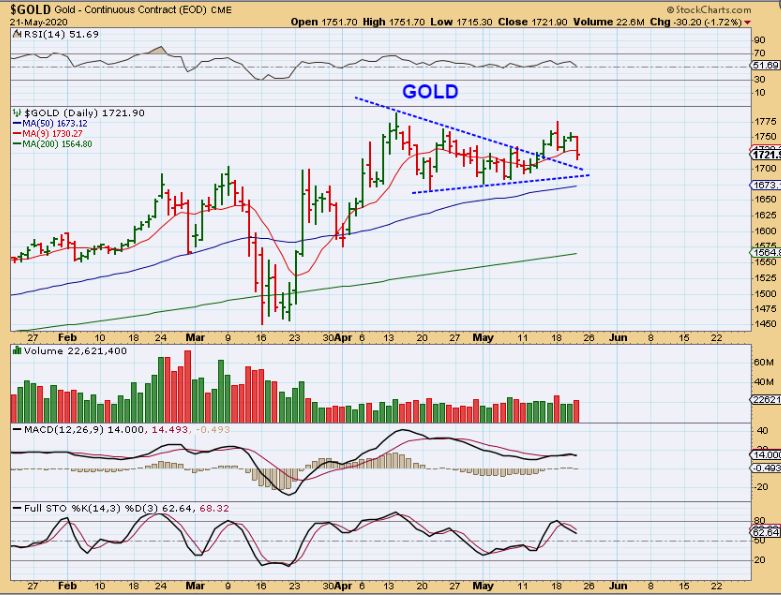
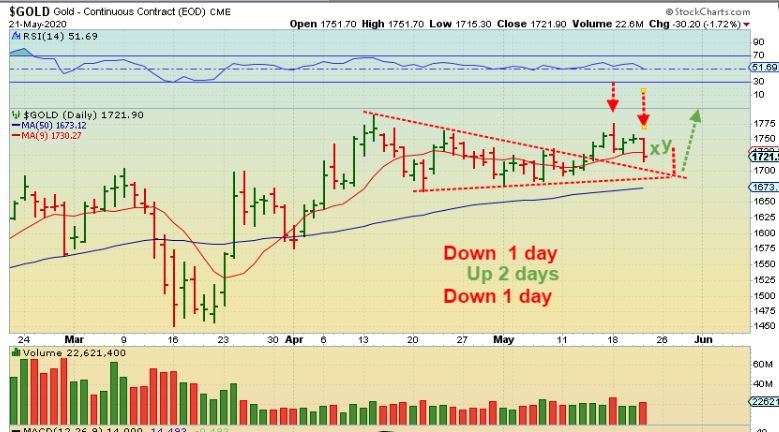
GOLD dropped yesterday and looks to be trying to back test a recent break out. This may be all we get for a dip, or it MIGHT even drop further, since we don’t have a clear back test touch. Did you notice the 1 down red day, 2 up green. One down red day? Well…
,
GOLD – this could happen, or Gold could just take off higher. I like to show what would be a bullish worst case scenario, so that IF this happens, people don’t panic. Selling is normal and will happen in a Bull Run.
.
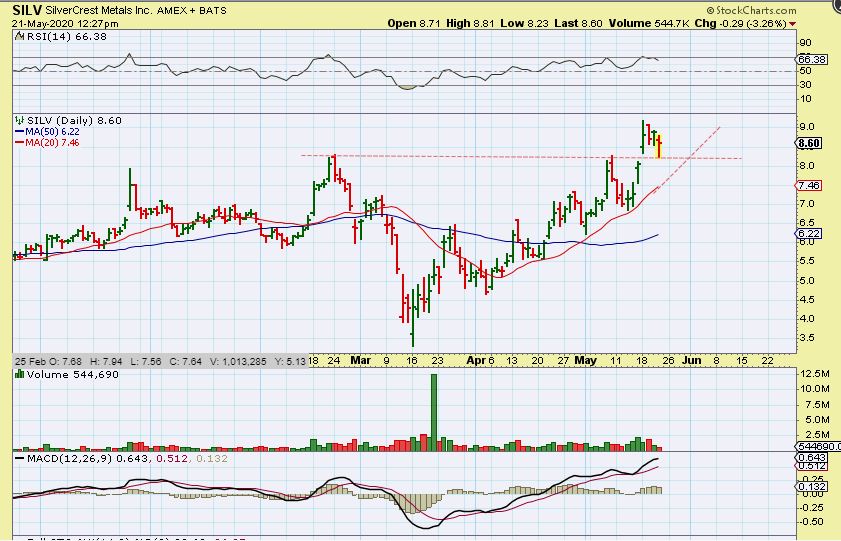
SILVER dropped 3.7%, and it can drop further too. We just had 5 nice days higher in a row, but 1 down day had some thinking that ‘something could be wrong’. As I explained in Wednesdays “Should I sell? ” report–we will have a bumpy ride, we will see down days, maybe even 3 or 4 in a row. In fact…
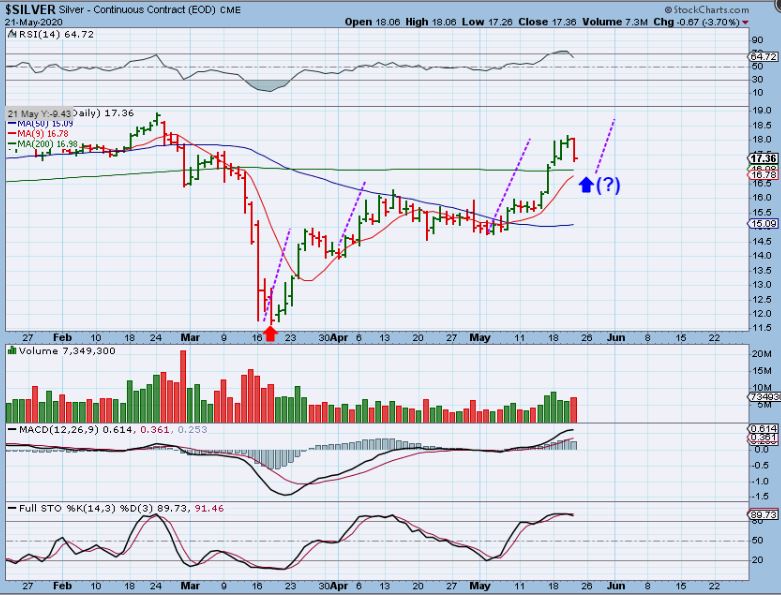
,
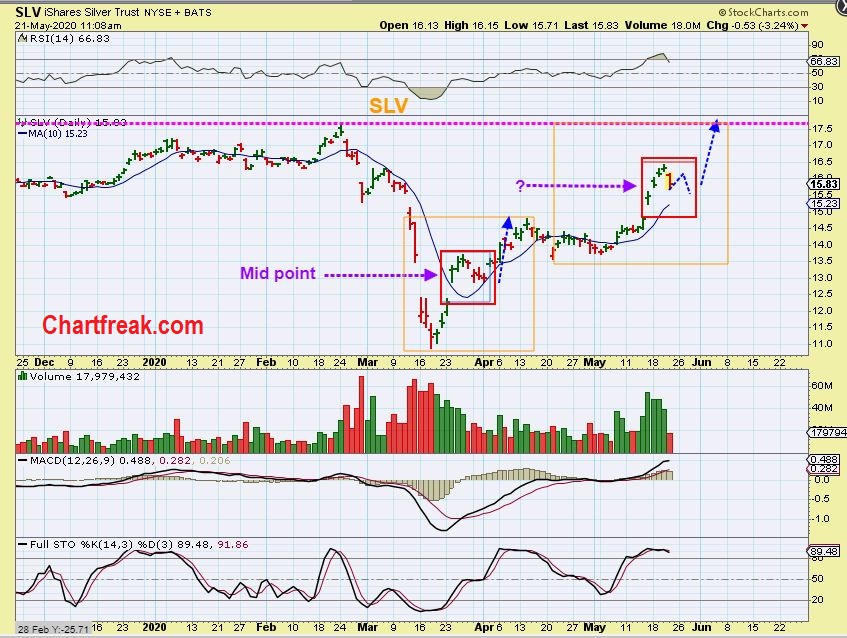
I drew this chart of SLV for the live trading area when questions arose about the drop. “Is there something wrong?” .
Look at the first run where I labelled this MID POINT. We could be seeing that chop / or pause again now and that one lasted for about 1 week of selling and then it continued higher.
.,
So the dip yesterday in GDX possibly just set the uptrend line on day 14. When we had our dcl in place, I mentioned that the 2nd daily cycle could be choppy and sideways, so this shouldn’t be too surprising. Some were concerned about …
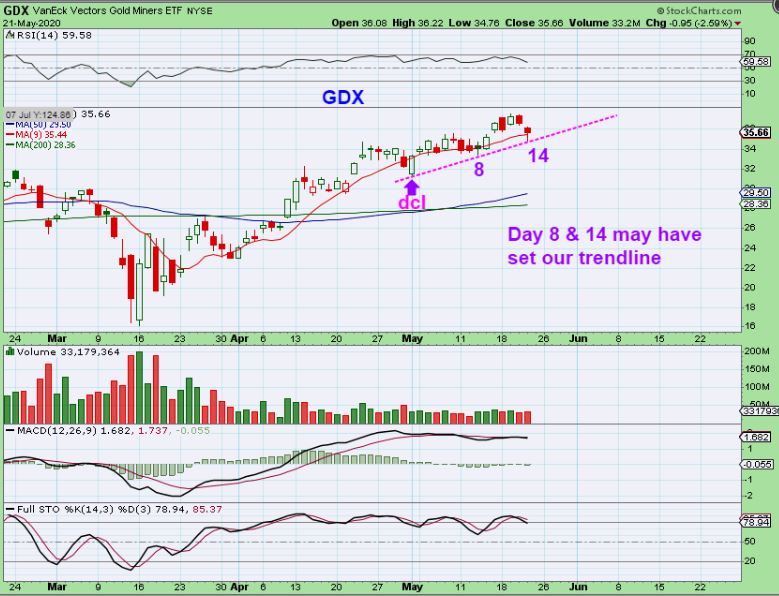
,
Some were concerned about GDX dipping below the 10sma. One reader emailed that he thought that was a violation of cycle rules. It is not. You can see that day 8 broke the 10sma in this run too. In the first daily cycle GDX broke the 10sma too. That does NOT violate anything, there is no rule there. In fact…
,
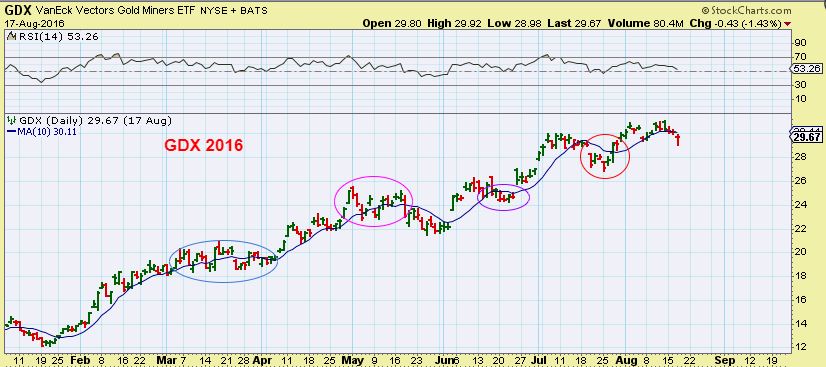
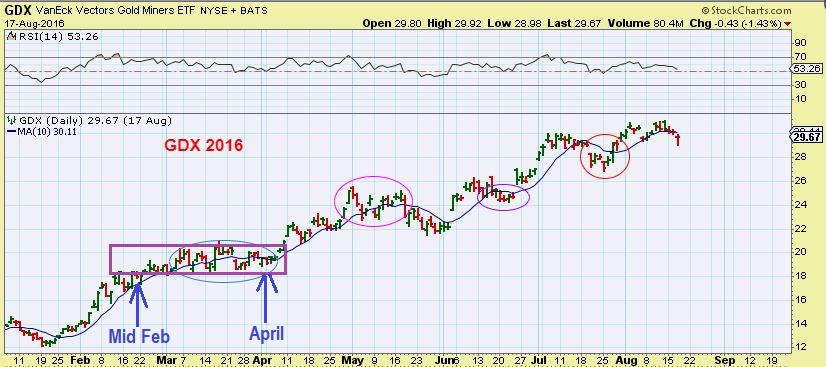
Just by looking at the 2016 GDX run that I posted in the Wednesday report, you could have double checked that detail. Looking at that 2016 run, we see that the 10sma was violated repeatedly during those choppy times, but it remained a Bull. I am going to point something else out that some will hate…
.
I am going to point something else out that some will hate: LOOK AT THIS CHART. Everyone loved the 2016 run, and wished we could repeat that. Well so far we are, but now look at the chart again.
After the first month out of the ICL, GDX actually chopped sideways for about 1.5 months. That could be 6 weeks! Cason, that could be 30 trading days of chop, drop, and pop on options! 🙁 and still be a bull Market. Price was THE SAME from Mid Feb to the choppy lows in April.
.
YESTERDAY WAS ONE DAY OF SELLING. ARE YOU READY TO RIDE THIS BULL? I CANNOT CONTROL THAT, YOU CANNOT CONTROL THAT, that is a BULL bucking people off.

.
What I HAVE mentioned is that some Miners will act differently that the GDX / GDXJ. Some will hold up on their own, so a basket of good miners may help during the bumpy times. Let’s look at what happened yesterday during the first day of selling this week.
,
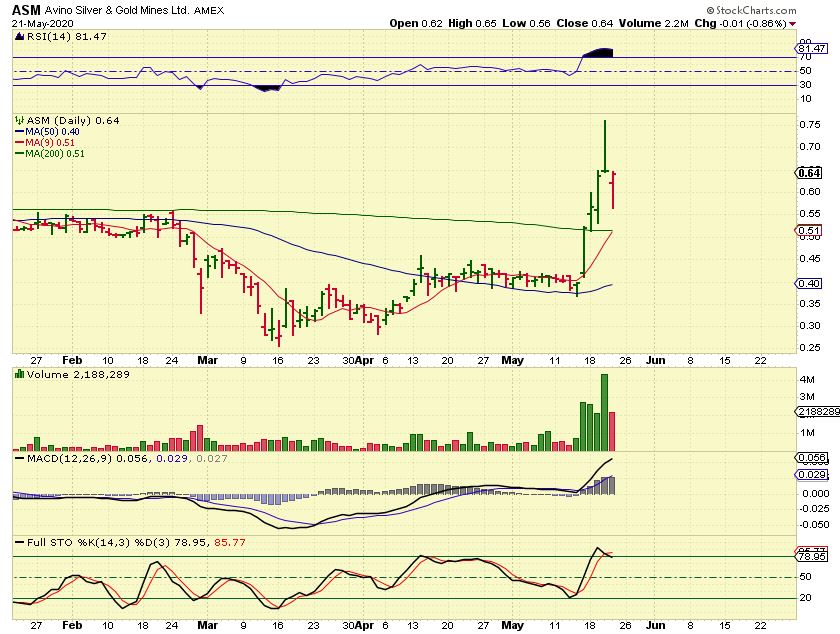
ASM dropped A LOT, actually from $0.75 highs to $0.56 lows in 2 days, but it started to recover into the close. That seems to indicate that buyers were there stepping in. Does that mean that the sell off is over? Not really, but it shows ‘buy the dip’ mentality may support price a little during times of selling.
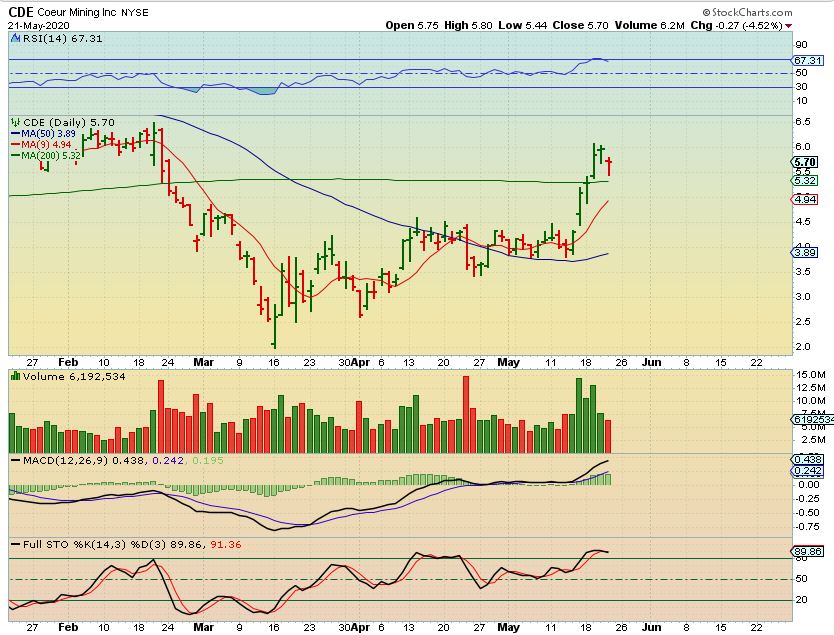
CDE also dropped and closed off of the lows.
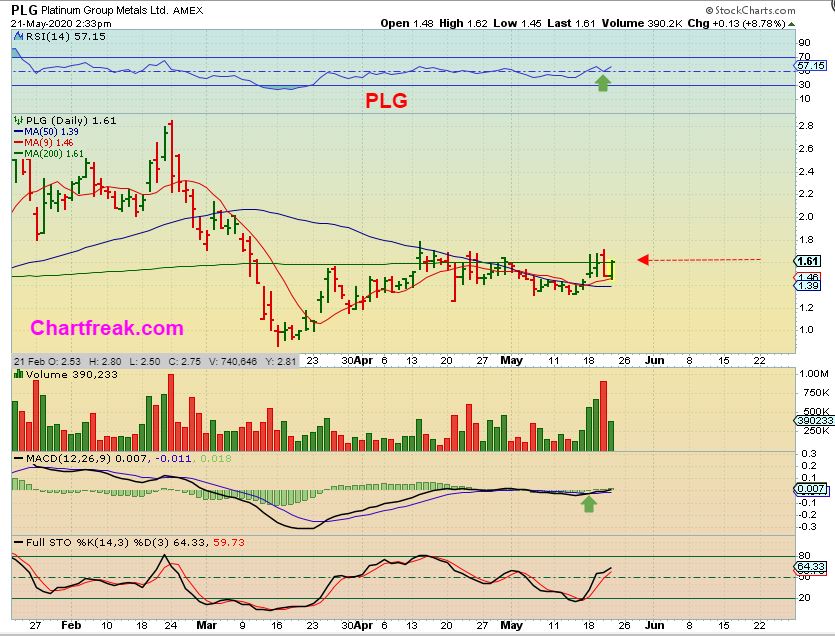
PLG actually started to make a comeback and closed up almost 9%. It is trying to regain that 200 sma.
SILV started to bounce midday, and this ended up closing even 7 cents higher than shown here.
,
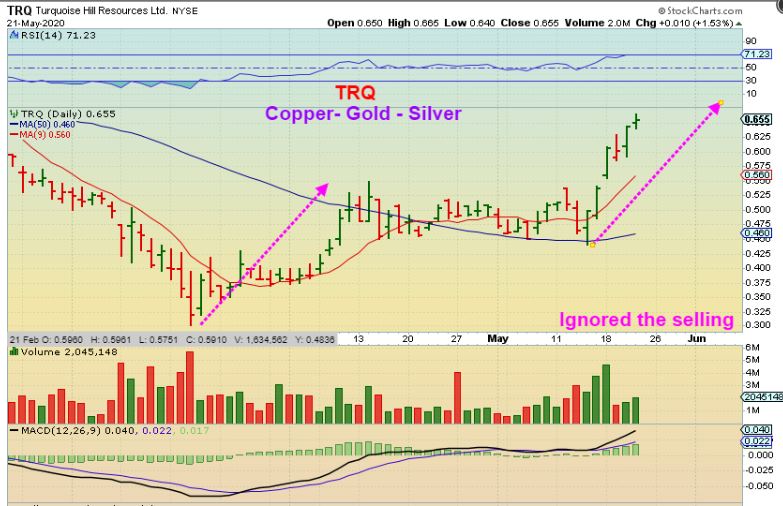
TRQ actually closed green, continuing the 2nd leg of its run out of the lows.
n
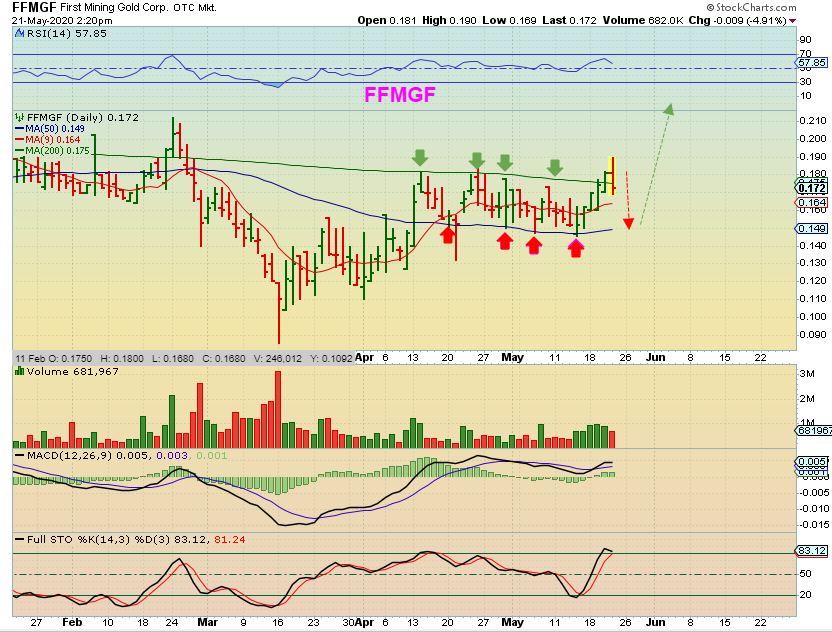
I decided to BUY this dip in FFMGF, and I will add if it dips further. Let me show you what I like…
.
FFMGF 2:30 p.m. yesterday. It has a bullish consolidation, bouncing between the 50 sma and the 200 sma. It was trying to break out and I want to own it ‘BUY & HOLD’ when it does, so I bought it at 17 cents. I will show you why I want this ‘buy & hold’ in a minute.
.
FFMGF – I also noticed that FFMGF actually broke from a pennant with volume is increasing too. Now it closed back above that 200sma. The real reason why I like FFMGF longer term ‘Buy & Hold’ is…
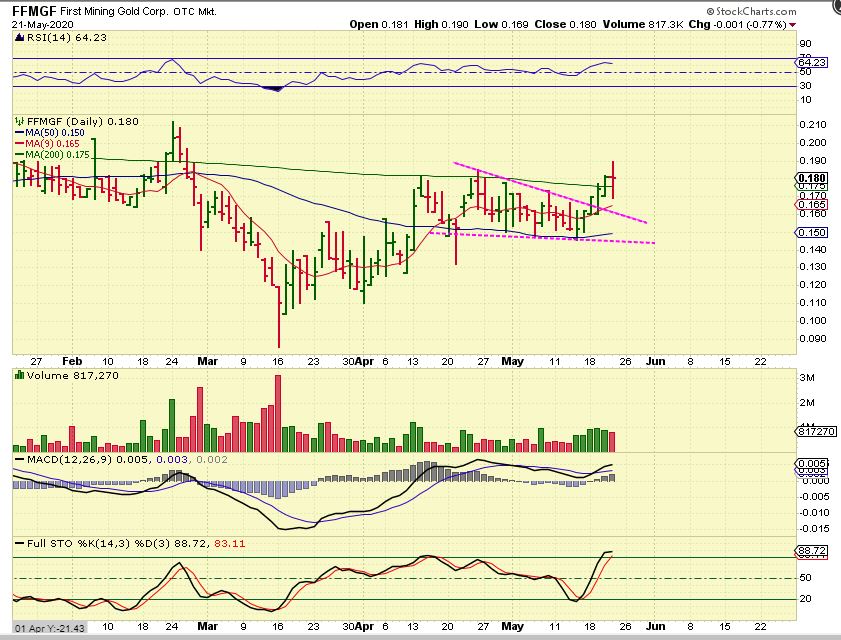
,
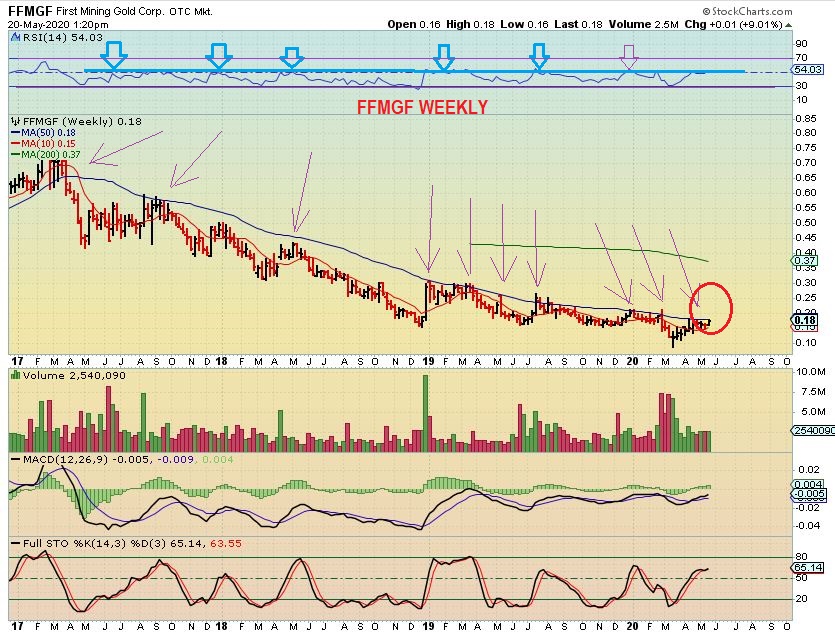
The real reason why I like FFMGF longer term ‘Buy & Hold’ is because of this long term weekly chart. The 50 week ma is 18 cents, and I noticed that this has held price down for 3 years. If this breaks out during a Bull Run…
,
SAME CHART: If this breaks out during a Bull Run, this is one of those smaller ones that can easily double, triple, etc. Look at the chart…
1. $0.36 is 100%.
2. $0.54 is 200%
3. $0.72 is 300%, etc. This chart shows me that that is possible over time in a Bull Run.
.
It has been a great week of trading/ investing, with one down day in the precious metals yesterday. I don’t know how it’ll end for us on Friday, but I do not think that this run is over at this point. Adjust your accounts if you need to so that you can sleep at night and enjoy your weekend ( Long weekend in the U.S.). Even if you feel that you personally would sleep better by reducing some leverage, remember: “There is always another trade” next week!
,
Enjoy your Friday trading, your weekend, and as always,
thanks for being a Chartfreak here with me! 
.
~ALEX
.
THE MJ SECTOR IS OPENING UP. In a recent report, I mentioned that I thought the MJ Sector had put in a dcl with the General Markets, but the follow through was slow. It seems to be picking up, and these can really run if they get going.
.
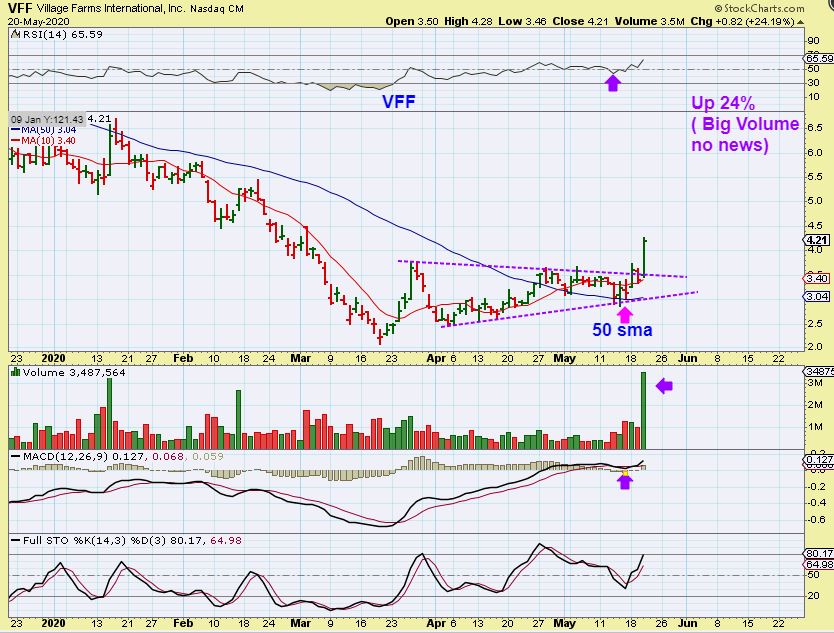
VFF – Earlier I was discussing that for some reason, without news , VFF started to break out so I bought it. This was as of Wednesday and I guess that it was just being a leader, because…
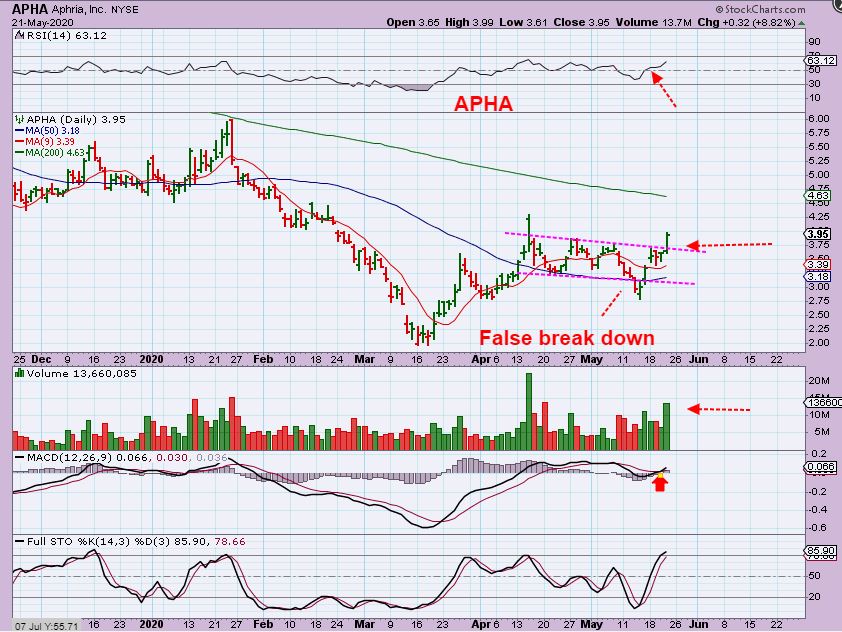
APHA -After putting in the lows at the General Market dcl, Apha climbed, stalled and Popped yesterday. This is already $2.75 to $4 already. It should at least run to the 200sma ( or more).
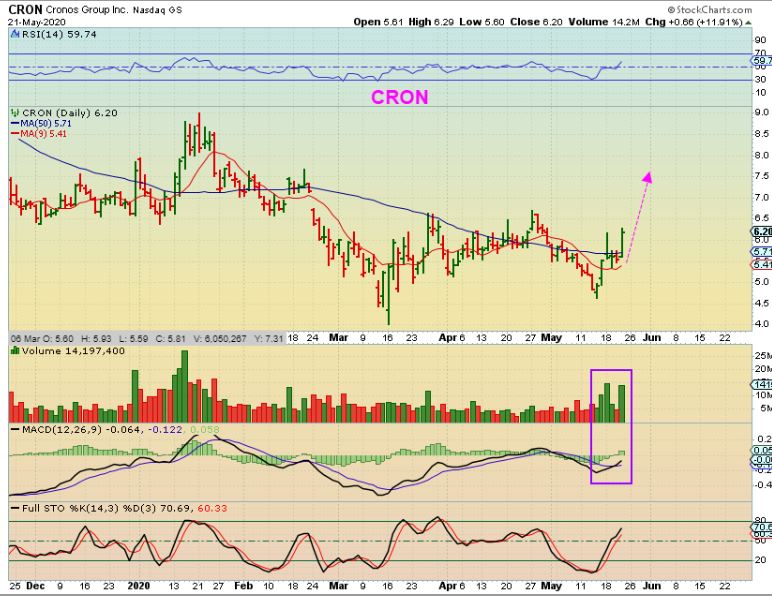
CRON is not a ‘lagger’, but it isn’t overly extended. It has nice volume and moved from roughly $4.50 to $6.20. Big move and probably just starting.
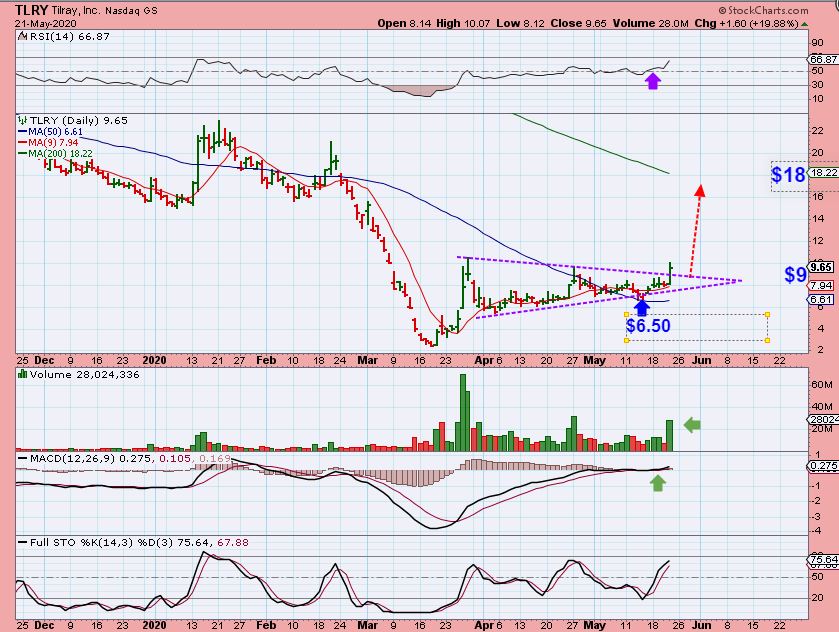
TLRY – We caught the lows on this one in March and rode a good part of that $2 to $10 move. It formed a bullish consolidation and look ready to go again.
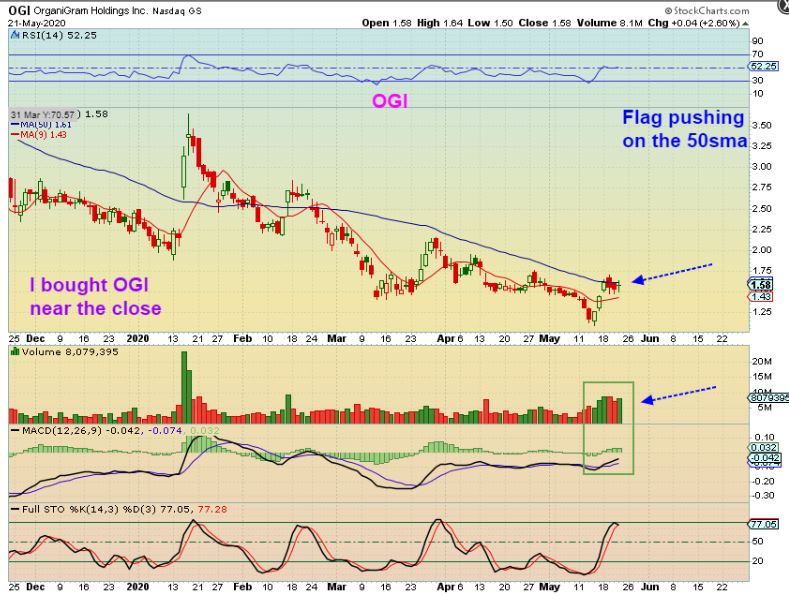
I bought OGI yesterday as a bit of a lagger that I am hoping will break out.