Weekend Review April 25th – To Better Days Ahead
.
This weekend we are going to look forward to the better days ahead. Miners are breaking out from a large multi year base!…
.
Trades are setting up in a way that help us to continue to make good money, and just like that Spanish Flu that hit in the early 1900’s, this current situation plaguing the globe will be behind us sometime in the future. There will be Better days Ahead! Let’s hit the charts…
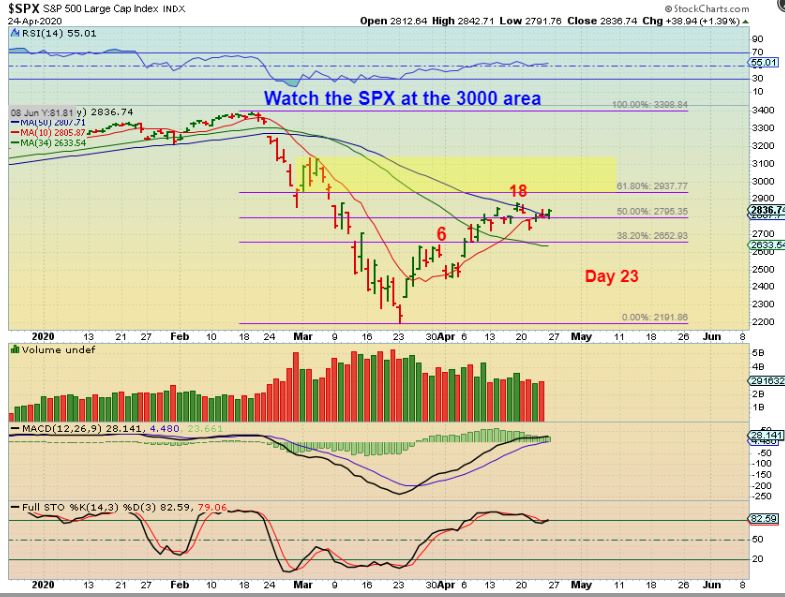
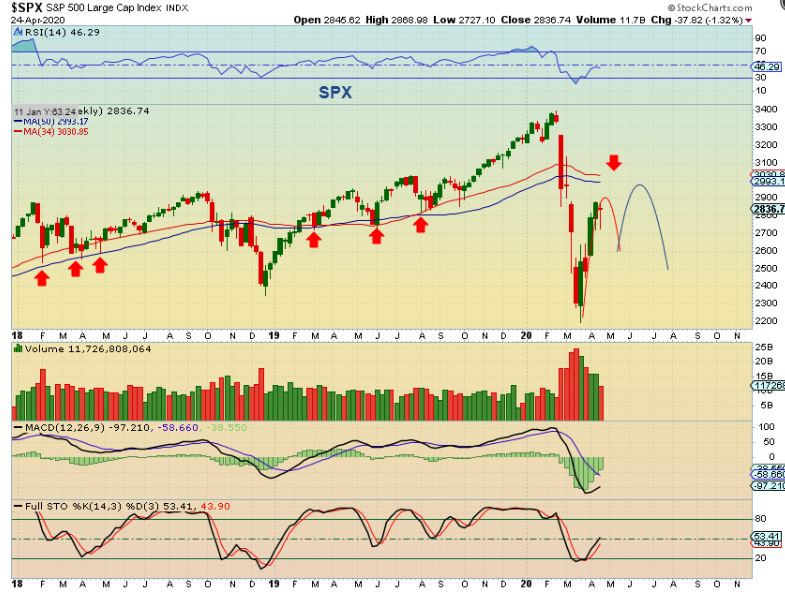
A daily cycle for The SPX can last for roughly 40 days, and I would expect a ‘peak’ to be right translated coming out of an ICL, so this may not have peaked yet. I was looking for a possible bounce to the 61.8% Fib number. Friday was day 23.
.
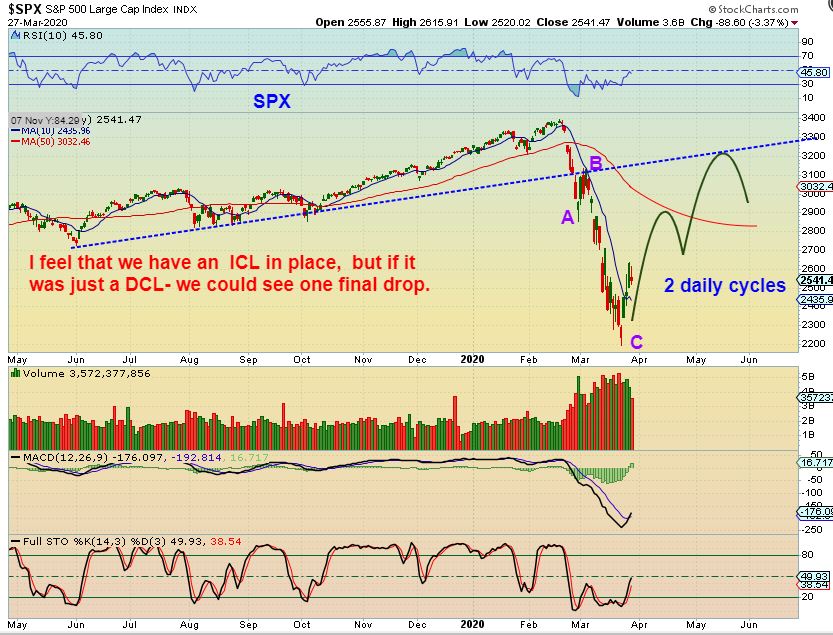
SPX MARCH 27th – Over a month ago I went long at the lows and drew this chart. I mentioned that I’d expect 2 daily cycles higher in the bounce and then this might roll over again into a bear market. I drew it to look ‘roughly’ like this…
.
SPX CURRENTLY – We are not due for a dcl quite yet, but as time goes on, this can still play out this way. I am going to look for clues along the way as to whether or not this looks like a Bear market starting (?), or is the Bull resuming? I am feeling like this will begin a bear market again, and
.
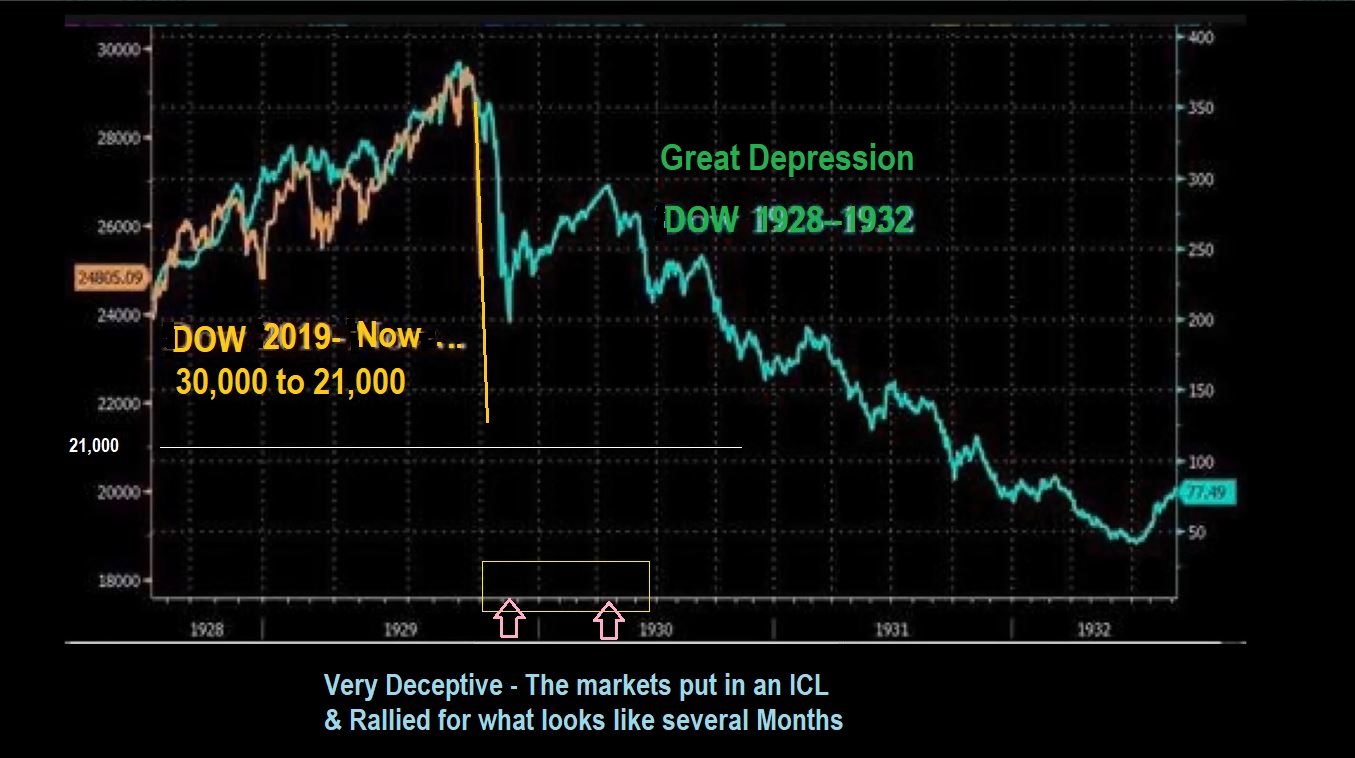
I have been posting this in each weekend report to remind my readers that a ‘believable rally’ can still become a bear market downtrend. This was the 1929 CRASH, the yellow line is our recent crash. After the crash in 1929, it then put in a very believable rally for months, but it eventually dipped into a long bear market.
.
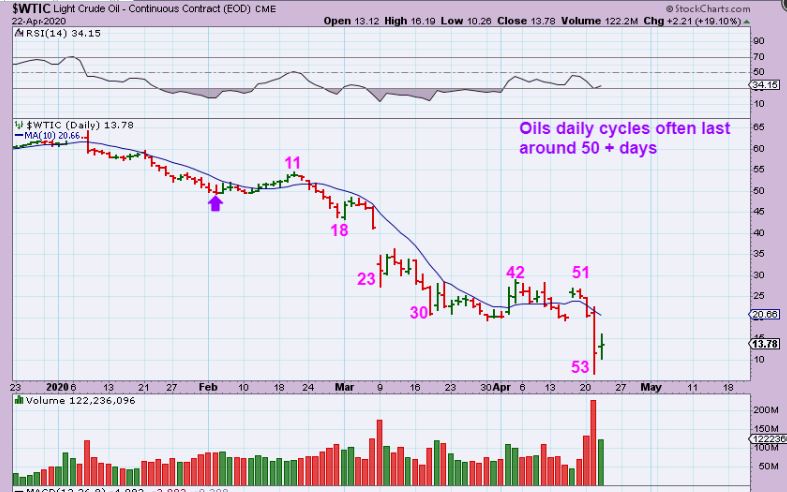
FROM WEDNESDAY : WTIC – I have pointed out that Oils cycles normally can last around 50 days normally. We are now ( after a massive collapse) At day 53. So now Oil could bounce, but as has been pointed out in the recent reports, OIL STOCKS have actually been very bullish for weeks…
.
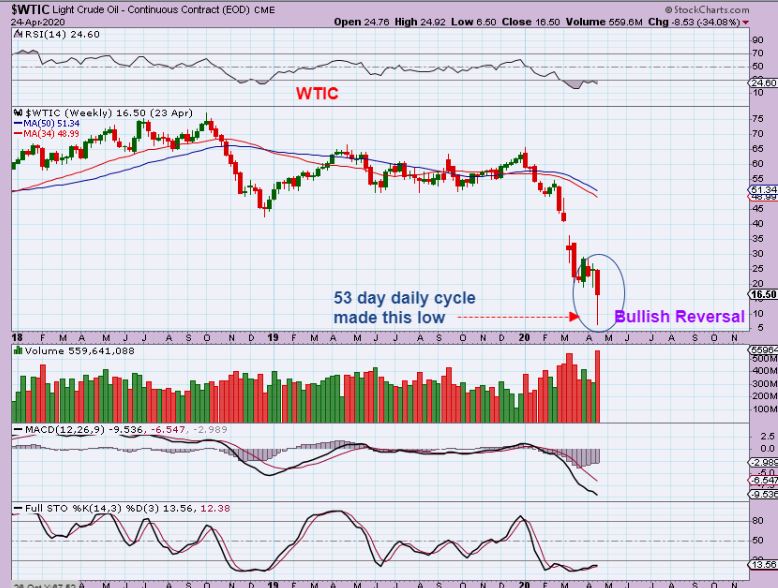
WTIC WEEKLY – Now at the end of the week we have a reversal candle, because Oil moved off of the lows on Wed, Thurs, and Friday. Oil stocks are bouncing back making BIG gains- I have covered that in daily reports.
.
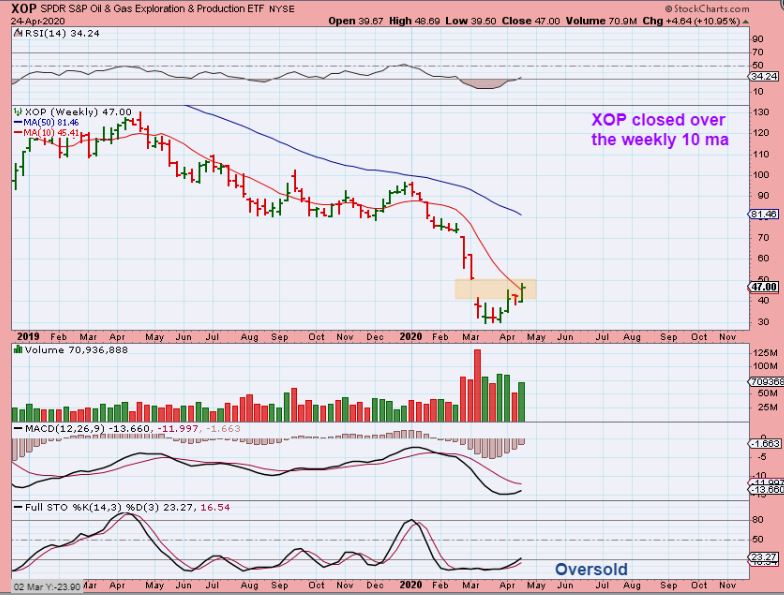
The XOP Weekly shows that Oil stocks bottomed well before Oil did, and I saw signs that they were bottoming in the charts. That is why I traded them despite the fact that Oil was still crashing down. Now we have closed above the 10 weekly MA. With what should be an ICL in Oil- These Oil Stocks are now less risky. We discussed my list and traded some on that list, which includes APA, OKE, MRO, XOM, BE, TUSK, VLO, WTI, OAS, PVAC, CVI, AROC, CLB, BTE, ERF, WLL, COP, LPI, DNR, and many more. Some have already doubled off of the bottom. Notice that XOP remains very oversold. 🙂
.
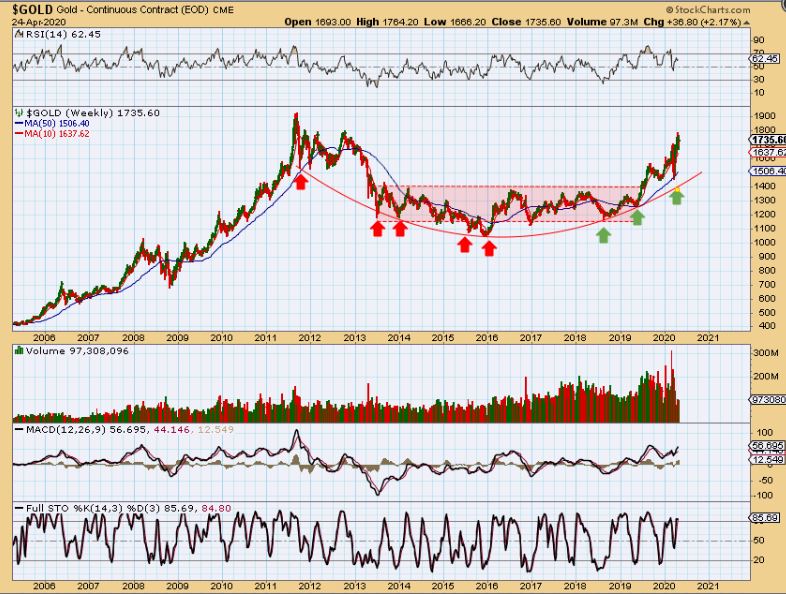
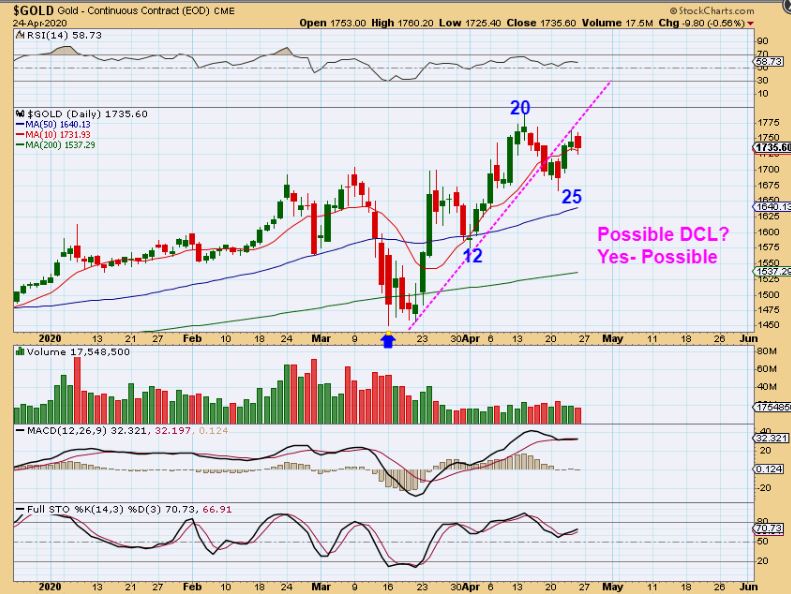
GOLD#1 – First let me point out that From MAY 2019 to SEPT 2019, GOLD ONLY RAN HIGHER & WENT SIDEWAYS when it was due for a dip. DCLs are not easy to see, and THAT CAN HAPPEN HERE. Gold may chop sideways, and NOT put in a deep dip for a dcl. Look where I wrote Run / Sideways / Run. Any dcl in those months looked similar to what we have now-Chop.
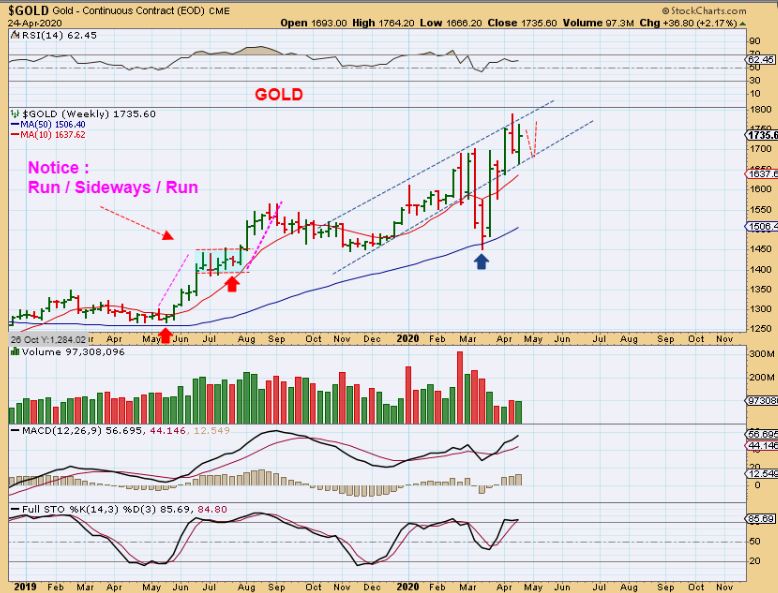
Now I want to look at the Big Picture here. This Bull Run really started long ago, and that crash down shake out in March was a 2 week anomaly. It then recovered in 1 week. This is still a BULL RUN, and retail investors still do not care about buying miners yet. THAT is great…
.
We here at Chartfreak have been watching this BASE turning into what I expected would become a giant GOLDEN BOWL, eventually returning to former highs. This was September of last year, a break out and I expected a back test & run higher…
We did get the back test, so I expected a run back to the highs to follow
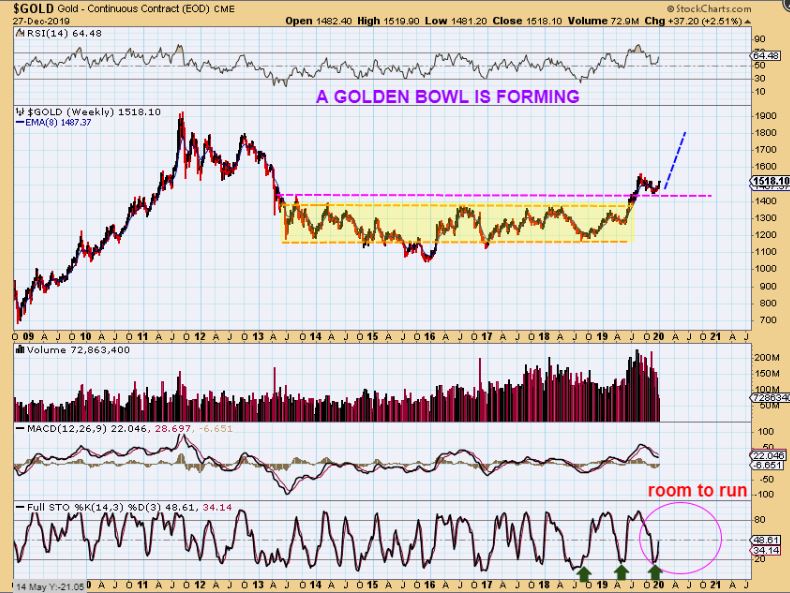
GOLD CURRENTLY – We are running back to the highs. We are going to see Gold finish this bowl and when it breaks out to new highs, Then the retail investors are probably going to start paying attention to it. They are going to want the Miners that we own now. That can lead to even greater gains down the road, with $3 Miners running to $20, and more. I’ll discuss that more over time.
.
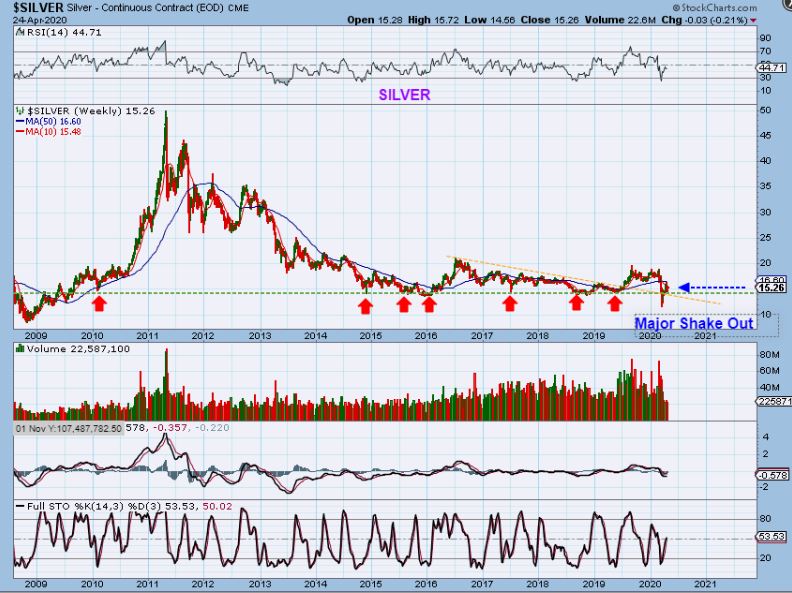
And SILVER is still in the base area. When this decides to break out & run, SIlver Miners will make Massive gains. We just saw a major shake out & recovery. As silver runs to $20, then $30, then $40, etc, Silver Miners will rocket higher. To show you what I mean…
,
To show you what I mean, this is an old chart of First Majestic when it ran in 2016. This ran from under $3 to over $18, and that was all in 8 months. When Silver gets going & retail investors start looking for bargains? I think the Silver stocks will rocket again.

.
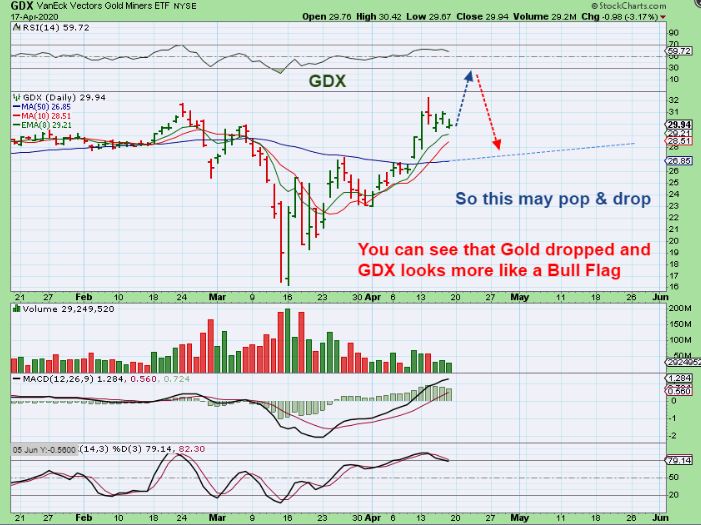
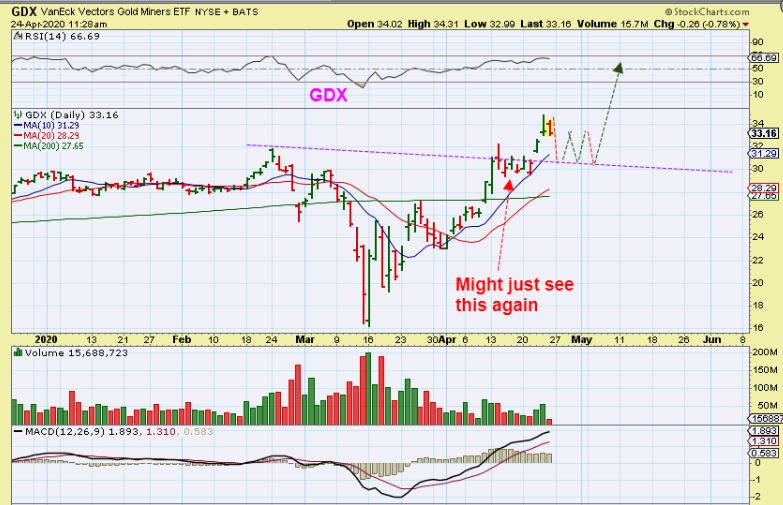
GDX APRIL 17 – Last Friday I said that something to watch for was one more final POP and then a drop to a dcl. I cautioned about over trading, since it may just tag the 50 sma…
.
GDX did give us that POP this week and now it may be starting a dip into a dcl, but I want to caution that the dip may not be deep. It may or may not get to that 50 sma…
.
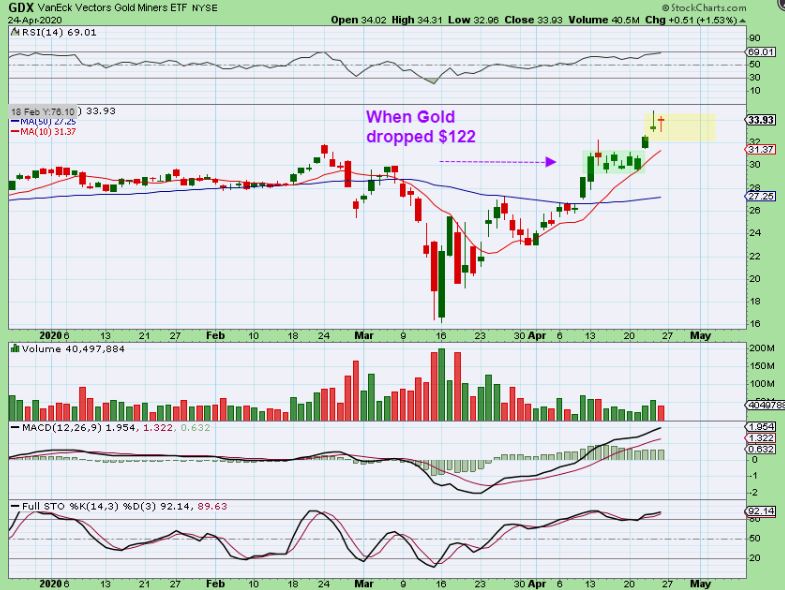
GDX could just chop sideways like the last Bull Flag. THAT FLAG happened when Gold dropped $122, so we might just see that again.
.
GOLD WARNING : IT IS STILL A POSSIBILITY THAT MINERS BULL FLAGGED AND GOLD DID PUT IN AN EARLY DCL (day 25). Gold sold off Friday, but Miners barely sold off, so I want to view miners as BULLISH and I do NOT recommend selling them off expecting a dcl. Some may ‘Lighten up a little’ if they want to try to re-enter lower, but if GOLD has a dcl & takes off from here? This can just take off higher on any given day.
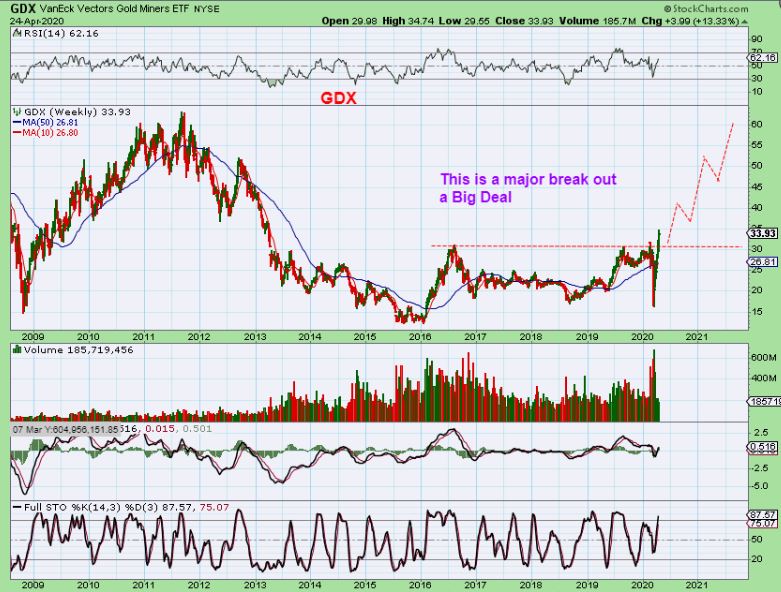
THIS IS A BIG DEAL: MINERS CLOSED ABOVE THE BASE. You want to hold Miners in your portfolio, because GDX is breaking out from a HUGE BASE. You can see in 2008 that the run higher was extremely choppy and dcls formed deeply, but this time may be smoother and less choppy. Now let me discuss what a possible dip could look like IF GOLDS DCL IS STILL AHEAD…
.
What a possible dip could look like IF GOLDS DCL IS STILL AHEAD…
.
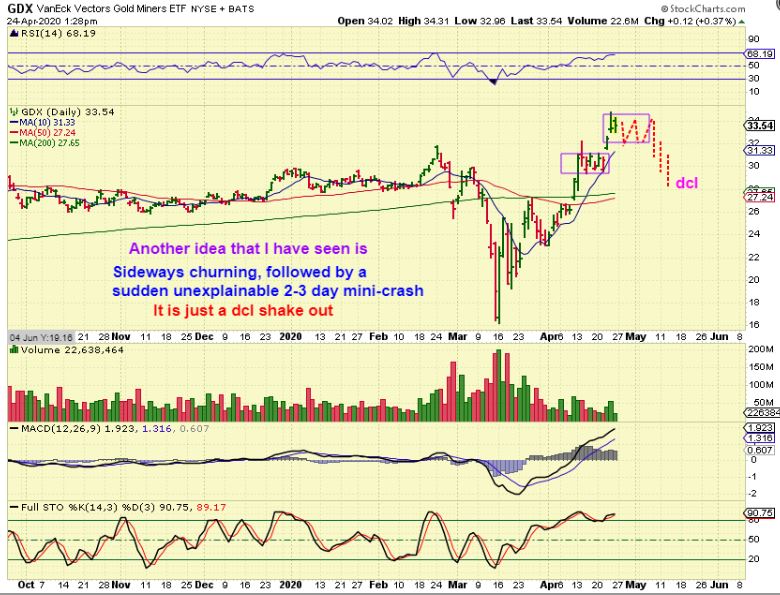
**I have not shared this idea yet, but I have seen this in the past.
This is when GDX goes sideways and look very bullish just like the last flag. It does this into say day 31, then suddenly , out of nowhere, we get a flash crash boom, boom, boom. It is devious, because people panic & fear that Miners will drop like they did in March just sell off. This then rips higher before you can get back in. This is a tough one, I hope we don’t see it.
.
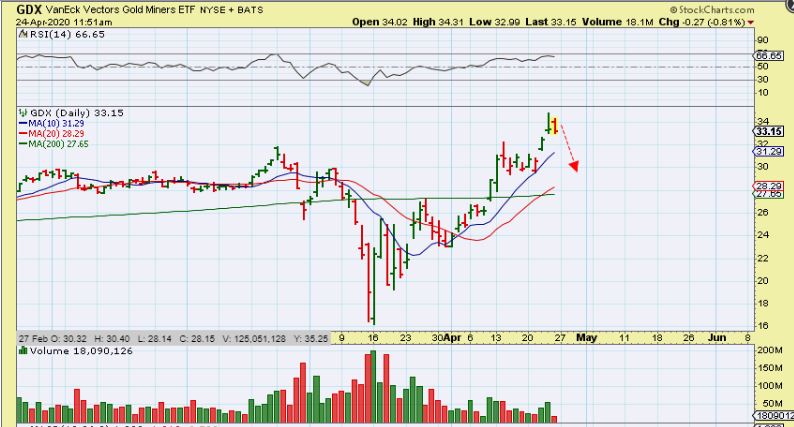
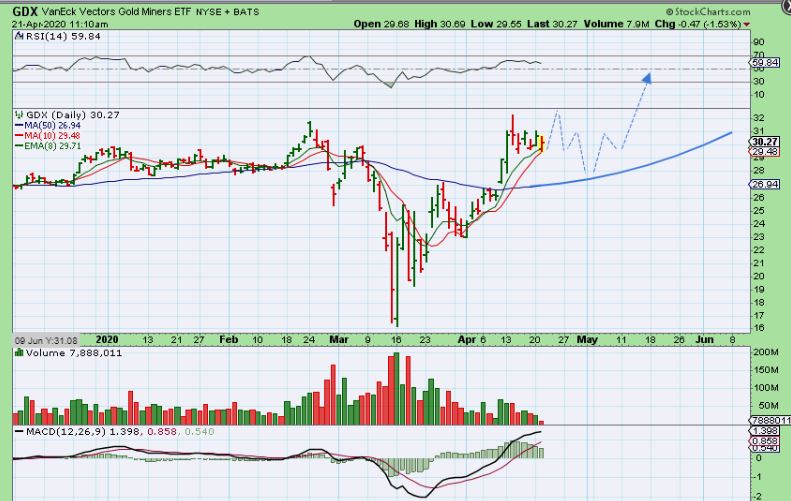
GDX April 21– I actually drew this over a week ago, and it is playing out this way now. A Pop higher was discussed, then a dip to the 50sma, then a rally in the 2nd daily cycle. This would reflect the POP we saw last week, and means next week could be the drop.
.
My thinking here is to show The most bullish possibility.
I know that you remember me saying that recently MINERS simply bull flagged when Gold dropped $122 , falling 4 out of 5 days, right? This would be GDX doing that again. A simple sideways chop to the 10sma and then a run higher. This is where selling would not be good, so buying at the 10sma might be the answer for those that have cash. The GREEN BOX formed as GOLD dropped $122. THAT is very bullish.
..
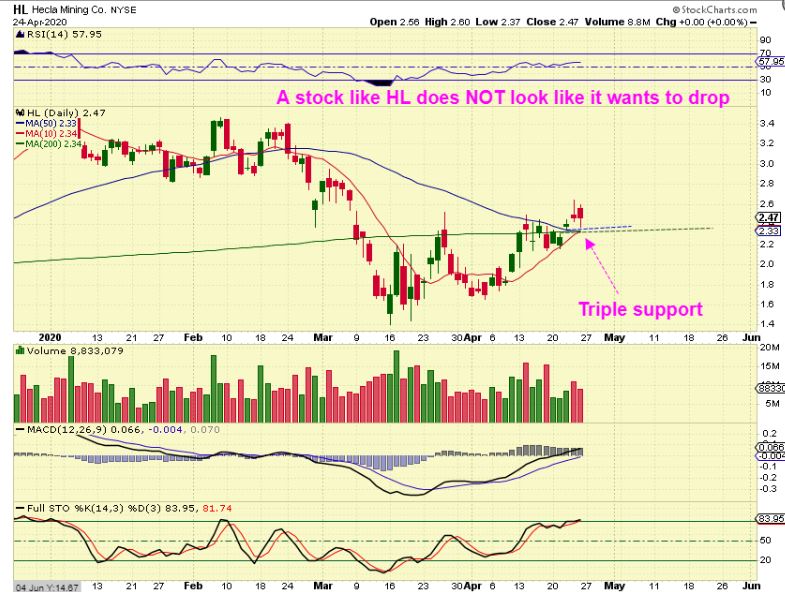
HL A Miner like HL could pull back, but since it has now closed above triple resistance, it may just chop sideways on triple support too.
.
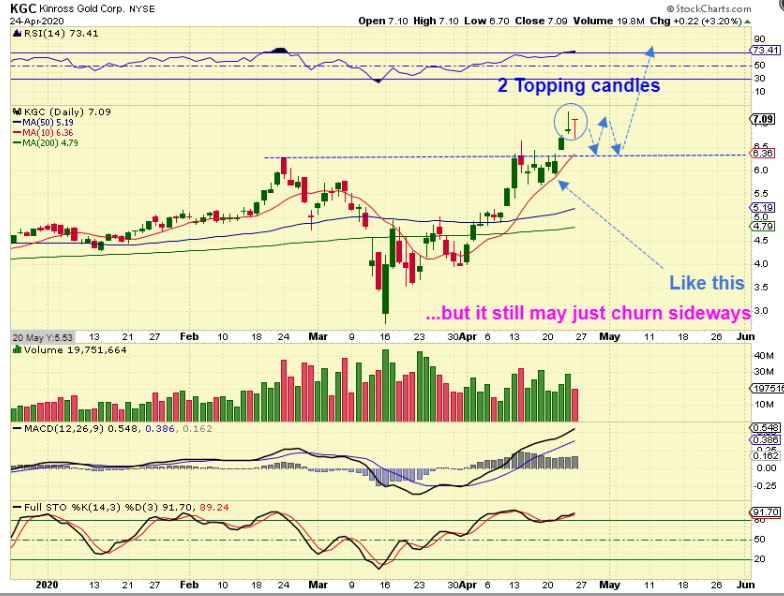
KGC – This has 2 ‘topping’ candles, but that doesn’t mean that it will break down & sell off deeply. It also may just chop along support as shown.
.
.
POSSIBLY THE MOST IMPORTANT CHARTS OF THE REPORT:
.
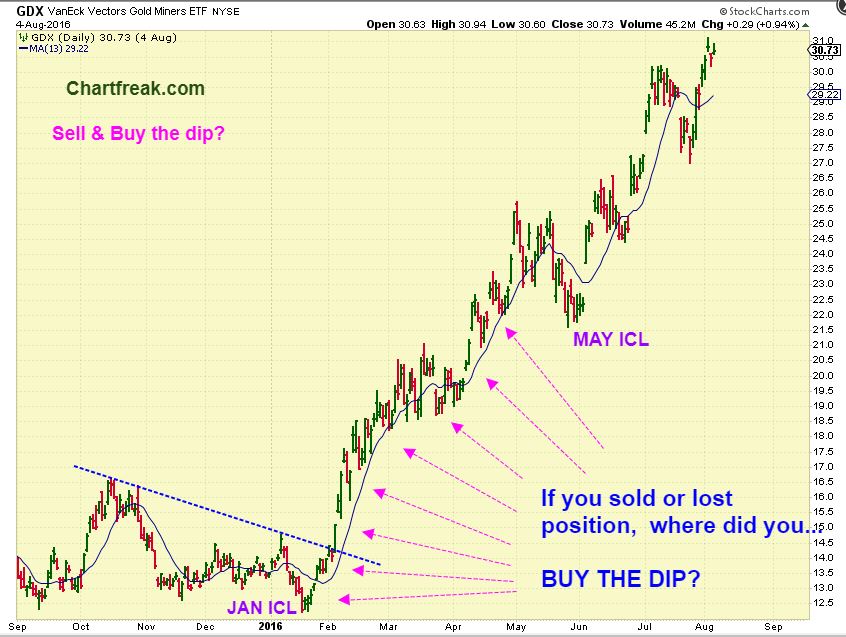
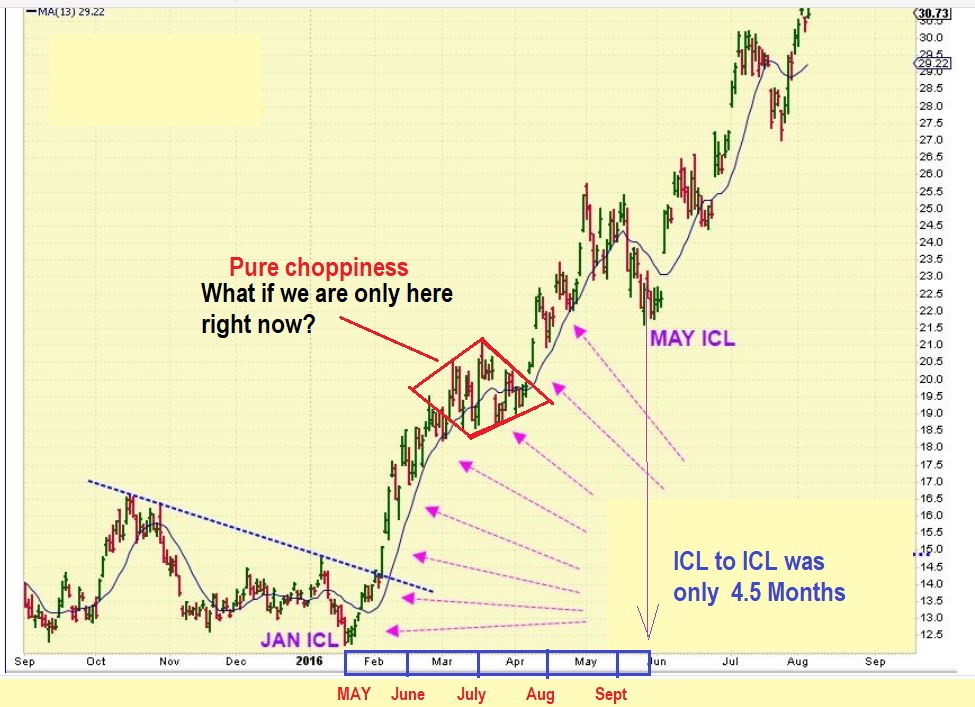
2016 had a V-Bottom sell off too, and then that ramp – up – run out of those lows was ‘relentless’. Pull backs only lasted a couple of days. Try Finding an obvious DCL every month or so, and it is impossible, right? Selling to get back in lower did not work then. GDX ran from $12 to $31 on this chart and ‘deep’ dips were rare, with the exception of that MAY drop, which was an ICL.
.
I drew his 2016 chart up for an older report coming out of the MAY 2019 ICL, so ignore the ‘What if we are here now” area. What I want to point out on this chart is the BLUE LINE, that is the 10sma. It often only went sideways to that line. Now I’ll go back to the GDX right now…
.
GDX NOW is only going sideways to the 10sma line so far too, even as Gold dropped $122 for 5 days. My point is : We want to be aware that the dips might not be very deep, so definitely hold a strong core. If you have cash, I’ll look for signs along the way as to how I think this is playing out, and report that in the daily reports. I do think that we are seeing a strong move that will continue higher in May.
.
The Precious Metal Bulls are running and even if Miners pause here, it should just be a brief one before the run continues higher. THAT means that we will be making money in the Month of May too! That means that this weekend we can just put the markets aside mentally, all looks good! With that thought, rest up and if possible we can use our energy helping family and friends to cope with this current global situation. My wife and I love to offer to do some grocery shopping for an elderly couple that live on our street. They are very concerned about going out, touching shopping carts, breathing the air in a confined spaces, etc.
I just want to mention that honestly, if you aren’t a higher risk, and you can help someone that might be, it is very rewarding. It never hurts to put on a mask, knock on the door, stand back and ask if you can help, maybe do their shopping? Some say “No thanks , My kids do that for us.”, but then they always smile and add, “…but it’s so nice to know that someone really cares though, thank you!” And THAT is the reward! 🙂
.
So for us here at Chartfreak, things look good with the Markets. We can rest up this weekend knowing that even though we may see a pull back, it should be rather mild. A rally should then follow with the second daily cycle, and better days and better trading still lie ahead. Give someone a helping hand if possible, and …
.
Enjoy your weekend, stay safe, and as always – thanks for being here at Chartfreak!
.
~ALEX
.
Trading in other sectors like Energy and Biotech for Coronavirus has been exceptional too. For a trader like myself, these set ups are excellent to play while waiting for a pause, sideways move, or dip to finish up in the Miners. Let me just point out a couple of trades and discuss this a bit further.
.
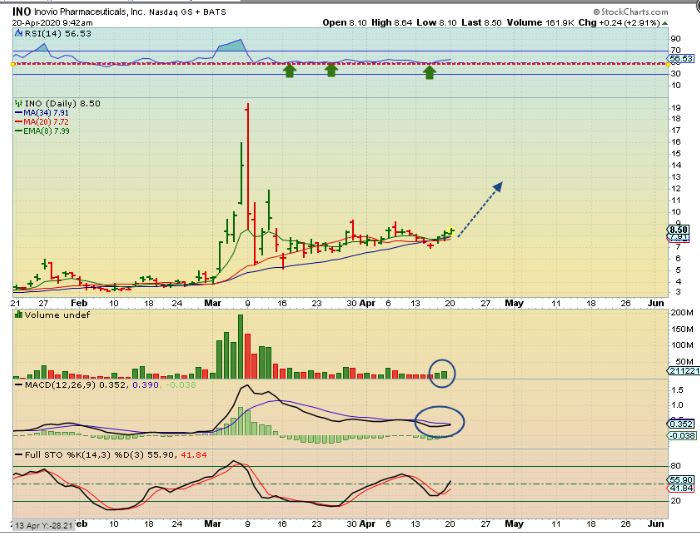
INO – Many of these Companies took off initially in March and we traded INO, NVAX, IBIO, etc. Then they based out and this looked ready to resume the run from a base, so I said I bought this and posted it as a buy. This is April 20…
.
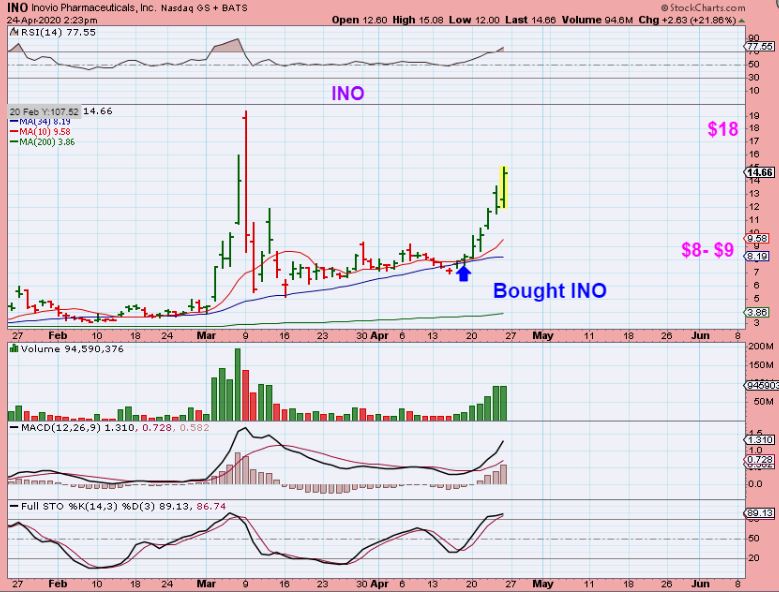
INO -Days later it is at $15. These are exceptional gains, but also a bit risky and not for everyone, because of the way they move. NVAX also ran to new highs. Lets look at another…
.
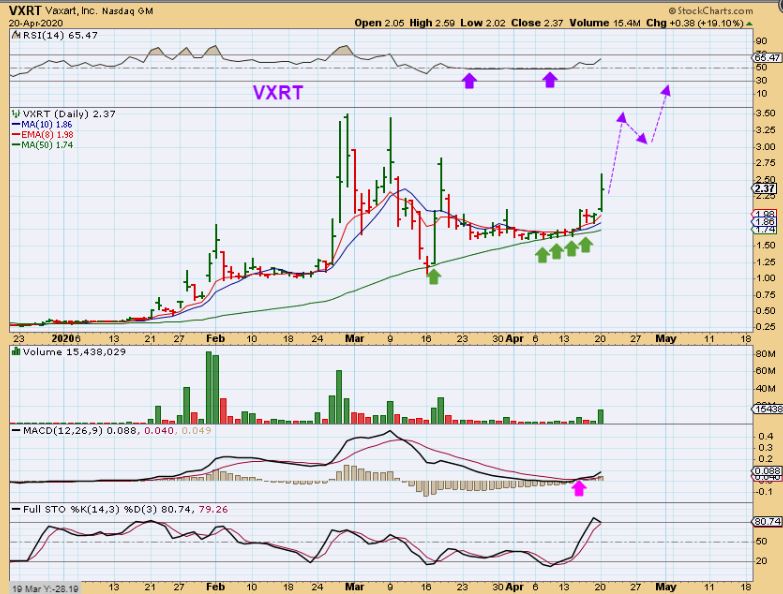
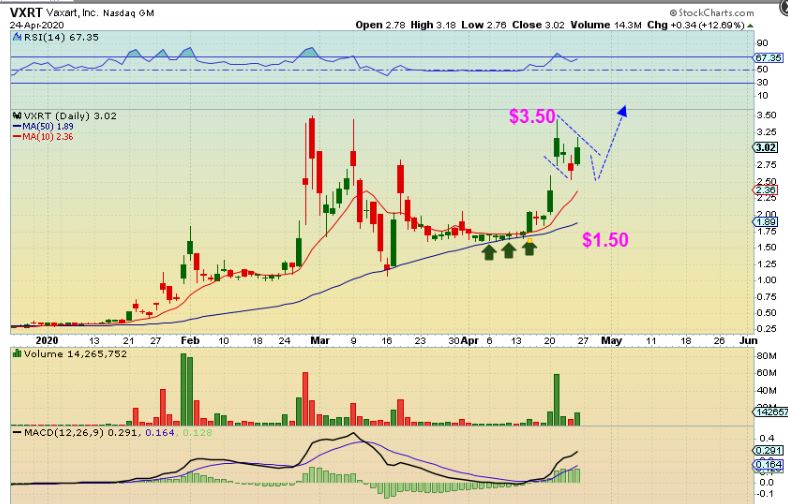
VXRT – I bought this in the flag on the Pop off of the green 200sma. Mentioned it in the live area and put this in the report, it should continue to form the cup and I drew a possible handle…
.
VXRT formed the cup QUICKLY and is building a handle. I don’t recommend these when extended, because they can pull back quite a bit, so this was a great trade…
.
VIR was mentioned on April 20 also, but it needed to get above the 20 & 50 sma to really trigger the buy. It could be bought here at $30 or wait….
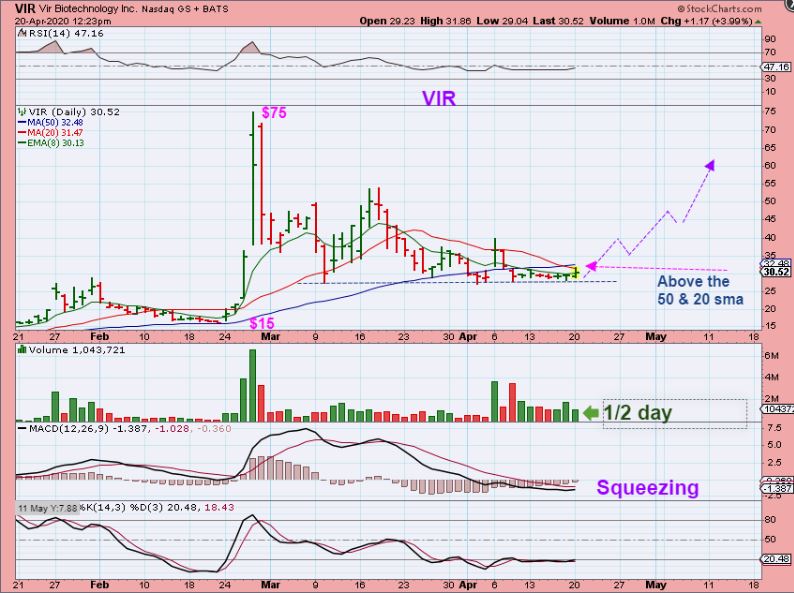
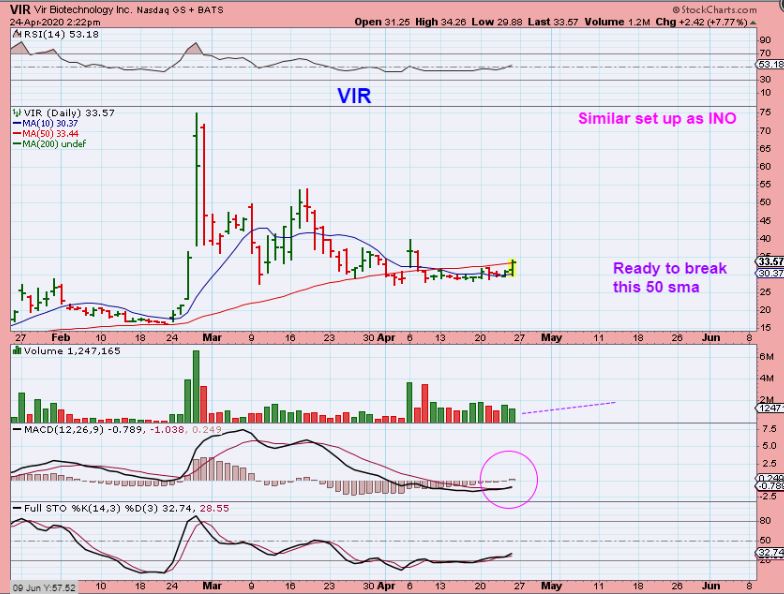
VIR April 24 – I bought it on Friday Morning and it looks ready to break out. This is basically the same set up that VXRT & INO had. A large blast higher in Feb/ March, then a drop and base, now hopefully this does what INO & VXRT did.
m
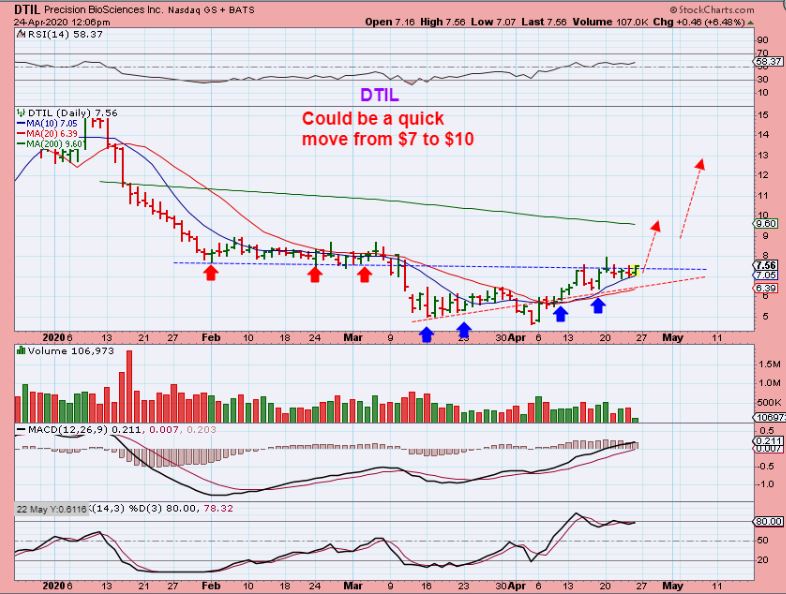
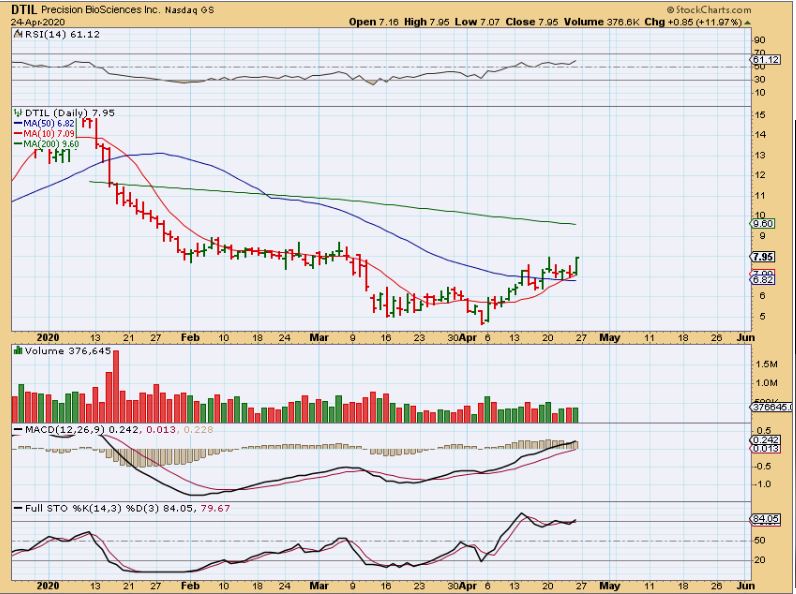
DTIL is another in this category, but it is a very different set up. It is still a long base though. I Bought this Friday too, and put it in the live section. It is a tight consolidation, I expected a break above the blue line and a run to the green line near $10. $7 to $10 in a few days is a great trade while Miners go sideways.
m
DTIL popped 12 % and closed near $8 by the close. It looks ready to go to $10 or more.
m
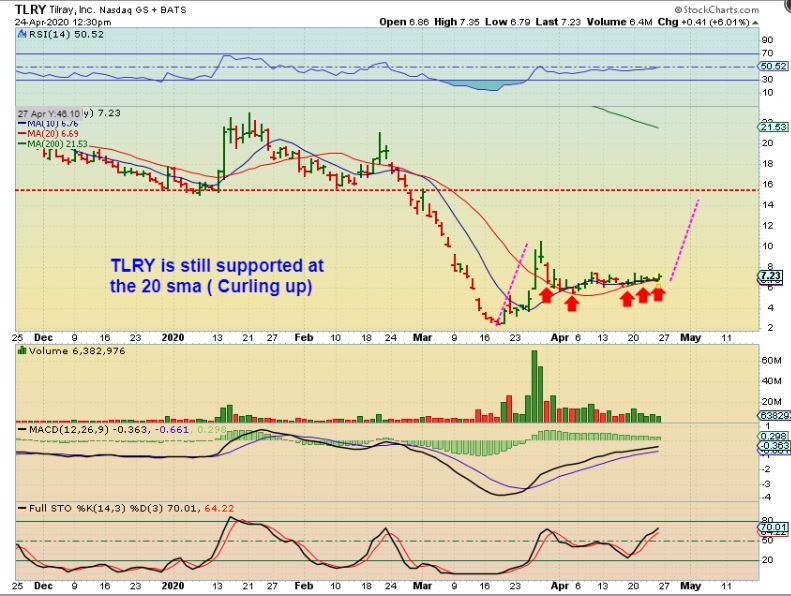
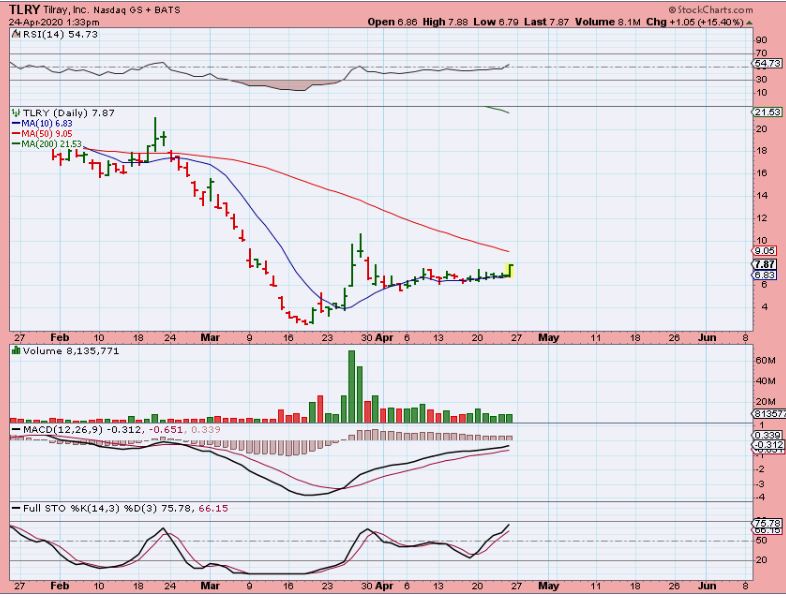
I also noticed that TLRY & CGC have finally formed what I think is a bullish set up ready to go higher. I bought it and posted this in the live area too. I got in under $7.23, this has been riding the 20sma nicely…
.
TLRY this was an hour later and it popped to up 15%, then closed up 18%. This can really run, we traded this out of the lows from $3 to $10. I think this will break right through the 50 sma. At that time, I also mentioned…
.
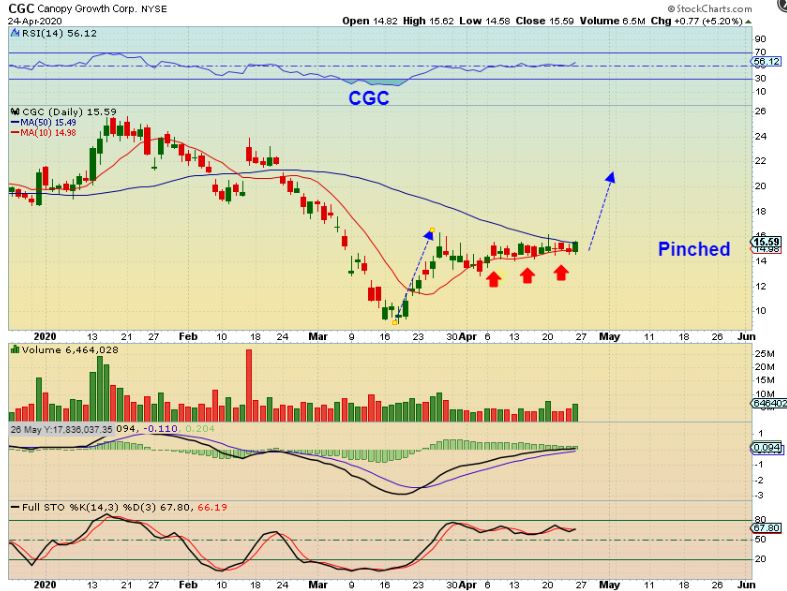
At that time, I also mentioned that CGC was looking like a similar set up. It was at $14.75 when I mentioned that , and here it closed at $15.59. I did not buy this one, but now I think I should have. This looks ready to burst above that 50sma. It is punched tight and these can be very explosive.
.
So now with the above charts and my current trading, let me explain something else here. You can see that I trade often, I do trade for a living. Sometimes its a scalp trade for maybe 1 – 5 days or so? Other times I ride trades for weeks ( like KGC now), and I may buy Miners near the ICL lows and let them ride for months too. And also at times like this, we had a good run in Miners for weeks, I may lighten up and put that money to work in INO, VXRT, TLRY, etc , until I feel that Miners are ready to run again. Why is that important for you to know?
.
I think that it’s important for the readers to know that, because I have had some mention that they sold 1/2 and went to cash, to follow my selling. I may have been asked or mentioned in the live area did I sell anything yet? I sold part of my AG position to lock in some profit, HOWEVER, I am also taking that money and using it elsewhere, until Miners look ready to go again. In the current set up, similar to 2016 as shown in this report, Miners may not pull back much, so selling may not work out for everyone. At times, they may just go sideways, making it hard for buyers to get back in. For someone just going to ‘all cash’ to re-buy later, I do not recommend going to all cash. Again, we might not pull back very much here, we could just go sideways like 2016, so do you want to chance selling 1/2 your position or more under that circumstance? It may be ok to sell 20% or 30%, but just be aware that if someone s=asks ” Did you sell any Miners?” I always say, ” Yes, but I am a trader.” , so that may be different for me .
,
Think about this please: Based on the charts above – I may sell ALL of my EXK for example. I put it in INO for a week, and come back with that cash plus 80% gains. I might also sell HL and put it in TLRY. Then TLRY goes from $7 to $14 in a week, while Miners drift. I come back with that cash plus 100%. Then if EXK & HL take off higher, I don’t mind re-entering higher, because I now have extra cash. I’ll just jump in.
Someone that sells just because I did, and sits in cash, may have to re-enters at a higher price than they sold for. So should you sell 20% , 40%, 1/2? Or just ride it out? That is up to you, but please don’t sell something just because I trimmed something- I may be trading with those funds.
.
Conclusion: I mention this mainly because people will just ask me in the comments, “Alex, did you sell any of your miners?” If I say, ” I lightened up a little, but plan on re-buying”, many think that they need to start selling too, and they may not understand that I am doing that as a trader. I sell and buy all the time, when opportunity arises. That may not fit your style if you are working all day or unable to be in front of the screens all day. I often write the reports for investing /trading more medium term when coming out of an ICL, but I may still trade often. That said, the current set up is possible to ride most or all of your positions into a dcl fully invested or just selling a little, since we expect that it’ll rally higher into a 2nd daily cycle run.
Ultimately it is up to you if you want to lighten up here. Maybe that IS your kind of style of trading, and That is fine. Selling maybe 20%, 25%, or 35% here to see if we get a pull back to the 50sma for you to re-enter IS a valid plan, as long as you didn’t just lighten up because I mentioned I did. I am raising cash for trades. And remember…
.
THIS IS A BIG DEAL: MINERS CLOSED ABOVE THE BASE. You want to hold Miners in your portfolio, because GDX is breaking out from a HUGE BASE.

