Weekend Report
With my expectations clearly laid out in all of my prior reports, I want to just keep the weekend report simple, and to the point, and focus mostly on Precious Metals and The Miners. This will basically be a reminder that things are playing out as expected so far, with the exception of Oil itself. Oil itself is due for a low, and that does look to be falling into place, but we don’t have a confirmed dcl /ICL yet. Lets review the charts.
.
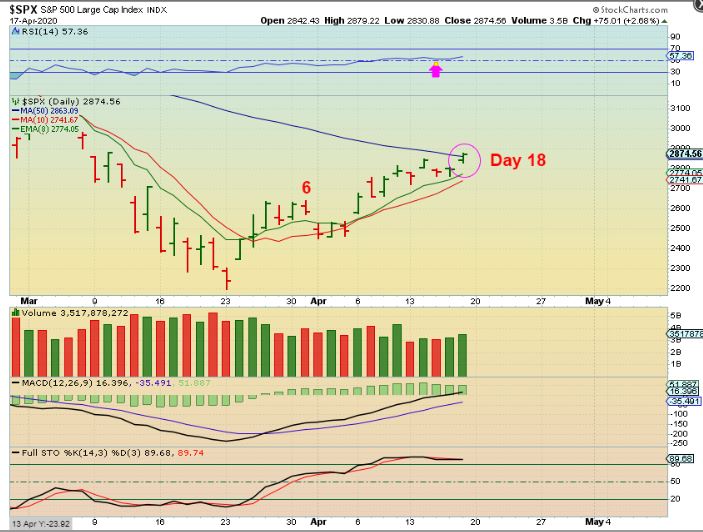
SPX DAILY – It was expected that the SPX could break above the 50 sma, because we watched the NASDAQ AND SOX do that. We are on day 18 of the first daily cycle, a daily cycle that I would expect to form as right translated, and can be 40+ days long. So…
v
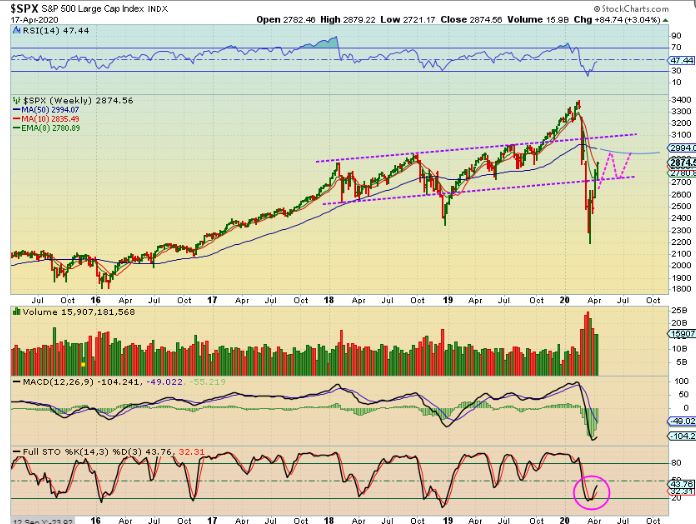
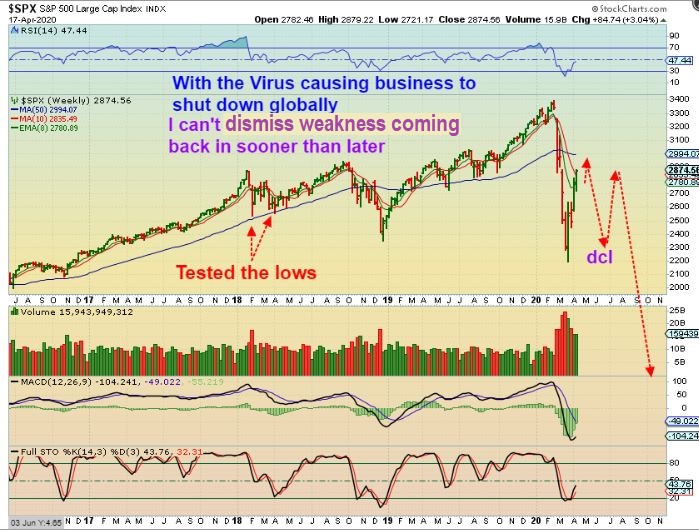
SPX WEEKLY – I have been saying that we would get a believable, convincing rally after this sharp drop. We would need to see a strong rally in the first daily cycle (ICL), and then the second one would need to be monitored, because if these markets are to roll over into a bear market / recession, it could happen in the 2nd or 3rd daily cycle. The first daily cycle looks strong and is playing out as expected and…
b
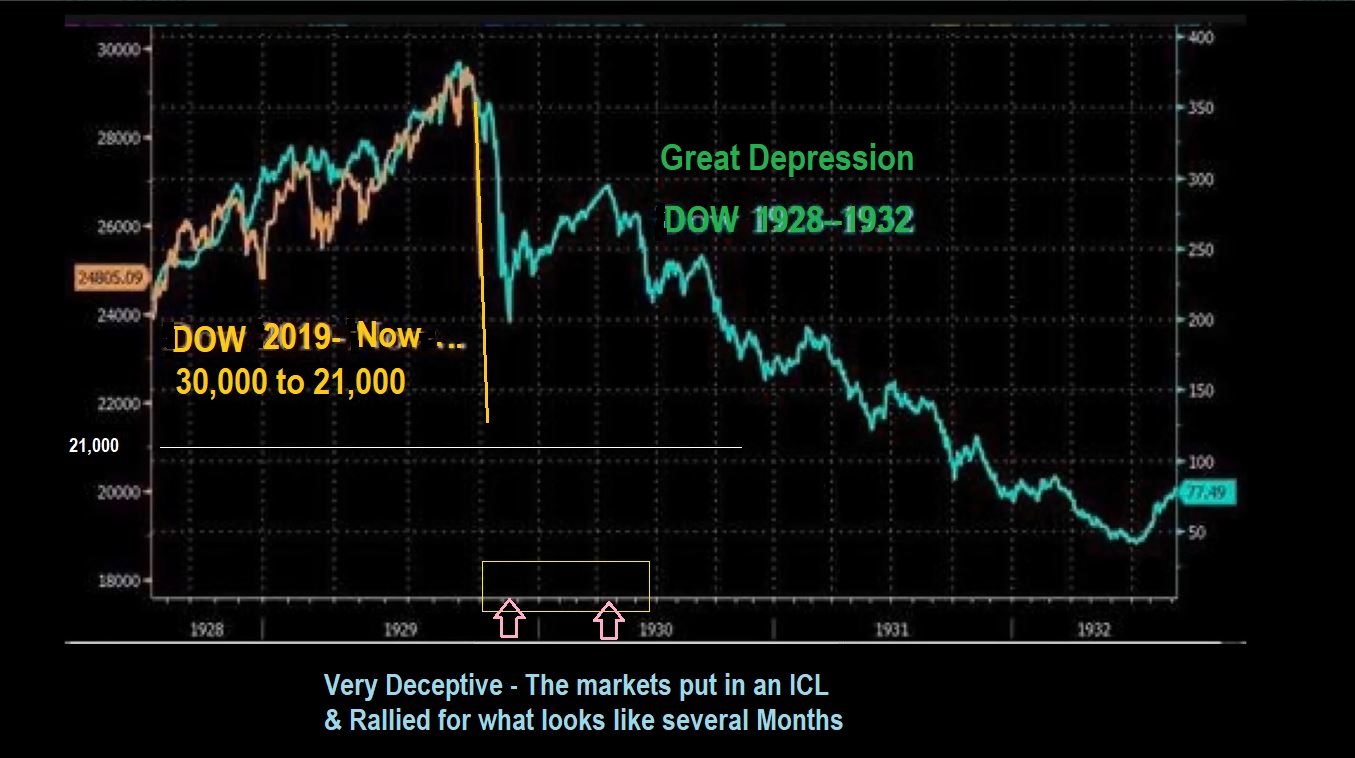
The current first daily cycle looks strong and is playing out as expected and as a reminder, We saw a very believable rally out of the 1929 Crash. It lasted for months ( looks like 3 daily cycles) and then a bear market still took over. We want to be alert to the possibilities, but right now TECH Stocks did ‘set up’ bullishly and continue to ‘set up’ Bullishly.
We have been trading & looking at various charts, and even at this point You can look at charts of CASA, LASR, SAIL, JBL, AMAT,AMD, SHOP, UBER, MU, TWLO, TSEM, ZM, WORK, CRWD, etc. and they remain short term bullish.
.
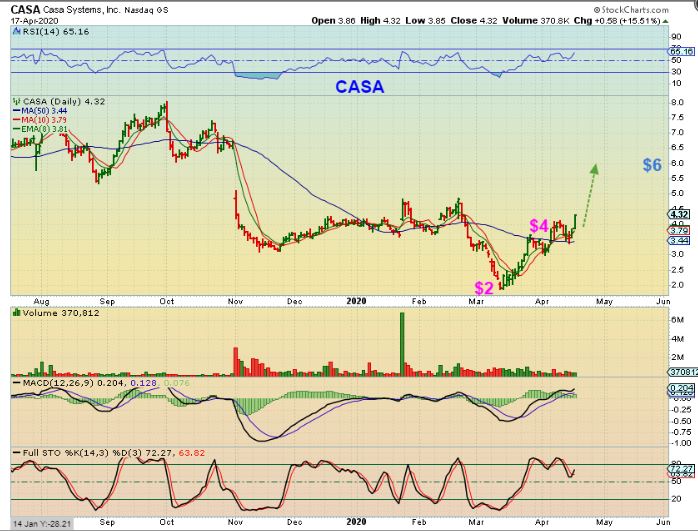
CASA – You can see that CASA has had a strong bounce from $2 and has set up bullishly above the 50sma at $4. It dropped to $2 and bounced to $4, and it looks like it wants to head to $6, but does that mean that all is Good now going forward, even if it runs to $6? Well…
n
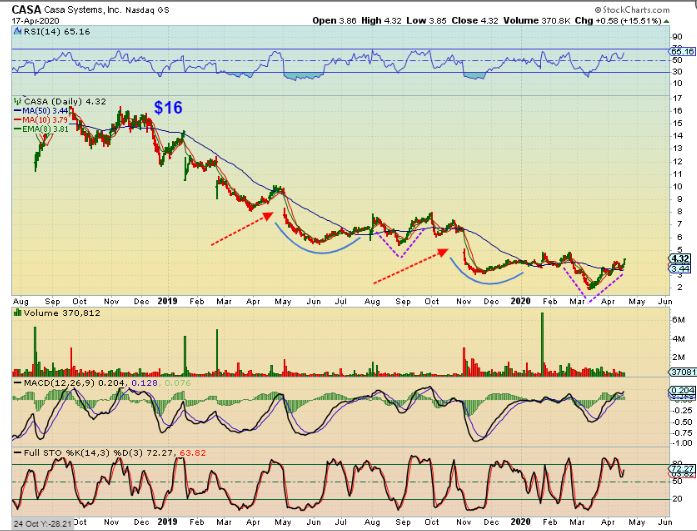
CASA did the exact same thing at the end of 2019. It almost looks identical with the recent Gap down, round base, V-drop & recovery, etc., so time will tell if these are real recoveries or just convincing bear market bounces and then the downtrends continue. For now – they are set up ‘long’.
n
.
SHOP – I pointed out SHOPIFY on April 8th as set up to try to break the downtrend. It was an inverse H&S and the business should do fine , even with COVID. Volume was increasing. AMZN, ZM, SHOP, ABT ( Abbott labs virus test) NVAX, CODX, etc . etc should do fine. I did NOT take this trade (unfortunately)…
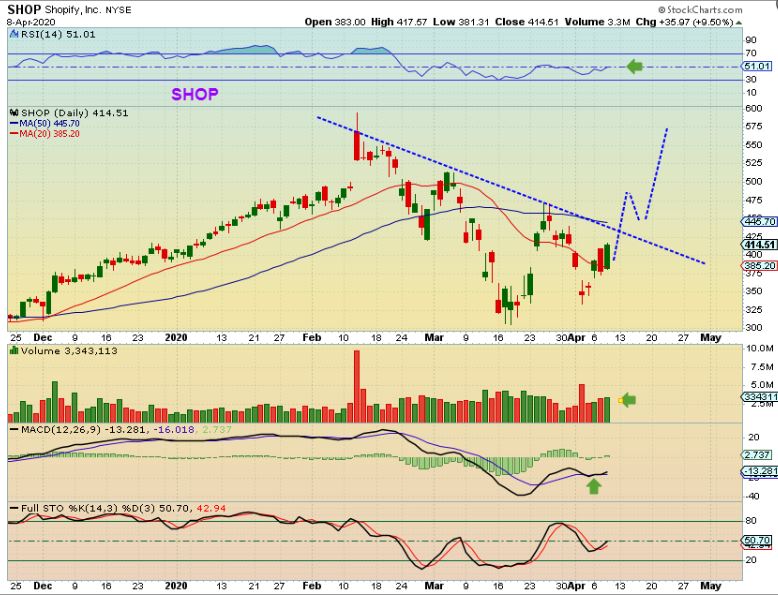
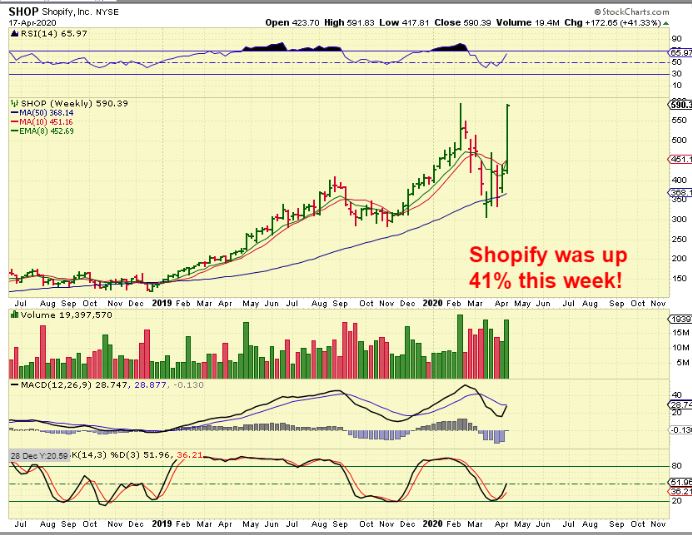
SHOP -One week later SHOP was up almost 45-%, and 41% last week alone, so some of these set ups are certainly playing out nicely. CODX was up 49%, and ABT and NVAX were up 12% too.
.
So until the markets start to break down, they remain bullishly aligned. ALL OF THE ABOVE HAVING BEEN SAID, WE STILL NEED TO KEEP THIS IN MIND…
.
SPX WEEKLY with the Coronavirus closing down so many business, the markets are now acting like all is well, and nothing is wrong. We could get a reality check in the markets after this daily cycle peaks too. The markets Looked VERY BULLISH RIGHT BEFORE THE CRASH, right? It can happen again, so we use stops and I’d even lighten up if I see tops start to develop in this sector.
.
.
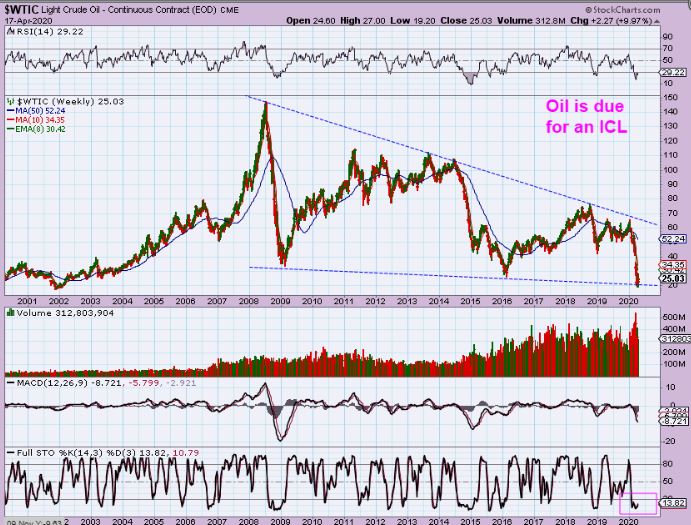
OIL WEEKLY – I have expected Oil to bottom and it is on day 51, which is right when Oil often bottoms. Oil & Energy stocks bottomed a while ago…
.
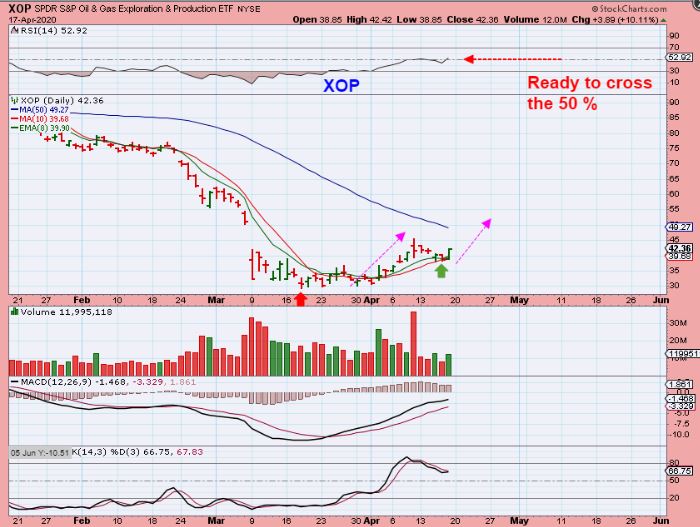
XOP DAILY -The XOP actually bottomed weeks ago and now even looks to have put in a higher low at the 10sma support. I thought that maybe Oil would bottom near day 40 because of this, but it played out with its normal 50 day daily cycle.
n
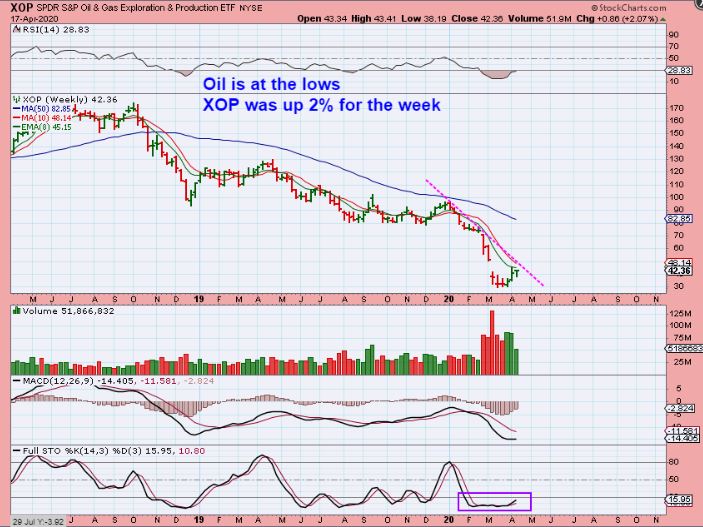
XOP WEEKLY – Step by step, we’ll see how this sector does once Oil starts moving higher too. Dec 2018 was a V-Bottom and then sideways. If this starts trading sideways like it did then, I may stop trading this sector, but for now I have been looking for higher price. The trades in this sector have been good ( MRO, APA, BE, PUMP, PVAC, OKE, VLO, etc. )
.
PRECIOUS METALS: The recovery in this sector is very Bullish.
.
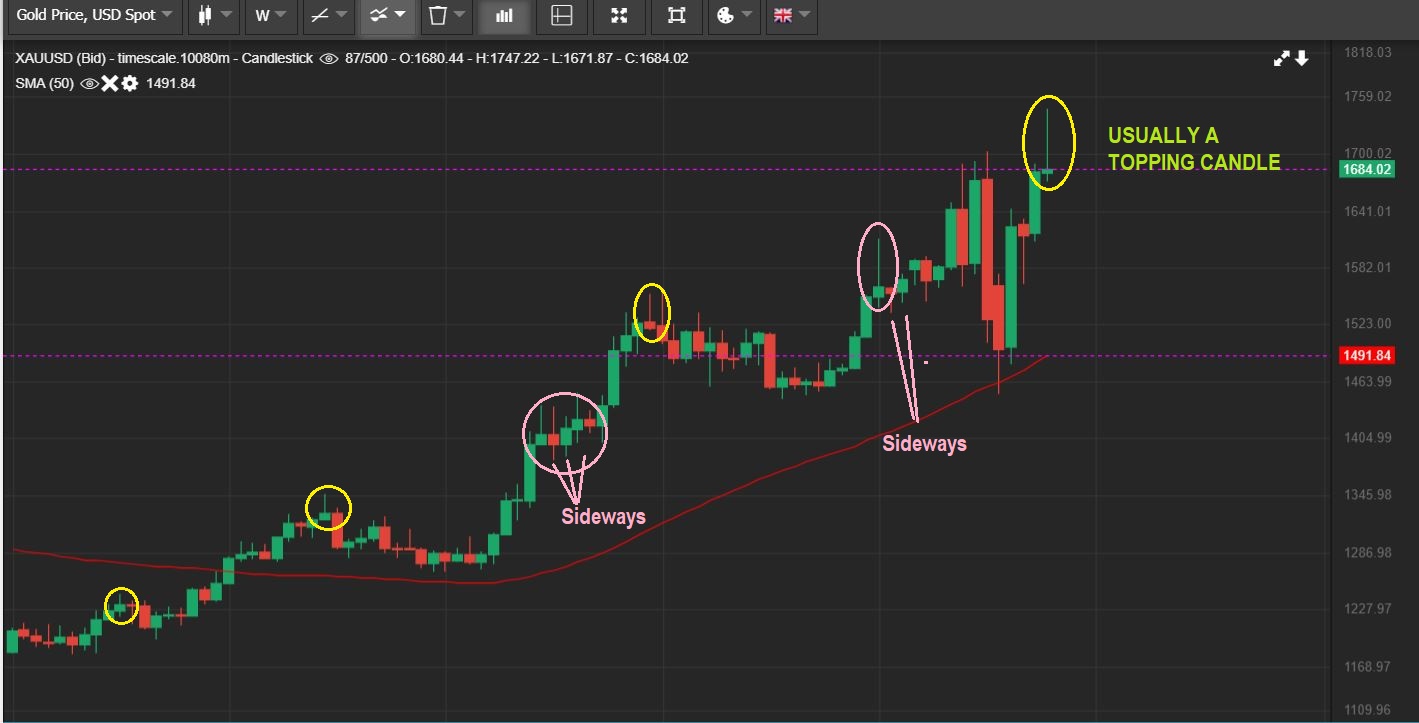
GOLD WEEKLY #1 – Gold made a nice run higher last week, but it sold off by the end of the week. That leaves us with a topping candle. As seen on this chart, that doesn’t mean that this now must sell off deeply. Look at the pink circled topping candles and you see that price went sideways too, so we could see that next week. We are due for a dcl soon though.
.
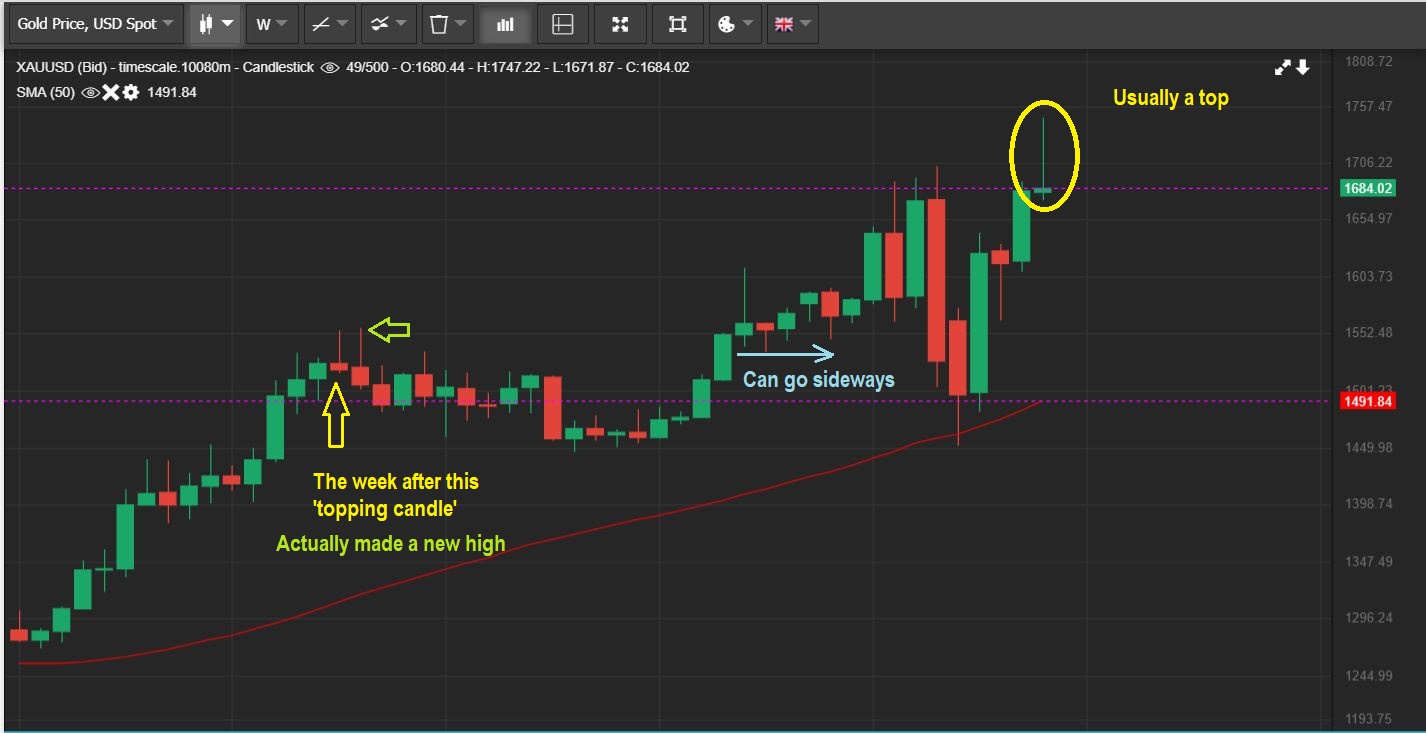
GOLD WEEKLY #2 – So zooming in,
1. Gold has a topping candle, but in the past we even had one that saw the following week make new highs before dropping lower. So Gold can move higher next week, but we are coming due for a low soon.
2. Currently we are due for a dcl. This was an ICL and the first daily cycle ran swiftly to new highs, so the next daily cycle low should be a bullish buy set up too.
,
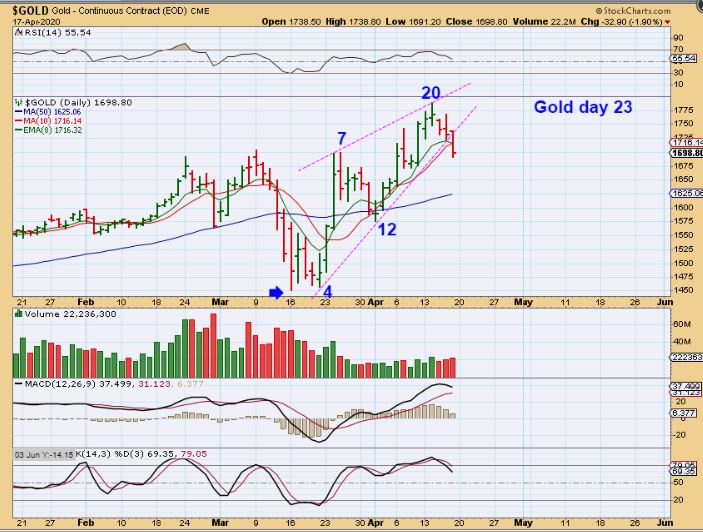
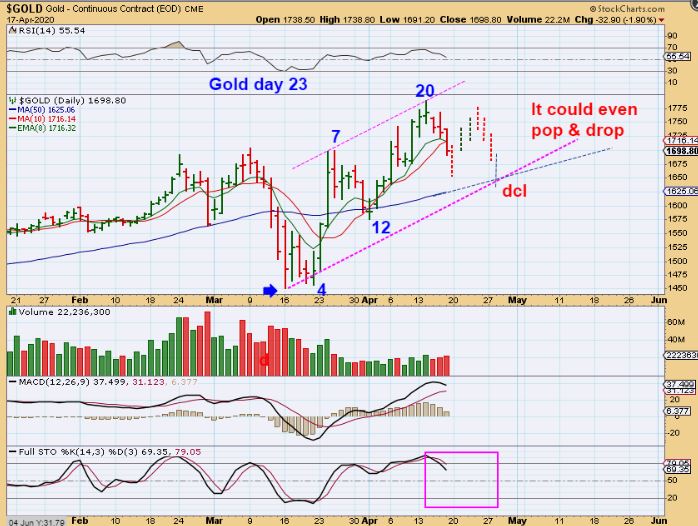
GOLD DAILY #1 – With Gold breaking the 10sma Friday, it also appears to have broken through the bottom of a wedge too, rather than breaking higher as hoped for. The weekly chart above shows it as a topping candle, so now we need to look at how this could drop from here…
m
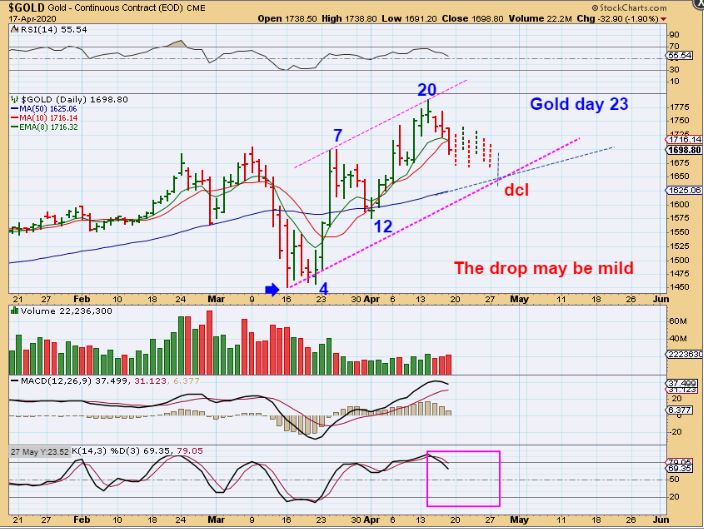
GOLD DAILY #2 – This was the first daily cycle and it had strong days and choppiness, so it may end with choppiness. I changed the wedge to a channel now and it leads to the 50sma. A back test of the 50 sma would be normal over time.
.
GOLD DAILY #3 – Gold could Pop & Drop too, because we have ‘time’ left in this daily cycle. Just keep in mind that Monday is day 24 and this could have 5-10 more days left in it. That goes for the Miners too.
.
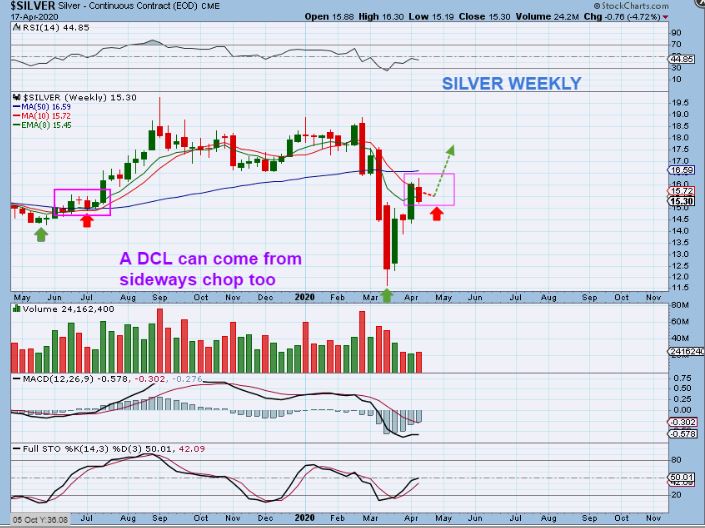
SILVER WEEKLY – Silver has not moved as Bullishly as Gold, it didn’t run back to recent highs yet, but it does look like it is forming a V-Bottom. A dip to a dcl will not hurt this set up.
b
.
THE MINERS :
.
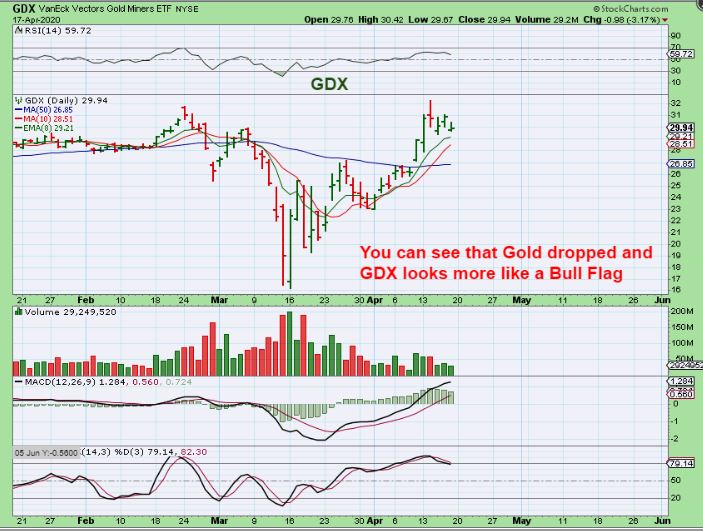
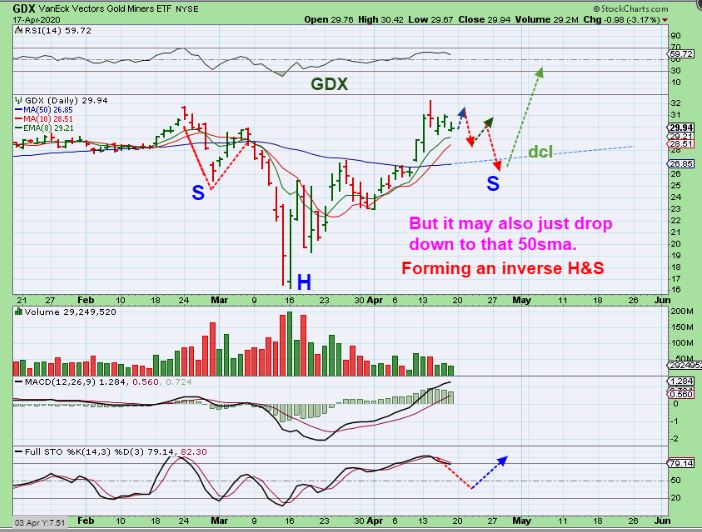
GDX DAILY #1– Gold broke down Friday as seen in its daily chart, but Miners didn’t follow. This does look a bit more like a bull flag, and next week will answer all the questions that the next 3 charts bring up 🙂 – Like “Is this a bull Flag?” and will Miners continue to resist Golds dip? If so …
,
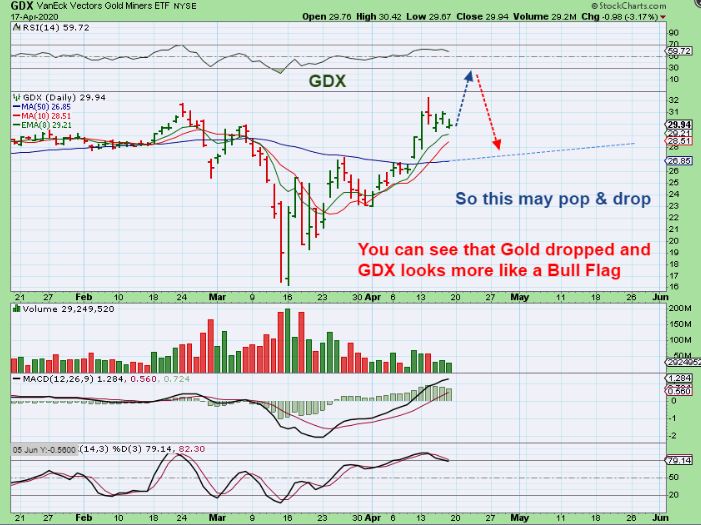
GDX DAILY #2-We could see a POP and Drop, because GDX will still be due for a DCL soon. So do we get a POP and DROP next week? If not…
,
GDX DAILY #3– GDX could just get choppy and droppy. A drop like this to the 50sma ( Think $26ish) would be normal and even present an inverse H&S, a Bullish Pattern with good upside potential. Let’s go to the weekly chart…
.
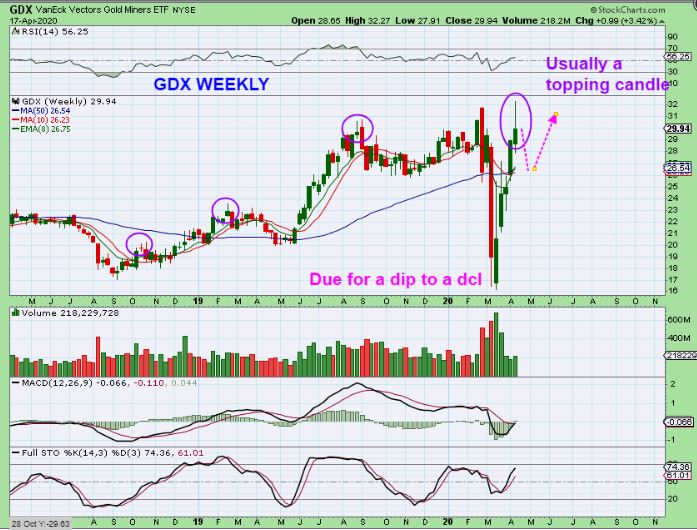
GDX WEEKLY #1– GDX also put in a weekly topping candle, so a dip to the dcl is expected one way or another. $26.50 is the weekly 50 ma.
b
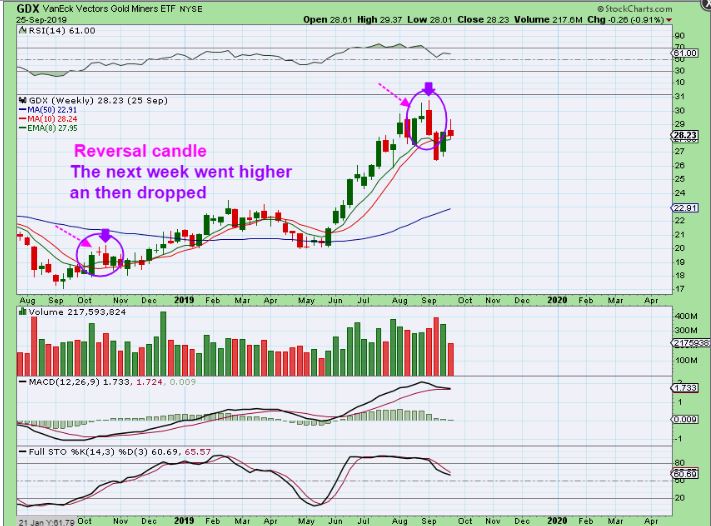
GDX WEEKLY #2– On this chart I am pointing out PAST Weekly Reversal candles. Why? Just to show that during the week following those reversal candles, price actually hit new highs again before dropping. THAT could explain a POP & DROP from a Bull Flag as shown in the daily charts above.
.
Please take another look at the Theme Picture that I chose for this report. That is considered a bullish set up, but is it climbing straight up? No. We see consolidation, choppiness, and pull backs along the way, yet it still climbs higher under bullish conditions. We have that now in most sectors of the Markets. We are trading moves out of ICL’s, and the run higher has been pretty steady and profitable. That said, time has begun to run long with the Miners, and they will be coming due for a dcl. I just want that opening theme picture to help everyone to be prepared for some possible selling, but I do expect higher prices again over time. Why? With the first daily cycle out of the crash being as strong as it has been, we would view the next dip into a dcl as a buy opportunity if you have cash on hand. It should be a higher low, and the 2nd daily cycle should rally higher. Individual Miners will also likely act differently, and that may affect how low the pull back becomes. Next week will give us additional insight in all of the sectors.
.
Trading was really good the past few weeks, and it should be really good in the weeks to come too. Enjoy your weekend, stay safe, and I really do wish good health to you and all of your families at this time!
.
~ALEX
.

