Thursday April 23rd – They’re Cooking
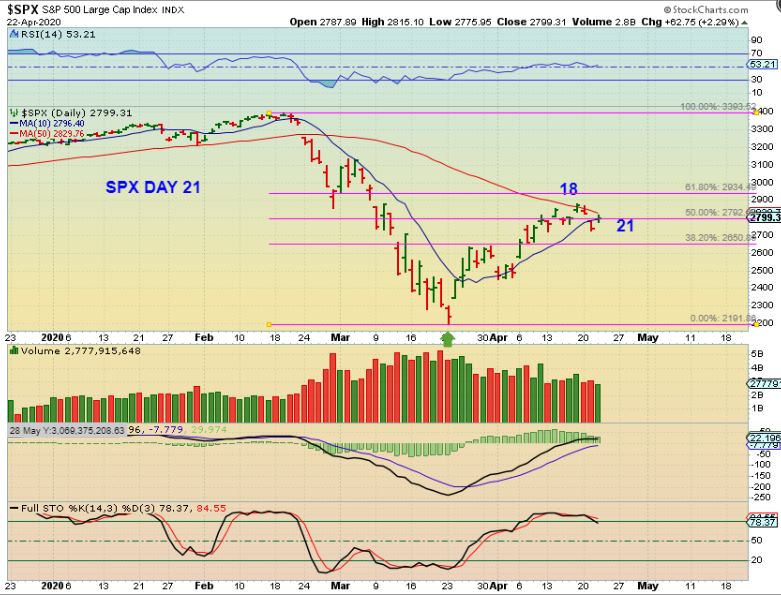
SPX – The General Market cycles can be long or medium length. For example: It can run 30+ days, it can run 40+ days. A day 18 peak is a bit short if this will be say 45 days, since a run from an ICL should be R.T. (Right translated). This could make 1 more POP higher to the 61.8% Fib line and then drop to a dcl, so…
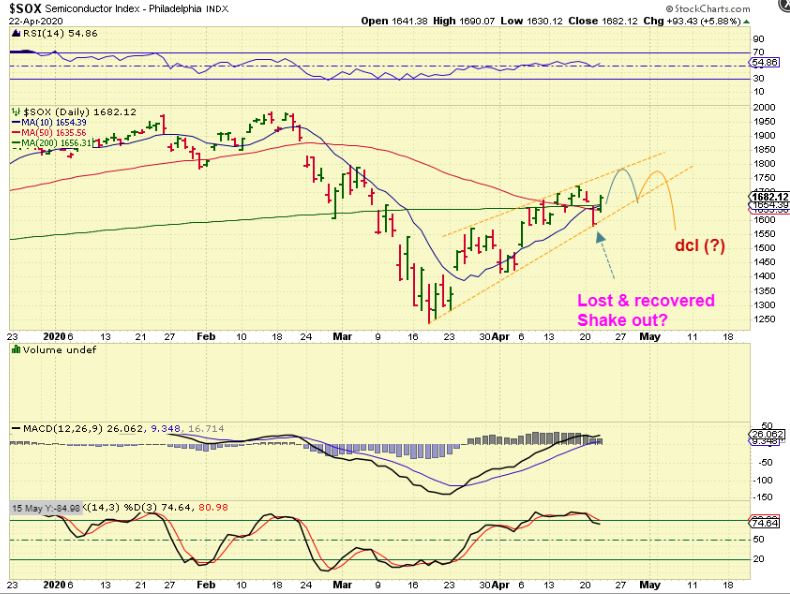
I took another look at the SOX – The Sox lost all of that support, but it regained the 50 & 200sma. So I see this 2 ways now…
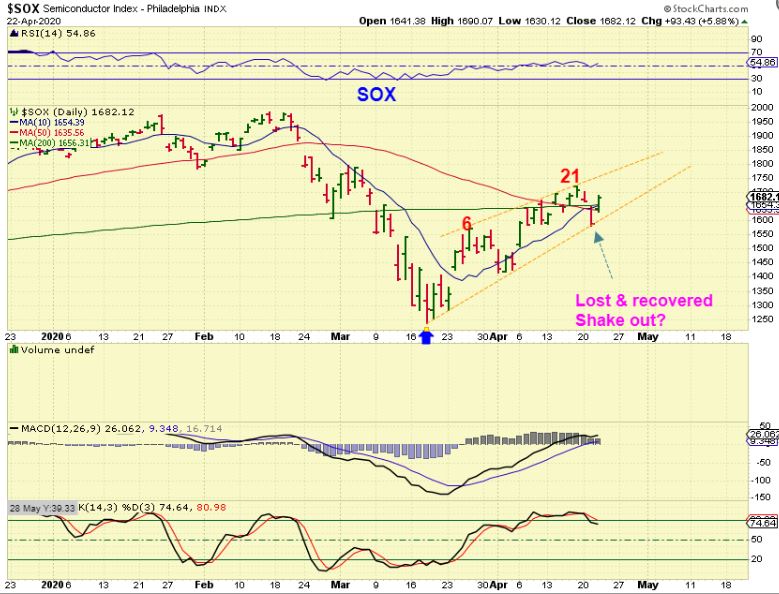
THE SOX might run higher, bounce around, and roll over to a dcl as shown here. That would still fill our expectations matching that 1929 drop that I pointed out in a few prior reports ( Please see the weekend report if you are a new sign up). If this runs to new highs? THAT will need to be monitored, but I find that LESS LIKELY.
.
.
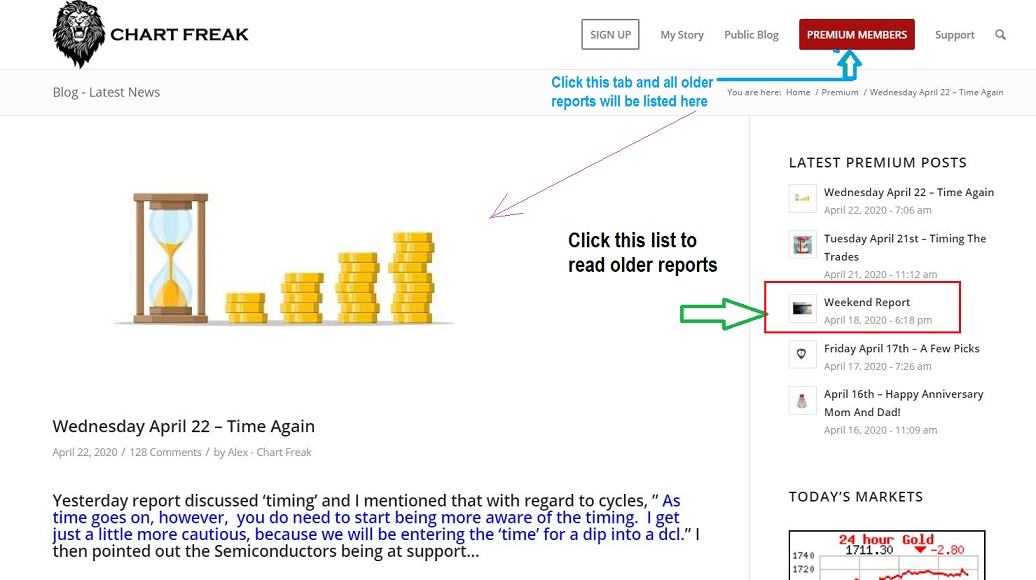
If the General Market runs to new highs? THAT will need to be monitored, but I find that LESS LIKELY. I still view this as playing out how I outlined it in the weekend report. The right hand column of this page lists prior reports, and you can go back & read the weekend report clicking in that column, as shown here. Click to enlarge this screen shot.
.
.
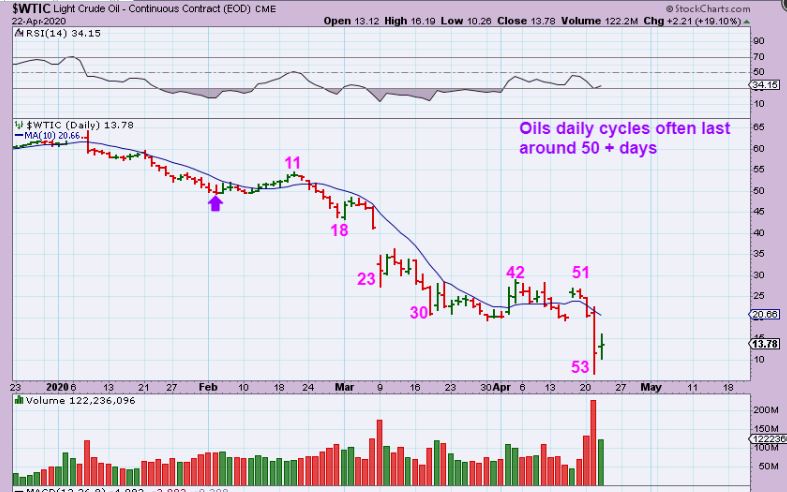
WTIC – I have pointed out that Oils cycles normally can last around 50 days normally. We are now ( after a massive collapse) At day 53. So now Oil could bounce, but as has been pointed out in the recent reports, OIL STOCKS have actually been very bullish for weeks…
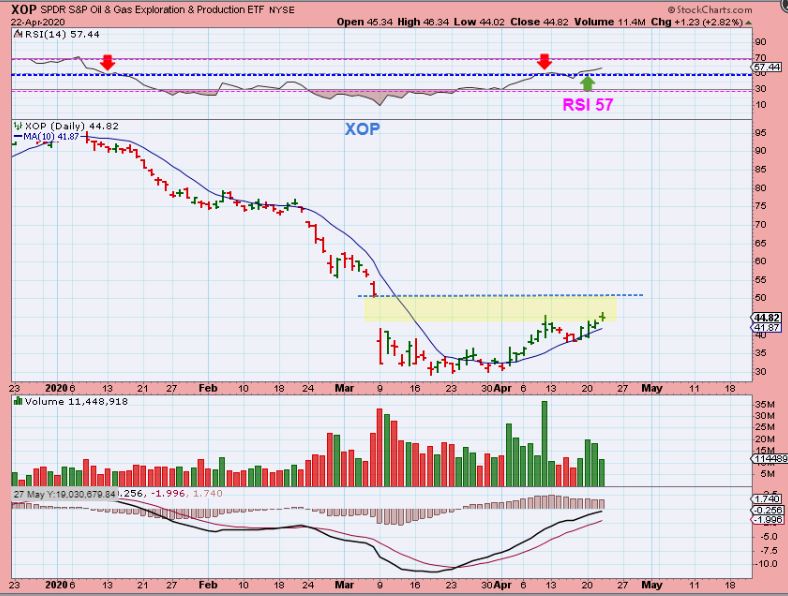
XOP – I have pointed out the XOP, XLE, OIH and many individual stocks that bottomed weeks ago and are either basing out or popped and now have put in a higher low near the 10sma. Some of these stocks have already bounced 100%! I will touch on this again at the end of the report.
.
TODAYS MOST REQUESTED SECTOR: PRECIOUS METALS 🙂
.
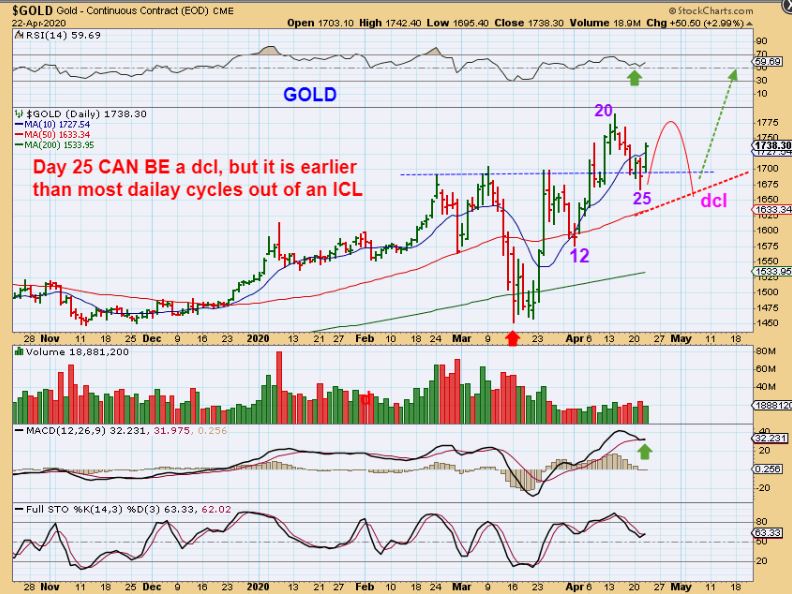
#1 question: Could that be a DCL ( Daily cycle low)?
Answer: It really can’t be ruled out when we have such a strong sector. It would be a stealth dcl for the Miners if it is, because even though GOLD did break a lower trend line & reversed back over the 10sma, Miners didn’t. The move out of these lows has been VERY STRONG, and a dcl here would be a bit early & a bit out of the ordinary, since it doesn’t meet all of the criteria. That said, we still could have a dcl ahead. I have recommended NOT over -trading out of positions or trading around the dip, and I’ve even mentioned ADDING at the many Bull Flags , because this is strong. It was leverage that I would be careful with. Lets look at the charts…
,.
GOLD #1 – So we have a reversal in Gold on day 25. Possible dcl? Maybe, but this was a bounce possibility mentioned in the prior reports too. When I mentioned it, I was saying that it may be a final bounce that is not Yet the dcl, so we now have to see how this plays out.
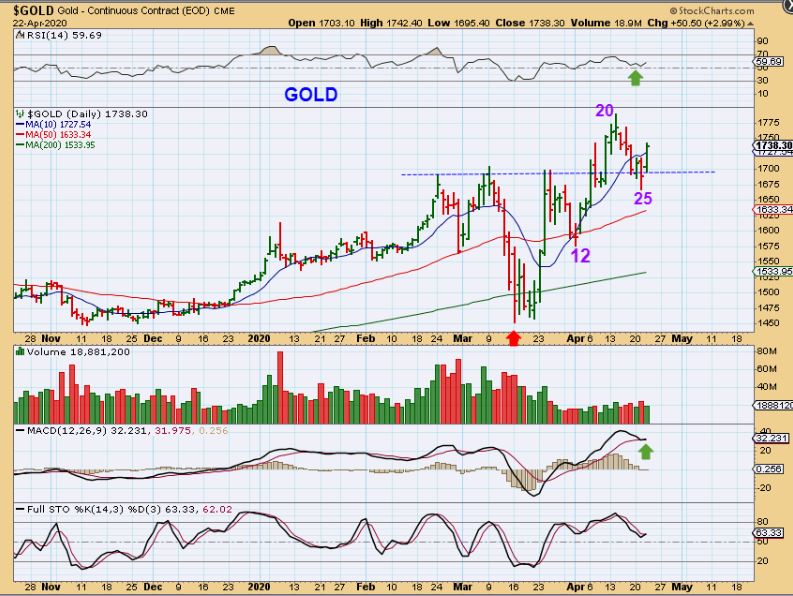
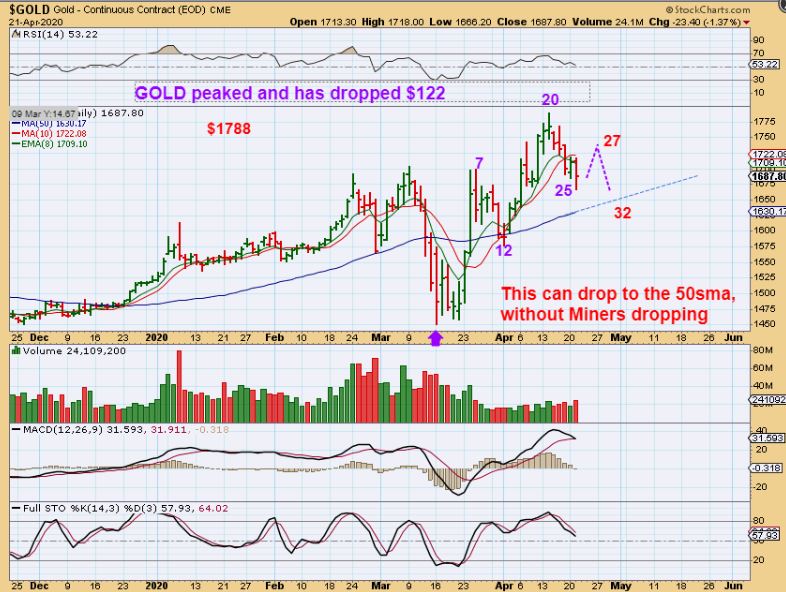
IN YESTERDAYS REPORT I STATED: WE DO NOT KNOW EXACTLY WHAT GOLD WILL DO, HOWEVER: If GOLD is on day 25 and our daily cycles often run 33 or so days ( More or less), Gold may dance around like this, eventually tagging that 50sma, but Miners may just continue to hold up & show relative strength.
So now we’ll just have to watch GOLD and see if it plays out this way with the DCL still ahead near day 33? Or is this the dcl on day 25? With the lack of clarity, we remain invested in this sector either way, because it has been very bullish.
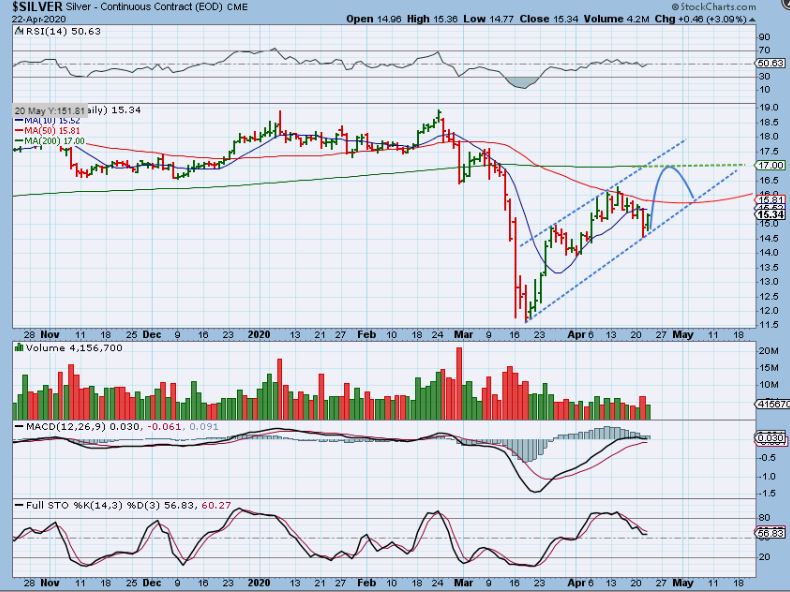
SILVER reversed higher also and the upper trend line is now parallel with the one that I can draw as the lower one. We have that 50sma as resistance…
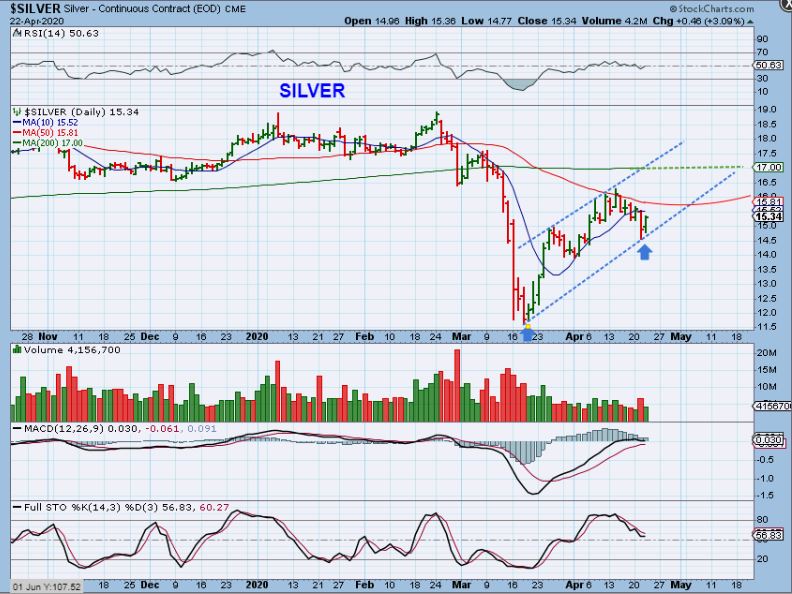
SILVER – If the dcl is still ahead for Silver, it could actually land higher than Silver is right now, as shown.
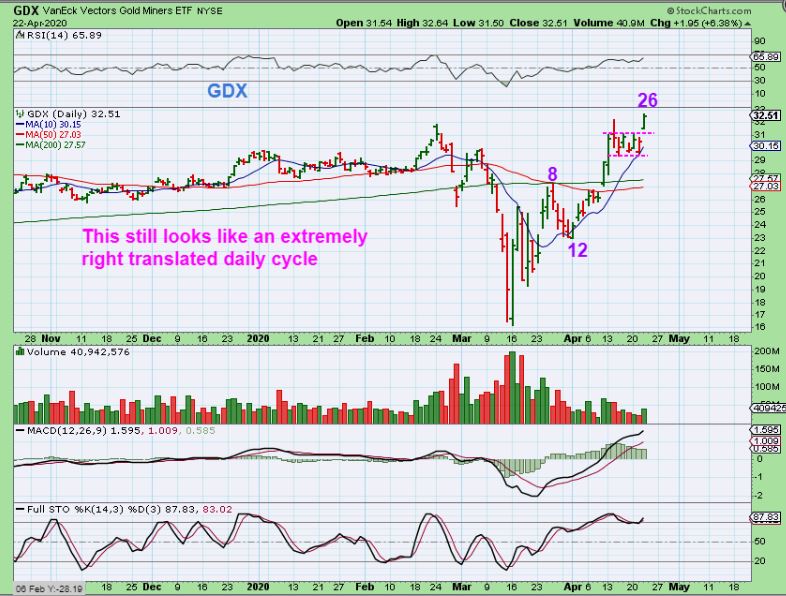
GDX #1 – You can see that Miners are leading Gold & Silver, making New highs on what is likely day 26.
.
GDX #2 I do NOT see a clear dip into a dcl in Miners, do you? So if Gold had a DCL, it means that Miners ignored the dip and did a sideways bull flag stealth dcl. The Bull flags are breaking out as expected, so it remains bullish. IF THE DCL LIES AHEAD …
.
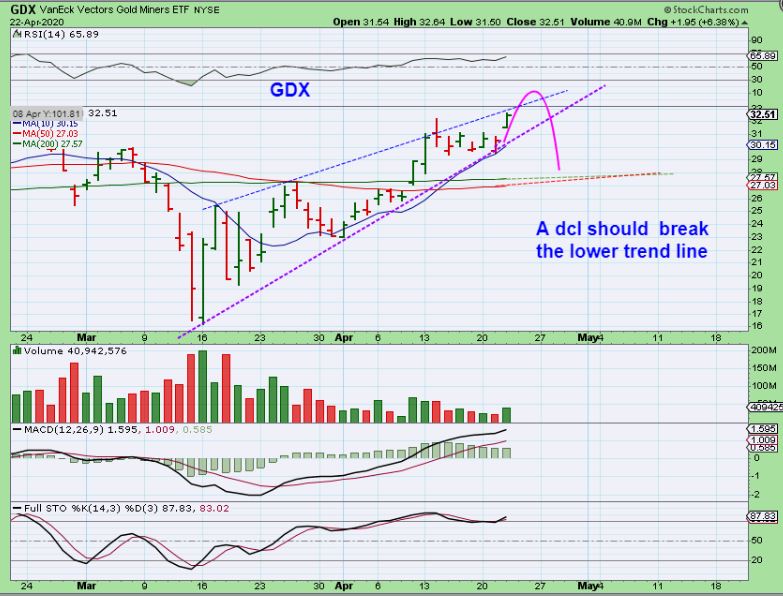
NOTE: IF A DCL STILL LIES AHEAD, GDX may look like this by day 33 or so. When you get a ‘normal‘ DCL, a lower trend line is broken. Wednesday is day 26. A TAG of the 50sma would be a normal back test/ DCL ( I know that this seems too bullish to do that, but you know that these Miners can drop quickly into a dcl). The idea is to stay invested, and dont let a dip throw you off if the dcl is ahead. PLUS…
‘
The reminder also has been that individual Miners may do their own thing.
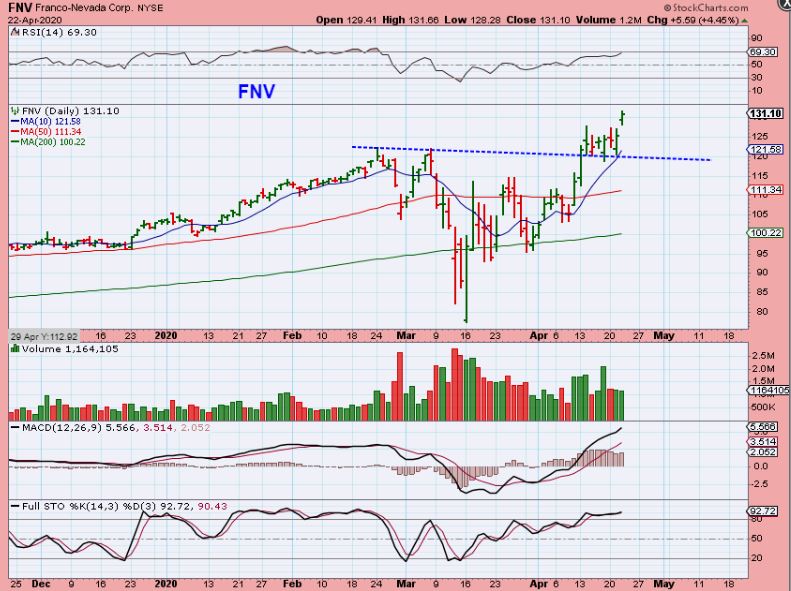
Yesterdays report hammered the point home: While GOLD dropped 4 out of 5 days, many stocks like FNV just continued to remain bullish.
.
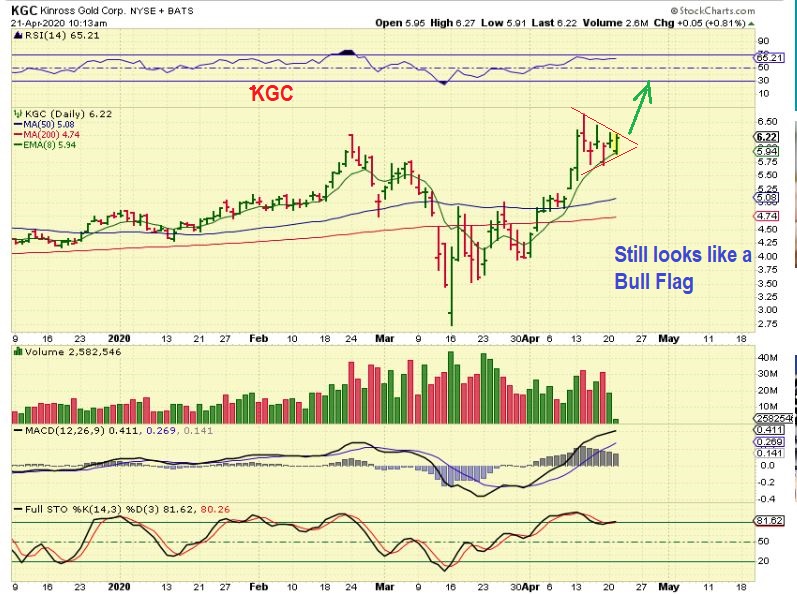
KGC FROM YESTERDAYS REPORT – Remember how I kept pointing out that “Gold dropped $122 on 4 out of 5 days” yet KGC & other Miners are a bull flag, still holding up above the 10sma.
,
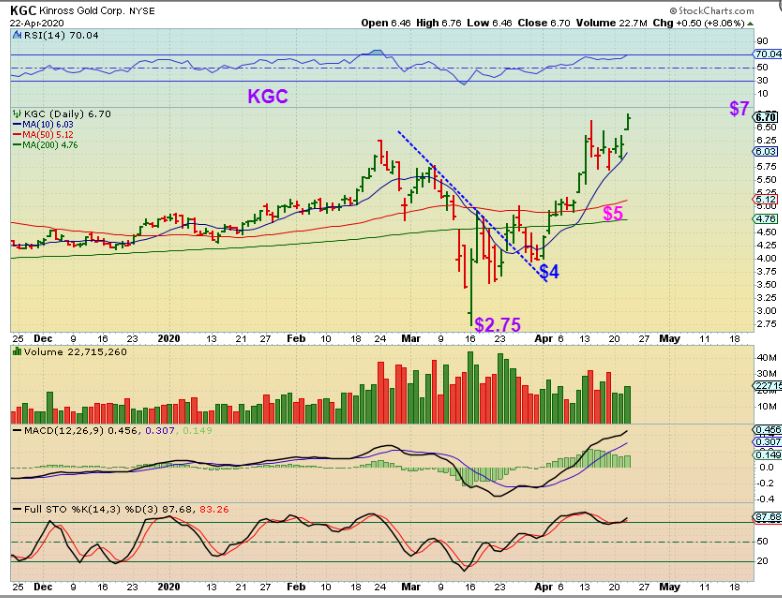
KGC broke to new high too, for example. Look at these gains since March. Many of us bought this weeks ago when I recommended it, and I wouldn’t sell it for a possible mild dip, I would add on that dip, because…
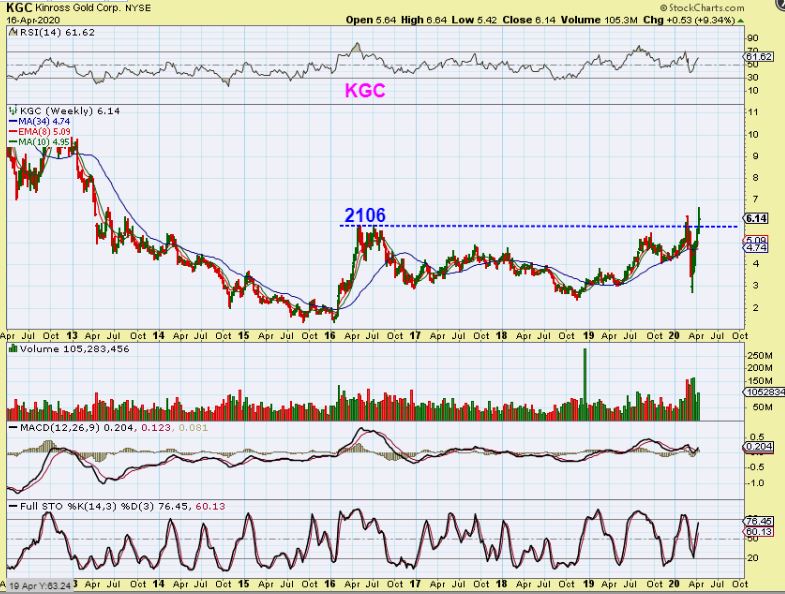
KGC – I posted this big Picture chart last week, to show that KGC broke above the 2016 highs already , and…
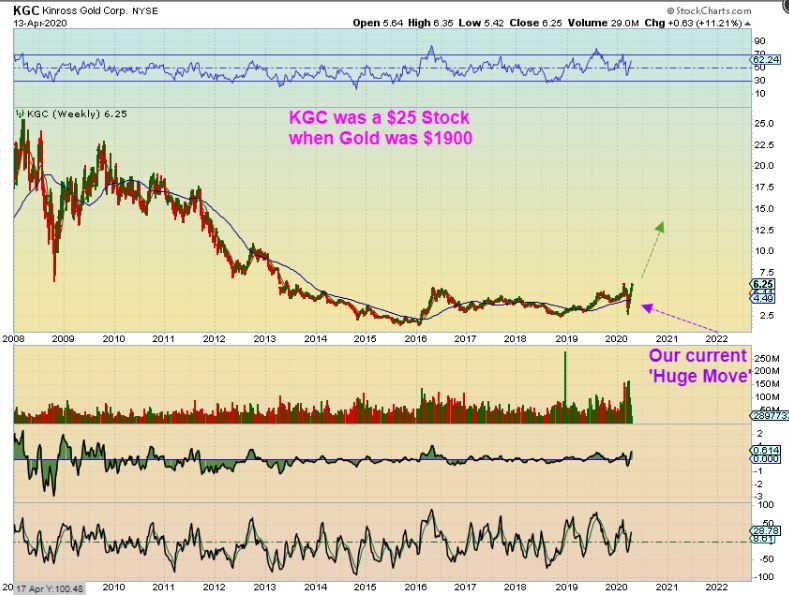
KGC – I posted the Bigger Picture chart on April 13 to point out the longer term potential. These Miners have enetered a BULL market and the potential gains are great.
.
So nothing has changed from the recent reports. Yesterday I repeatedly pointed out that GOLD dropped $122 for 5 days, but Miners were not selling off. They are bullish. We are just watching these scenarios play out, and trying to be ready for any opportunities that may come our way. If Gold & Miners just start running day after day, we would make money. They are pushing higher from their bull flags. If Miners dip to a dcl, we can add to position and make more money shortly thereafter as we push higher during the 2nd daily cycle.
Lets see what Thursday brings our way, and I will discuss a few more things below.
,
Enjoy your Thursday trading!
.
~ALEX
.
WHY YOU SHOULD STILL BE IN MINERS ( or added at Bull Flags). Again, when GOLD dropped for 5 Days and lost $122, Miners remained bullish.
.
HL broke above that 50 & 200sma Wednesday…
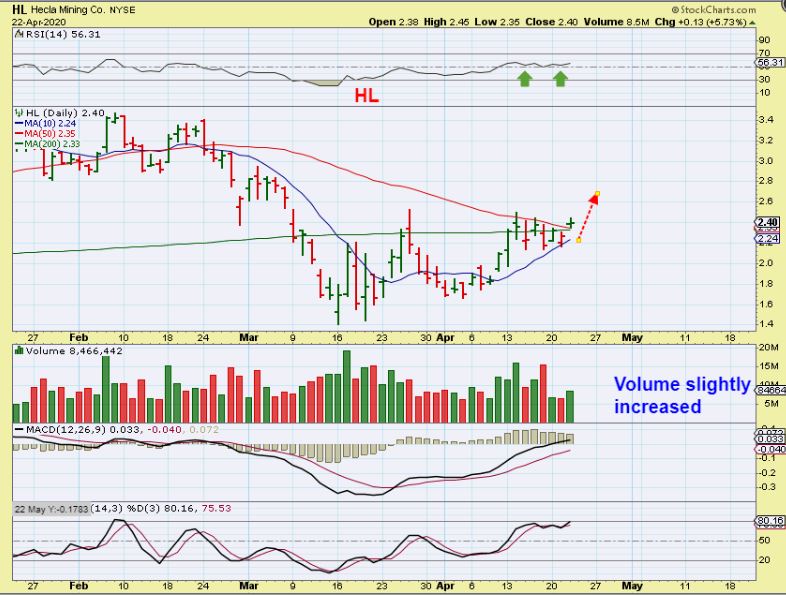
It might run and then simply back test during a dip to a dcl.
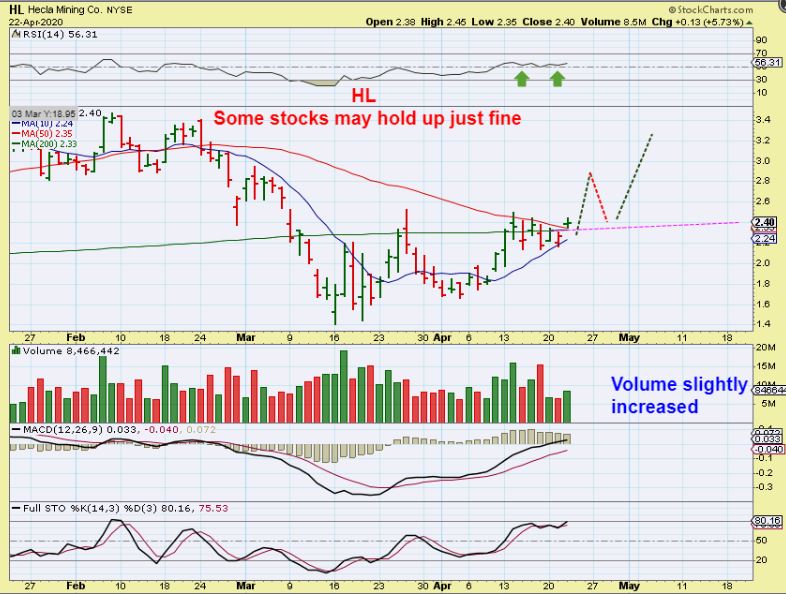
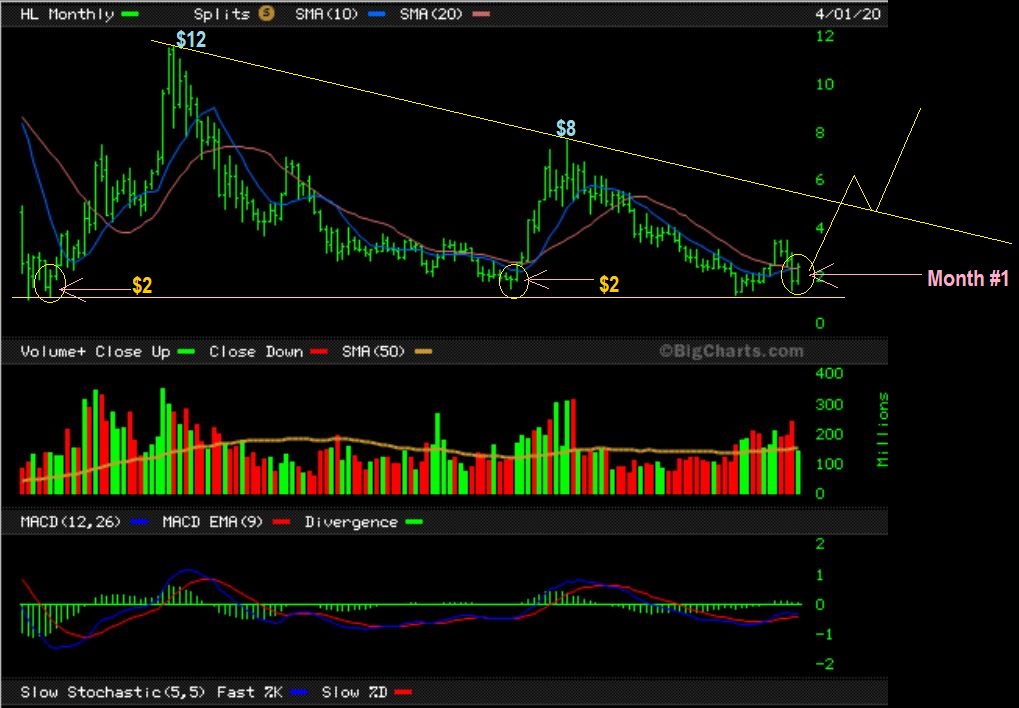
HL – If you buy a $2 stock with the potential to go to $4 ( 100%), that is great, right? Or the potential to run to $6 (200%), that is excellent. Well, HL in 2008 ran from $2 to $12, and in 2016 it ran from $2 to $8 IN 1/2 a YEAR!
.
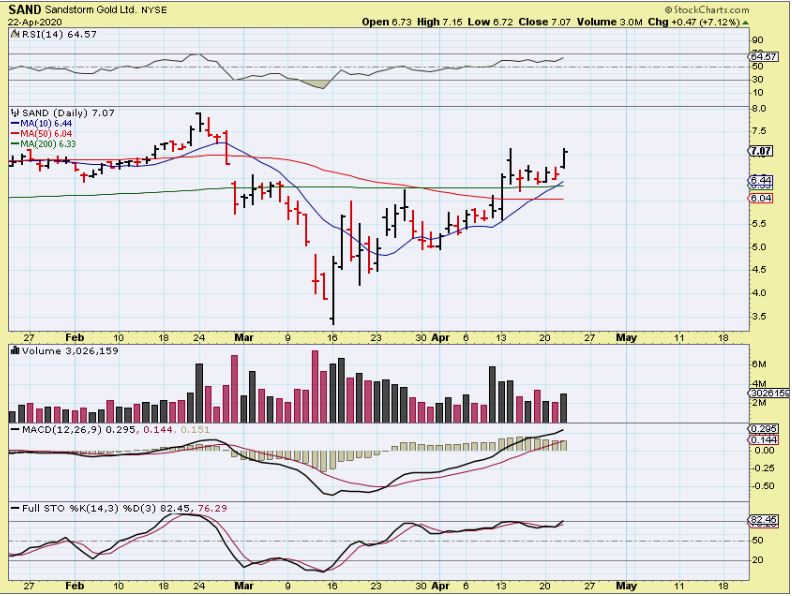
SAND FROM YESTERDAYS REPORT – This is a bullish sideways move while Gold sold off for 5 days, so…
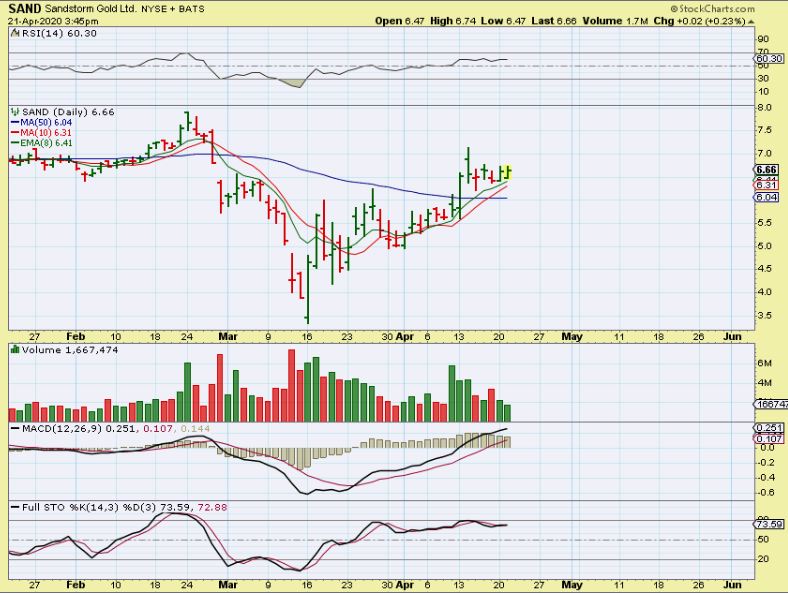
SAND did break higher when Gold decided to move higher too. This was a bullish crawl along the top of the 200sma.
.
YESTERDAY I WROTE: SSRM gapped lower and then broke back above that 50sma. SSRM looks like the gap down is being accumulated while Silver sold off sharply.
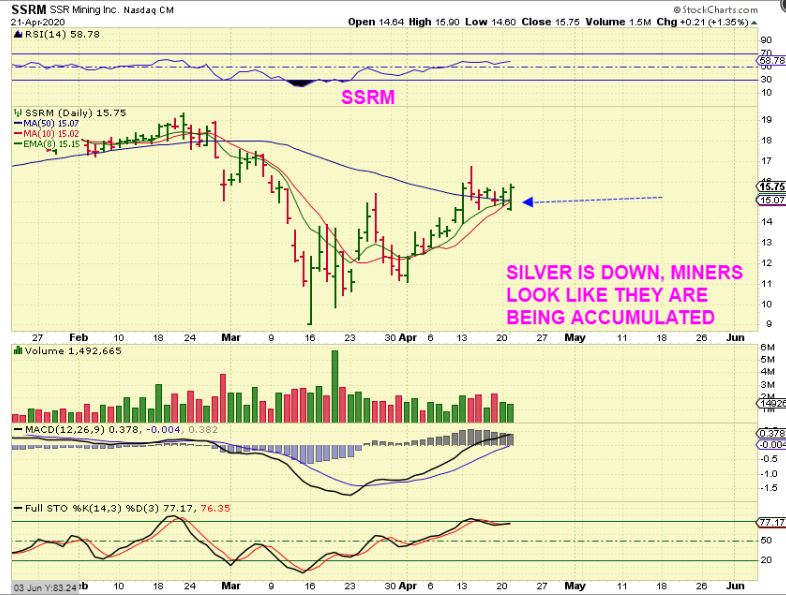
,
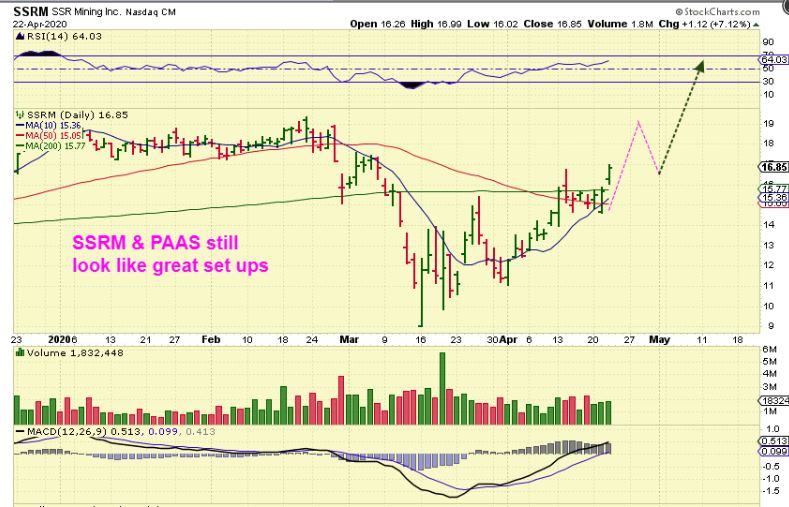
SSRM had 7% follow through Wednesday. A DCL ahead may just offer a back test. PAAS was also pushing higher.
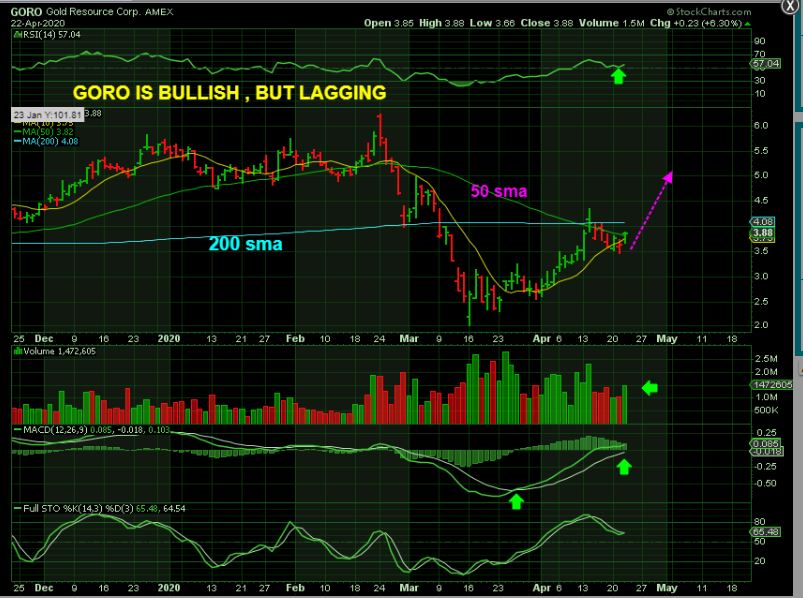
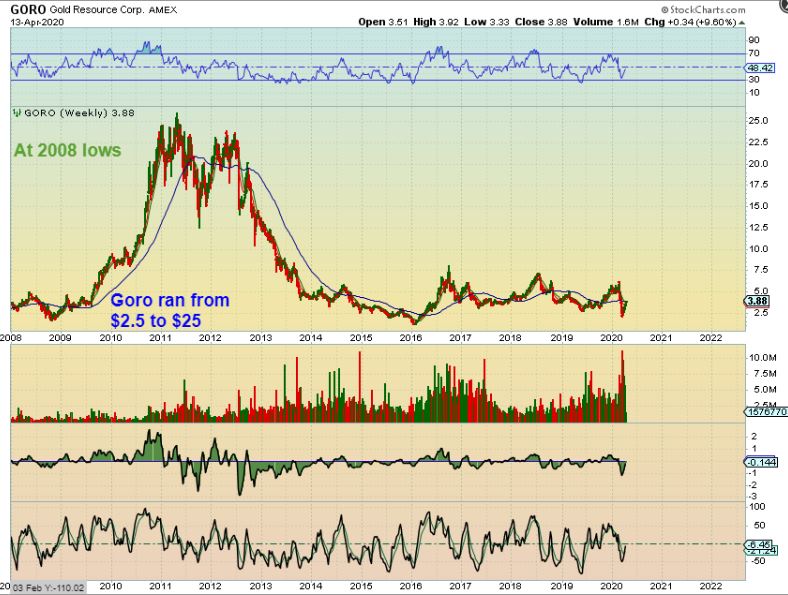
GORO might be considered lagging since it isn’t at prior highs like some of the others, but it is a bullish set up. It is up 100% from the lows, so that’s not bad for a ‘laggard’, but…
.
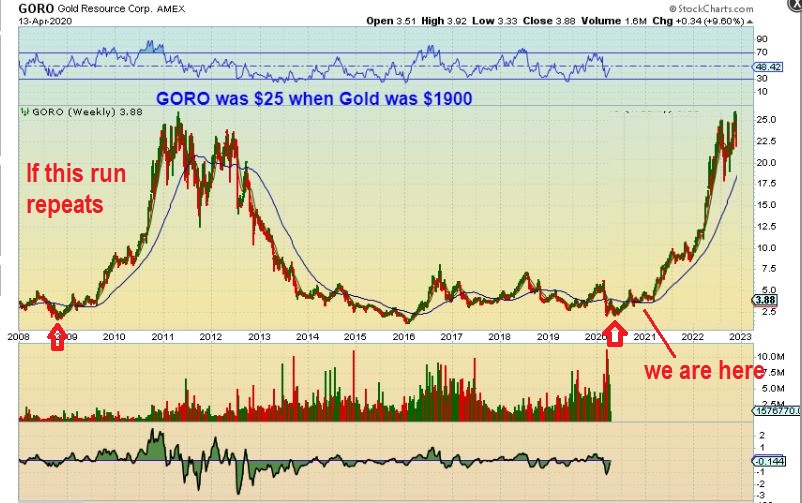
I posted this Big Picture chart of GORO almost 2 weeks ago, and the potential is excellent. $3 to $25 over time would be a real winner.
.
I actually ‘copied’ the climb from 2008 to 2011 to show how GORO would look if it made that climb now.
.
THIS CHART FROM YESTERDAYS REPORT: IAG is coiling under the 200sma with GOLD selling off. Many Miners are currently coiling , flagging, and consolidating recent gains, preparing to make another run higher …
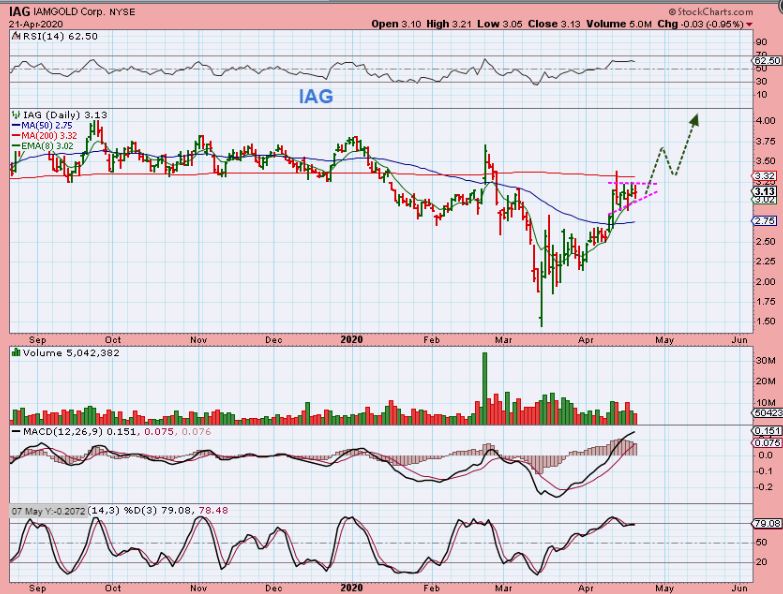
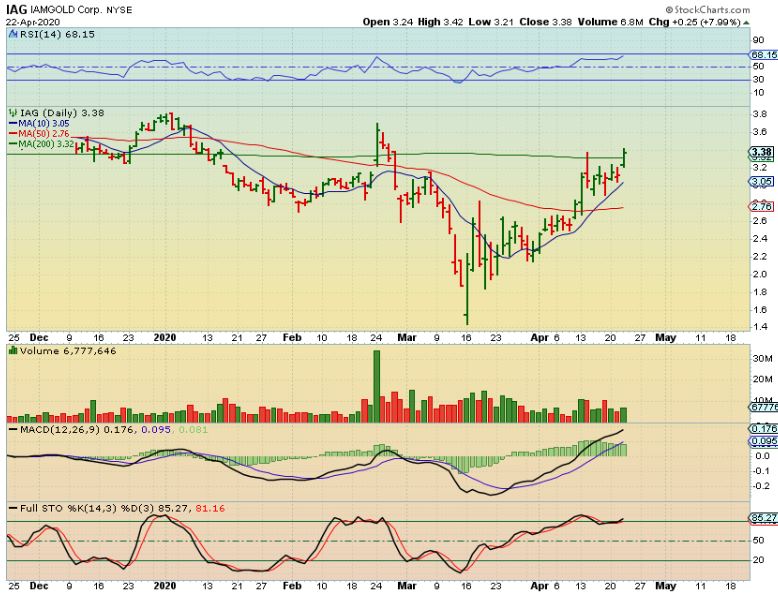
IAG started to push higher and is also breaking that 200sma. That is a buy signal really, and IAG was up 8%.
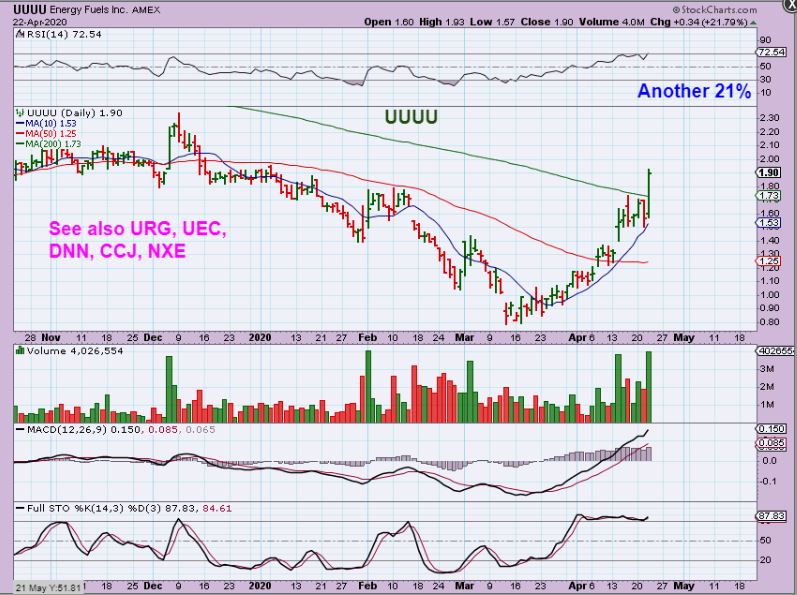
The Uranium stocks ‘paused’ but never really pulled back more than the 10 sma. UUUU, UEC, URG, etc were up big yesterday again.
.
ENERGY STOCK
.
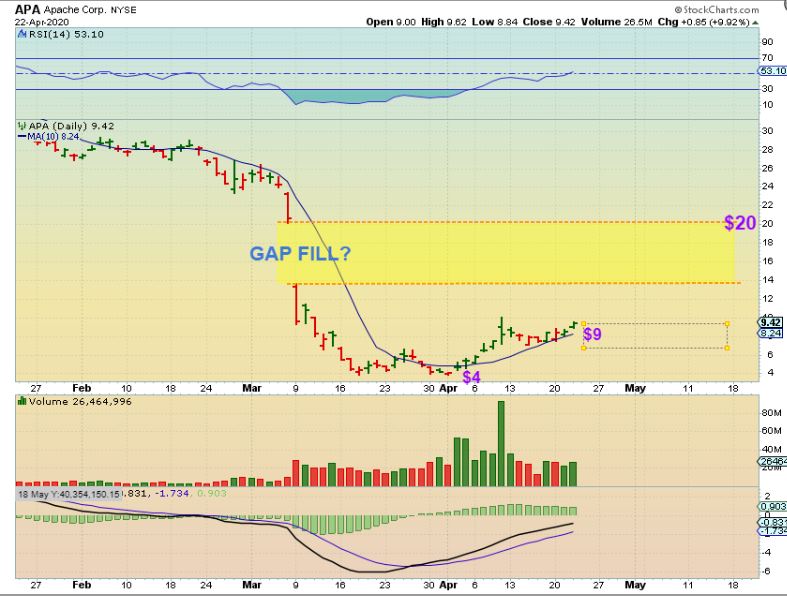
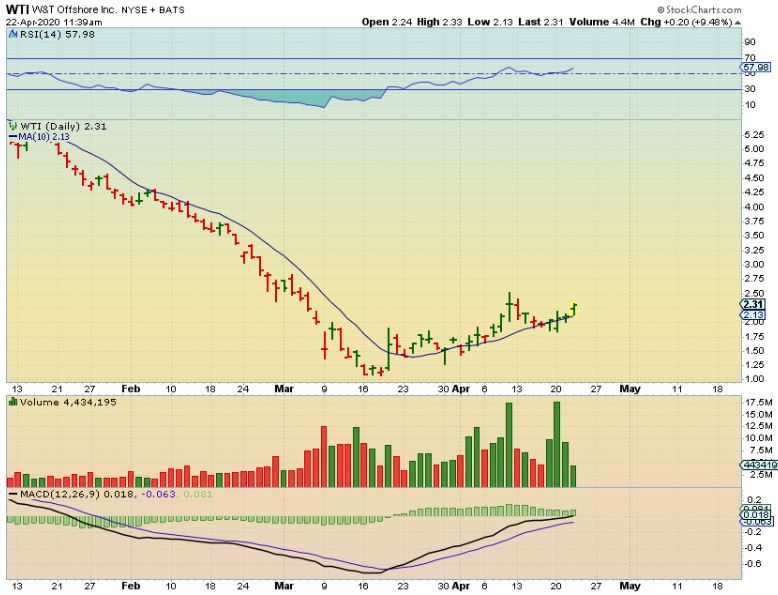
APA and many of the others that I have been discussing are putting in higher lows and continuing higher. I have traded MRO, APA, OKE, PVAC, WTI, and more. They are making big gains, even while OIL was still getting crushed down. These are not easy to ride though, they rise and drop 10-20% in 1 day.
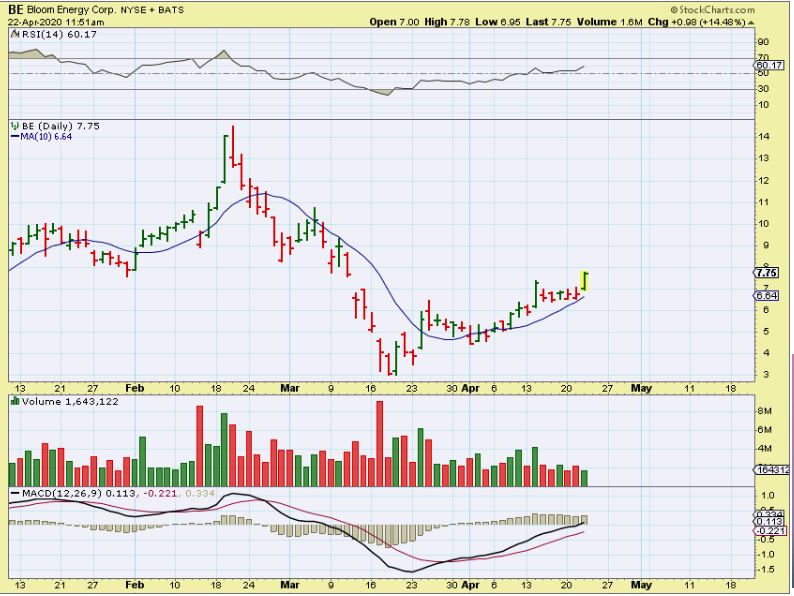
You can see that these are often finding support at the 10 sma area. BE was up 15% again, and is up almost 200% off of the lows.
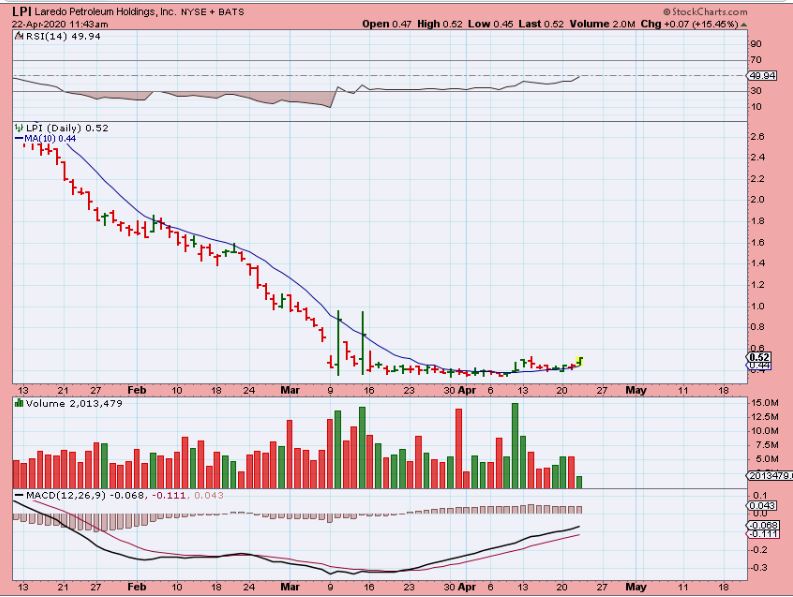
LPI is a long flat base, and it may be a laggard that is ready to run with Oil. This small pop was up 15% yesterday.
I took a position yesterday in WTI and TUSK to try this sector again. It is choppy and difficult to ride, but again, it is up 100% in 1 month. KEEP POSITIONS SMALL OR REASONABLE TO KEEP RISK LOWER.
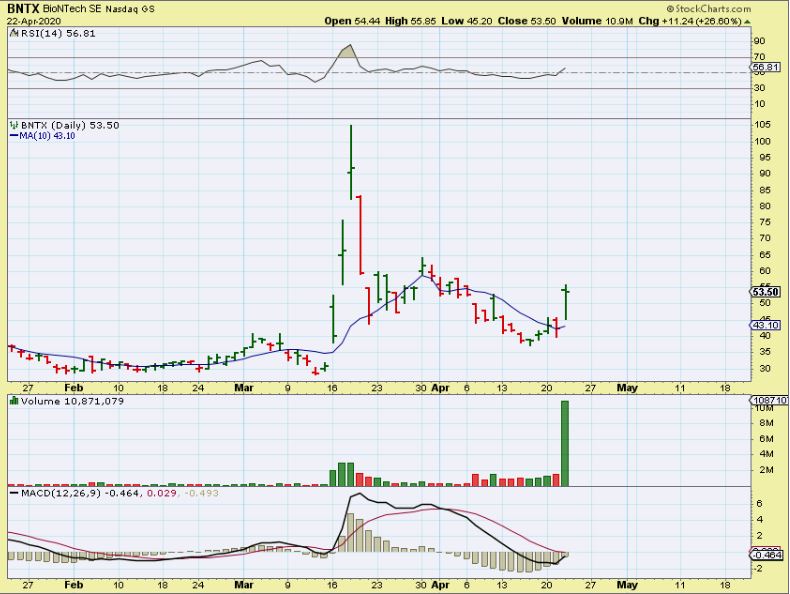
Recently 10 or so BIOTECH Coronavirus or treatment hopefuls were mentioned. They included INO, NVAX, BNTX, VXRT, etc.
.
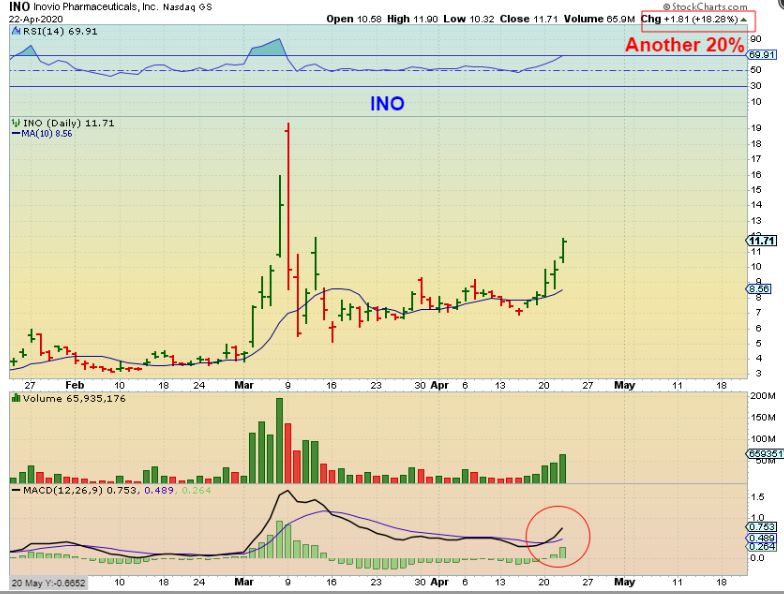
I mentioned that I was buying INO in the $7- $8 area and posted this chart showing that it was at support. I was asked by email if I still own it, because others took the trade with me…
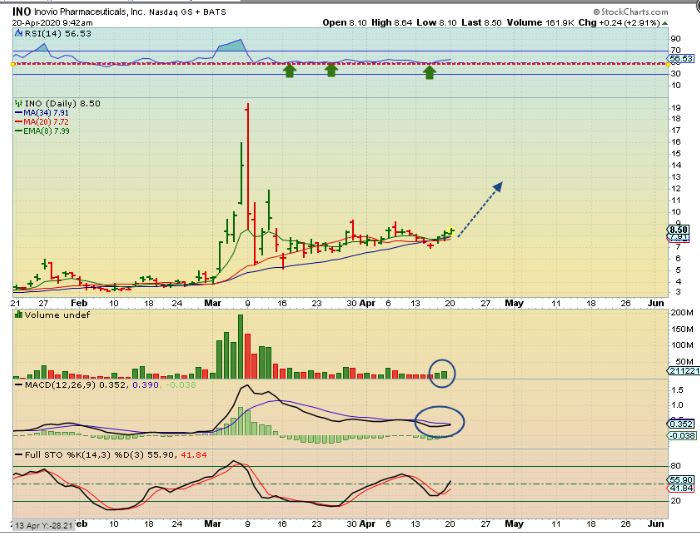
INO – You can sell anytime you want to lock in gains, or even sell 1/2 and let some ride, but I have seen these run to recent highs and I still have a full position at this point.
BNTX – This is one that I did not take as a trade ( I took VXRT instead), and …
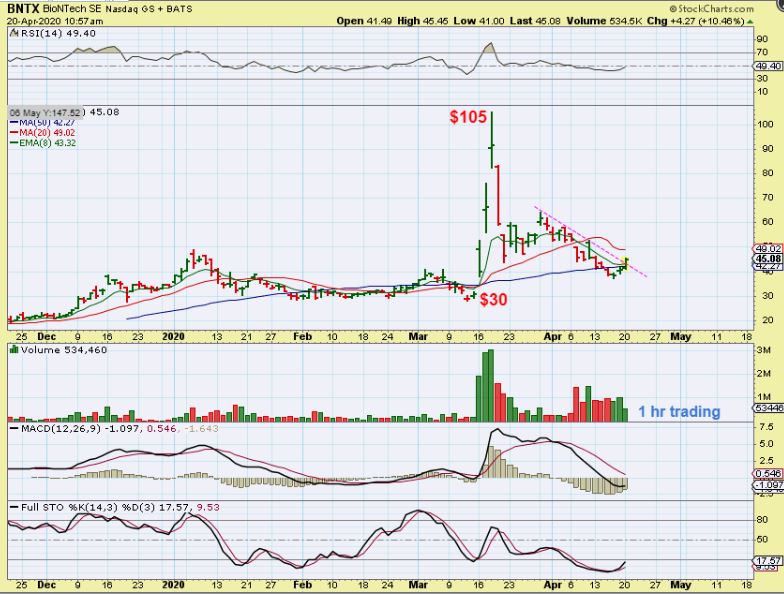
BNTX actually Popped open, closed that gap, and then continued back to the highs yesterday. This was a 26% gain, congrats if you got it. The volume was high, it should continue higher over time, but these can be a rough ride too.