Friday April 24 – A Sign Of Weakness?
Today is Friday and it is the last day of a great week of trading. This report is going to simply cover the markets, so let’s get to the charts…
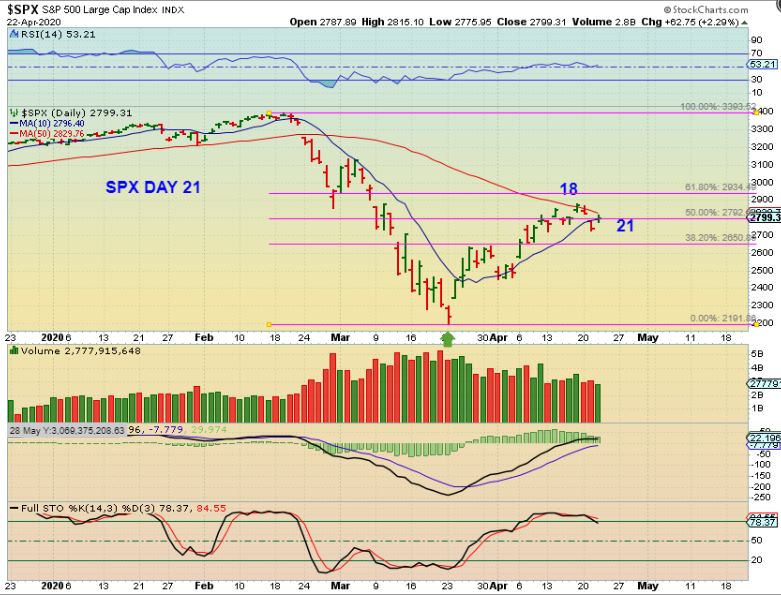
YESTERDAYS REPORT: SPX – The General Market cycles can run 30+ days, it can run 40+ days. A day 18 peak is a bit short if this will be say 45 days, since a run from an ICL should be R.T. (Right translated). This could make 1 more POP higher to the 61.8% Fib line and then drop to a dcl …
.
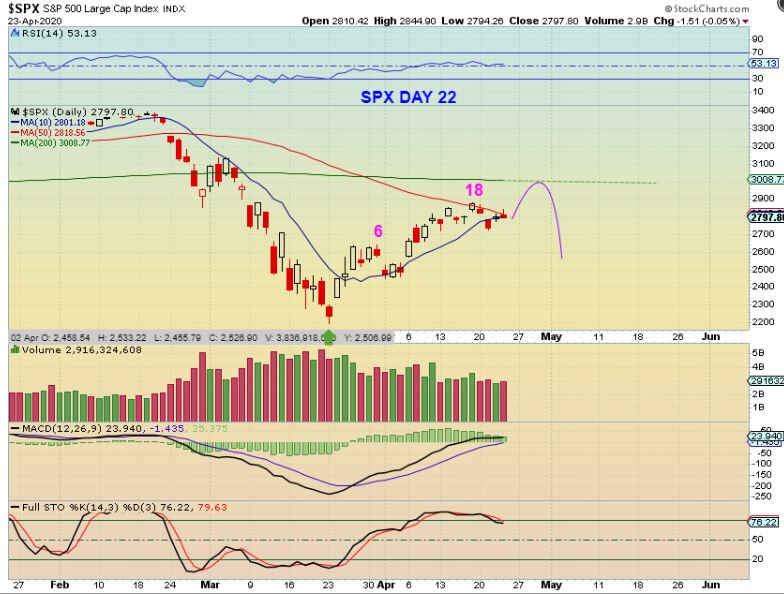
On Thursday the SPX struggled at the 50 sma again. The General Markets rallied early and then sold off, so we need to see how this plays out, but there is still time to rise and tag that 200sma. In the bigger picture I expect a dcl and then another rally attempt in the 2nd daily cycle.
.
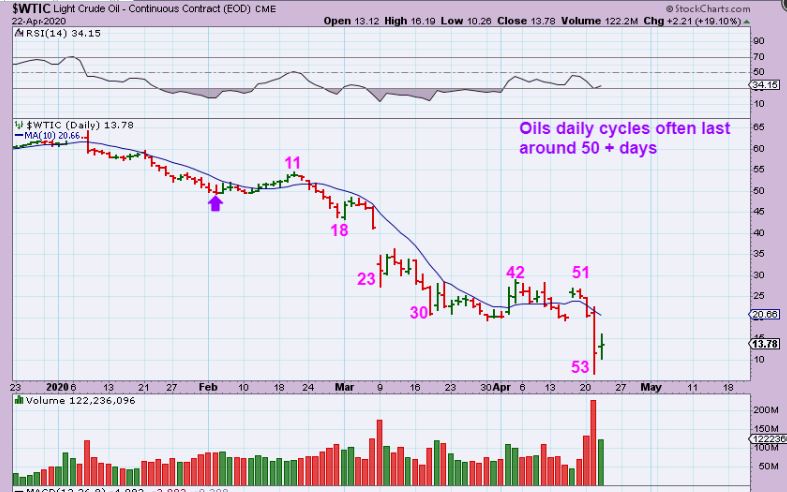
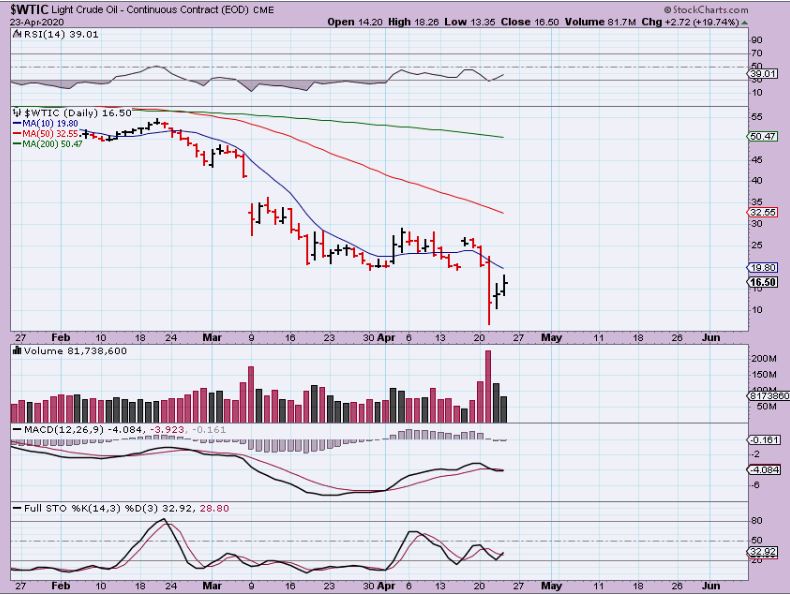
FROM YESTERDAY : WTIC – I have pointed out that Oils cycles normally can last around 50 days normally. We are now ( after a massive collapse) At day 53. So now Oil could bounce, but as has been pointed out in the recent reports, OIL STOCKS have actually been very bullish for weeks…
.
WTIC – On Thursday Oil did continue the bounce & Oil stocks continued to rise. This could be day 2 of a new daily cycle.
.
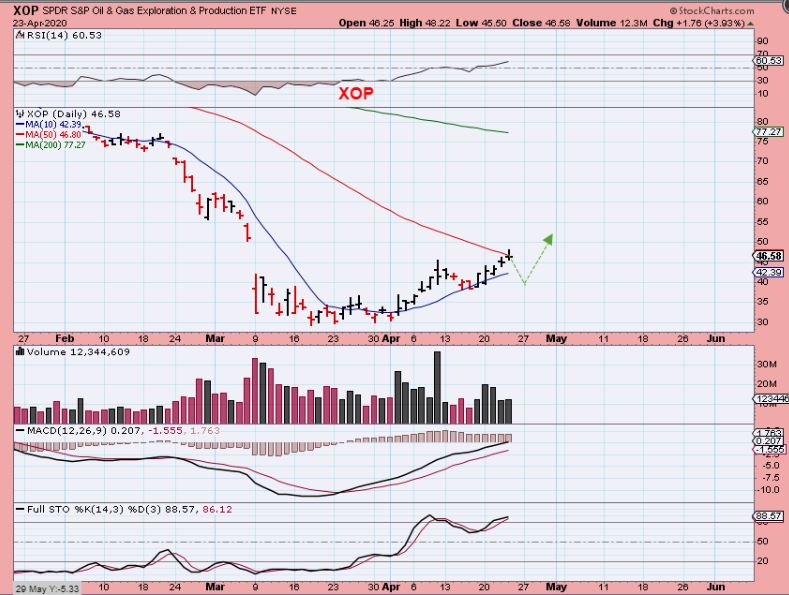
XOP – This doesn’t look like much of a gain and it did finally hit resistance at the 50sma, so it could pull back here, but MANY Oil stocks were up 10% and some were up 50% & 100%+. The POP off of the lows can be exceptional. I will discuss this a bit more briefly at the end of the report.
.
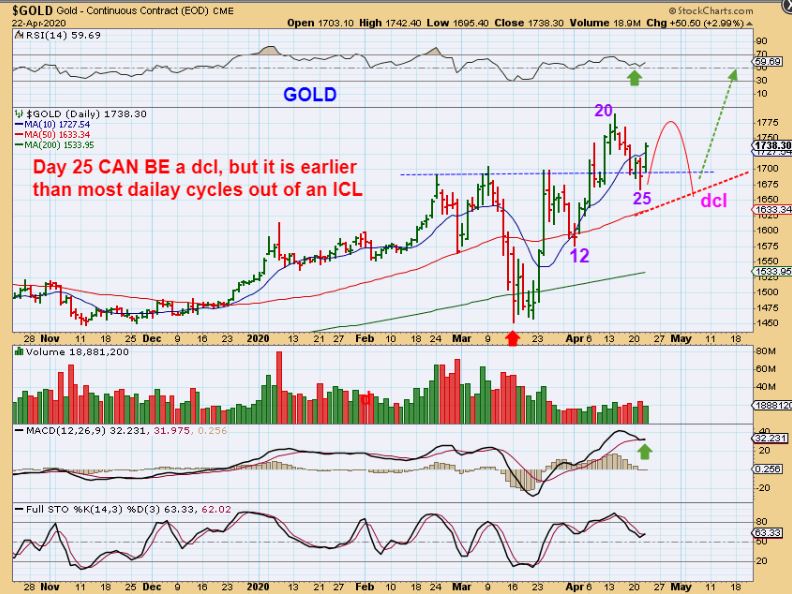
YESTERDAYS REPORT I WROTE : So now we’ll just have to watch GOLD and see if it plays out this way with the DCL still ahead near day 33? Or is this the dcl on day 25? With the lack of clarity, we remain invested in this sector either way, because it has been very bullish. (It could pop and roll over as shown here).
.
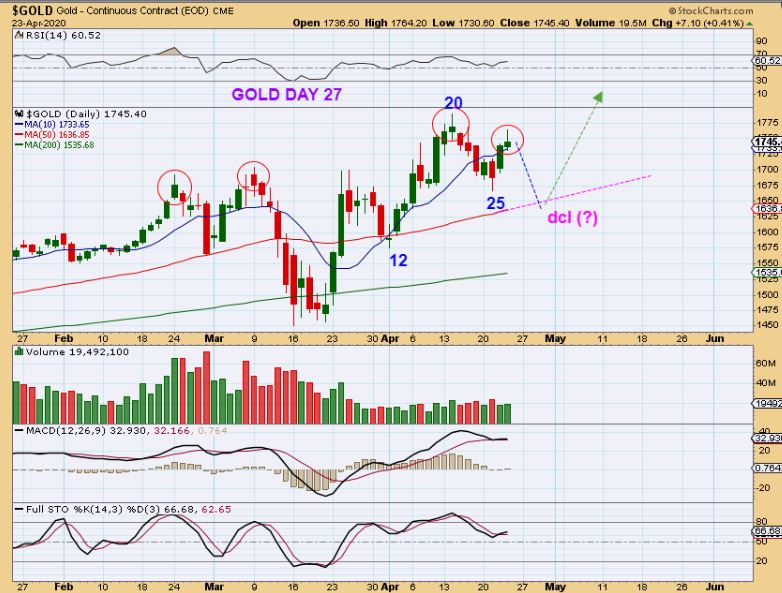
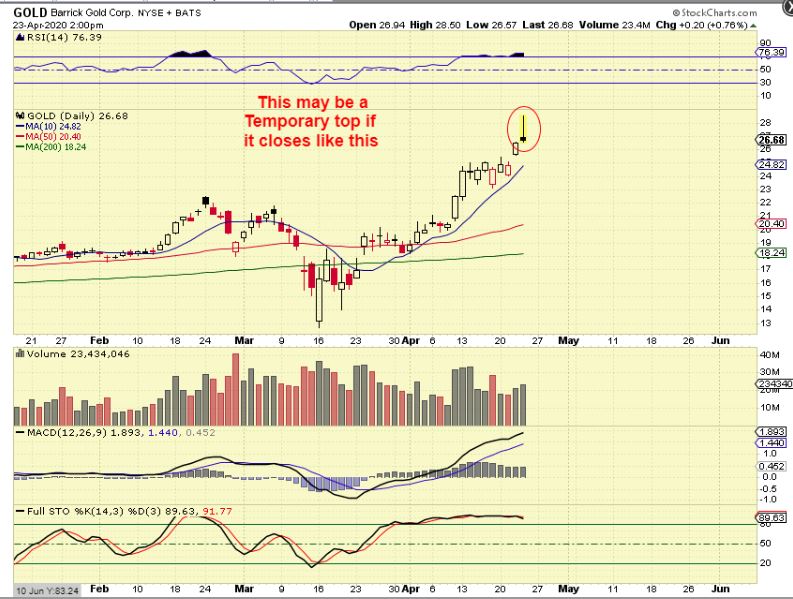
GOLD did POP and then sold off into the close. This is usually a topping candle or at least a sign of selling / weakness and on day 27 we may have the day 20 peak and a drop to the 50sma , as mentioned in past reports.
.
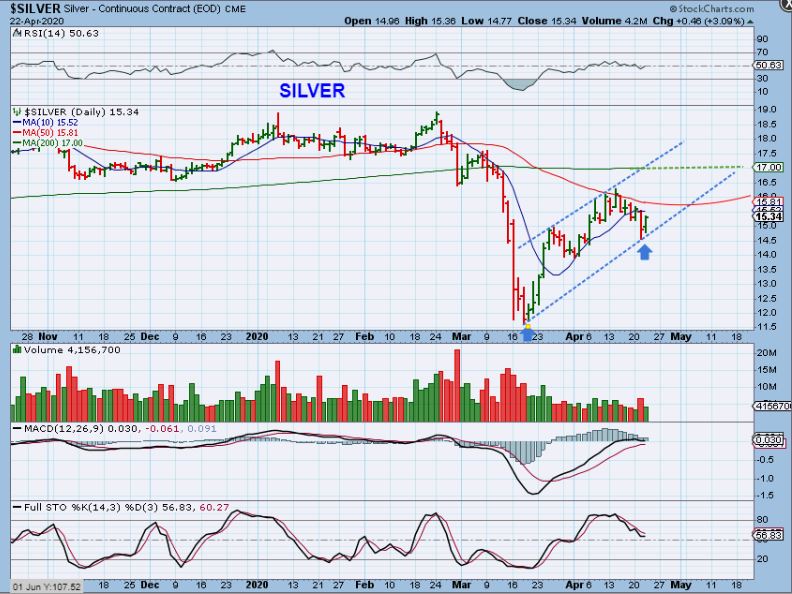
FROM YESTERDAY: SILVER reversed higher also and the upper trend line is now parallel with the one that I can draw as the lower one. We have that 50sma as resistance, but I did think that this could reach the 200 sma.
.
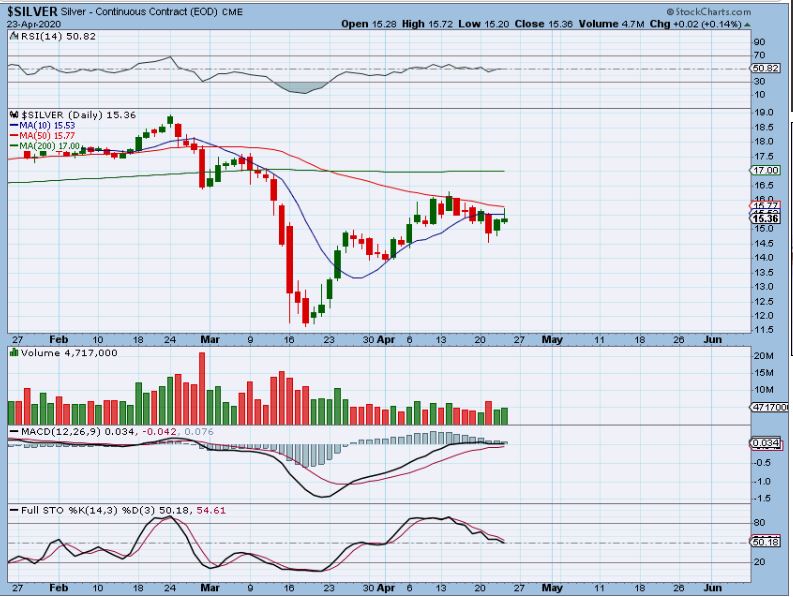
SILVER tagged the 50sma and dropped again, so we may need some time and a dcl before we finally break higher through that 50sma.
.
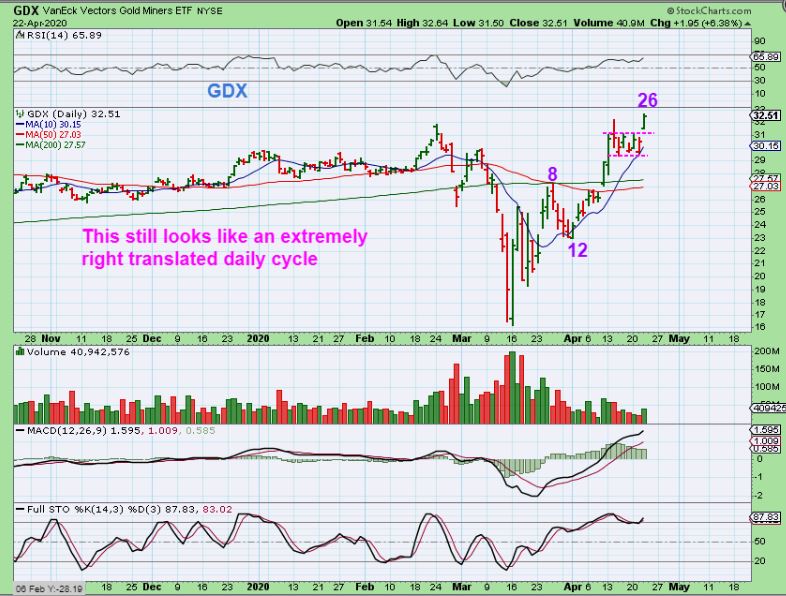
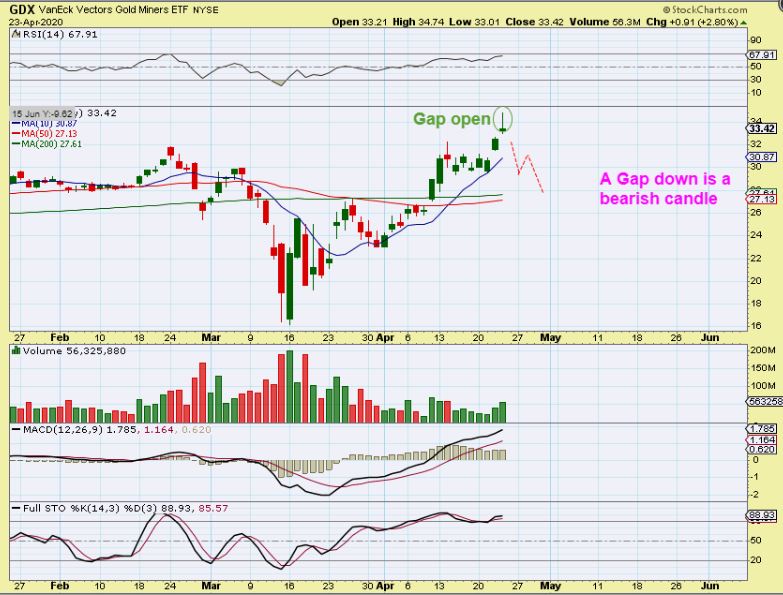
IN YESTERDAYS REPORT I WROTE: GDX I do NOT see a clear dip into a dcl in Miners, do you? So if Gold had a DCL, it means that Miners ignored the dip and did a sideways bull flag stealth dcl. The Bull flags are breaking out as expected, so it remains bullish. IF THE DCL LIES AHEAD …
.
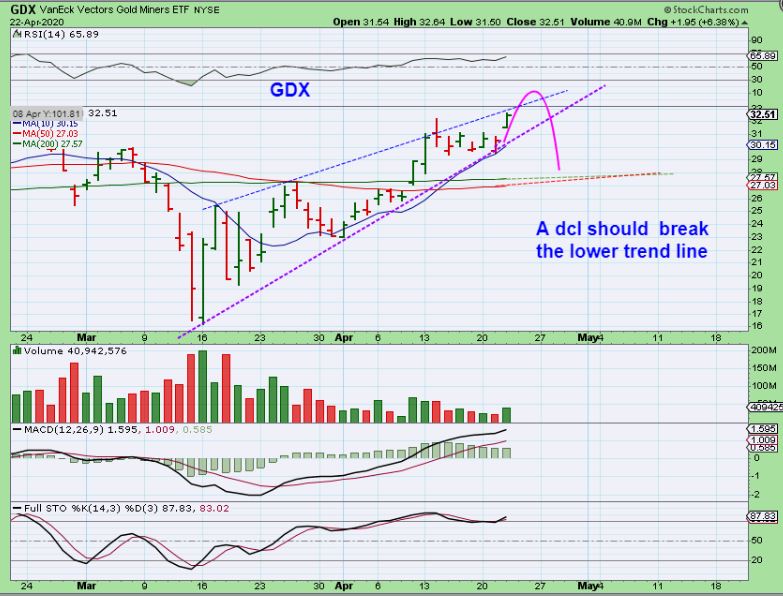
ALSO YESTERDAYS NOTE: IF A DCL STILL LIES AHEAD, GDX may look like this by day 33 or so. Wednesday is day 26. A TAG of the 50sma would be a normal back test/ DCL ( I know that this seems too bullish to do that, but you know that these Miners can drop quickly into a dcl).
.
GDX – And there it is, we got a topping candle here in GDX / GDXJ too. We gapped open, ran higher and sold off all in one day. That is a day 27 peak and that dip to the dcl could now shake the bulls off a bit, but it is really a Buying opportunity.
.
.
BARRICK GOLD – I posted this Midday to let the readers know that we may be topping here, to drop into the dcl. As a day trader, I sold 1/2 of some of my Miners, hoping to re-enter lower later.
.
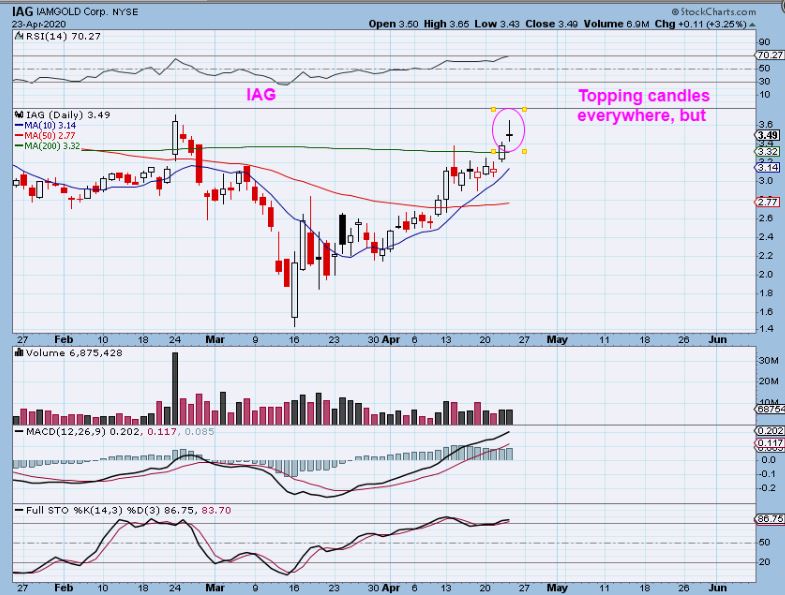
IAG – Many Miners had that same candle by the close. Does that mean we have to crash down or drop deep?…
.
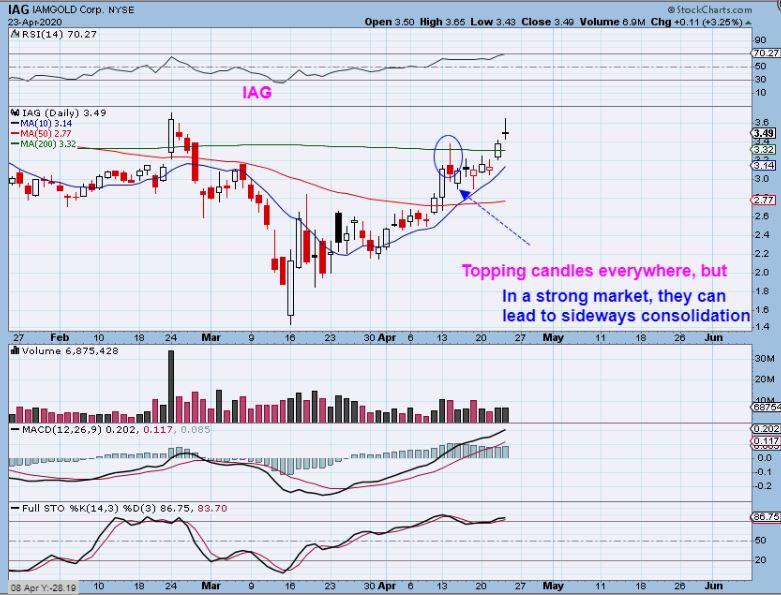
IAG – We have seen these candles before and they can just stall price with choppiness. Here I am pointing out IAG with a similar candle on April 14. Price then dropped, popped, dropped, popped, and went sideways.
,
.
It didn’t seem like we had a real DCL in the Precious Metals, because that day 25 dip didn’t meet all of the normal criteria. Now it looks like we are seeing some selling or weakness at this peak with the Miners posting topping candles. That is right on time for a drop into a dcl, so whether it gets choppy sideways or drops down, it seems that now a dip into that DCL will take place, and that will be a buying opportunity in the near future.
.
I will have a few thoughts below, mainly with the Energy sector. Today is Friday , the last day of the week, so adjust your accounts before the weekend if you wish, and Enjoy your Friday trading!
.
~ALEX
.
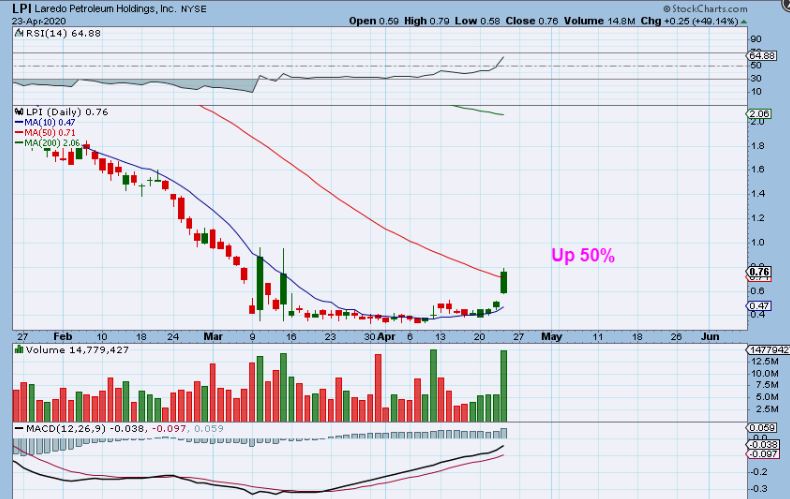
YESTERDAY I POINTED OUT LPI THIS WAY: LPI is a long flat base, and it may be a laggard that is ready to run with Oil. This small pop was up 15% yesterday.
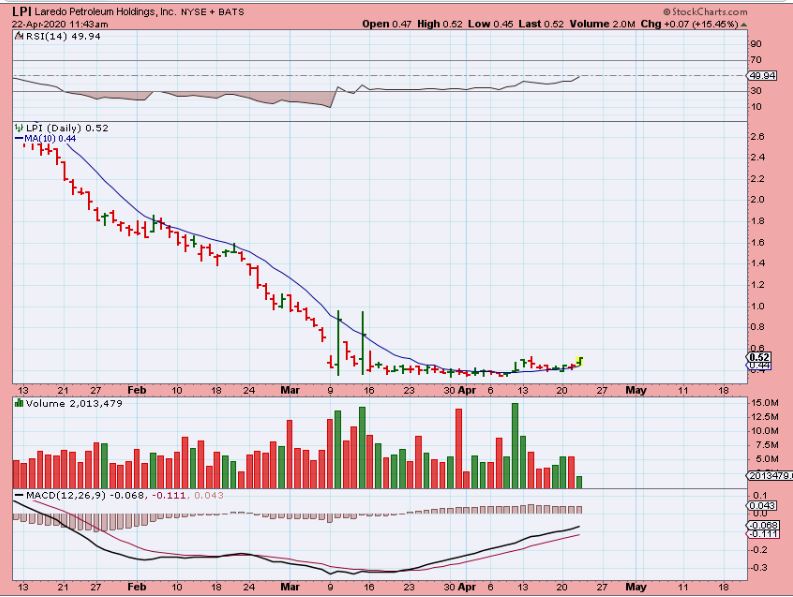
,
LPI – Yesterday LPI was up 50%. This is the kind of out of the ordinary moves that can happen under the current conditions.
.
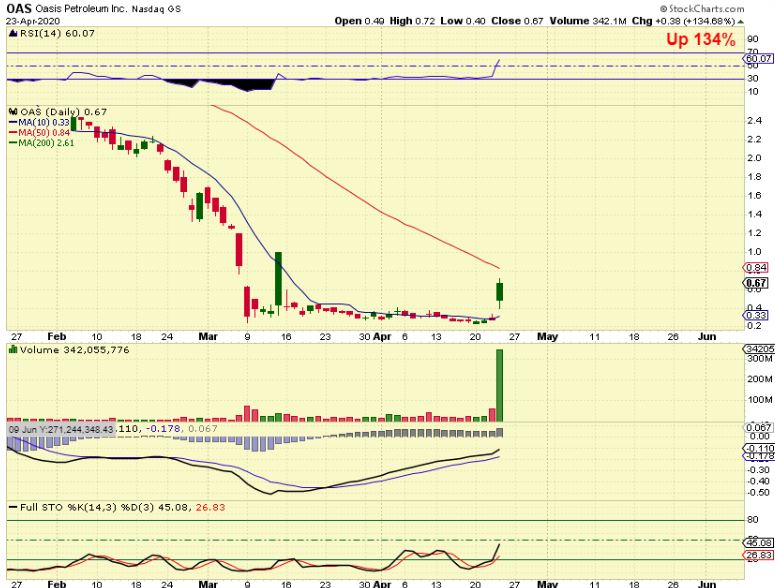
OAS – I have also mentioned OAS and it Popped 124% from that base. So I have added some reasonable positions in the sector off & on over the past few weeks, and so far it has worked out well. I like the set ups, especially if I see a long base that has formed.
,
.
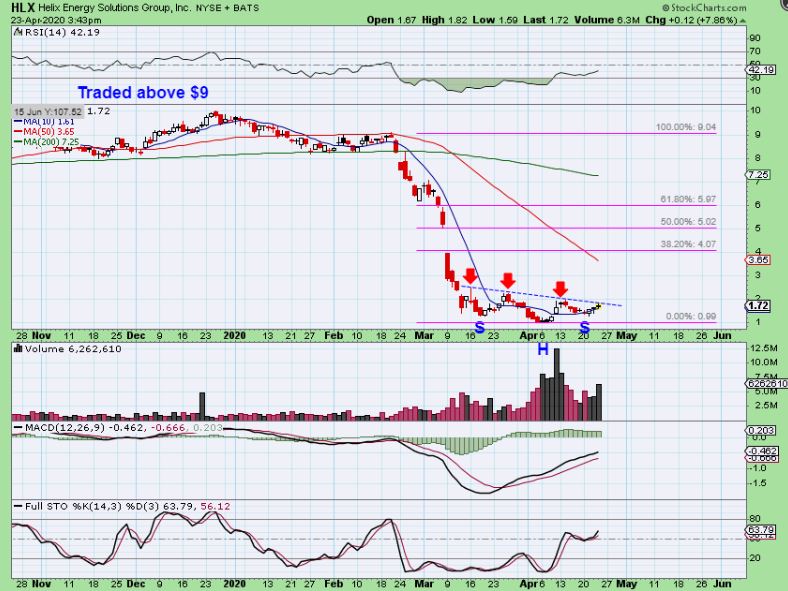
I bought HLX since it seems to be forming and inverse H&S and a wedge. It used to be a $9-$10 stock before the crash. At $1.70, a pop to that 50 sma is a 100% gain. NOTE: This is a HIGH RISK trade, these companies can be in trouble with the recent Oil plunge.
,
.
BTE had a surge of volume at the lows in a base, and often that is followed by a price move. I bought BTE for a short term trade.
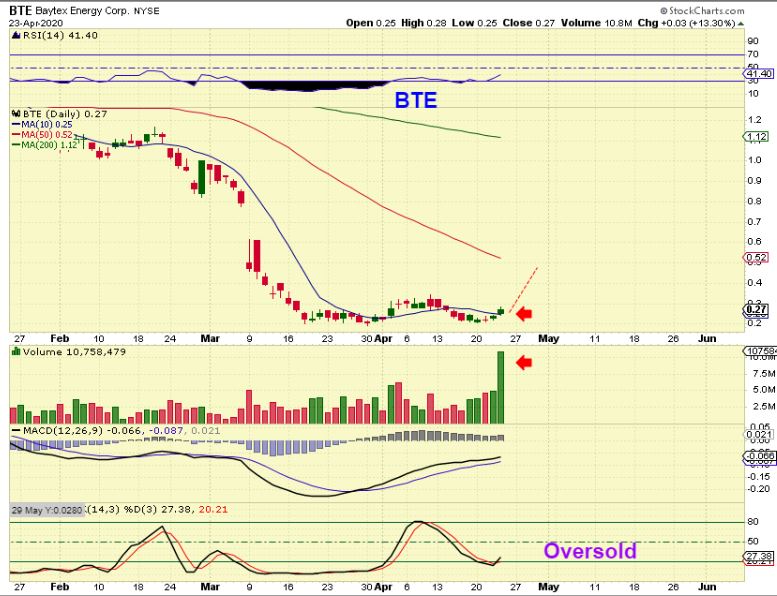
,
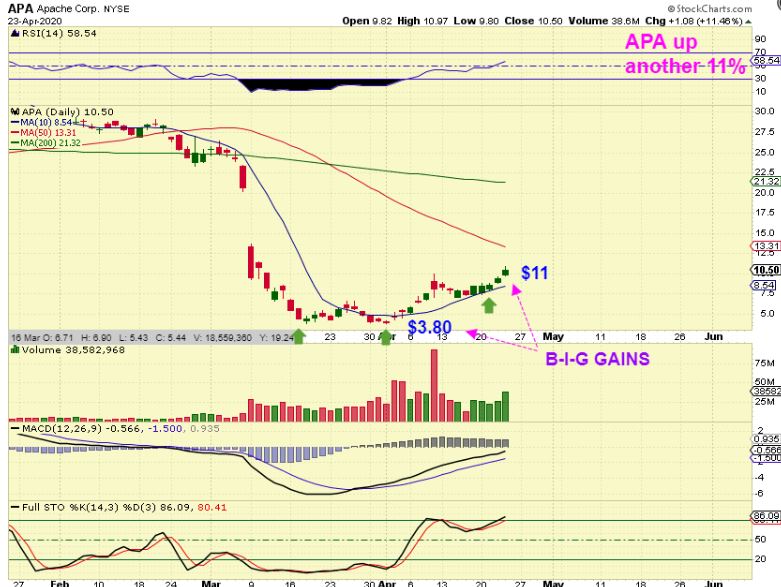
I have posted APA, OKE, PVAC, BE, PUMP, TUSK, MRO, WTI , and other Energy Stocks as stocks that bottomed weeks ago , despite Oil crashing lower & lower. You can see the double bottom base here before running from Under $4 to $11, and the stocks above have similar features.