
April 4th Weekend Report – The Big Quarantine
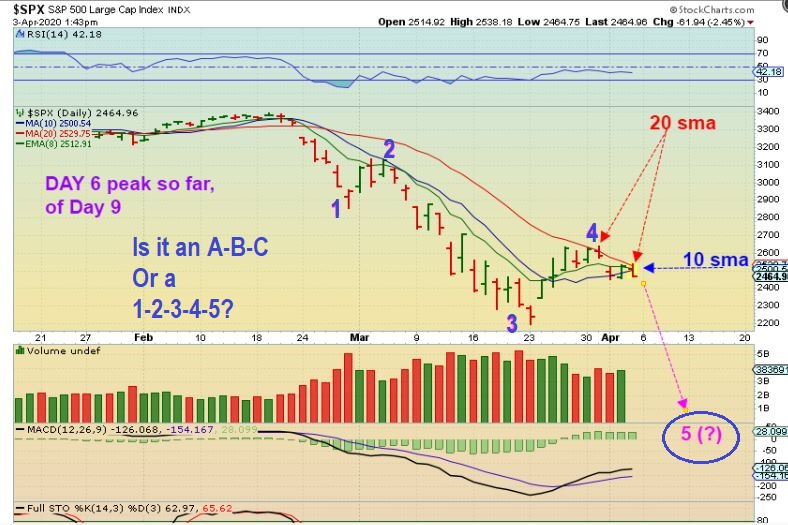
SPX – The question still exists as to whether or not this was an ABC Drop (Complete with ICL), or is it a 1-2-3-4-5 Drop , still leading to the ICL? Either way, we did have a confirmed low ( DCL at least) that was trade able. It is currently being rejected at the 20sma, so it could roll over into a final low here too. Let me explain further in more simple terms…
.
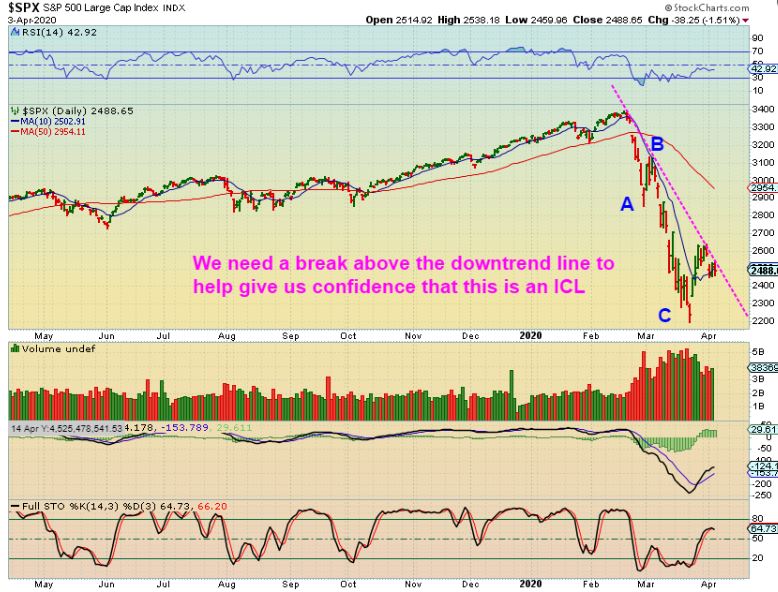
SPX -This would be the a-b-c type drop. Breaking through the down trend would help us to see that this was an ICL at ‘C’.
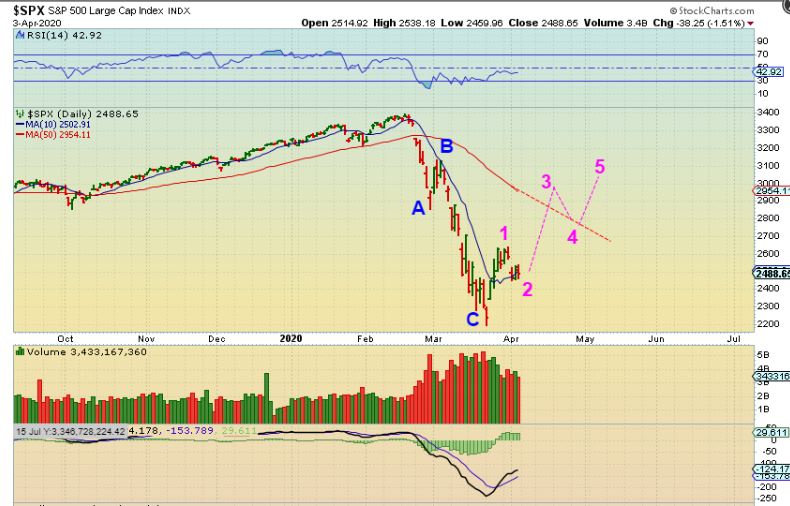
SPX – If it is an A-B-C to an ICL, then we could expect this to unfold into more of a short term bullish daily cycle, maybe something like I have drawn here.It may or may not get back above that 50sma though. I will explain this in more detail with the NASDAQ too, but first this…
.
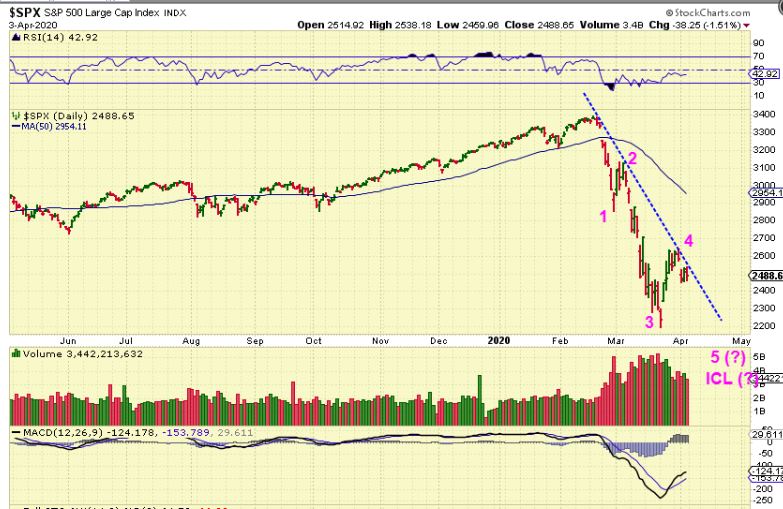
SPX – This would be a 1-2-3-4-5 drop with this current daily cycle taking us down to the ICL.
VIX – The VIX did reach the same level that we saw near the 2008 Market low . The market actually bottomed a bit after that peak.
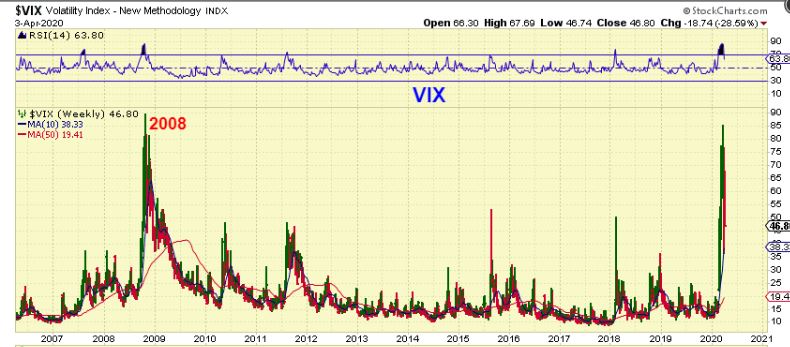
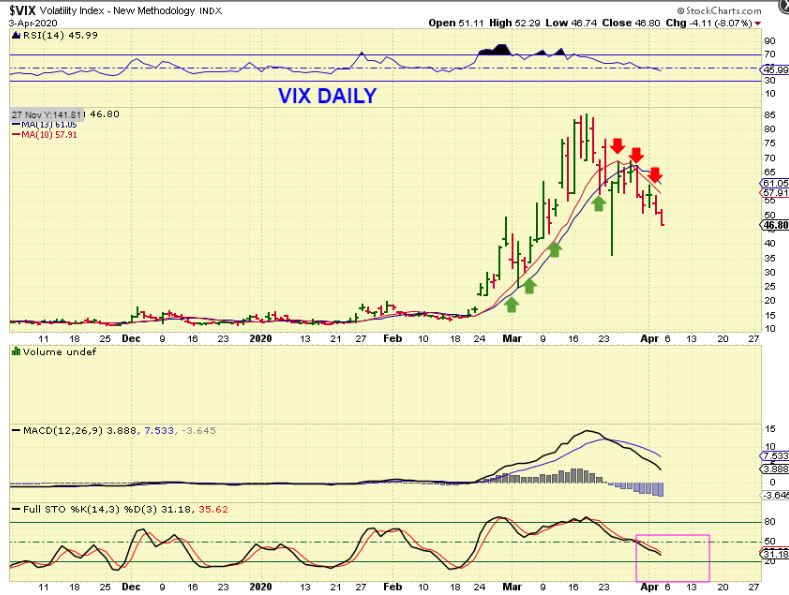
And as I have pointed out recently, with the current daily cycle low, the VIX is being rejected at the 10 sma, so far.
.
IMPORTANT REVIEW LESSON
.
I have been comparing the 2000 top with what we may have taking place now. It is a good way to prepare for various possibilities. Today I want to take another look at that 2000 top. I also want to discuss the market psychology at that time, since I see similarities in the emotions then and now too.
.
NASDAQ 2000 TOP – It was ALL good news at the top, wasn’t it? The use of the internet was really starting to take off, personal Desk Top computers were advertised for every home? Laptops sales increased for convenience! AAPL, DELL, Microsoft, etc were racing higher. Cell Phones for everyone? Really? Nokias stock was on fire. So no one believed tech could top here. There was… ” SO MUCH GROWTH AHEAD!” Tech Companies were doing awesome, read the chart and you’ll see why things looked so bright. There is NO WAY this could top under THESE Bullish conditions. Read the chart…
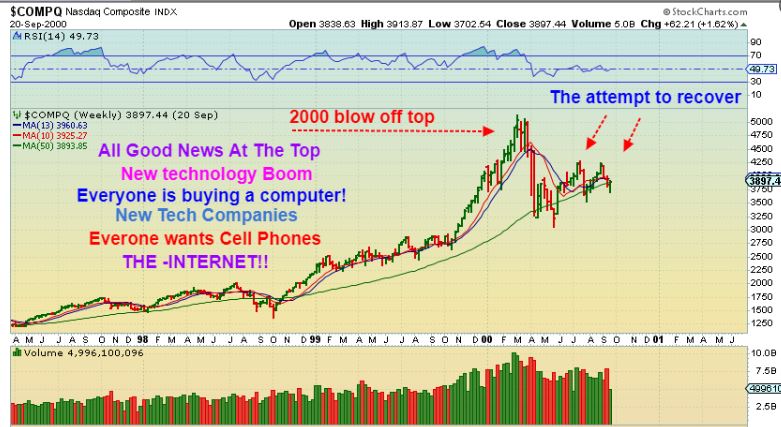
NASDAQ 2000 TOPPED RIGHT THERE & DROPPED after that little double top, at the height of the BOOM in tech.
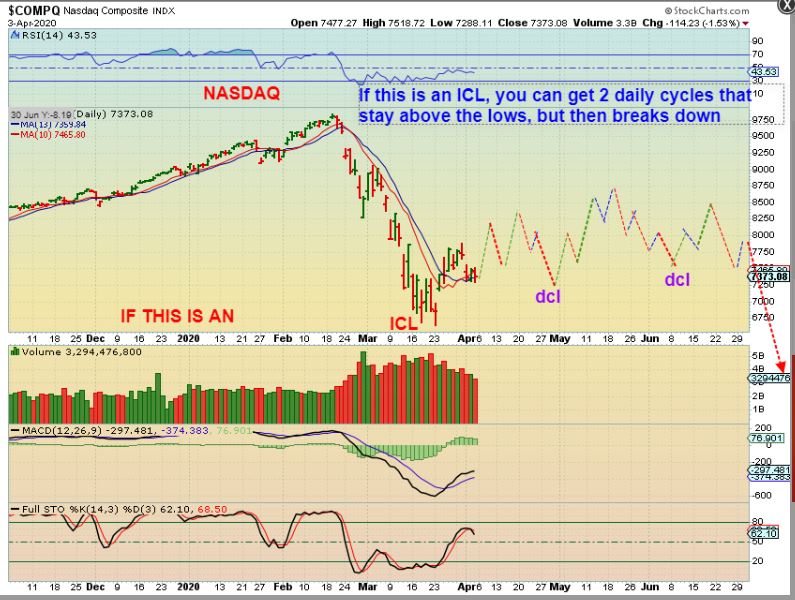
So back to this chart: These 2 bumps higher were 2 daily cycles coming out of that ICL (Low) that eventually rolled over. I have been saying that we could see that now too…
,
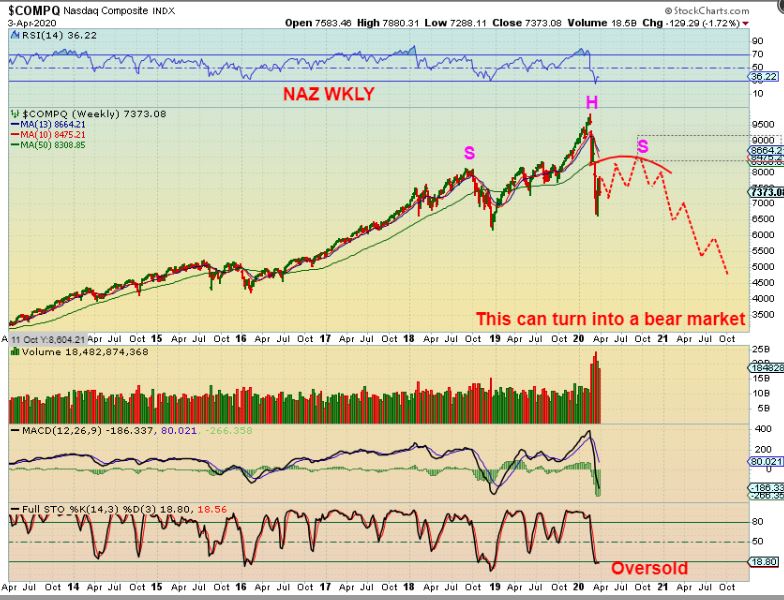
NASDAQ WITH 2 DAILY CYCLES– we could see something like this. This is JUST A VISUAL AIDE, NOT A PREDICTION. It could be choppy & sideways like this though, similar to the year 2000 for the NASDAQ. What about breaking to a new low right now? Could that happen? Yes, it could and this is why…
.
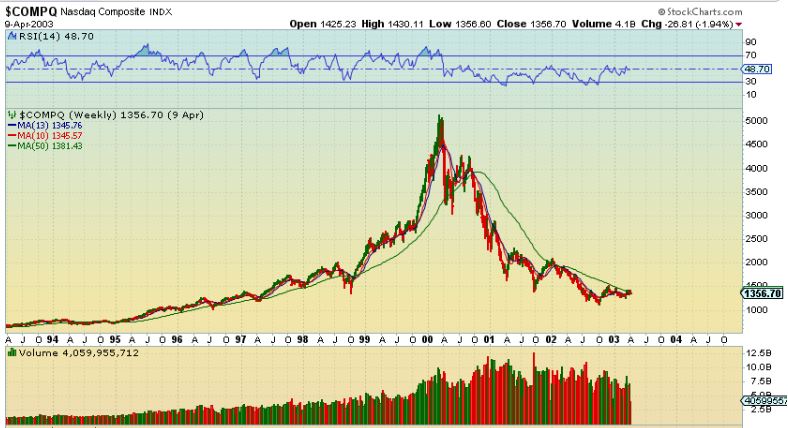
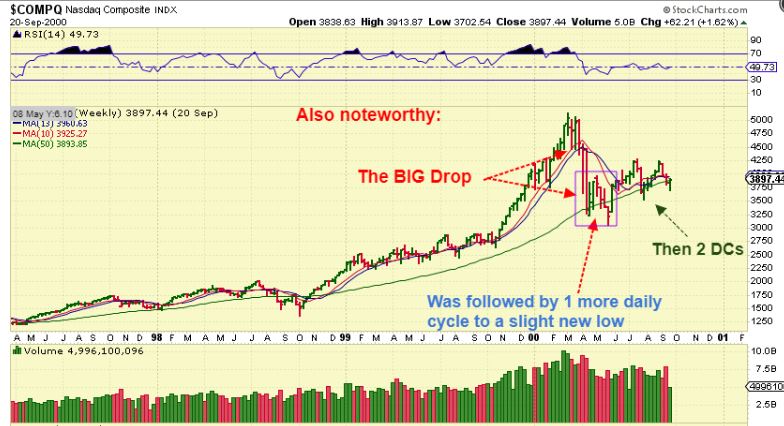
NASDAQ 2000 TOP: I noticed that in 2000 we saw 1 more weak daily cycle after the steep drop & then it dropped to a New Low again ( the real ICL) before those 2 daily cycles. Do you see the purple box? So we can’t rule out that we could even be in that final daily cycle right now, which gives us ‘5’ of that 1-2-3-4-5. THAT low was then followed by 2 daily cycles and then …
.
we saw the bear market take over, despite growing demand for personal computers, cell phones, games and gadgets. So…
.
We may have seen a NASDAQ TOP. This could be the ICL, or like we saw in that 2000 top, 1 final daily cycle developed and made a slightly new low. After that, Bulls got drawn back in for the slaughter.
After that ICL, The Bulls had all of that good news to look forward to – The explosion of the Internet useage, a Cell Phone for everyone, Desk Top & Laptop sales growing, New tech Gadgets and Games, etc etc) got drawn back in for the slaughter.
People do tend to get emotional at the top of a Bull Market, and it was that way in 2000. Everyone was talking about Tech Stocks. News events still stir emotions, I am hearing that ‘ The Fed has unlimited spending ability’, this bull can never die! We’ll see, right? Reality is that it could look just like that 2000 top, where it HAD to be a bull, conditions were so perfect. Computer & Cell phone sales were rising, technology was booming, so how could it just top there? And then it did. All you really can do is try to leave emotions and personal Bias aside, and let the charts play out. My advice has been to Keep reasonable stops in place and keep position size reasonable. Over time we will gradually see what is really happening in the big picture.
.
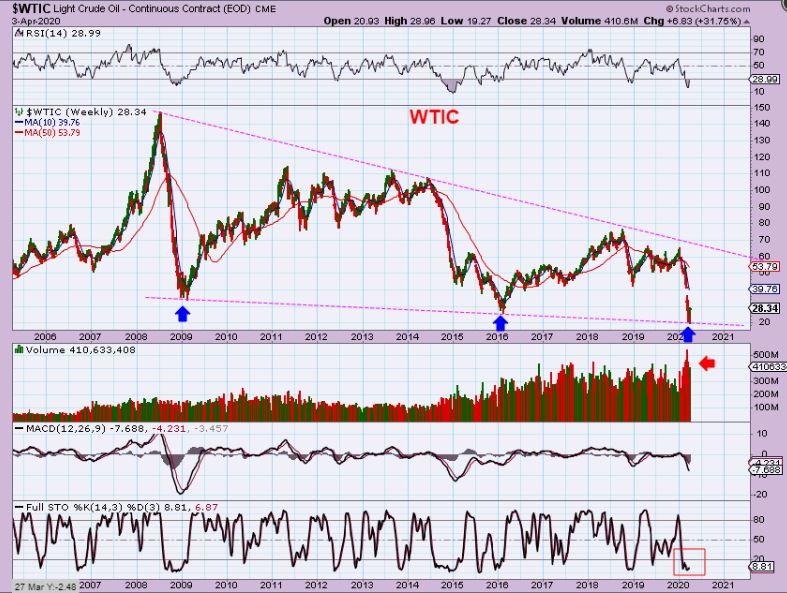
WTIC WEEKLY – We have been expecting a low in Oil, because the cycle count entered the time period for a low to develop. This was a 32% Pop in Oil off of those lows this week. I was also having us look at the following chart…
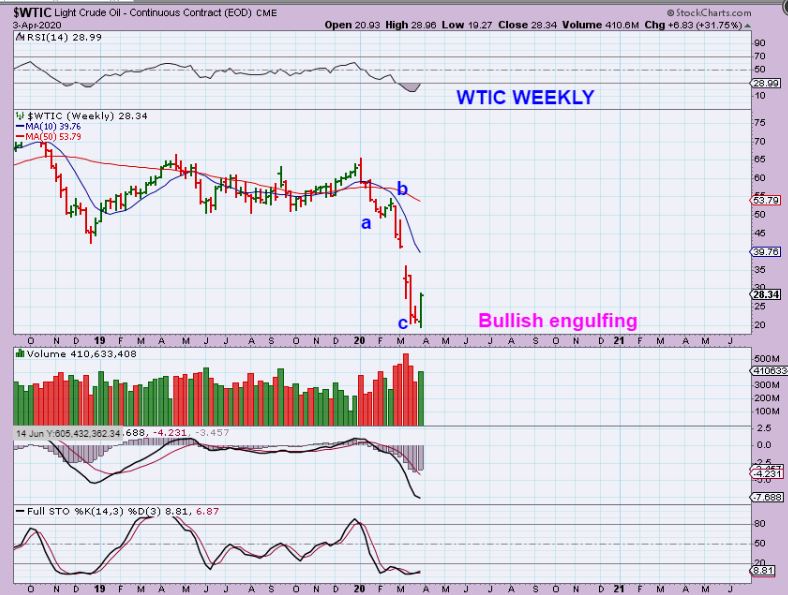
OIL WEEKLY – I posted one like this last week and the week before, showing that we were in a place that a low could develop. I have started to hear people calling for $10 OIL, but will the Powers that Be allow that? Russia, The Saudis, and The U.S. are in discussions to prevent that now. This is very oversold and we probably have an ICL with this dcl.
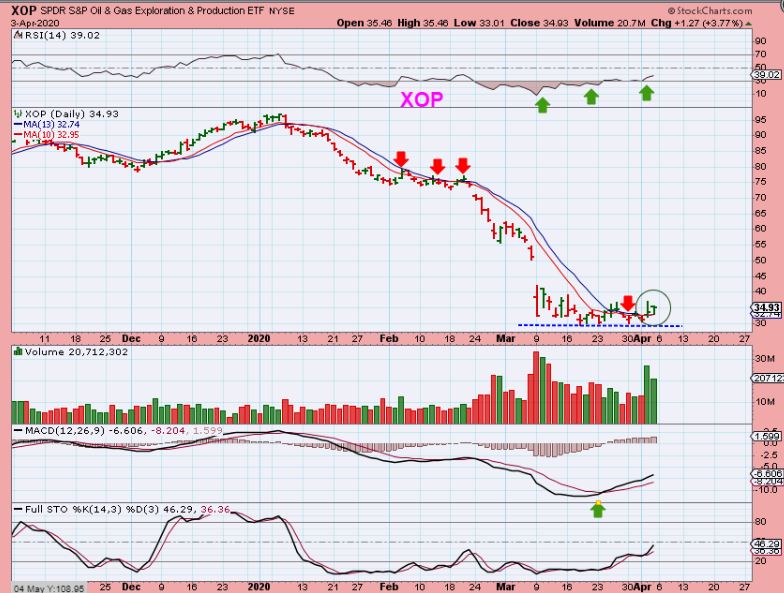
XOP DAILY – The XLE, OIH, and XOP all look to be bottoming and started forming small bases as Oil made new lows.
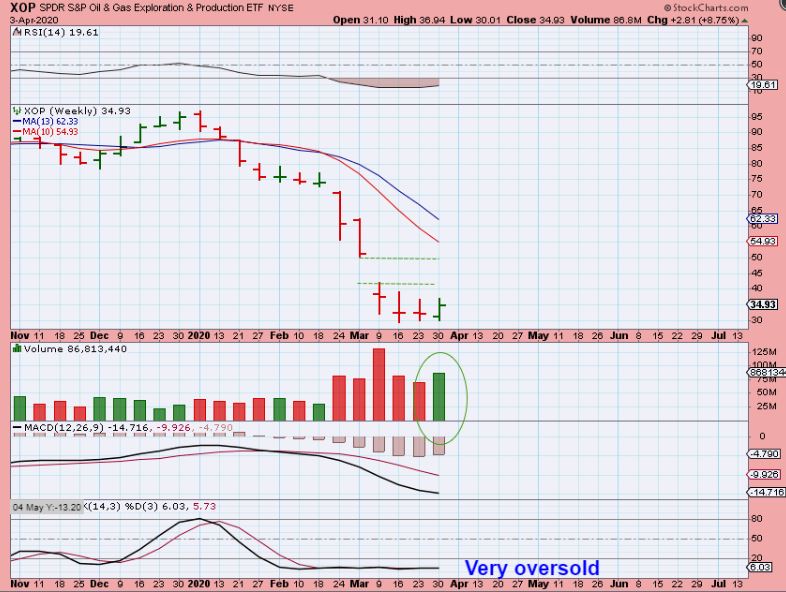
XOP WEEKLY– They started to move up out of those bases a little bit this week. I have been discussing in the weekday reports that if they follow through higher, some of these stocks are going to make great %- gainers, even if they only bounce. It is important to understand, however, that they can be very hard to trade or Buy & Hold when they swing up or down 20% a day.
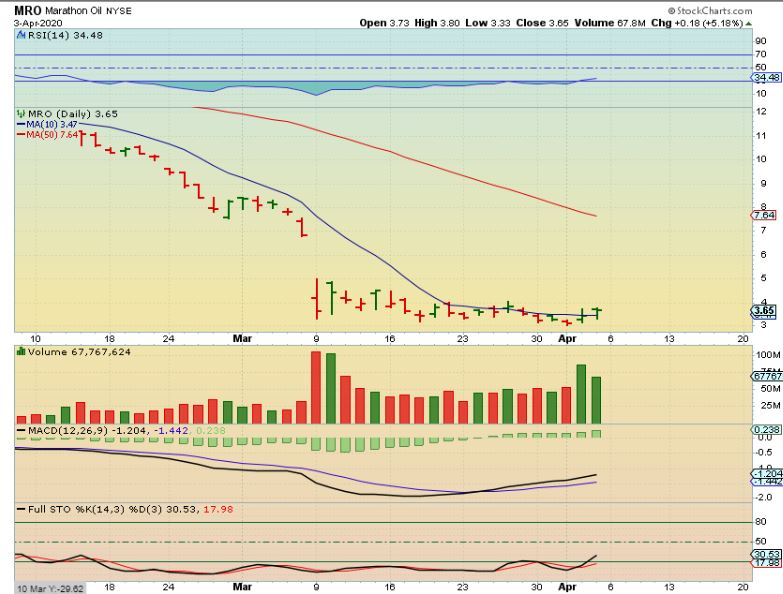
MRO is one of many companies that I have pointed out in the weekday reports as forming a base and possibly ready to add on some nice gains. This is a 4 week base, and it added 5% Friday, but what if it simply bounces to the 50sma & fills that gap made on the way down? Well that is a $3 to $7 move. If Oil does climb higher, we’ll see if that plays out, and I will continue to discuss them as they make progress.
.
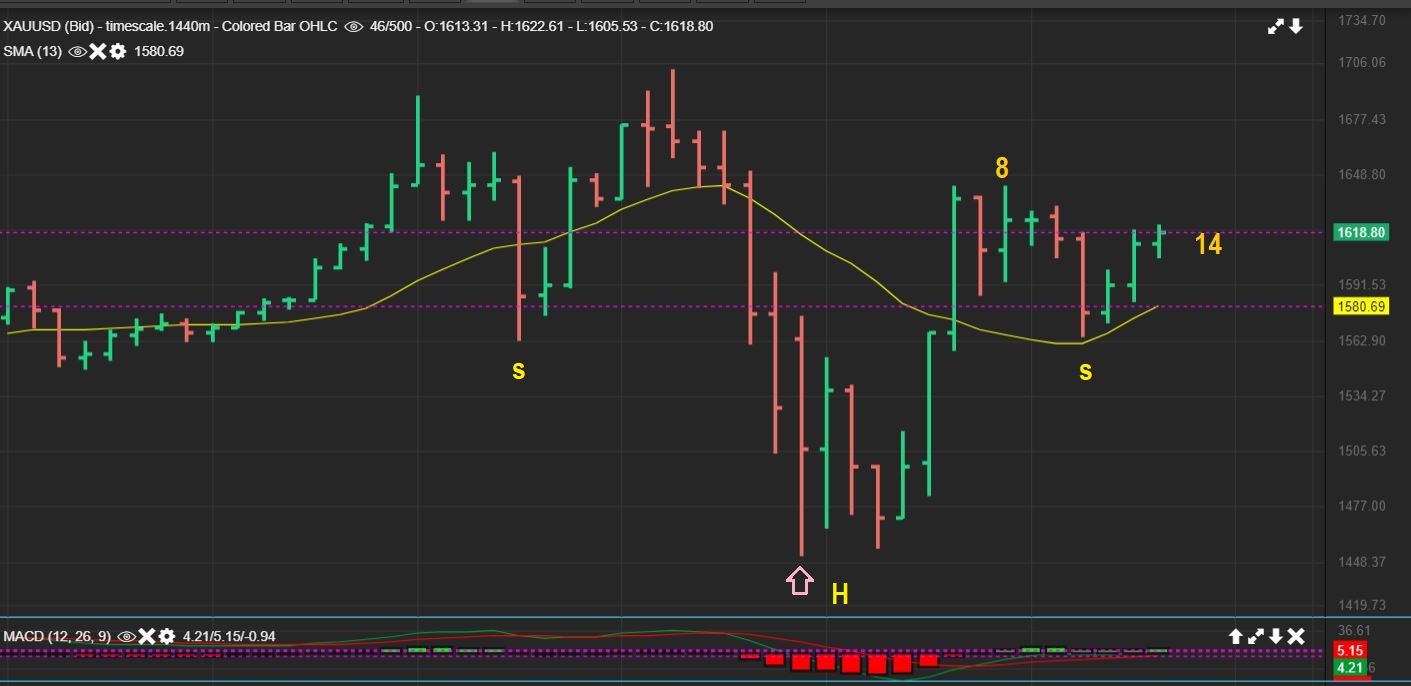
GOLD DAILY – Gold formed an inverse H&S on the daily chart and moved higher after a $40+ drop last week.
.
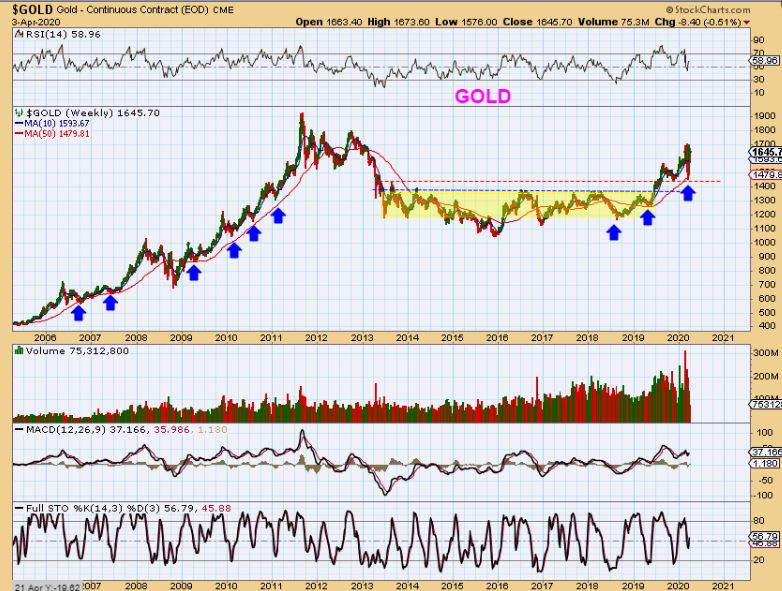
So the Big Picture for GOLDs WEEKLY chart was a crash & recover type of back test so far. Gold actually held up better than Silver & the Miners.
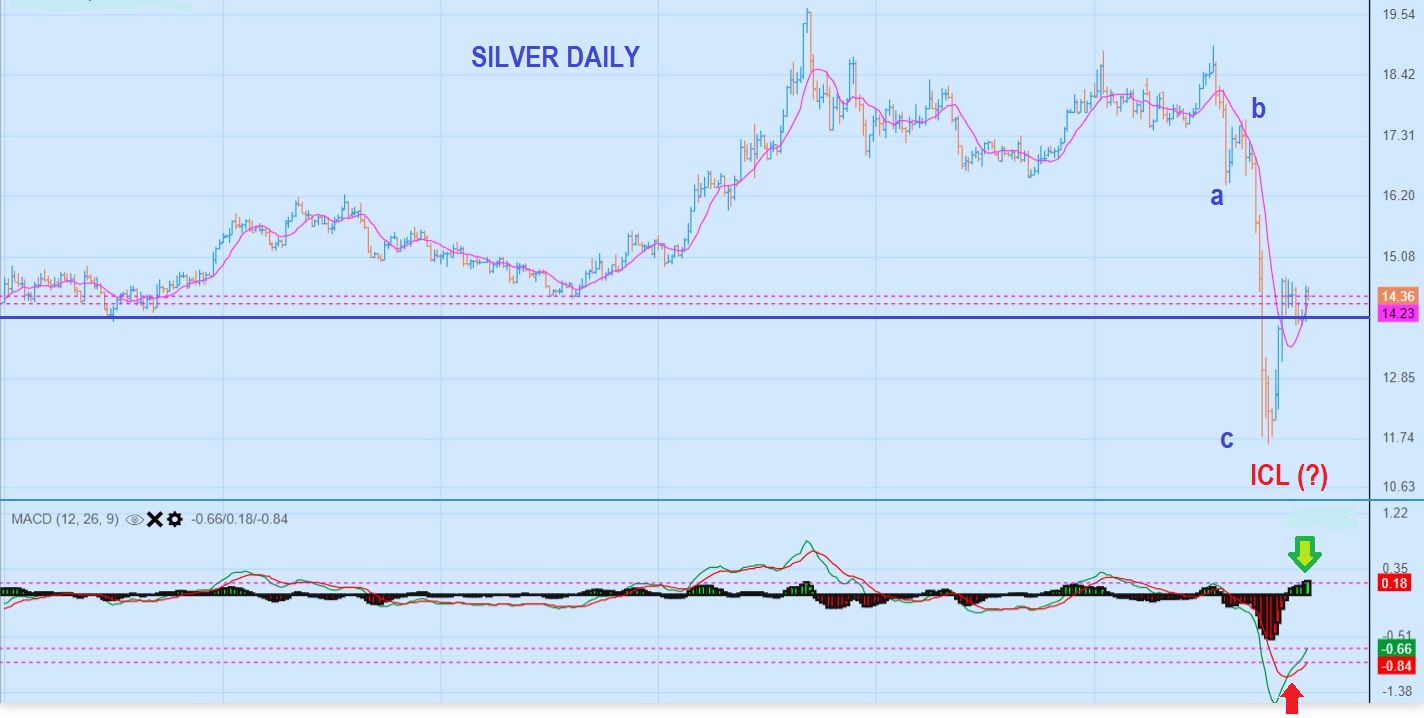
SILVER DAILY- We discussed a possible early ICL with that Crash. Here we see that it did have that a-b-c type of a drop that usually takes place heading into an ICL. It then snapped back out of the lows and…
.
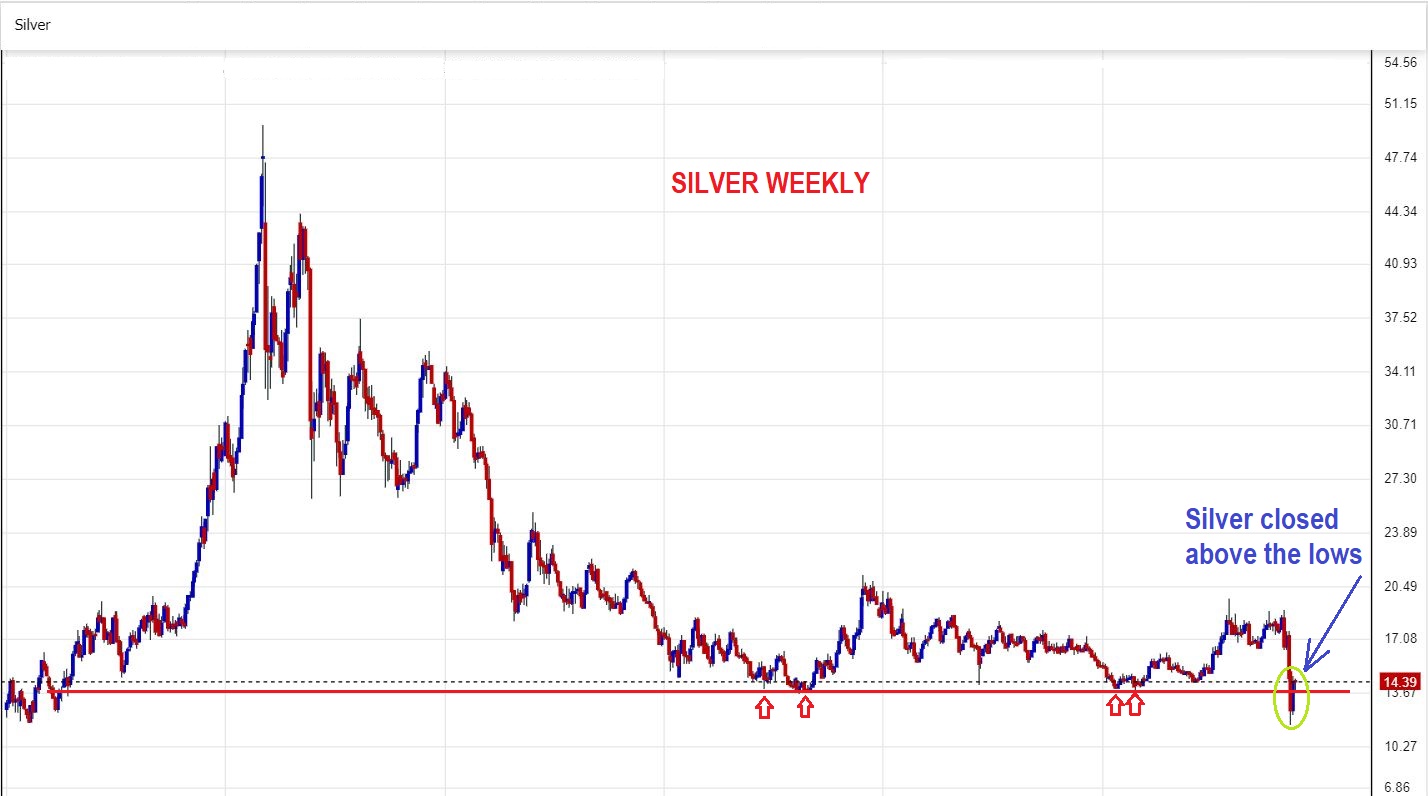
As we look at the Big Picture SILVER WEEKLY Chart, we see that the crash would have stopped out just about anyone holding a position. It then recovered. It has been reported that Silver was actually Impossible to buy at this time without paying a large premium, so it does seem to be a manufactured shake out. If it was, that should be the Lows in place as buyers here would become strong handed positions.
.
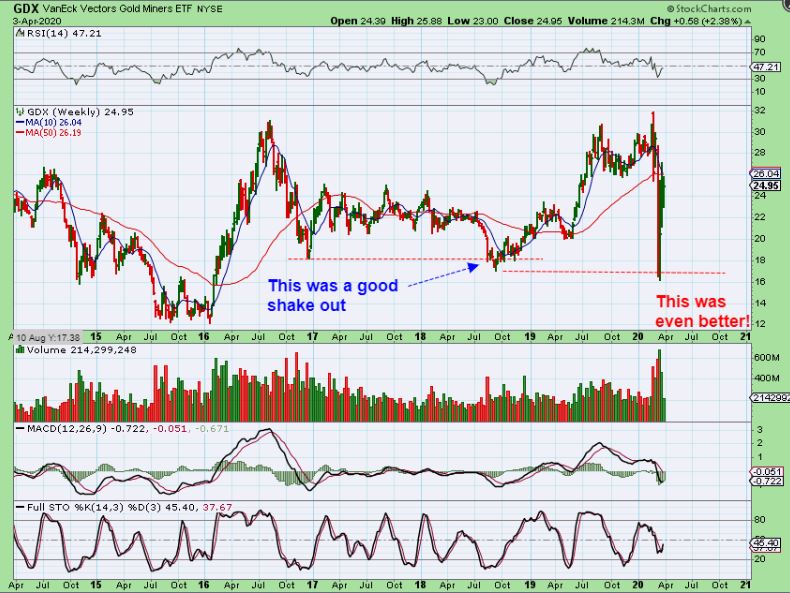
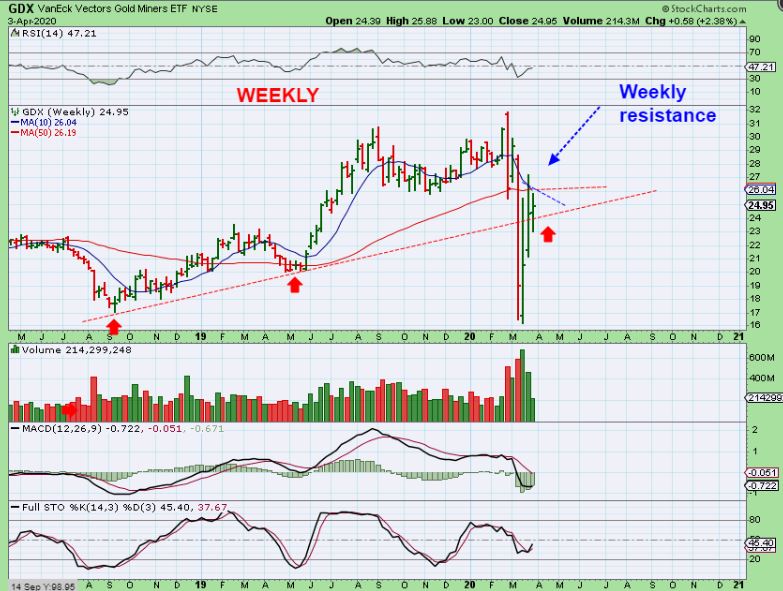
GDX WEEKLY – I thought that the stop run at the ICL in 2018 was a good one, but this one even undercut That one. No one would have expected that, so this is where using stops saved the day. Most of us had locked in gains from 2 years or trading or riding miners, and re-bought positions much lower again with what is likely the ICL. You will recall that…
.
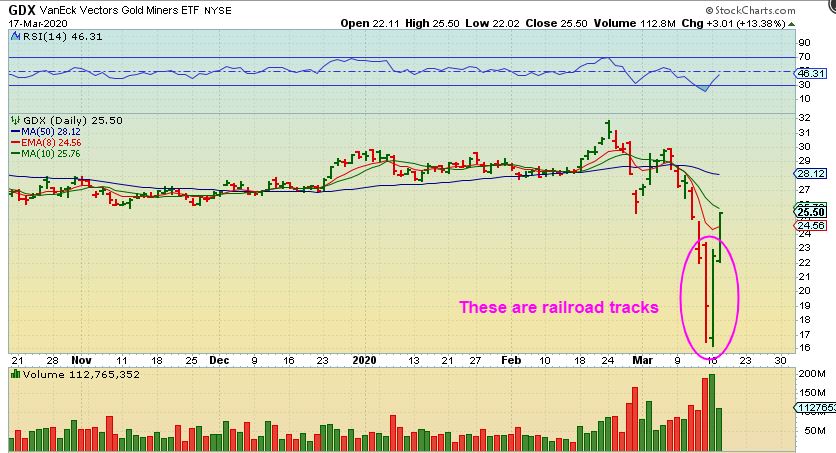
You will recall that when it quickly reversed higher, I was buying, saying that it looked like we had a rare version of extreme Rail Road Tracks. They are viewed as a reversal pattern with lows in place. Many Miners were still near their sell off lows, so opportunity to buy cheap was still there. I used the following charts…
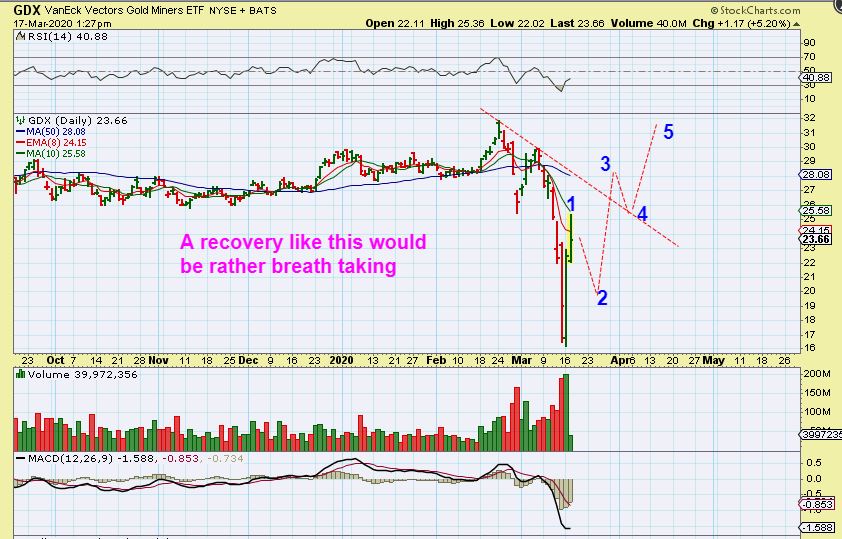
GDX MIDDAY MARCH 17 – GDX bounced higher & sold off, but it was looking like lows were in place…
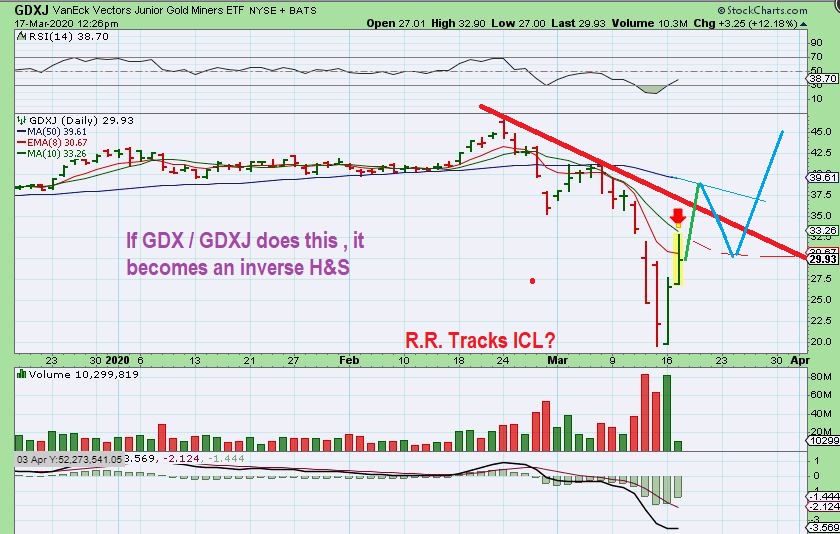
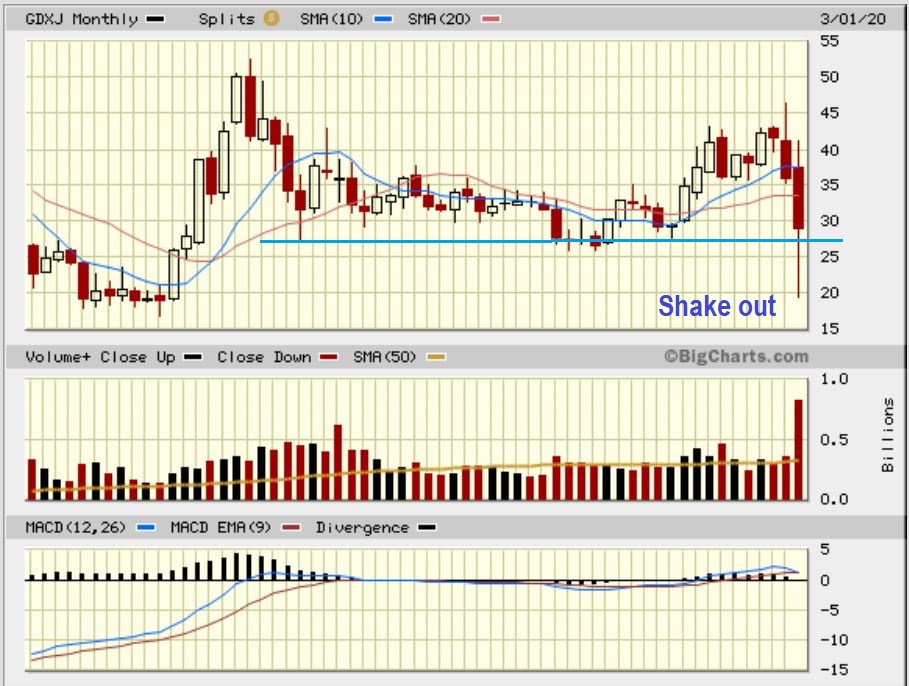
GDXJ MIDDAY MARCH 17 – GDXJ was also forming R.R. Track lows…
GDX actually ran higher and closed near the highs.
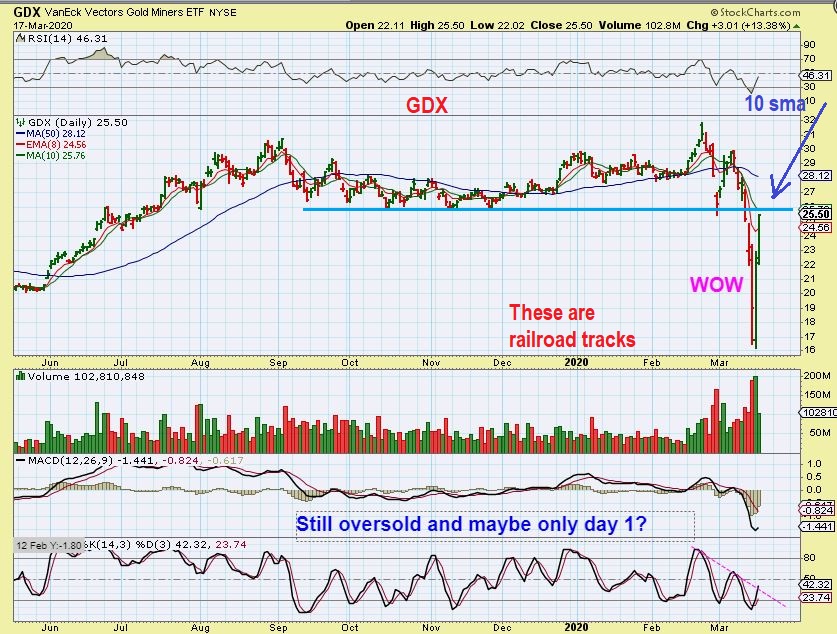
GDX RailRoad Tracks in place.
.
GDX WEEKLY CURRENTLY – So we see that GDX recovered the uptrend line and closed above it last week & closed back above it again this week. The weekly stochastics is curling upward now.
GDXJ MONTHLY – I used Monthly charts when March ended to show a solid shake out & recovery for the month of March in GDXJ, and…
GDX MONTHLY shows an extreme drop & recovery in GDX as of the end of march too. The monthly MACD remains above the zero line.
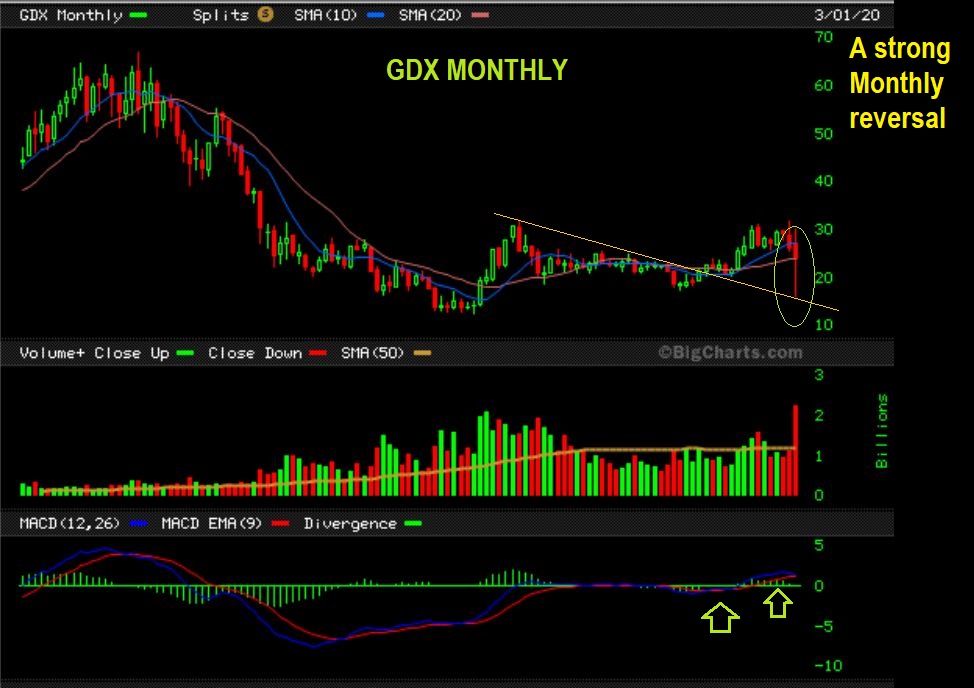
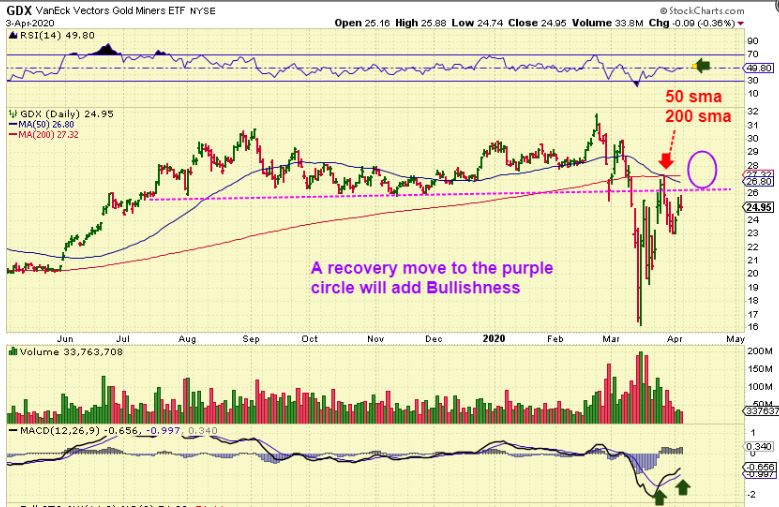
GDX at this point, a push a little higher will give is a daily cycle high above day 8, and back above the 50 & 200 sma. This will add even more bullishness to the sector. The down trend line will be broken, it will help to ensure that we could get a Right Translated Daily Cycle, etc.
.
We have now seen the lows form in the General Markets and Precious Metals, and this has offered trade ideas along the way. Oils reversal out of the lows this week adds another sector to that group. At this point, we have confirmed DCL’s in place, but it would take a little more upside in the General Markets to help confirm whether or not an ICL has been put in place. I am thinking that we do have one in place for the Precious Metals, since Gold is back up near the recent highs already.
There have been a good number of trade set ups in each sector, but good solid follow through for a week or 2 has been hard to come by. Things remain a bit choppy and volatile. Some of the Miners are nicely off of their lows and doing well, but the General Markets are choppy. Oil & the Energy stocks have offered some trade ideas too, but we do still see a lot of choppiness and volatility with those stocks too. That could change if Oil begins to move steadily away from the lows. We’ll continue to monitor each sector daily in our weekday reports.
.
Life in general has been a time of adjustment for most with the recent plague running through our streets. It may last a little while longer, but I sure do look forward to a normal weekend again. I look forward to the time, and I’m sure many of you do too, when we can look back on this as a memory and just enjoy our time left spent with family and friends again. Stay safe and I certainly wish good health to you and all of your families!
I hope that you are able to enjoy your weekend, and thank You all for being here at Chartfreak with me too!
.
~ALEX

