
Wednesday March 3-18
These Markets are moving in ways that we are not at all used to, and I am left to try to figure it out. I am seeing moves that are EXTREME , to say the least, and today I want to show you something that I am seeing that is actually very exciting to me. I usually cover the markets in a basic order of SPX, NASDAQ, WTIC, USD, GOLD, SILVER, GDX, etc, but today I need to change things up a little. Let’s get into the report, I will show you what I am seeing here. Oh, and by the way… Today is a Fed Day ( F.O.M.C.), but with Sundays surprise 1 pt rate cut, it will likely be just The words of the Fed that could move the markets.
.
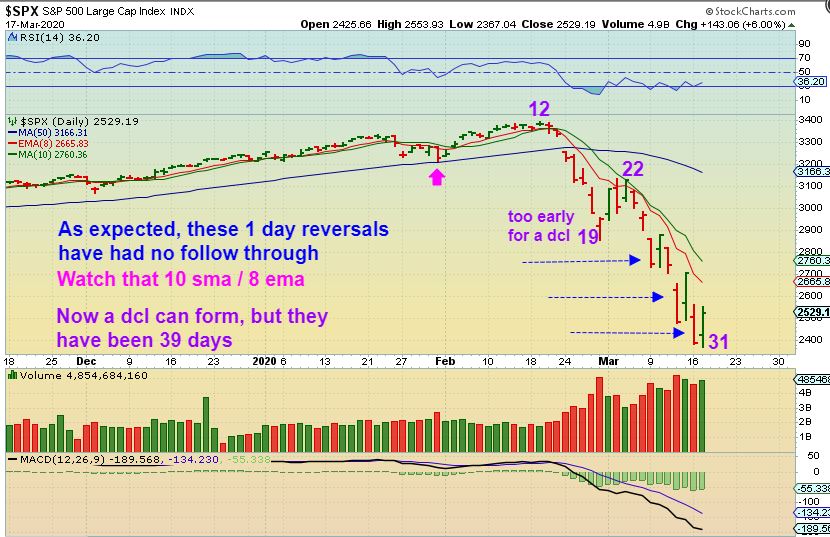
SPX – Each time we get a reversal, people get excited that the lows are in and we will see a sustained run, but the warning from me has been this – Lately our daily cycles have been running 39 days. Day 19 was just too early for a dcl, and so was day 25 really. Now each reversal tags the 8 ema area & drops again, so we have not had a swing low. We are on day 31, so a dcl CAN form at anytime, but it needs to close above the 10 sma to be a confirmed low. Read the chart.
l
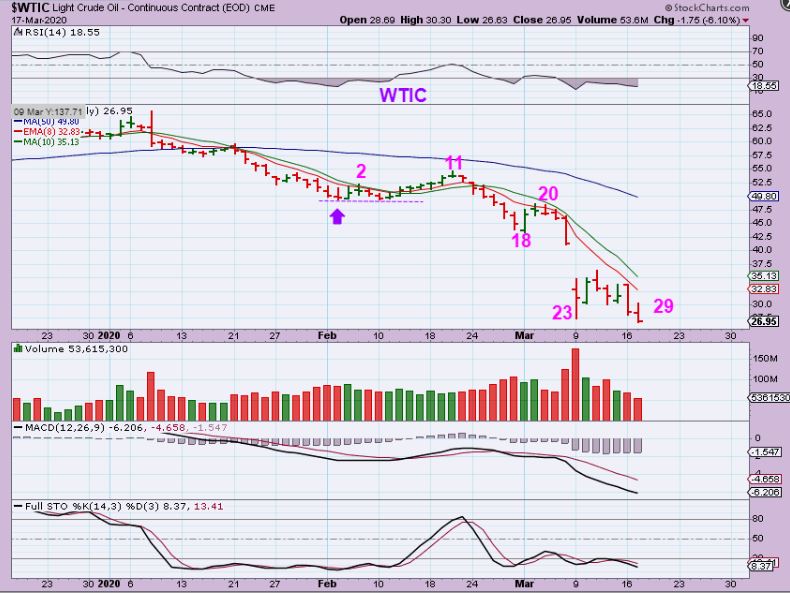
WTIC – Oil made a new low and Wednesday is The Oil Inventory report. Oil can chop or drop further, because it is on day 29 and most daily cycles reach day 40+. Some Oil Energy stocks have been putting in good size POPs / trade-able pops, but today is a day to be cautious. Oil inventory.
.
AT TIMES WE GET MOVES THAT ARE OUTSIDE OF THE NORMAL PARAMETERS OF WHAT WE USUALLY SEE. EXTREME MOVES NEED TO BE LOOKED AT FOR WHAT THEY ARE, DISMISSING NORMAL ANALYSIS, AND FIGURING OUT WHAT WE ARE SEEING. LET ME SHOW YOU WHAT I MEAN…
.
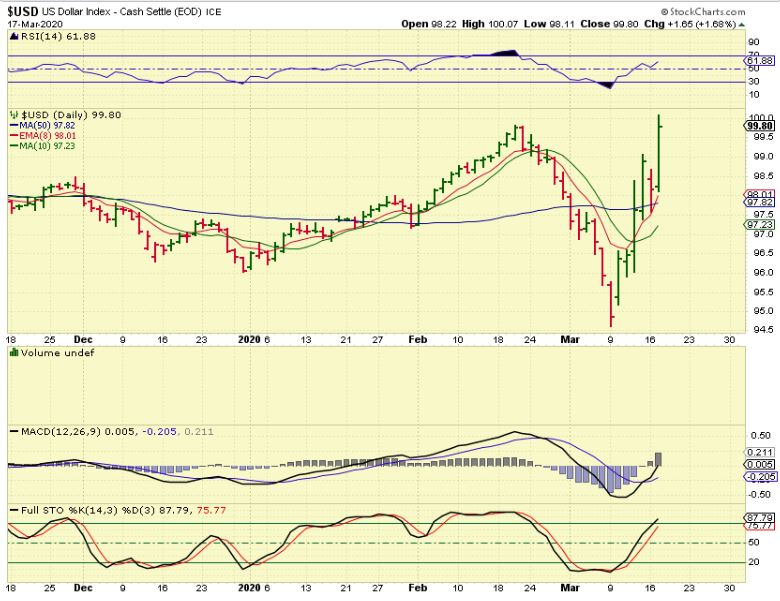
USD DAILY – This is extreme and this is obviously not normal. The USD crashed down made new lows last week. Now it is making new highs, so I want to jump right to the Weekly chart…
,
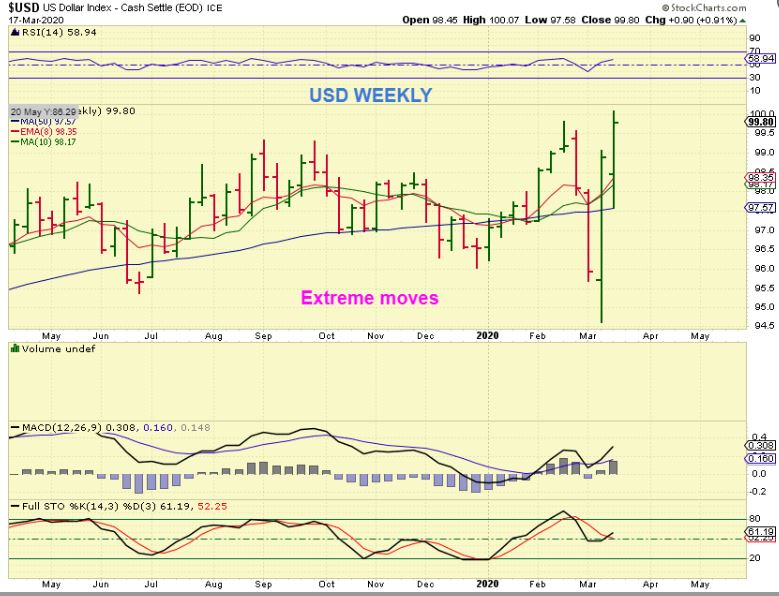
USD WEEKLY – You cannot treat the move here as normal, and after breaking down and looking bearish, if quickly found an ICL and now it obviously looks very bullish. The good news here is that when we get to covering the Miners- we may be seeing something very similar.
m
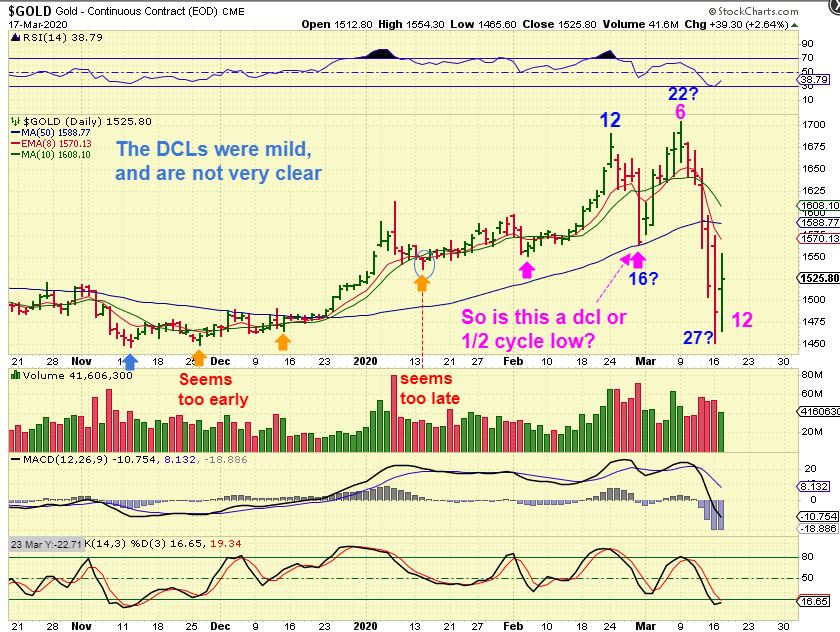
GOLD – To start, Take a look at November through January, and you’ll see that the dcl’s are very hard to find, because the dips for Gold were so weak. WHERE IS THE FIRST DCL AFTER THE NOVEMBER BLUE ARROW? January seems too far ahead. Then we had a crash last week. Read the chart. Well…
.
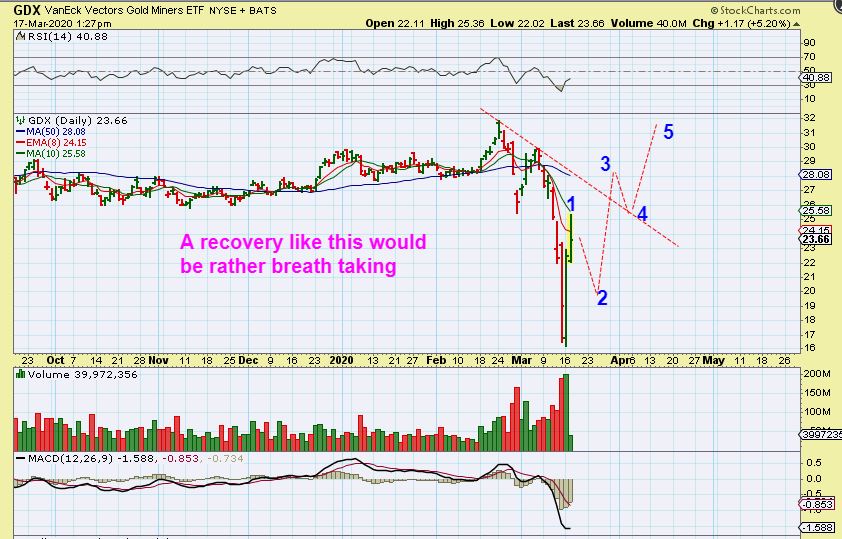
I DO think that the blue count is correct, because I went back & looked up a few charts and I found several Miners that match that count ( and posted those yesterday). We would be on day 28 , and this can go lower, but we are close to lows. They may even be in place. so let me show you one of those Miners daily count again…
.
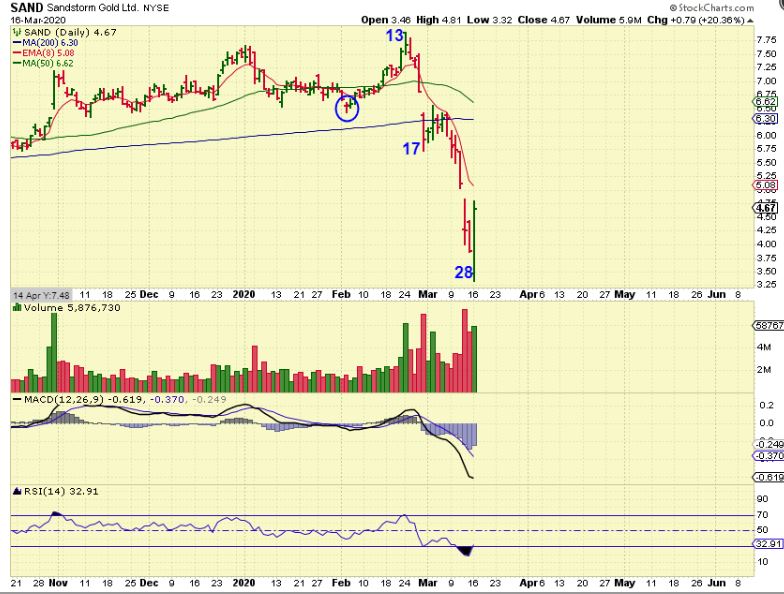
I wrote : “SAND landed on day 28 as a reversal candle and also a bullish engulfing with Gold & Silver getting hit. These may be durable lows.“
.
SO GOLD on day 27 CAN be an early dcl, but it also could drop further. That said, Miners look Bullish. So for Gold we have to just say that we do not have a swing low or move above the 10sma yet, this can move lower. A recovery of the 50 sma would be quite bullish however.
.
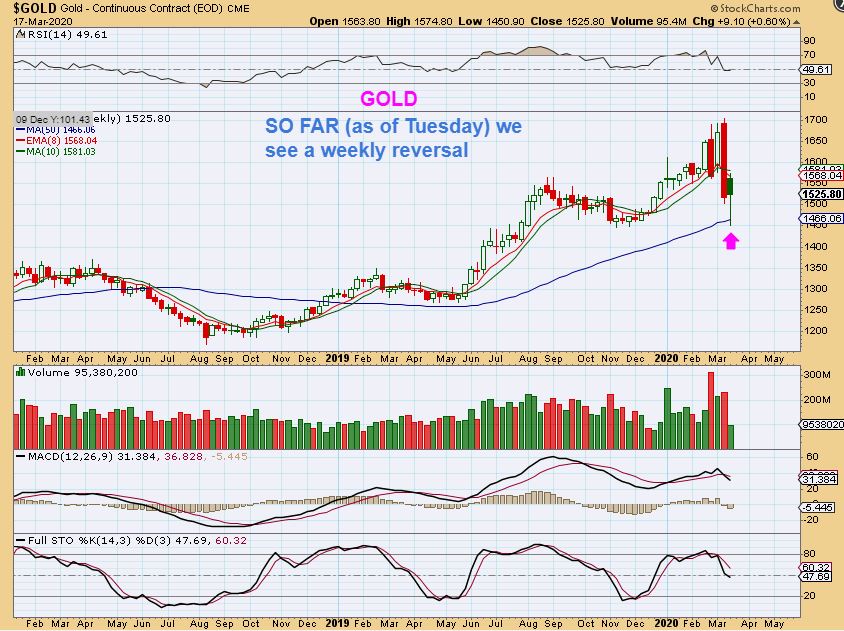
GOLD WEEKLY – Jumping to the weekly chart and look at this. Dismiss cycle count and you have ( so far) A reversal at the weekly 50 ma. In technical analysis, this is bullish and would be bought with a stop under that low, so now we’ll see what the FOMC MTG does for Gold , if anything.
,
BEFORE I COVER SILVER: I want to interrupt this report to tell you an something that Is important to my current analysis .
.
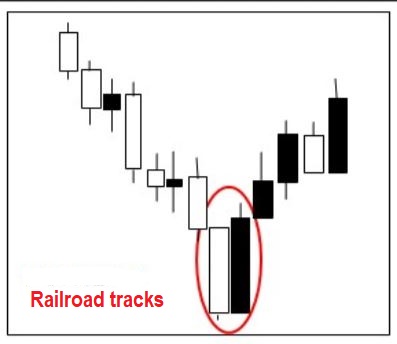
Way back in January 2003, I took a course on technical analysis and I had the privilege of having Joe Grandville visit the class. He taught me something that I RARELY EVER see anywhere else, and it is called RailRoad or Railway Tracks in candle stick analysis. He pointed out that true R.R.Tracks are very rare, because the conditions that they usually form in is also quite rare. He also mentioned that many claim to see small R.R.Track candles, but they are not reliable, they are not True R.R. Track Candles. In my opinion, that is why you probably have never heard of this pattern. It is so rare, that I think it is forgotten. I never forgot them, because I learned about them from Joe after the 2000 Market Top, and at the start of the Bull run in Miners- and they showed up around that time. Let me show you what I am talking about …
.
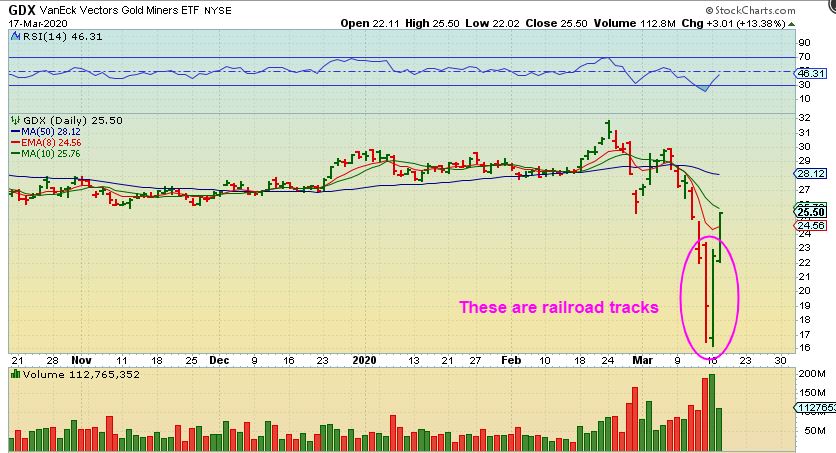
These are Railroad Tracks. It consists of a sharp sell off candle, immediately followed by a snap back reversal candle. It is best if the highs of the sell off candle are taken out by the reversal, but not absolutely necessary. According to Joe Grandville, he trusts that these are the lows, at least for a while. It can vorm that V-Bottom and would become a reversal. He felt that the more extreme the tracks were, the more reliable they could be as lows. WHY DO WE CARE?
,
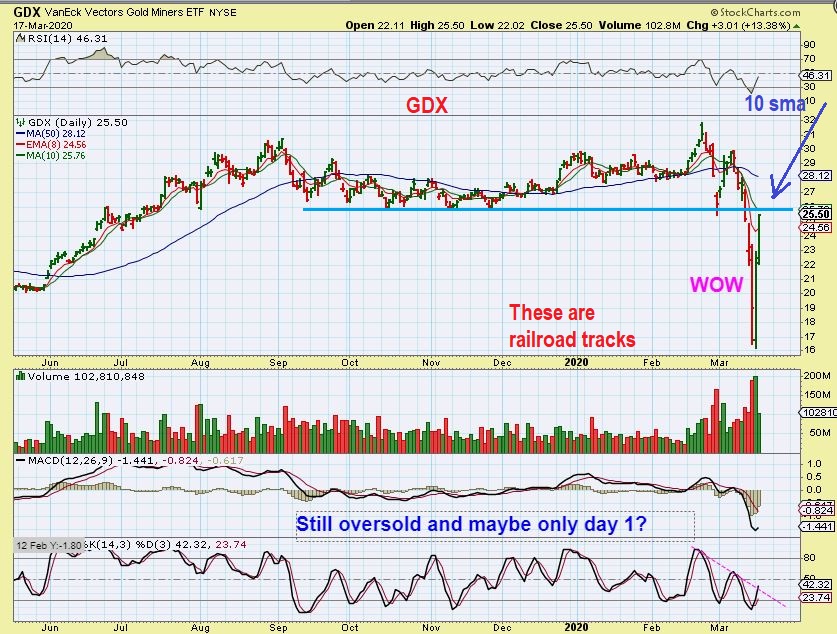
GDX R.R. TRACKS – I am seeing RailRoad Tracks in GDX & GDXJ (Not in all individual Miners, but that is fine). Now let me show you something even more amazing…
,
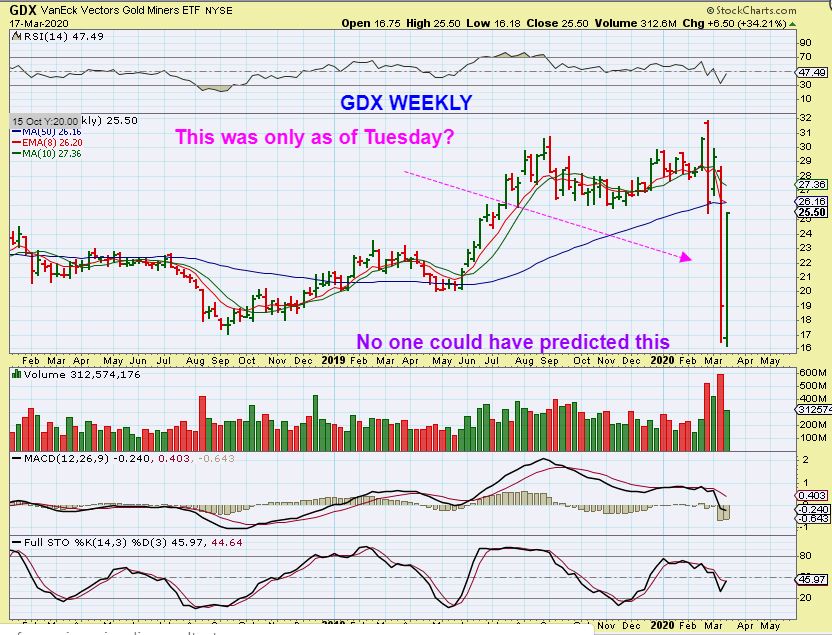
GDX WEEKLY – I have NEVER seen R.R.Tracks as extreme as THIS on a weekly chart! Note: This was only as of Tuesday, so it could change, but if the Fed Mtg holds Miners up or pushes them higher, this is the most amazing case of RailRoad Tracks that I have ever seen in my life ( Thank You Joe, for helping me to know what I am seeing).
.
NOW we see GDX ran from $16 to $25 in 2 days?? What? The trick is trying to figure out a way to get in if you weren’t inclined to buy that reversal as a trader. I have good news here too! That good news is…
.
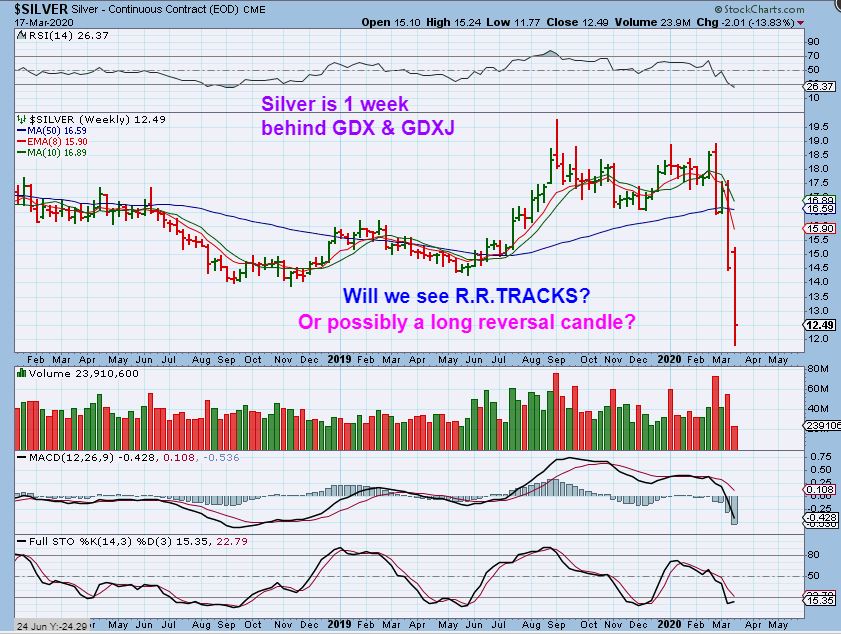
SILVER – Silver remains near the lows, but is starting to reverse. We saw that Gold reversed at the 50 week ma, and Miners pulled a R.R. Track. What if Silver puts in R.R.Tracks next week? You will get in at the lows now. It also may rally back after the Fed Mtg. If it does, we won’t see R.R.Tracks, since it would be all in one week, however…
.
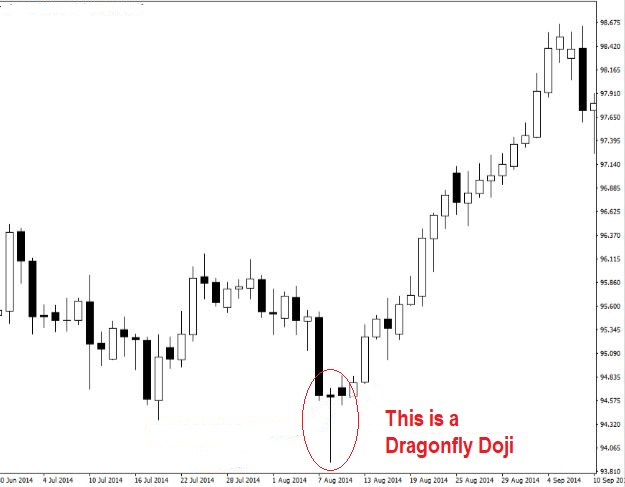
THIS IS A DRAGONFLY DOJI – And if Silver reverses this week, closing a lot higher by Friday due to the FOMC MTG, we would get a dragonfly doji in Silver. You can buy Silver with a stop or just watch Silver after the Fed Mtg. If it starts to recover, the weekly Silver chart may become a Dragonfly Doi. You have SLV, AGQ (double silver) or USLV ( 3xetf).
,
GDX -I drew this ‘2’ a bit lower than I meant to, if this is a daily R.R.Track. GDX can pull back as it nears the 10sma, but those lows really shouldn’t be broken, so this is something that I am watching for. As a R.R. Track pattern, this also could do what we saw the USD so. (See The Next chart again)
,
The USD Broke to new lows but then quickly reversed, now making new highs. Many Miners are still near the lows, but IF Miners do this with the R.R.Tracks pattern? IF THE MINERS dorace higher like the USD, then these Markets just cleaned the slate and left many behind. Look at this chart and just imagine GDX doing this. Lets go back to GDX…
.
GDX is at the 10sma. We could break above it or pause with the FOMC MTG today. This is honestly one of the most amazing R.R.Track charts I’ve ever seen. Can you believe that this would only be day 1?
,
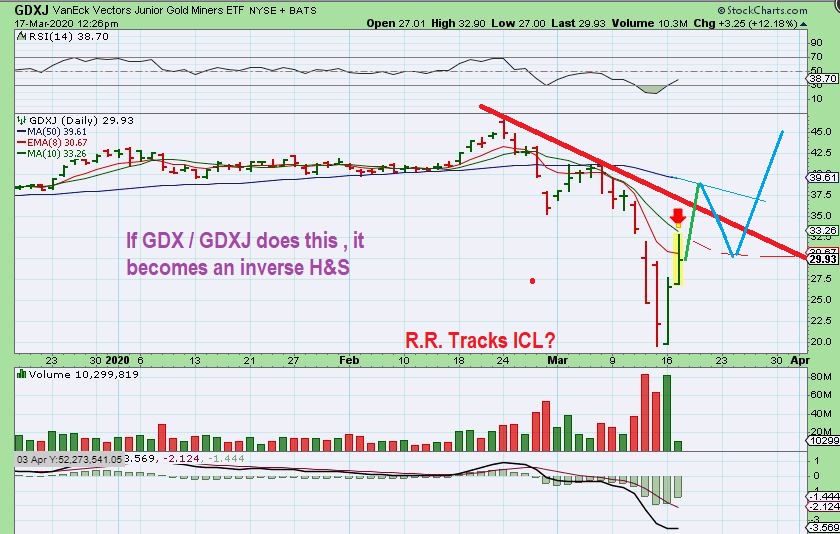
GDXJ -I actually drew this midday yesterday as GDXJ pushed against the 10sma & dropped back. By the close, it ran back to the highs though. Was that an ICL R.R.TRack Style? As I mentioned at the start of this report- we are seeing extreme moves, and may need to adjust our analysis as a result. I usually take it step by step, and you should just use stops along the way. THERE IS MORE GOOD NEWS…
.
THERE IS MORE GOOD NEWS… Many Miners are still pretty close to the lows , but they’re starting to play catch up rather quickly.
IN YESTERDAYS REPORT I WROTE:
.
The reversals seen Monday are often bought by technical traders as Bullish Engulfing Candles. You must place a stop under the reversal, and usually raise it as time goes forward. I THEN SHOWED THESE 3 CHARTS…
.
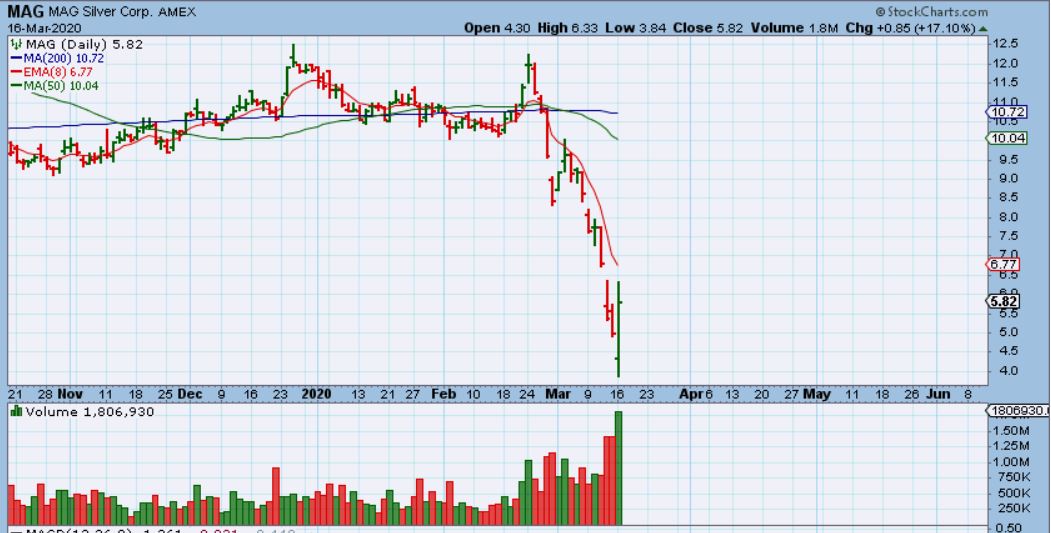
MAG – That looks like a big bullish engulfing with high volume. That move was a gap down with Silver, and then a rally from $4 to $6. It could get choppy, but I have mentioned in past reports that a candle like that can be bought with a stop and then raise the stop as price rises.
.
MAG – If you bought that reversal, even yesterday, you would have added almost 30% to your purchase yesterday alone. Yes, we are talking about ‘roughly’ $4 to $8 in 2 days.

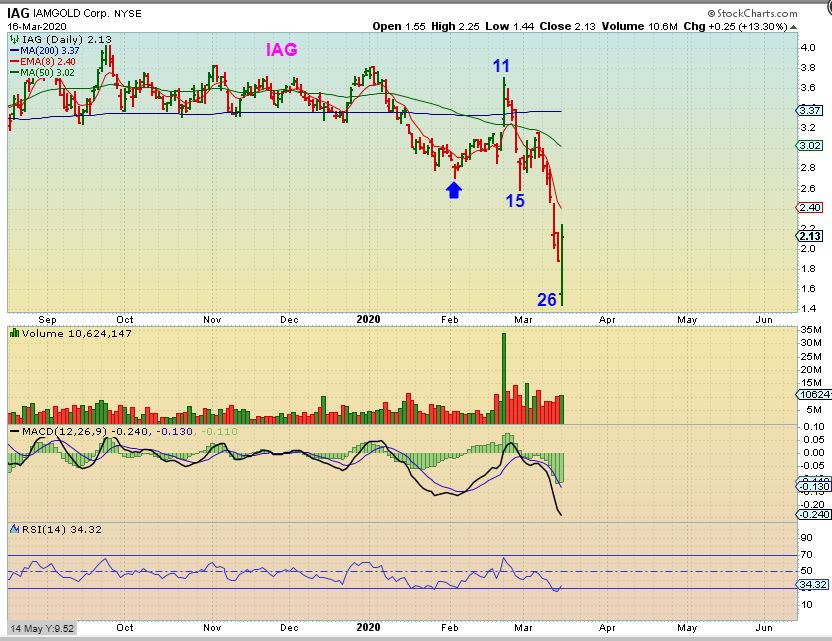
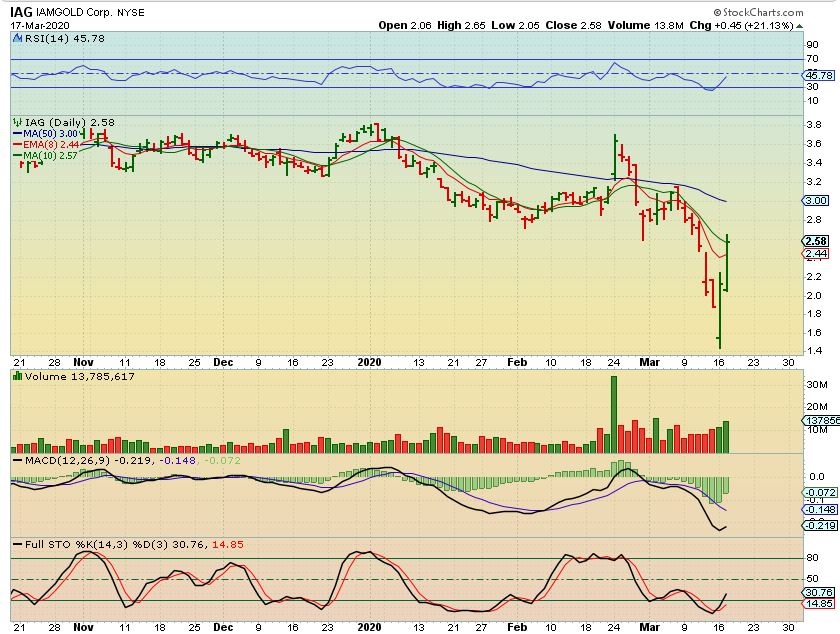
Tuesday I wrote: IAG – I decided to try to look at other miners with a view toward individual cycle counts. IAG would be within the timing for a dcl, though recent ones are 32ish days- these drops were extreme.
.
IAG – If you bought that reversal, you would have added another 21% on to your purchase yesterday alone. Yes, we are talking about ‘roughly’ $1.40 to $2.65 ( almost 100% gains) in 2 days!
.
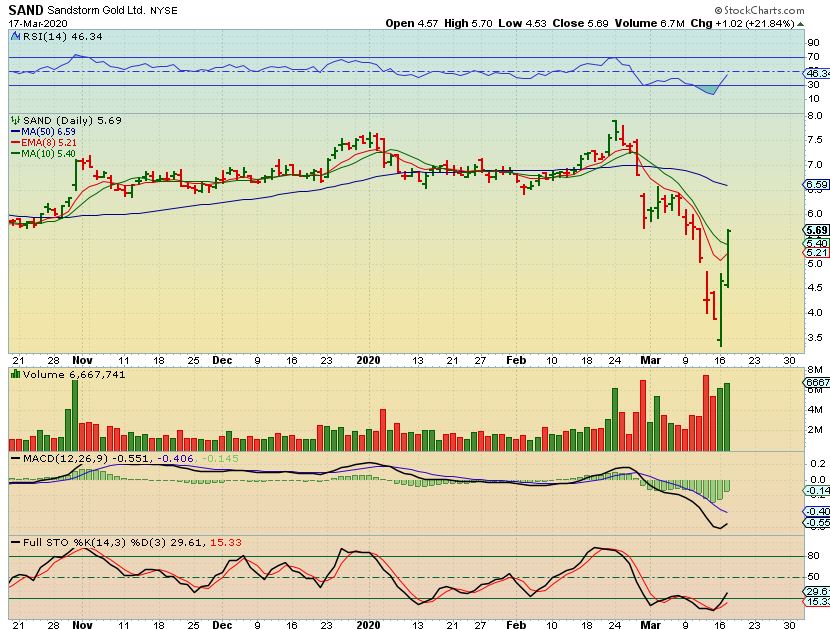
Tuesday I wrote: SAND – Even Sand landed on day 28 and also gapped down, reversed, and did a bullish engulfing with Gold & Silver getting hit. These may be durable lows.
.
SAND – You would have made another 21% on sand yesterday alone. These are now turning into V-Bottom lows.
.
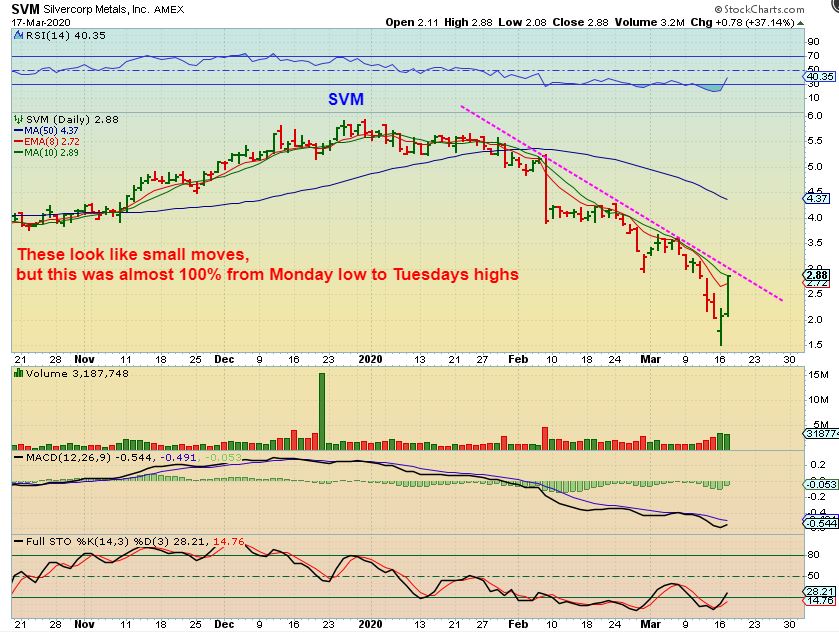
SVM CURRENTLY – These are not small bounces, this is almost 100% in 2 days also, but look where it is. It is still near the lows. It may even pull back. There should still be plenty of good upside if this runs back to the highs. In other words, SVM is under $3, and can easily run to $6 if these are now becoming that sought after purchase.
.
We saw Miners rocket higher for 2 days, even though Monday saw GOLD & SILVER getting hit . Tuesday they added gains and now I am seeing R.R.Tracks & V-Bottoms forming everywhere. Some Miners may be up 100% in 2 days, but if reversal candles and bullish Engulfing candles were not being bought due to fear of that sell off, that is absolutely understandable, but at this point there are many Miners still near the lows and they have a lot going for them now. Earnings should be good with GOLD still being sold near $1500- $1600. Oil & Energy costs for Miners have plunged with Oil. This helps the bottom line. The General Markets look to have Topped, and the coronavirus is shutting down many companies and will really hurt the earnings reports going forward.
.
I DO HAVE 1 MAJOR CONCERN with Miners, and that is the Coronavirus. If 1 Miner gets it, they may need to shut down a Mine, that may be temporary, but it also probably will not go over good. The best you can do is
1. Buy an ETF that already shot back up there near recovery levels, and you risk a small pull back with that too. Or…
2. Buy a basket of Miners near their lows and see how that works out. SVM has Mines in China, and there is news that the report of NEW cases in China has dropped drastically. The Virus may have run its course there, and that could help SVM.
.
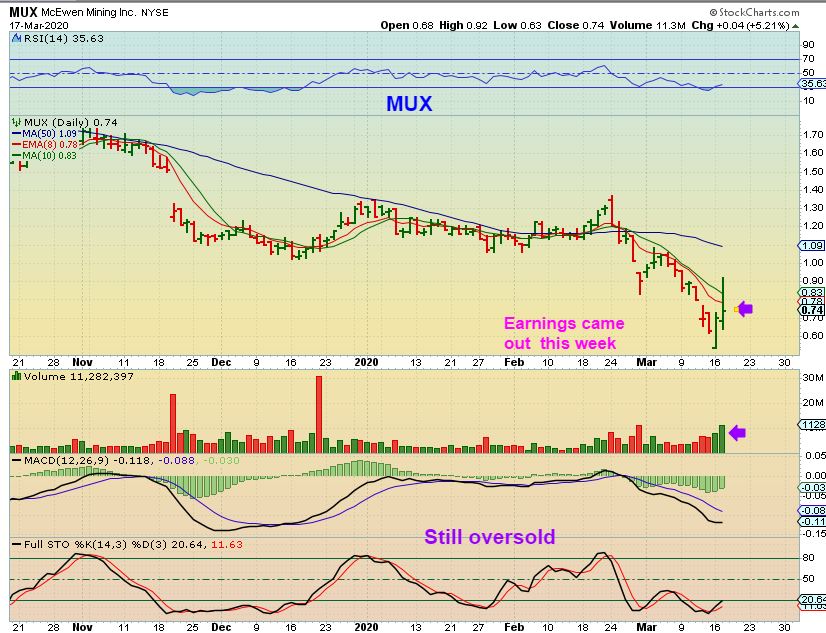
MUX released earnings this week & popped higher, but slowly sold back down into the close. I don’t view that as bad in this environment. It closed up %5. It is still near the lows, and there are others like this, so it is not ‘too late’ to start a small basket and expect some upside going forward, and stops can be placed ‘just in case’.
The charts are starting to look Bullish in Miners, and possible Rail-Road Tracks and reversals / bullish engulfing / dragonfly dojis, etc are forming. This may be the buying opportunity of the year. If you see SVM, IAG, MAG, etc pull back, they can be bought on the dip. Can Miners remain choppy? Yes. Can it be volatile? Yes. Yet for some of these, these may be the yearly lows going forward. Buy the dip? Buy ones close to their lows? I will be posting charts set ups going forward if this bullish action continues after the Fed Mtg, and it really looks like that will be the case. Use stops as always. Enjoy your Wednesday trading!
.

