The March 15th Weekend Report – Courage
I tried to take the time to really dig deep on this report, because I assume that this is why you are here at Chartfreak. We just had a week or 2 of absolute chaos and uncertainty, right? Things happened in various sectors that many of us have never seen before and even though many of us went ‘short’, even I certainly didn’t anticipate seeing the degree of downside that we have seen occurring in such a short period of time. It was full on crash mode, and that raises many questions.
To find the answers to those questions takes extra time, thank you for your patience. You may work full time, you have a family, and are all dealing with the uncertainty of the Virus Pandemic, global economics, and so on, so you probably do not have the time to do the market research on your own. I think that my work here can help to answer many questions. I don’t have time to show you EVERYTHING I found in just this one report, but I will try to help clarify a few things for now, and will continue to do so going forward. I do believe that this SUDDEN burst of volatility and panic selling shall pass or gradually die down over time. The good news? I DO plan on showing you today why I think that the slaughter in Miners this week can still lead to great gains down the road. I am not a never-ending ‘Gold Bug’ – so I am not saying that from a Bias or a place of undying false ‘hope’. It was a monster sell off week, I understand that. I have actually been through this before in 2008. We had a financial crisis at that time. Hopefully you used stops and preserved funds as recommended here, and even if you are licking some wounds from the downward explosion, we can all make what could be excellent gains going forward again over time, based on what I am seeing so far. I will discuss these things today and continue doing so going forward. For now, Let’s get to the charts!
.
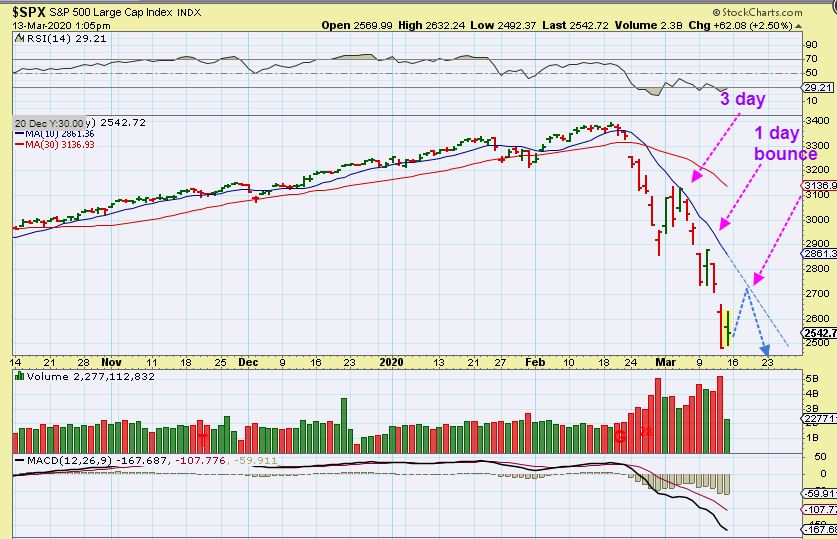
SPX MIDDAY Day 29 ( or 1) – I captured this midday Friday, thinking that we could get a bounce after that Gap down. This COULD ALSO be a dcl, now that we have approached day 30, but recently they have been 40 days long. I want to break this down a bit more though….
,
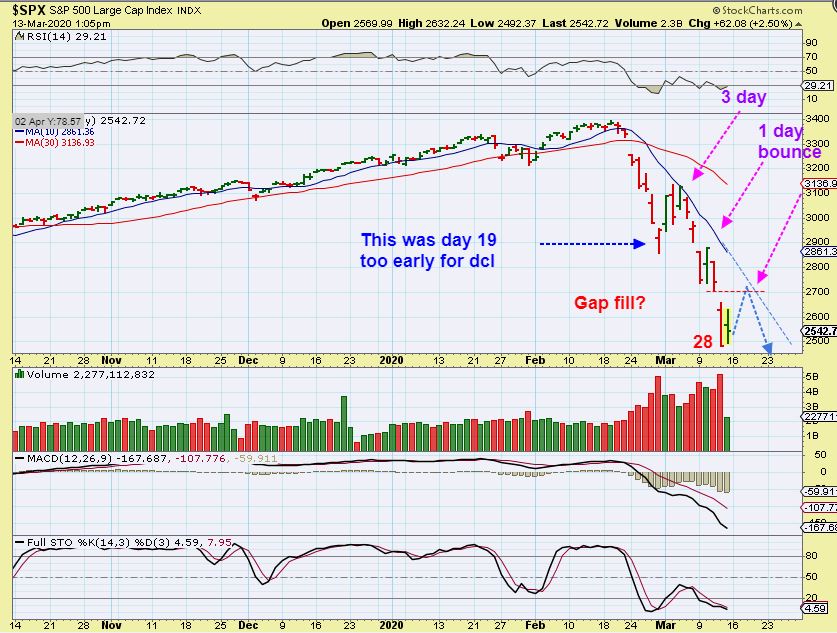
SPX MIDDAY Day 29 ( or 1) – The day 19 reversal & bounce failed after 3 days at the 10sma. Day 25 gapped down & that reversal lasted 1 day. Now we have day 28 gap down and a bounce , so I was looking at the 10sma & a gap fill to start…
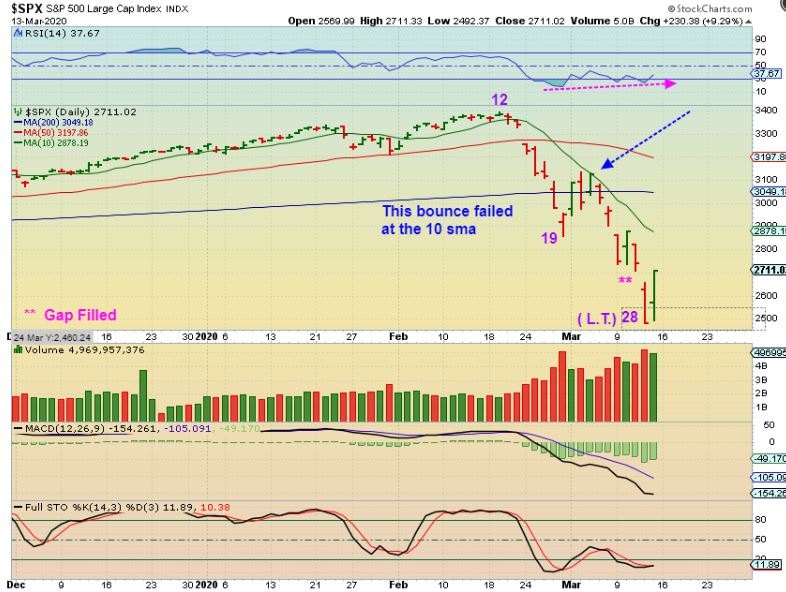
SPX Fridays close – By Fridays close, We now have the gap filled and a good reversal. WATCH THE 10 SMA NEXT. A break above that may signal an earlier dcl due to the sharper degree of selling. I do see RSI divergence. If you bought the reversal, begin to raise stops over time.
.
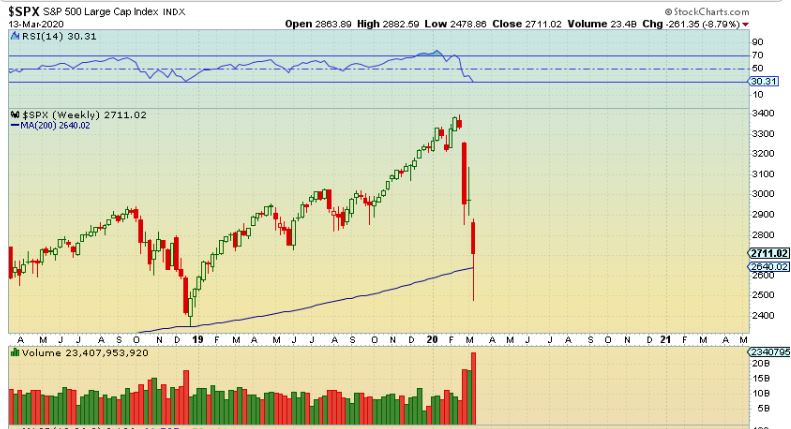
SPX WEEKLY – The weekly is showing a pretty convincing reversal that lost and recovered the 200 week ma. This kind of reversal is bought by traders and a stop would go mid point on the candle ( coincidentally at the 200). We may now see a bounce out of a dcl.
.
SPX WEEKLY- That reversal was right at the trend line that I have been pointing out since the top, adding confidence that we may be at a support or buy area. Temporary or longer term will be determined over time, we RAISE STOPS along the way.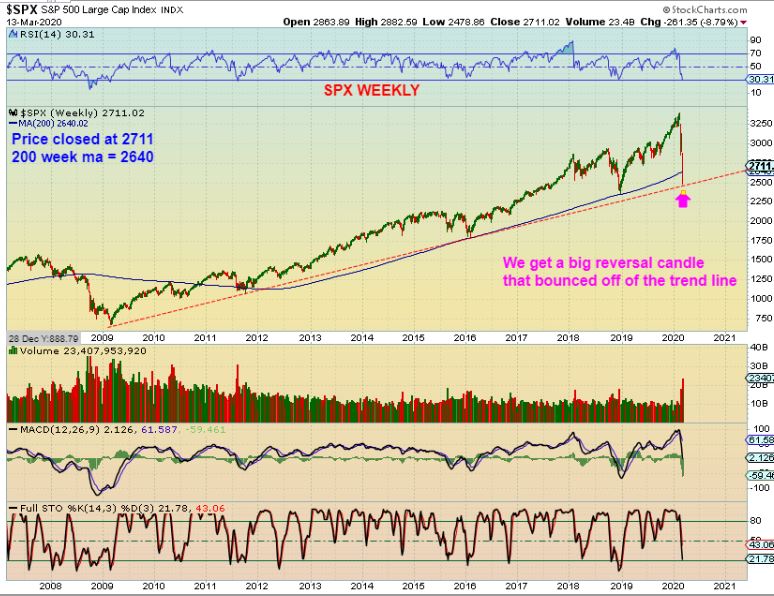
.
NOW I WANT TO DO AN EARLY EXAMINATION OF PAST SELL OFFS. WE WILL BE WATCHING THIS ‘BOUNCE’ TO SEE IF THE TOP IS IN OR IF THE BULL CONTINUES ON. My personal thoughts at this point in time are that the top is in for this Bull in the General markets.
.
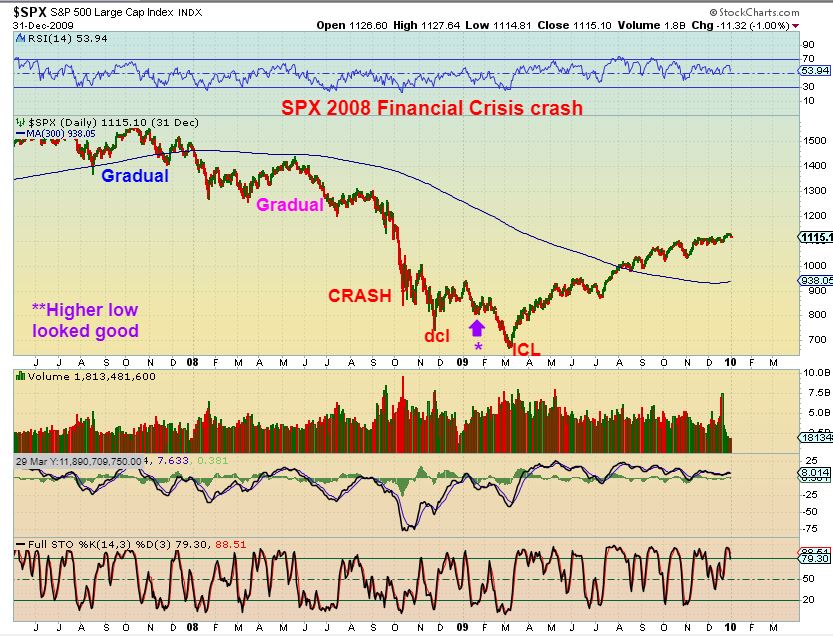
SPX – Notice that with that 2008 Financial crisis, the sell off went gradually lower with some pretty decent bounces along the way. The 2 ‘gradual’ sell offs were daily cycles bouncing higher out of the lows, and then rolling over after 2 months. 2 daily cycles up, and a few down to new lows. THis could happen now too. This was bear market action leading into the sell off lows. SO EVEN IF WE GET 2 DAILY CYCLES HIGHER OUT OF AN ICL- THIS SHOWS THAT IT CAN STILL BE THE START OF A BEAR MARKETS.
.
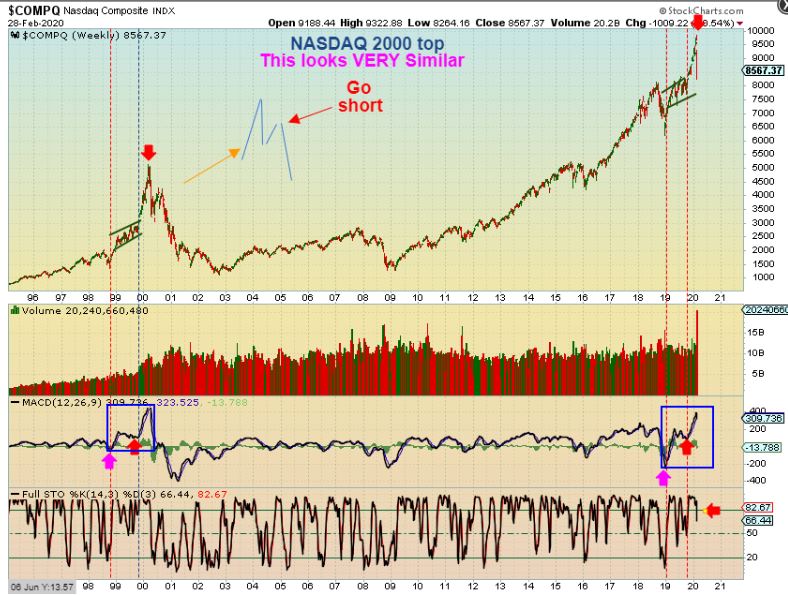
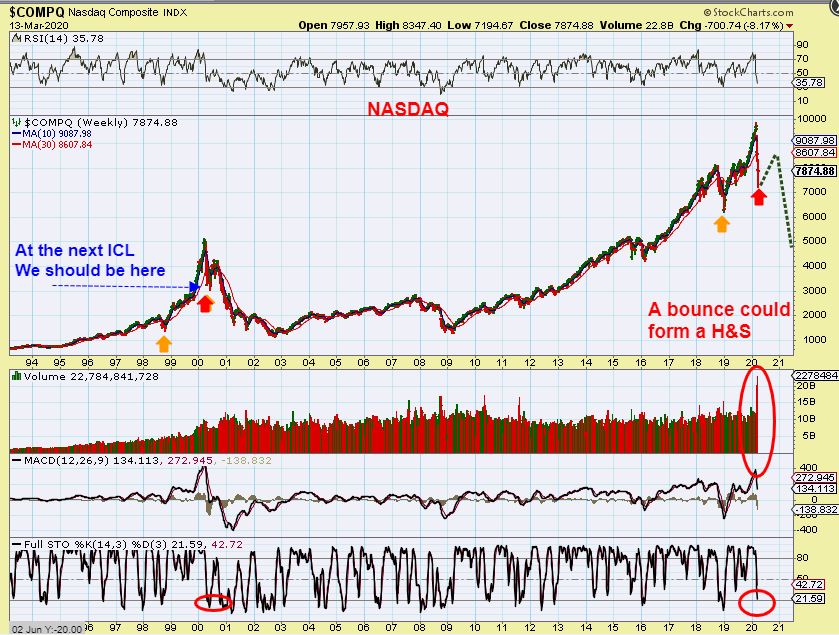
NASDAQ – In Feb I posted ‘Sell’or ‘short the bounce’ if we see a repeat of the 2000 Bull Top. WELL…
.
NASDAQ 2000 vs Now – The bounce is the NEXT move out of that plunge. So if we just reached that bottom area ( that would be an ICL) we should focus on that bounce. THAT BOUNCE fooled many people back then, when it was really a good time to lighten up if you missed selling at the top. So let’s review that now…
.
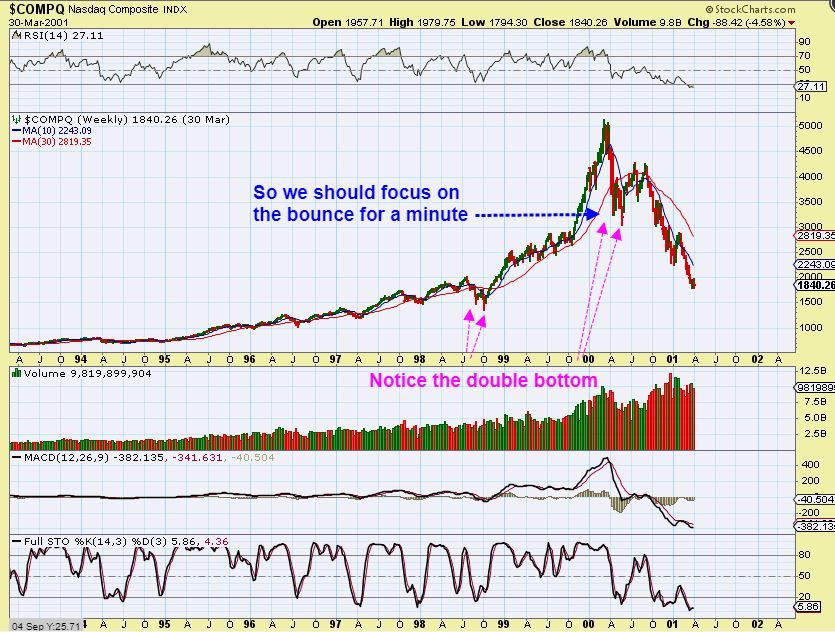
NASDAQ WEEKLY 2000 Top-
1. Notice that the 2000 ‘double bottom’ indicates 1 more daily cycle rolled over into the real ICL. We may have time for that too.
2. Remember that this is a weekly chart, so each candle represents 1 week out of that low. THAT is why it fools people- because the bounce lasted for weeks and even months, thus people felt that we were in a recovery like 1998. See the chart.
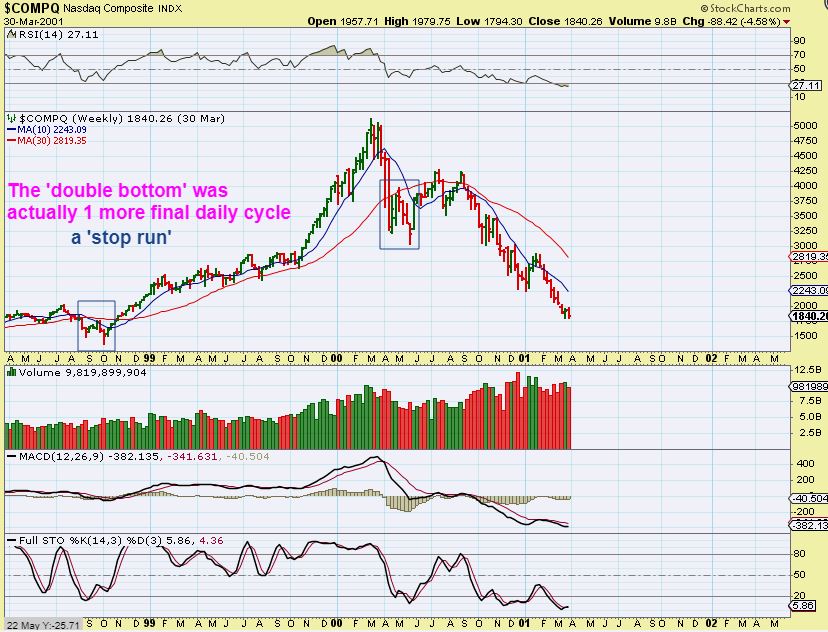
NASDAQ WEEKLY 2000 Top– Zooming in, you can see that the first bounce was just a mild daily cycle that rolled over into a slight undercut ( Stop run) ICL, just like 1998. Then it moved higher…
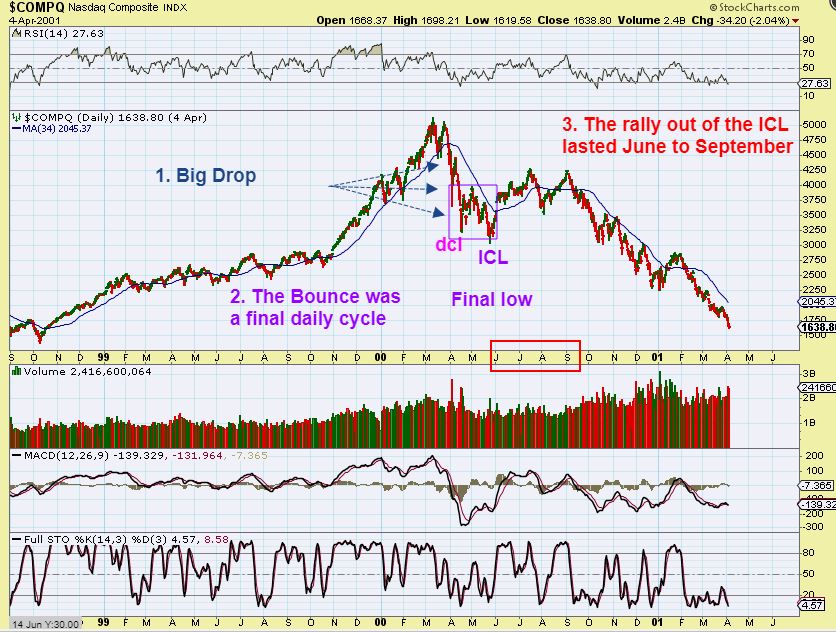
NASDAQ DAILY –
1. We saw that SHARP DROP, similar to what we just went through to into a dcl
2. A bounce that rolled over to a final daily cycle low (the real ICL).
3. That rally then lasted from JUNE TO SEPTEMBER, and it fooled Bulls into expecting more new highs. As you can see, it then sold off steadily from September.
NASDAQ DAILY ZOOMED IN– If I chop off the ‘sell off’ part near September and just show you June lows to September highs, this is why it was a believable bounce. KNOWING that it sold off gives you the reason that we need to always use stops. You make money on the bounce – you don’t want to give it back…
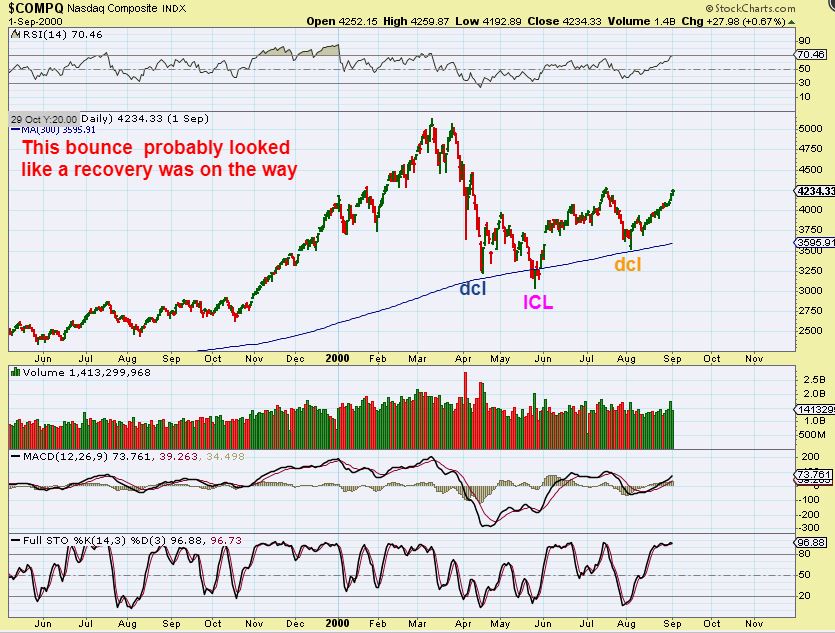
REPEAT FOR EMPHASIS: KNOWING that the Bounce eventually sold off after 3 months shows why we use stops. You can make money on the June to September bounce – You don’t want to give it back.
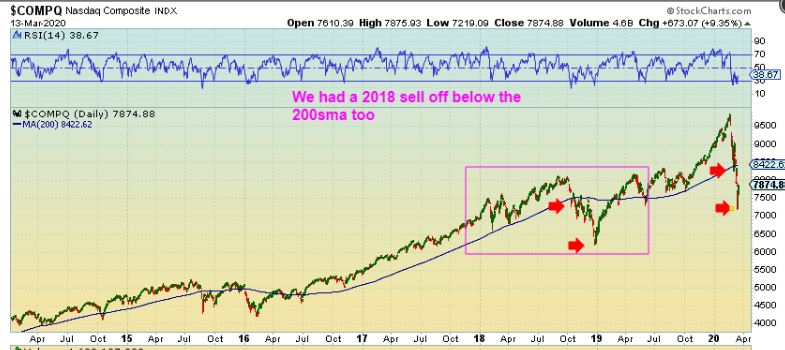
LETS ALSO LOOK AT THE 2018 SELL OFF FOR HELP Too – We crashed below the 200sma & then recovered. This one recovered as a V-Bottom and ran back to new highs, so you would buy the ICL, and trail a stop & come out just fine. That 2018 drop looks a bit similar to the one we just went through, but I’m not so sure that this one is all finished with that coronavirus still spreading. Lets break it down though.
QQQ – That drop hit the 200sma & bounced. Some bought that, but we watch that 10sma, right? …
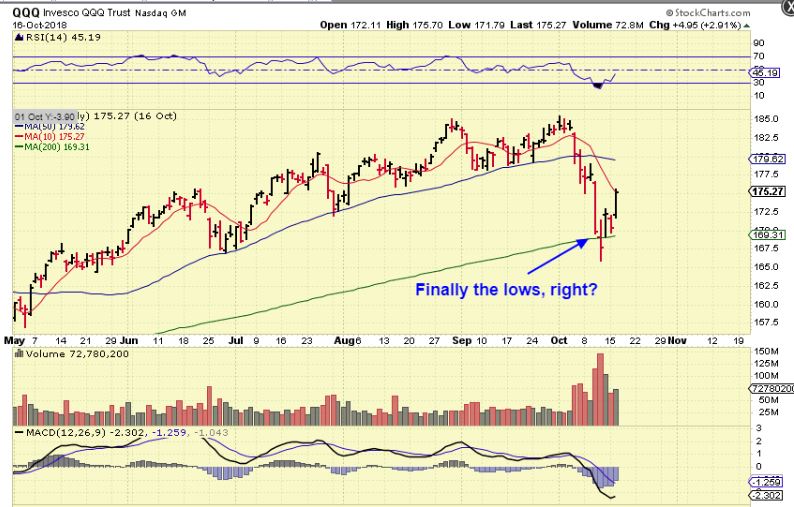
QQQ – That was a 4 day bounce to the 10 sma ( We also just had the 3 day bounce to the 10sma) and it rolled over, breaking below the 200sma.
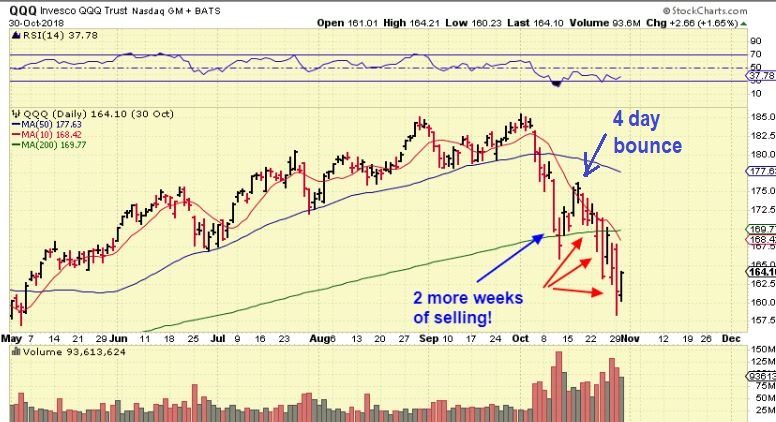
QQQ – Notice how the ‘bounce ‘ then broke back above the 200sma, yet crashed again. So if we get a bounce next week, this is helpful. That was a bounce for 6 days & peaked, rolling back over. NOW look at the new lower low in November. Was it Finally a real ICL , shooting straight up out of a V-Bottom to that 50sma? …
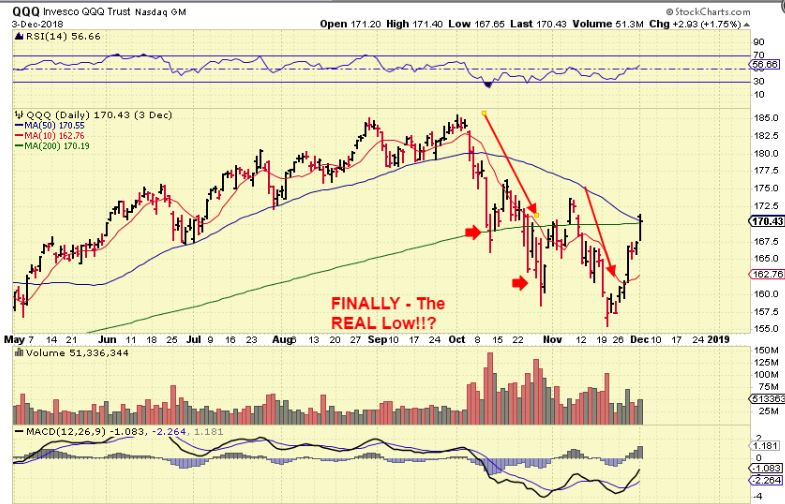
QQQ – NO, IT DIED AT THE 50 sma & Rolled over again. HOW FRUSTRATING IS THAT? So that first drop did not lead to the ICL, the ICL was still another daily cycle ahead, and that 50sma is where it failed again.
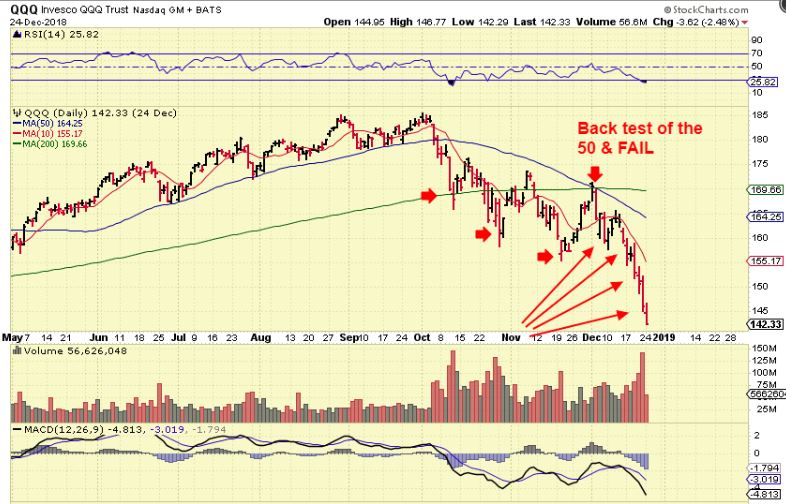
NASDAQ 2018 sell off – And finally a V-Bottom ICL. So now we are looking at the current drop and that 2018 side by side. That one had various bounces along the way, as seen above. This one was a PLUNGE straight down, and that is why this gets tricky. This could bounce to the 50 or 200sma and just tag it and drop again, so if this plunge led us to an ICL, it can rally. If it is just a dcl, we need to be cautious, no matter how Bullish it looks.
.
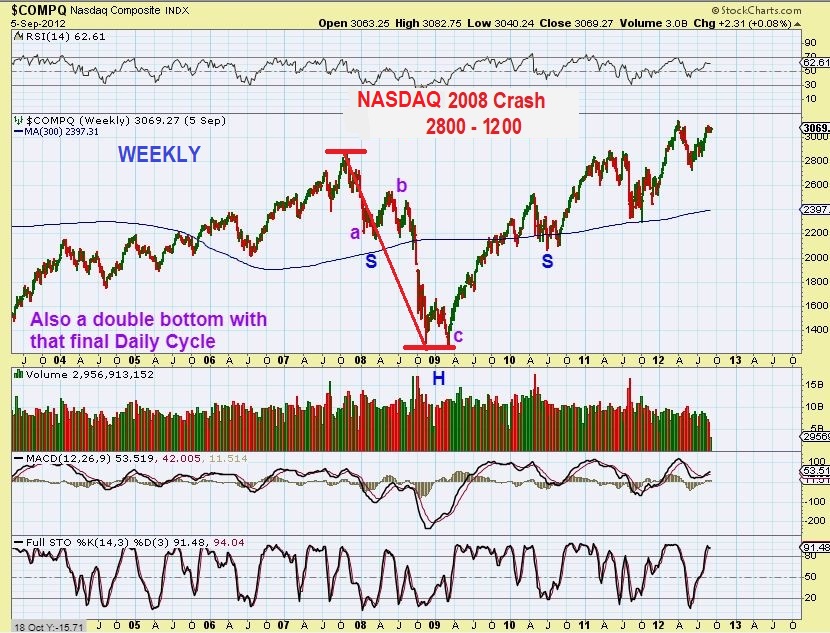
NASDAQ 2008 sell off – Are you ready for more? In the 2008 Financial crisis, the NASDAQ was cut – in – half. This was a ‘Banking Crisis’ and it may be more similar to how the ‘Virus Crisis’ affects earnings, thus the sharpness of the crash to the lows. Notice again that this is a weekly chart, and we see a double bottom low. To me, THAT indicates that a daily cycle played out at the bounce out of the lows in 2008. We could see that now too ( Double bottom after a bounce).
.
This General Market portion of the report has pointed out prior sell offs and the bounces that happened at those times. Some eventually had V-Bottoms, but others had bounces that failed again & again until the REAL Lows were put in place. You can buy the lows for the bounce , but MUST use stops or wait for price to break the 50sma, etc. We will discuss things along the way in the daily reports. WHAT DO I PERSONALLY THINK? I think we must have seen the TOP, like 2000. SOME may want to think about this: IF this Virus really hurts earnings ( of course it will. The sports world is now on hold, Empty arenas everywhere ( -$$$), Even Disney world shut down (-$$$) . Millions in ticket sales, Vendors like Coke, Pepsi, Beer, Restaurants, Movie theater’s, etc (-$$$) will all be reporting slashed sales & losses, etc. If this is a top like the 2000 top, and you did not use stops, you MIGHT want to consider lightening up on a bounce to the 50 sma. The bounce in 2000 lasted 3 months out of the ICL, we will be watching that when it comes.
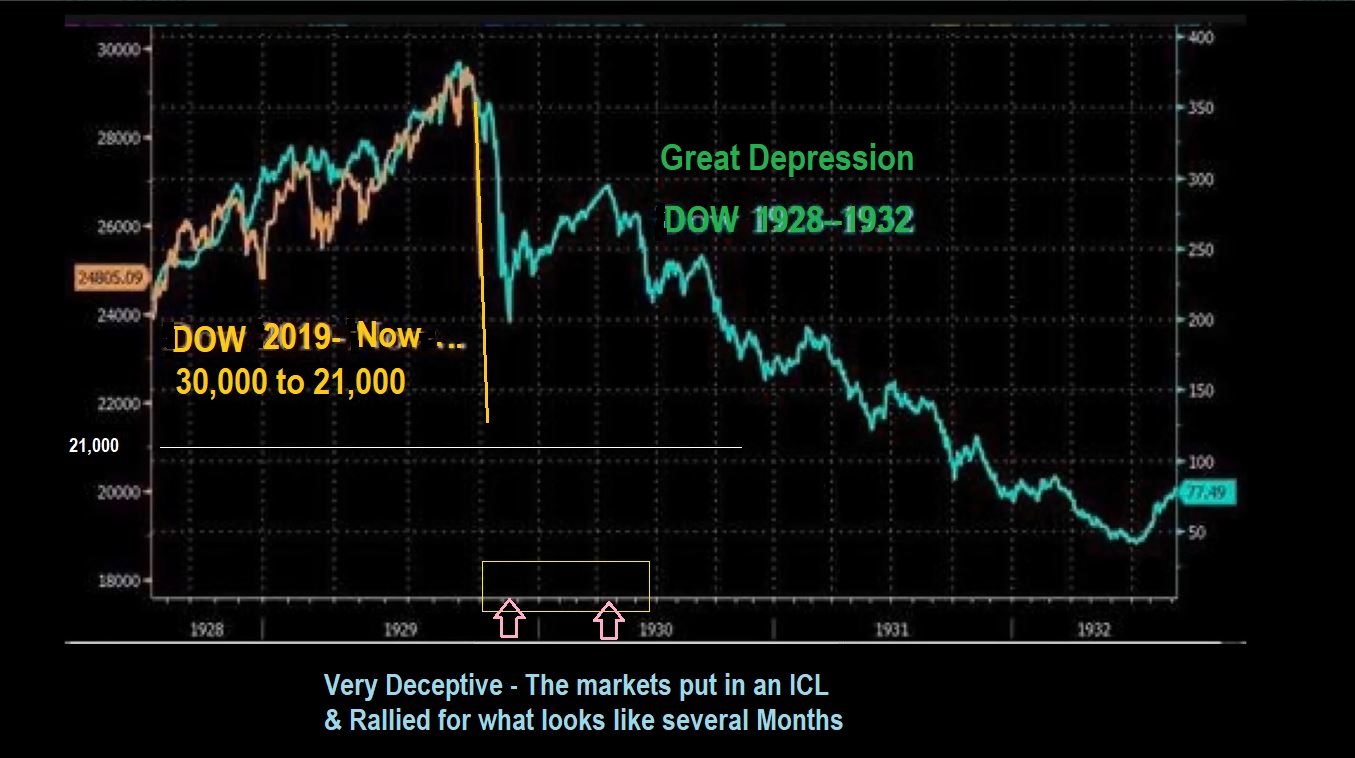
A HEADS UP ABOUT THE BOUNCE OR COUNTER RALLY – We just sold off deeper than the first drop at the start of the Great Depression too. It then rallied for several months before trending lower & lower. Just another thing to keep in the back of the mind.
.
FOR THE SAKE OF TIME- NOTHING AT ALL CHANGED WITH OIL SINCE I WROTE THESE 3 CHARTS, IT HAS MOVED SIDEWAYS , SO I WILL JUST RE-POST IT, with an EDIT to update .
.
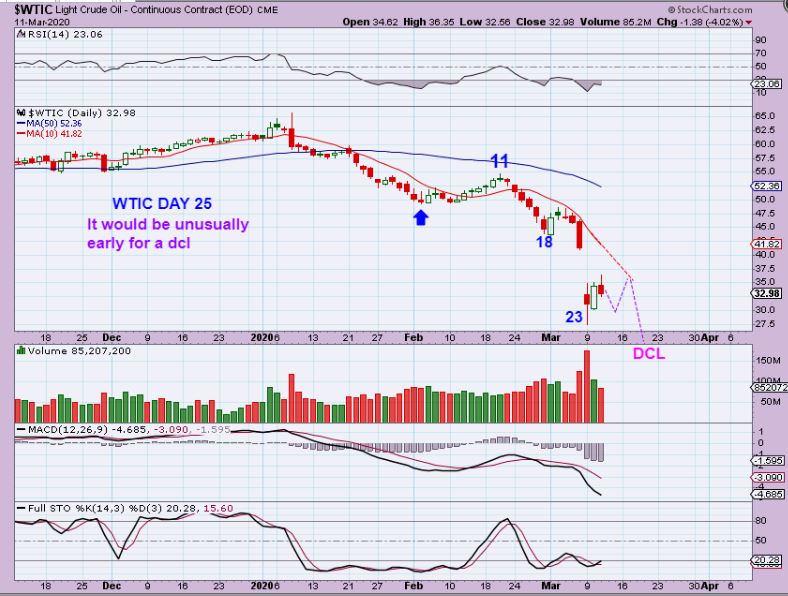
WTIC FROM WEDNESDAY – With a day 23 low, it seems way too early for a dcl, but that 25% drop in 1 day is NOT Normal. I discussed that this could bounce, chop around, and then slightly break the lows for a dcl, or just plunge to maybe $20. EDIT : So far, we’ve seen the bounce & choppiness continue. The Wednesday Oil Inventory Report did drop Oil remained well above the lows.
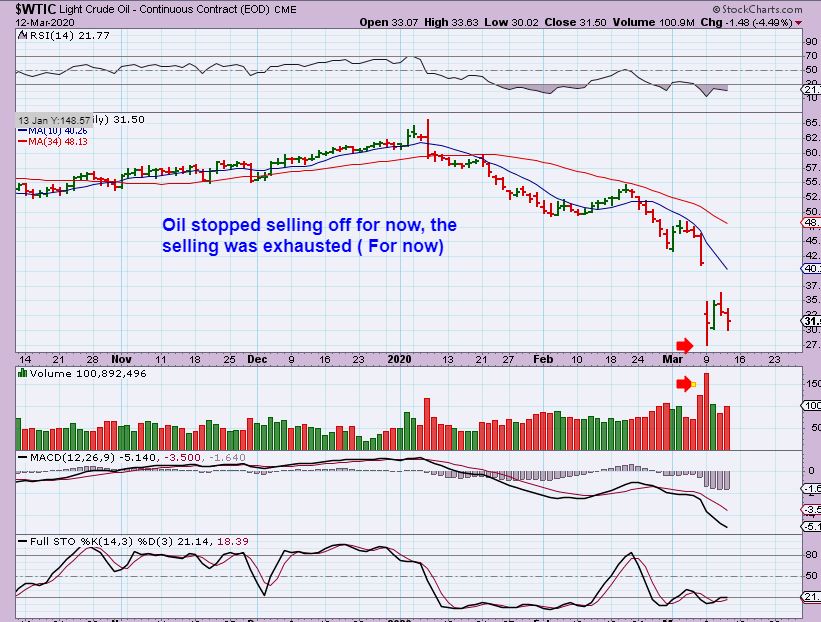
WTIC – OIL STILL REMAINED ABOVE THE LOWS, DESPITE THE GENERAL MARKET SELL OFF. It is NOW Day 27 as of Friday and possibly this is too early to be the dcl. We could get a bounce & slight break of these lows into a dcl. A 25% slam down is not normal, so there IS still a chance that these are the Capitulation lows.
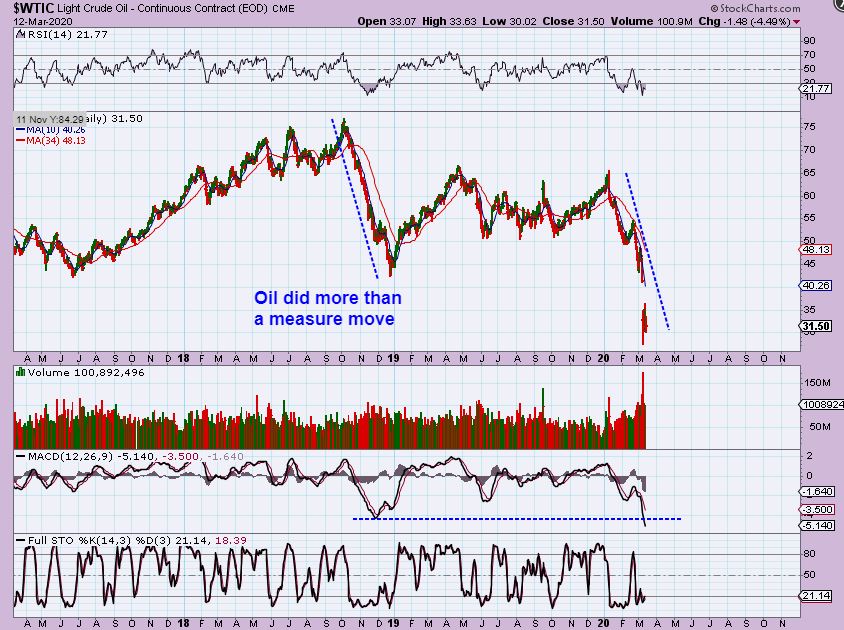
WTIC– Oil did do slightly more than my original measured target, and is quite oversold. It can bounce, especially if the general Markets bounce.
.
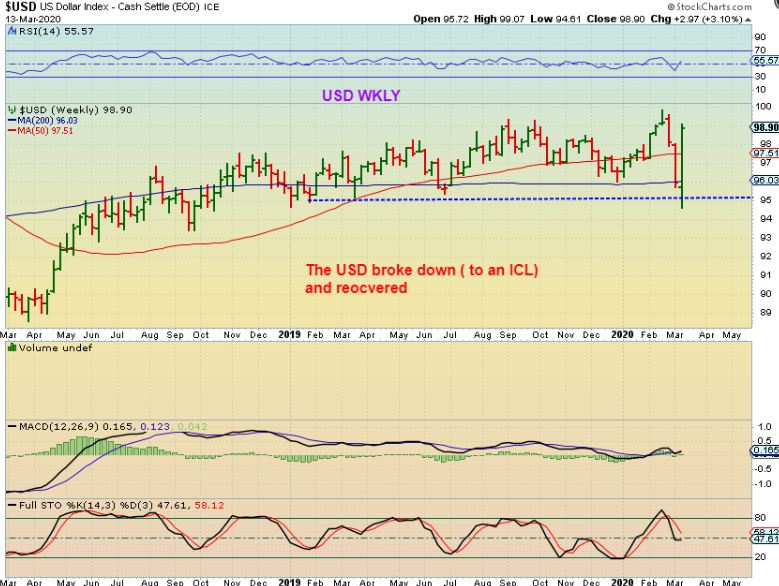
USD WEEKLY – The USD started to break down and fall into an ICL. Guess what? It put one in place and popped up off of the floor like a prize fighter. The USD surged out of that ICL, and looks quite Bullish. GOLD finally got the message that it was time for it to roll over too, and dip down into an ICL too.
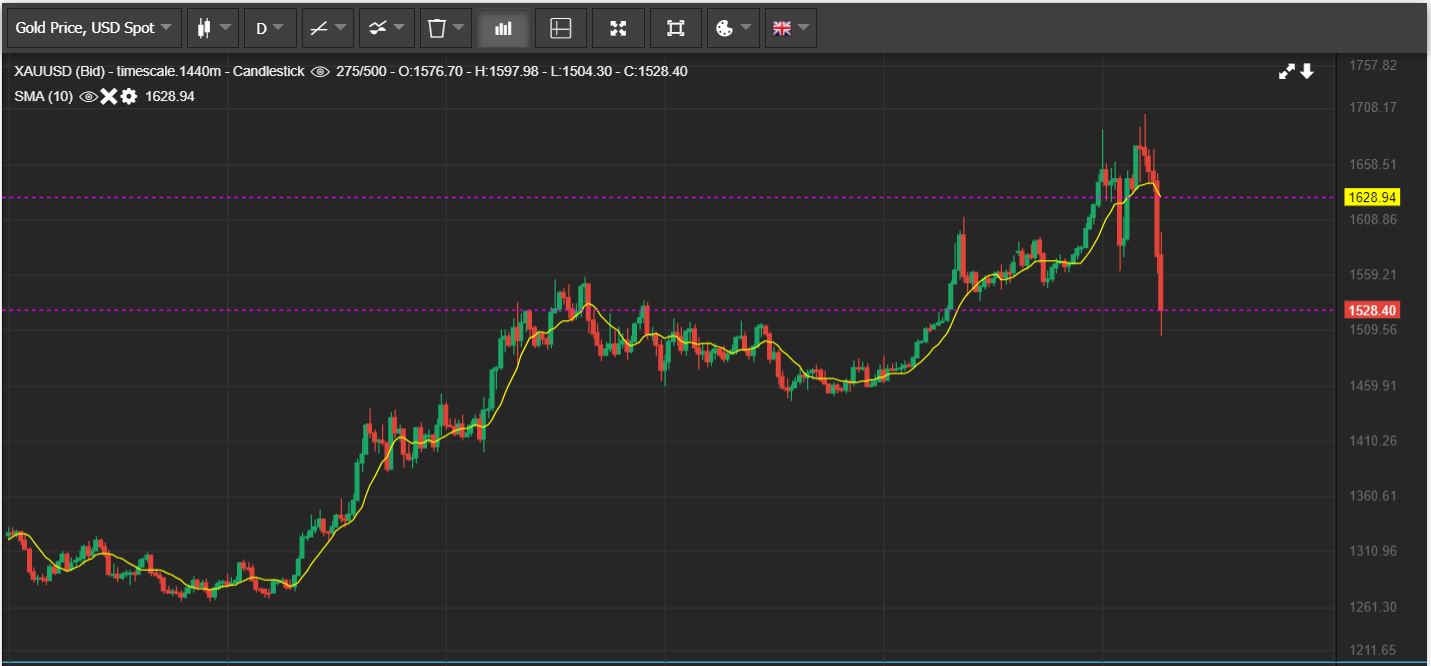
GOLD DAILY – Gold was holding up very well even though Silver & the Miners dropped VERY SHARPLY. Gold then followed Thursday & Friday. These are abnormal price drops. IF GOLD FOLLOWS THE MINERS LEAD, THIS CAN DROP EVEN FURTHER.
.
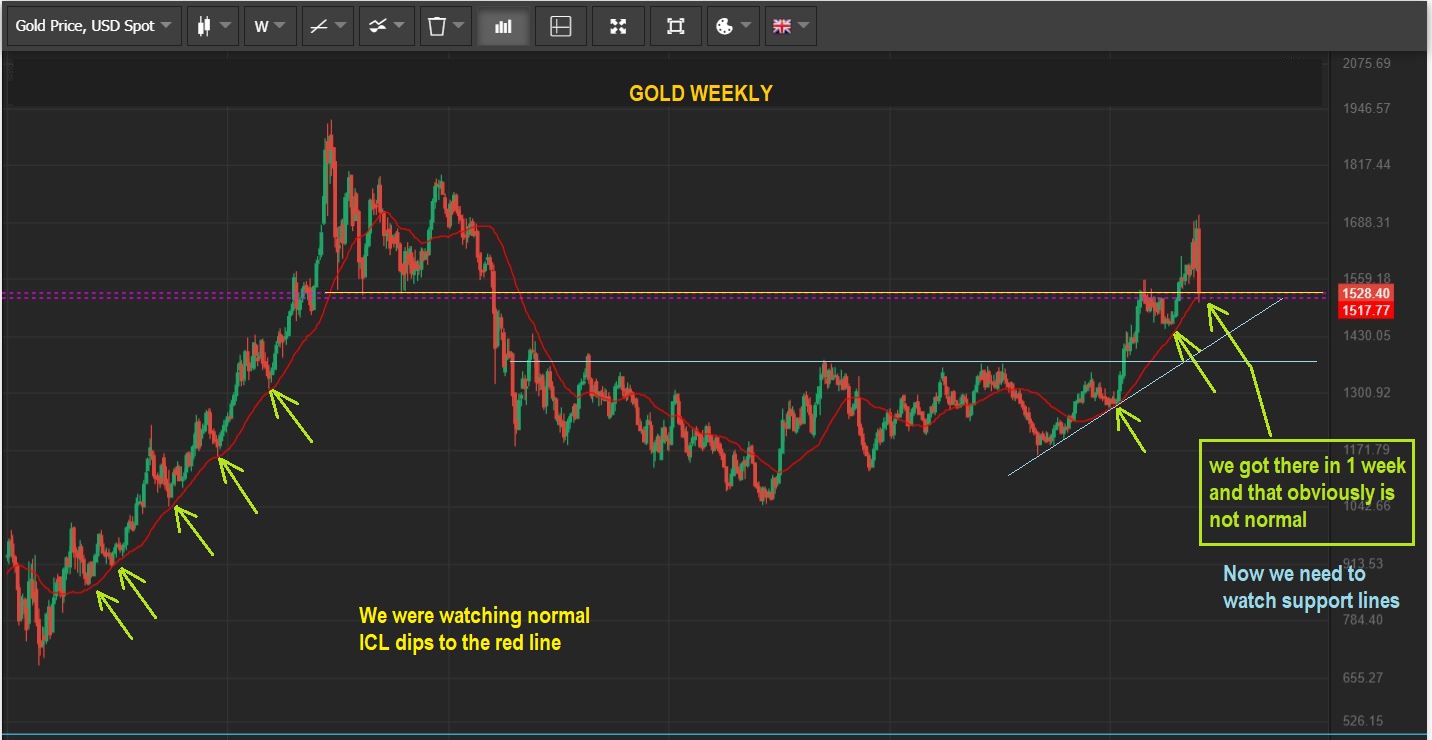
GOLD WEEKLY – GOLD reached ICL levels in a 1 week drop from the top. Read the chart, it can drop even lower due to cycle timing. I have added a few support lines that we would like to see hold if Gold sells off further.
I think that we should visit the charts of the 2008 Banking Crisis. Why? Most people (myself included) thought that GOLD, SILVER, & MINERS would be a safe haven in a banking crisis, The Precious metals got caught up in the selling then too. THIS IS WHERE I LEARNED THE IMPORTANCE OF STOPS – The hard way. I used some stops on more recent purchases, but I also said, ” I bought XYZ & PDQ much lower as a buy & hold in 2002 – 2004, I’m not worried about those. ” Mr. Market promptly punched me in the gut, and robbed my account of my very hard earned gains and then some. I had a sick ‘pit’ in my stomach, but I am happy to tell you that the gains CAN be made back. Even losses that I felt heart ache over did eventually come back, but 2008 taught me what many are just now learning. Preserve your funds and trust the charts when they break down- don’t trust the fundamentals. Lets go to Gold 2008…
.
.
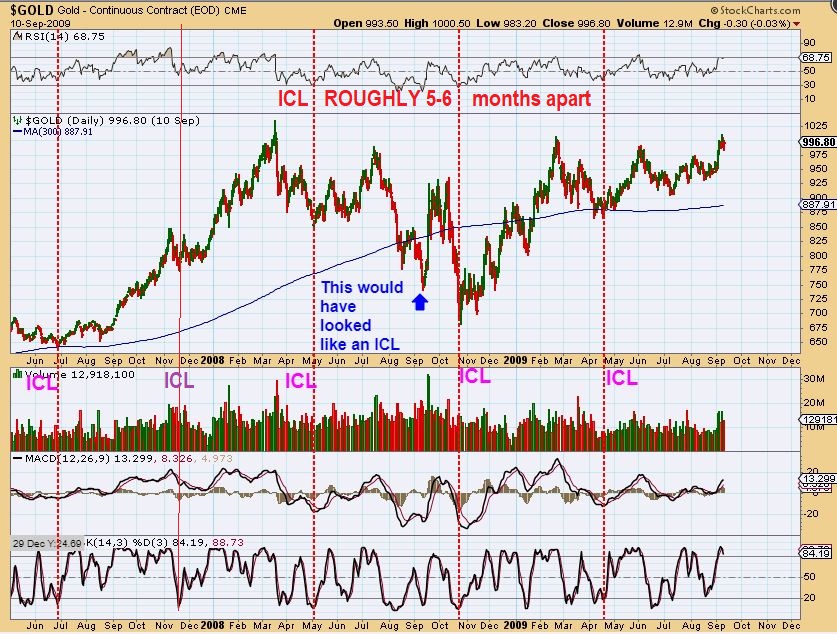
GOLD DAILY 2008 – We expect ICLs just about every 5-6 Months, and this chart shows that that was reliable, but the DEPTH of the drop is an unknown with cycles. Cycles help us with ‘timing’ the lows. ALSO NOTICE the Blue arrow. THAT looked like an ICL, yet even after that BIG ramp up, but something happened and it made a new final low. That final drop didn’t matter in the long run, it made new highs, but stops would have locked in gains from that bounce.
.
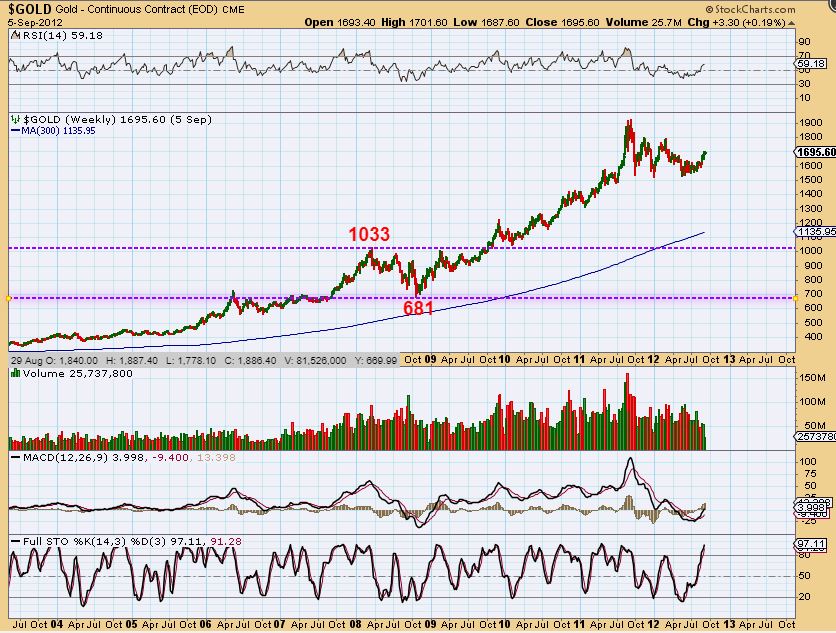
GOLD WEEKLY 2008 Financial Crisis – So the drop was Big in 2008, and Gold lost almost 40%! Even with that kind of sell off it eventually went on to make a solid continuation of the Bull Run though, and this is where we can hope to make some solid money going forward. If Gold & The Miners continue higher after this ICL, we can watch the Miners double, triple, and so on all over again. 2008 was a Temporary Crisis that ran its course with bank collapses and bail outs. This crisis should end too, and …
.
This virus crisis should end too, and even if this ‘tops’ the general markets, MINERS are making good money with low Oil prices and Gold sales at Higher prices. We may actually see a rotation of Funds out of the General markets and into the Miners. It does not take much money to push these Miners around, as you will see ( and inflows of money can push them much higher too) .
/
FROM FRIDAYS REPORT: TO PUT THIS DROP INTO PERSPECTIVE
.
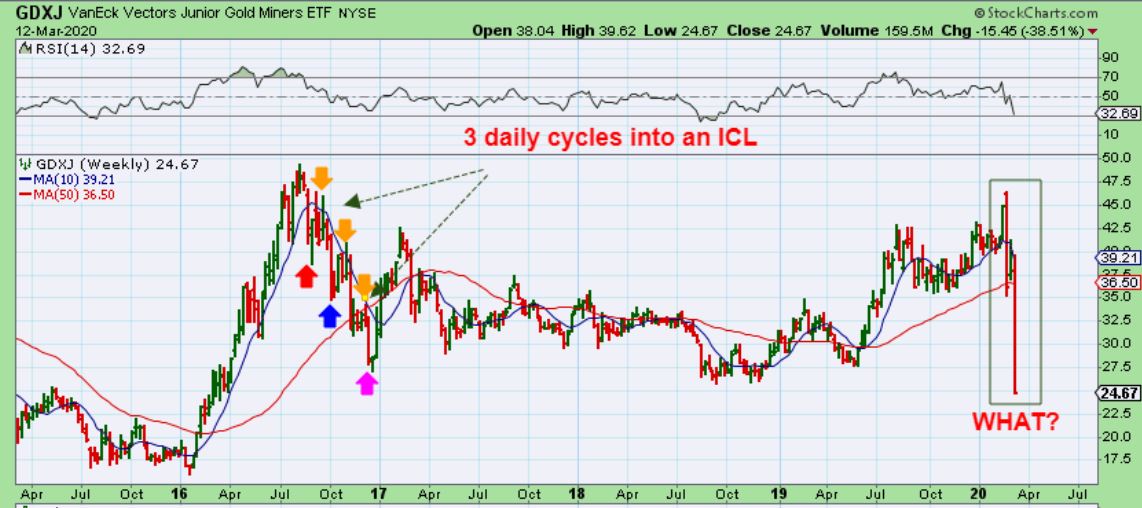
GDXJ WEEKLY – In the 2016 sell off into an ICL, we can even see 3 entire daily cycles roll over on the weekly chart into the ICL ( lows). Look what we just did in basically 2 days of panic selling. Are you kidding me??
.
1. Did we just flush down into an ICL, with ICL Type selling happening all at once? Maybe.
2. Do we need another daily cycle while Gold sells off? Maybe.
3. Will Miners bottom first as Gold drops into its lows? I think that is Most likely. This massive selling may get a bounce & double bottom, but we will need to take it step by step.
.
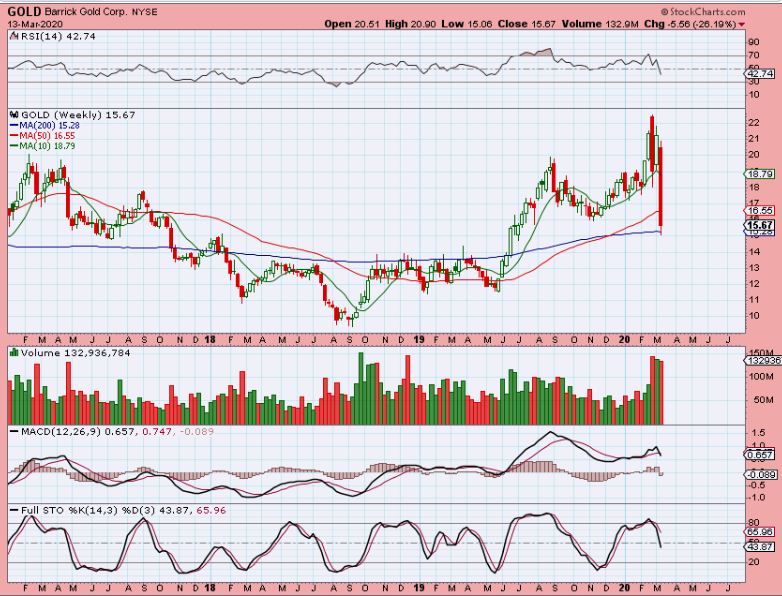
BARRICK – And I just want to stress that even miners with good fundamentals were cashed in to pay of Margin Calls or offset losses. BARRICK lost about 1/2 of the gains from 2018 ICL to now. So stops really are important.
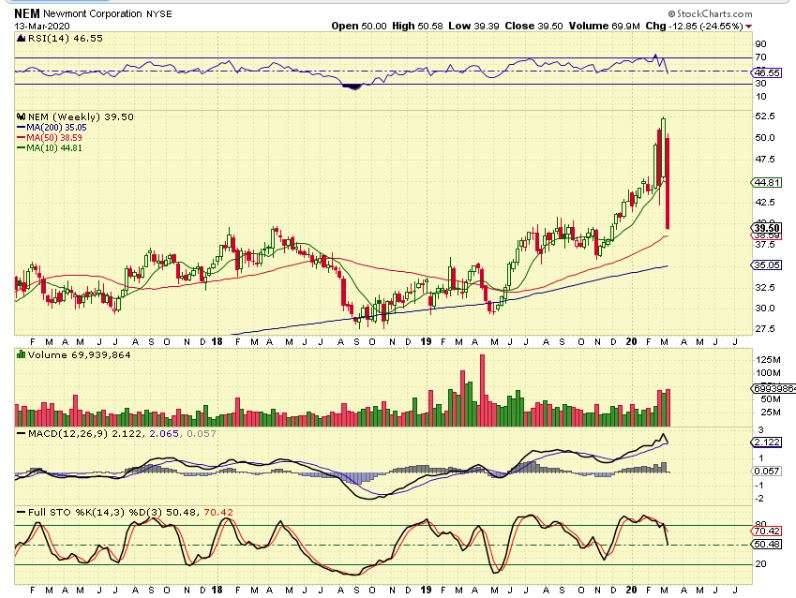
NEM – And Newmont dropped 25% last week. So stops really are important to protect funds.
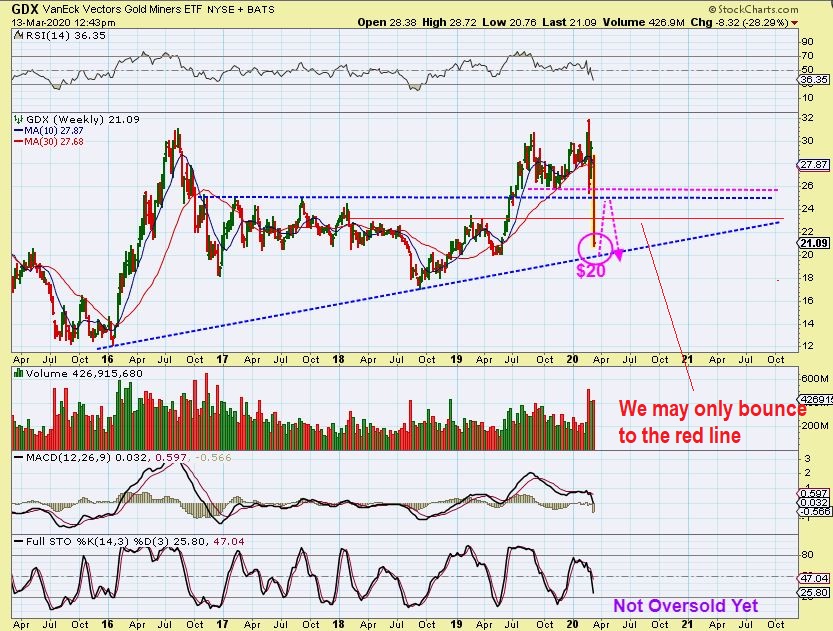
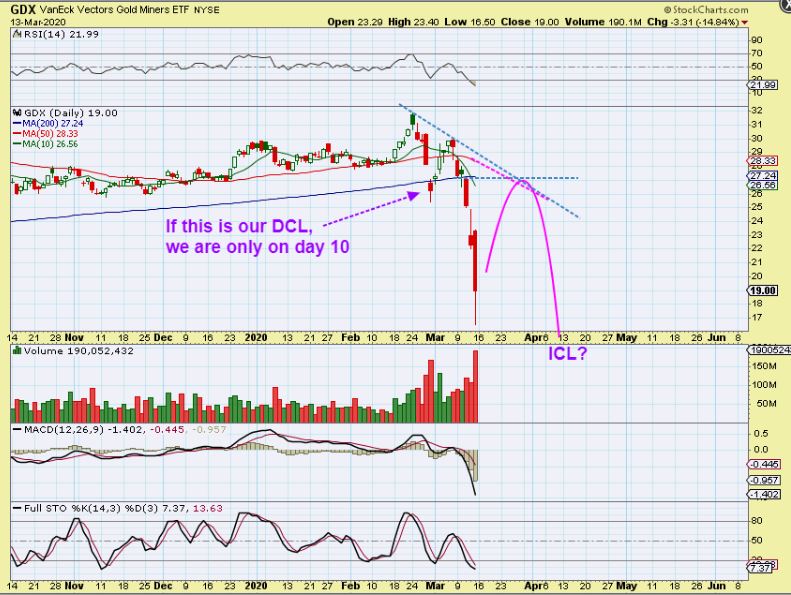
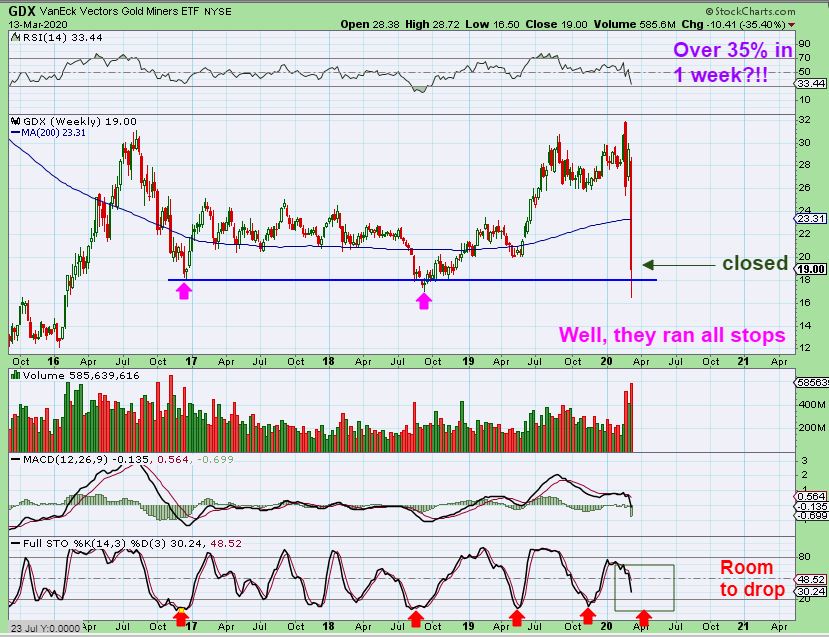
GDX WEEKLY – GDX bounced into the close, but I grabbed this to point out various levels of Support ( the $20), and then a bounce to the Mid-point at $23 or maybe a good bounce to $25? Let me show you why I think we may bounce & drop again…
.
GDX DAILY – This crash can bounce, but if I go by that dcl in February? Then we are only on day 10, so a bounce to back test moving averages could happen and then a double bottom low with an undercut may be the ICL. I CANNOT know this for sure, but this set up does seem possible if that was the dcl in February. A flush out capitulation low, that retests later. If that is how we get an ICL, THAT WOULD BE THE BEST BUY.
GDX WEEKLY – Plus all of the stops were run and it bounced. A 35% drop in 1 week is really unheard of, but this was an anomaly for sure. So the ABOVE idea of an ICL is a favorable one – with the stops run and now a bounce, and then a double bottom ICL. NEXT I will show you am UGLY ONE.
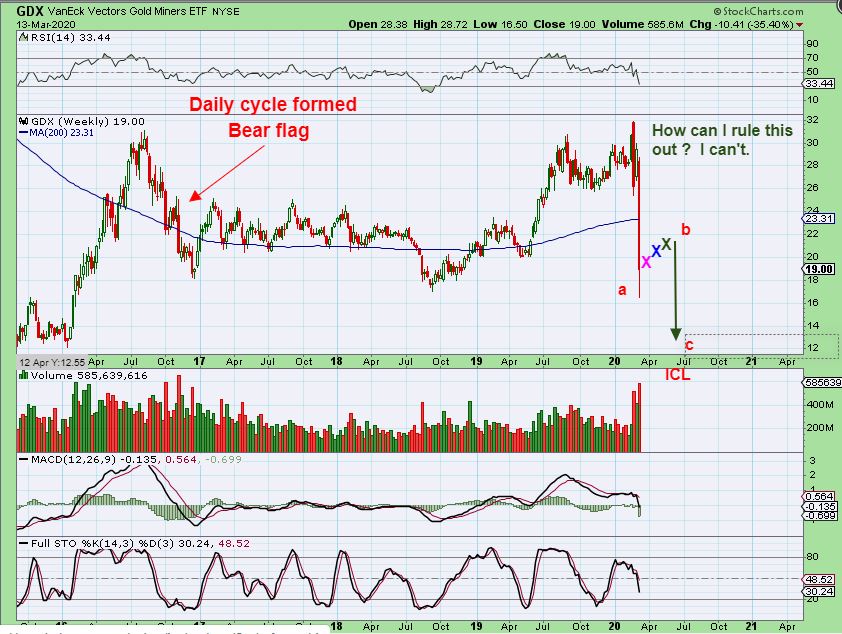
GDX WEEKLY – I can also picture a bear flag bounce and drop to 2016 lows 🙁
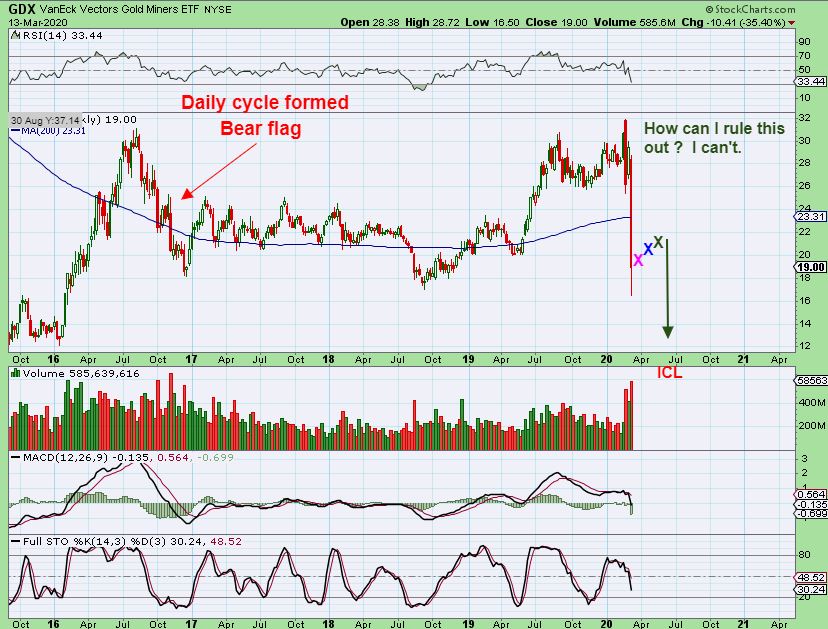
GDX WEEKLY -It would be an a-b-c drop, and an absolute scream of a buy, but horrible for anyone that didn’t sell. Buy & Hold traders that added all the way up are already at big losses from those higher purchases. This would crush them, and I can’t rule it out, so CONTINUE TO USE STOPS.
.
THE MILLION $$ QUESTION:
“IS THE BULL RUN IN MINERS NOW DEAD??”
.
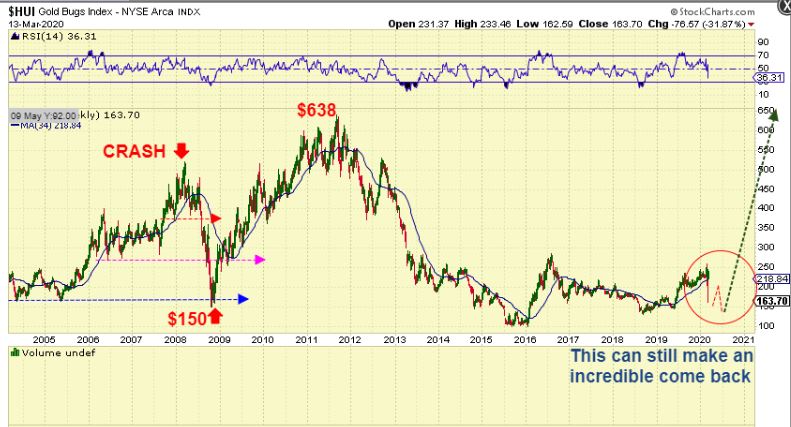
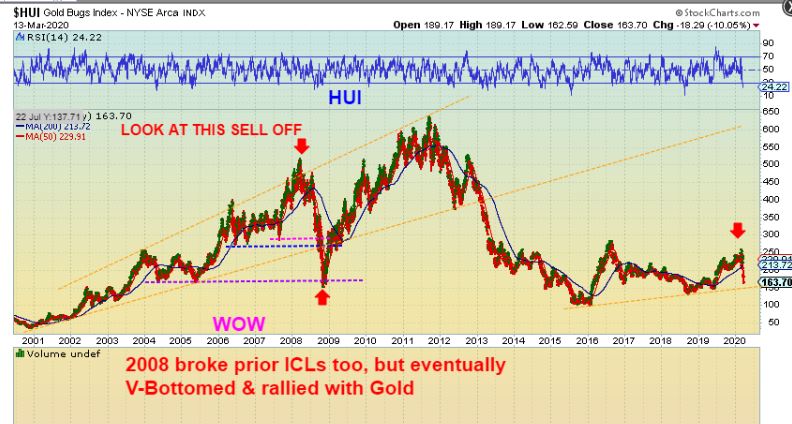
HUI WEEKLY – Look at the drop in the 2008 Financial crisis.
1. 2008 was during the Miners Bull run 2000-2011
2. It crashed below many prior ICLs so it was ‘Broken’ and UGLY
3. It V-Bottomed & ran back to new highs within a year, after the fear & liquidation ended.
4. The current drop is less than that one so far, so even if we get my a-b-c drop, it is not TOO broken.
.
NOW LOOK AT THIS AGAIN: HUI BROKE MANY PRIOR ICLS, BUT THEN RALLIED FROM NEAR 2008 lows at $150 to $650. BOOM, great gains were made! So there is hope of a Bull coming out of the ashes in Miners.
I obviously do not have enough time to show you Everything that I found or looked up this weekend, but I do feel that this report offers plenty of guidance in these uncharted waters to give us a reasonable outlook. I have reviewed past crashed and their recoveries, and also past crashes and their follow through drop into the bear market sell offs. From here, I will take it step by step along the way like I always do.
As you can see, this kind of sell off is a rare occasion, but these things do happen in the markets every so often. In the general markets, it may be a top to the Bull Run, so we will proceed with caution. In the past for the Miners, it acts as a cleansing process, it purges the markets of excess and clears bullish sentiment. We saw the HUI crash through many ICLSs in the 2008 Crisis, and yet rally hundreds of % points higher. Think about this too: When you see a devastating storm hit a town on the news, like a tornado, flooding, earthquakes, etc . The people do suffer some losses, but hopefully they found some protection from that storm (stops acted like a storm shelter of sorts). What about those caught off guard when a storm strikes or were just unable to fully protect their valuables? We’ve also seen a damaged city or village begin to pick up the pieces after the storm. Slowly but surely, the recovery work can start to repair damage and make that town look normal again. The repair work may be slow at first, and the repair work may be slow in the miners too, but over time the damaged neighborhood can slowly be restored. Accounts that suffered losses may be able to rebuild with a resumption of the Bull Run in Miners, but it may take some patience to continue to allow this thing to play out. I feel that we could still have to finish this daily cycle or even have 1 more to get that final ICL, only time will tell. It could be a slight stop run of the current low. We’ll take it a step at a time.
.
In that 2008 crash, I racked up losses in Miners and I still remember that pit in my stomach. I was upset that I didn’t use stops on everything and didn’t see that big of a drop coming ( I thought Precious Metals were a safe haven in a financial crisis). There were articles of panic everywhere. And then, eventually the Crisis passed and with a resumption of that bull run in Miners. My losses were erased and my gains were very good. Remember that the HUI ran from roughly $150 to $650 after a Crash and many Miners doubled, tripled, etc again. It was a steep sell off in everything this week, and I hope that you are still able to enjoy the weekend, despite the selling & spreading of the virus throughout this beautiful planet. Be safe and heed the warnings & precautions whenever possible, and enjoy the truly precious things in your life- your family, friends, and loved ones!
.
~ALEX
.
.
THE BIG CONCLUSION : TAKE COURAGE, ALL HOPE IS NOT LOST. COMPARE THE 2008 CRASH WITH TODAYS. HUI SOLD OFF VICIOUSLY IN 2008. IT BROKE MANY PAST ICL LEVELS & WAS A BROKEN CHART. AFTER THE CRISIS IT DOUBLED, TRIPLED, ETC. THOUGH CRACKS HAVE NOW APPEARED, LET HOPE PREVAIL 🙂