Tuesday March 24th
I’ll start with the SPX for Friday and the thoughts at that time…
.
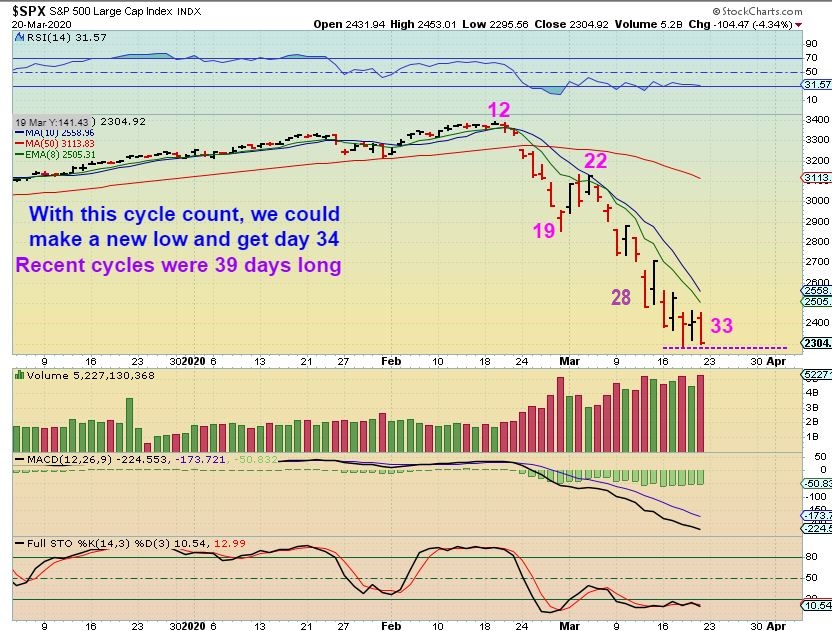
SPX – Wednesday low was almost broken, so on Friday, si that is likley day 33. A break of that 10sma is the safest way to play a long position.
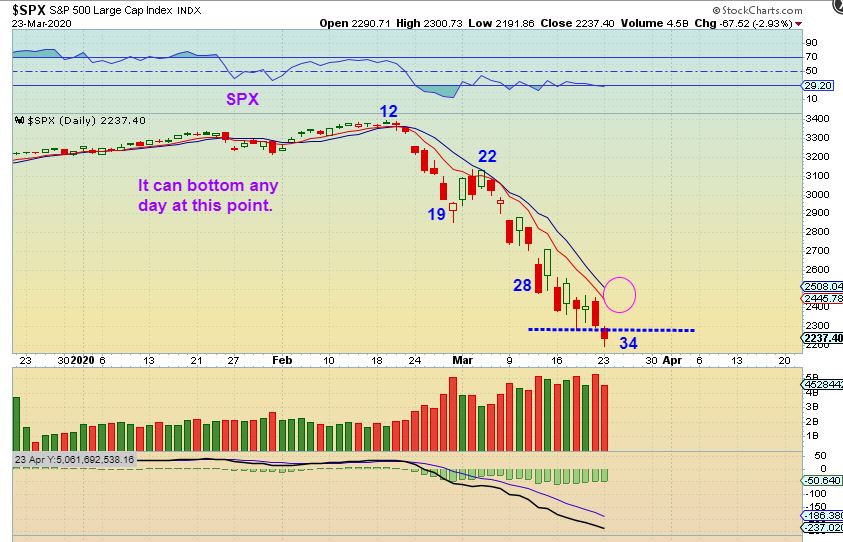
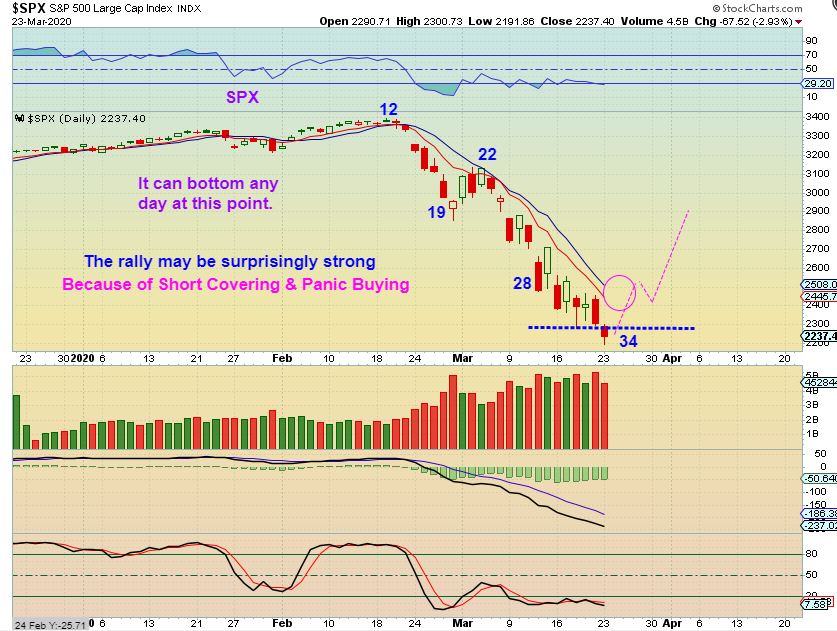
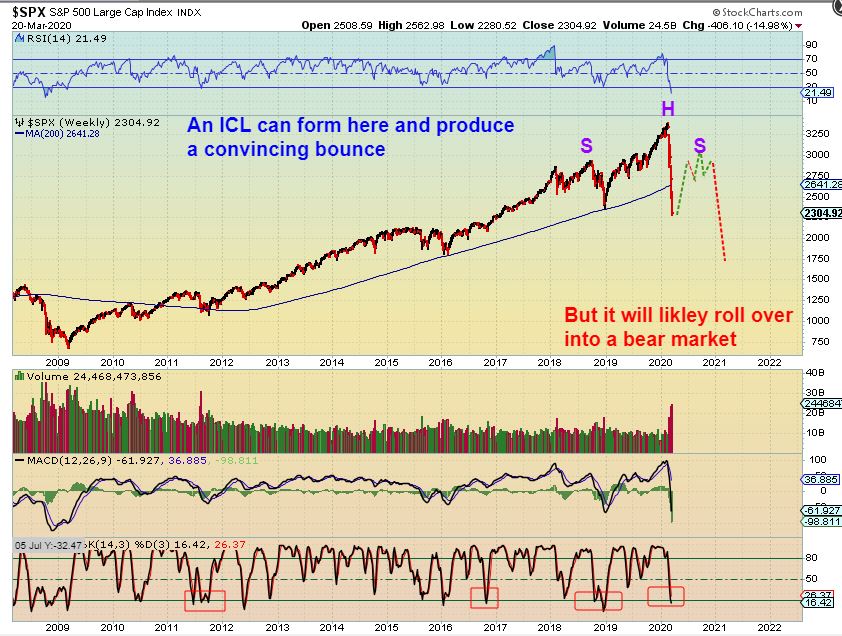
SPX – Monday we did break the lows, so this is day 34. We are within the timing for a dcl, a break above ( & Close above) the 10sma adds conviction to take a trade. It is a buy signal with a stop under the lows.
SPX – Though it looks weak now, I have seen many of these get caught up in a period of short covering & panic buying, and the rally is much better than people think it can be. Bear Market Rallies can be straight up & deceivingly bullish looking. Many underestimate them.
REMINDER FROM THE WEEKEND REPORT: SPX WEEKLY– My expectation is that we are entering a recession. As mentioned in past reports, many small businesses could go bankrupt under the current covid19 conditions. We can play the long side, but I’ll be ready to flip short after the bounce, looking for clues after we enter then 2nd daily cycle, if this is the ICL.
KEEP AN EYE ON AMD, MU, TSEM, CREE, and SOX – I think the semis are bottoming first.
,
FROM FRIDAYS REPORT FOR WTIC – OIL SLAMMED down 25% Wednesday. Thursday it pushed higher so watch the 8 ema & 10sma here too. I have mentioned the cycle counts and Oil USUALLY has 40 + days in a daily cycle, but I do see some Oil stocks making & Holding higher lows. Oil dropped Friday, and is back near the lows, similar to the SPX. They may bottom at the same time.
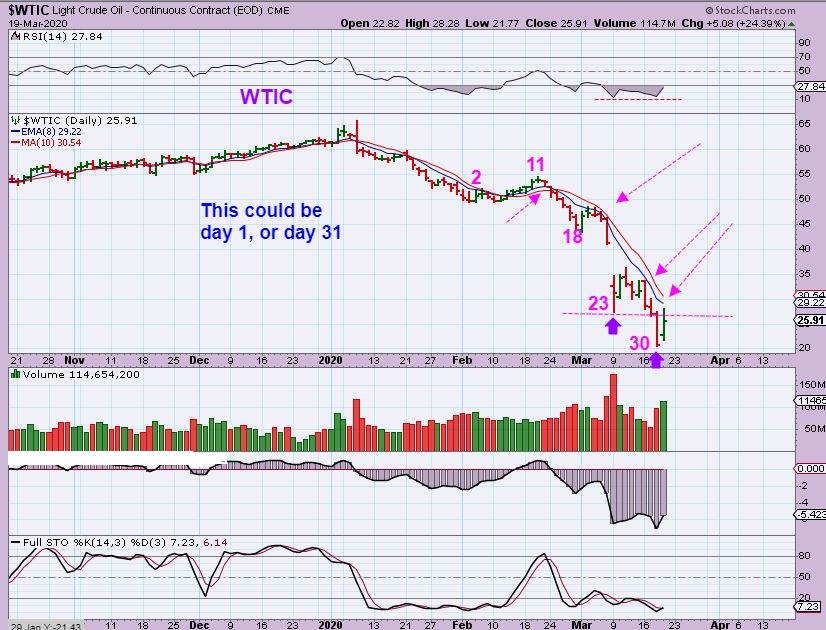
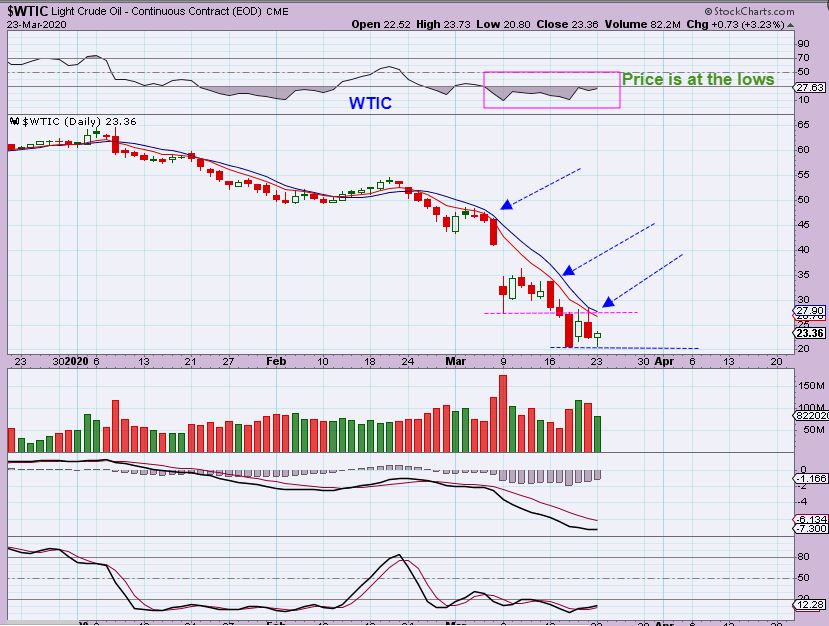
WTIC Monday – Oil actually did NOT break the lows, but it was close. This is day 33 or day 3, because while price is at the lows again, the RSI is showing strength.
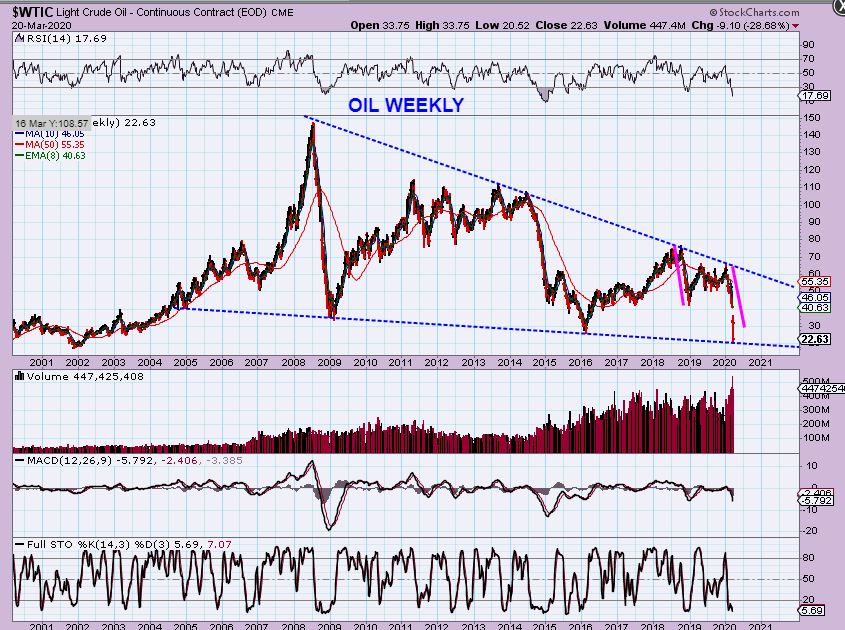
WTIC WEEKLY REMINDER – I found this possible lower support level, so Oil could eventually bounce back to $50 Oil over time. It may be a choppy bottoming process first however.
.
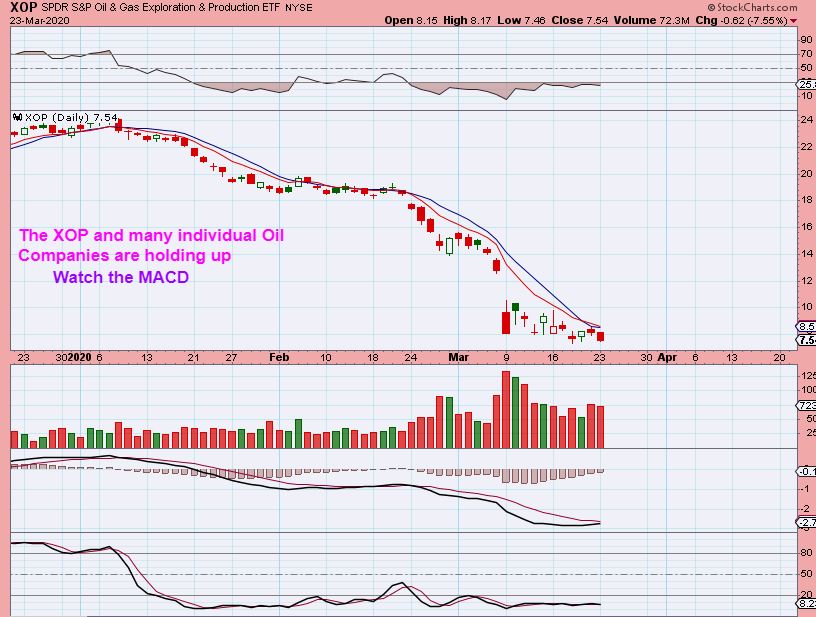
XOP– These Oil Stocks are showing some resistance to selling pressure.
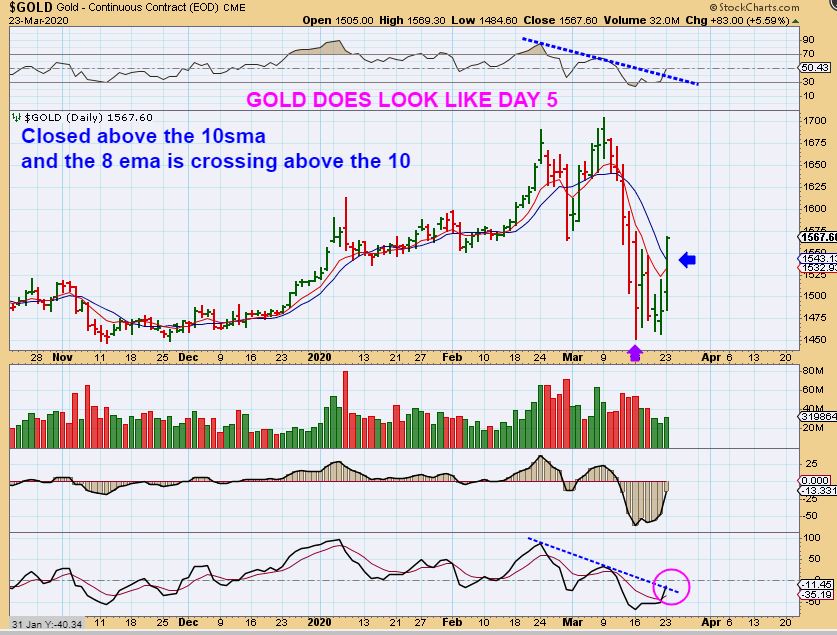
GOLD – This was a big day and it pushed Gold to close above that 10sma. THAT should be a dcl in place. We should be able to expect Miners to move higher now too.
.
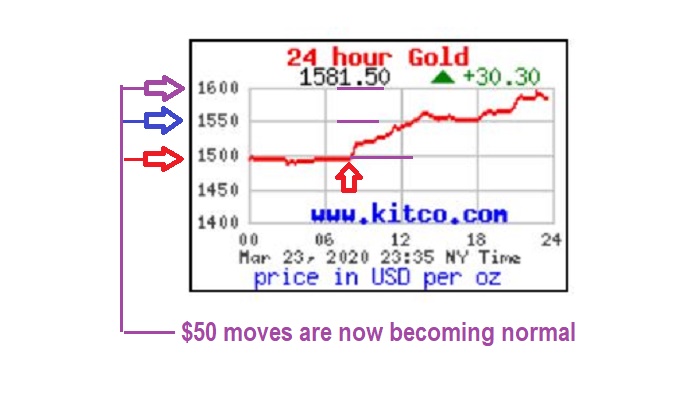
GOLD IS NOW MAKING $30- $50 MOVES AS PART OF NORMAL ACTION, and even $100 moves can take place in 24 hrs. Gold ran from $1482 to $1580 Sunday night to Monday night.
m
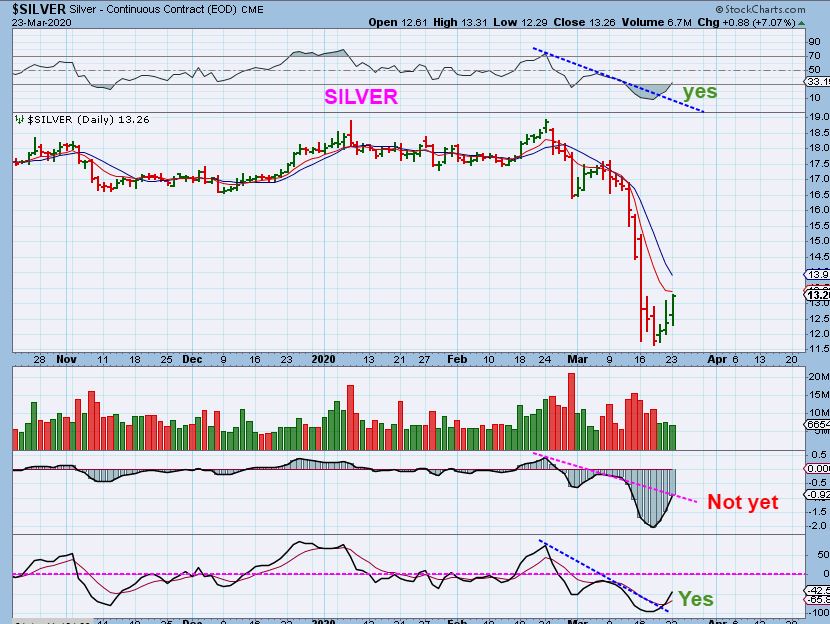
SILVER – Silver could be on day 3, but it hasn’t made it to the 10sma yet. That is right under $14. Read the chart for signs of strength.
.
SILVER – I posted this during the day, as Silver broke out from an inverse H&S & Several Silver Miners moved up steadily.
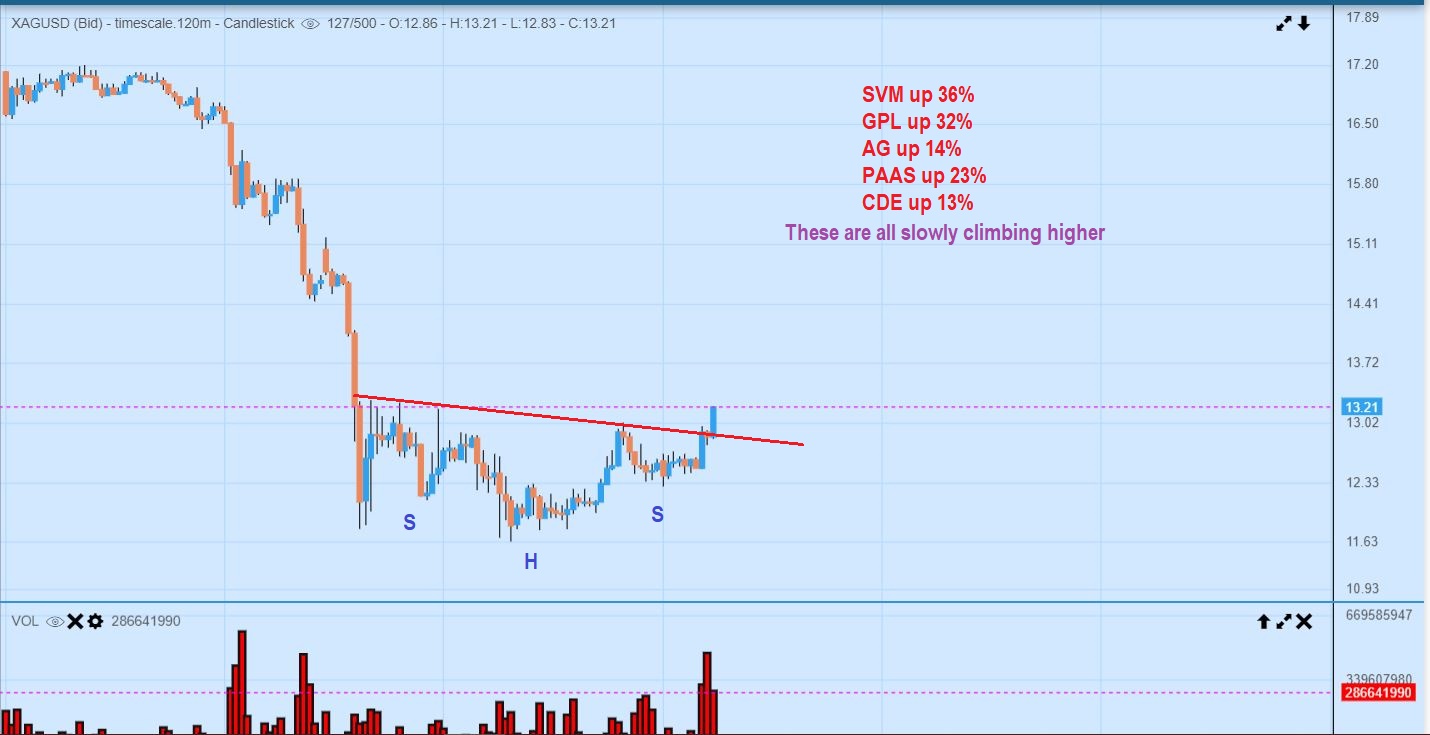
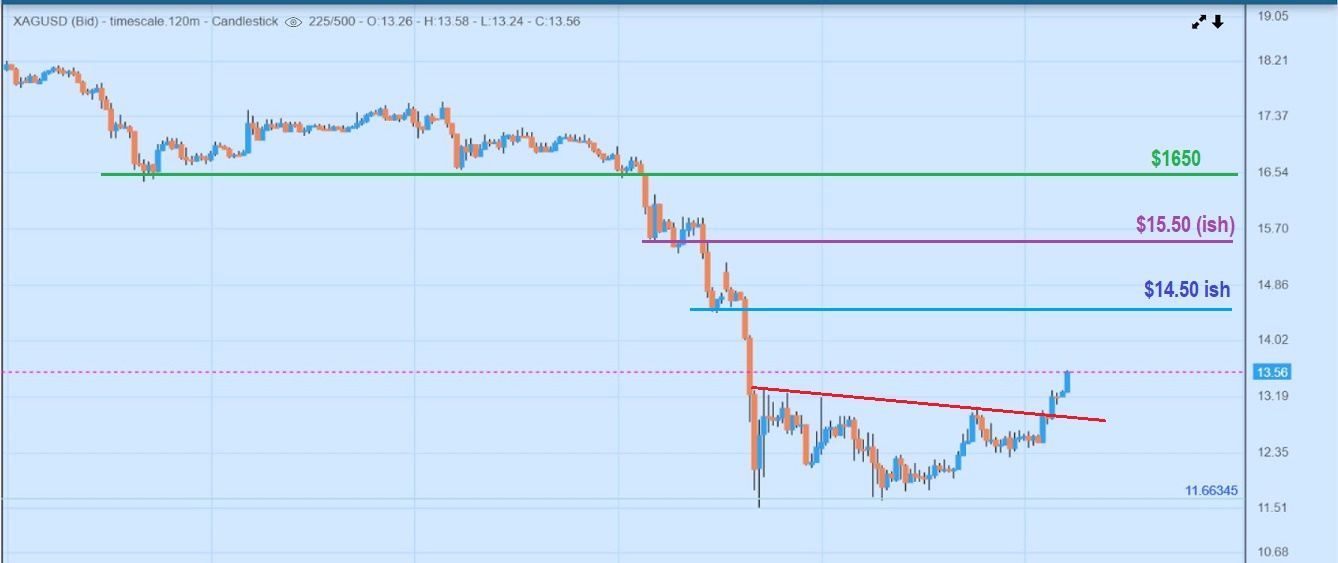
SILVER – We see follow though after the close, and I drew in some overhead resistance points, just in case we get a run higher.
.
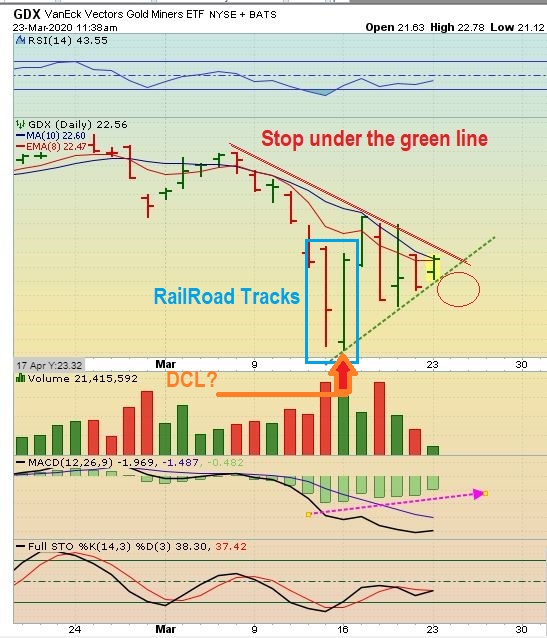
During the morning trading I posted this chart as a guide for traders that wanted to buy GDX or GDXJ, even though we still have the choppiness and risk.
/
GDX – Taking note of the triangle, one could start a position by entering with a stop right below todays lows, or the green dotted line as price rises. A break out & Close above the 10sma would be a good first step to a run higher.
.
GDX & GDXJ pushed above that 10sma , but then closed below it by the end of the day, so we have a swing low with the R.R.Tracks, but still no confirmation. Gold did close above the 10sma, so it may be disappointing that GDX didn’t do the same, but it may follow Gold Tuesday. Also GDX was still up almost 7%, so it was a nice gain.
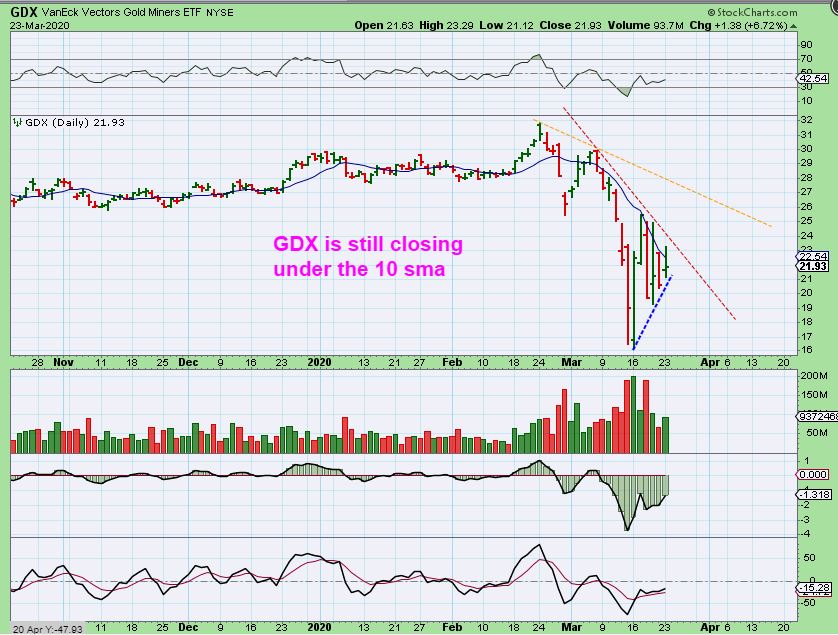
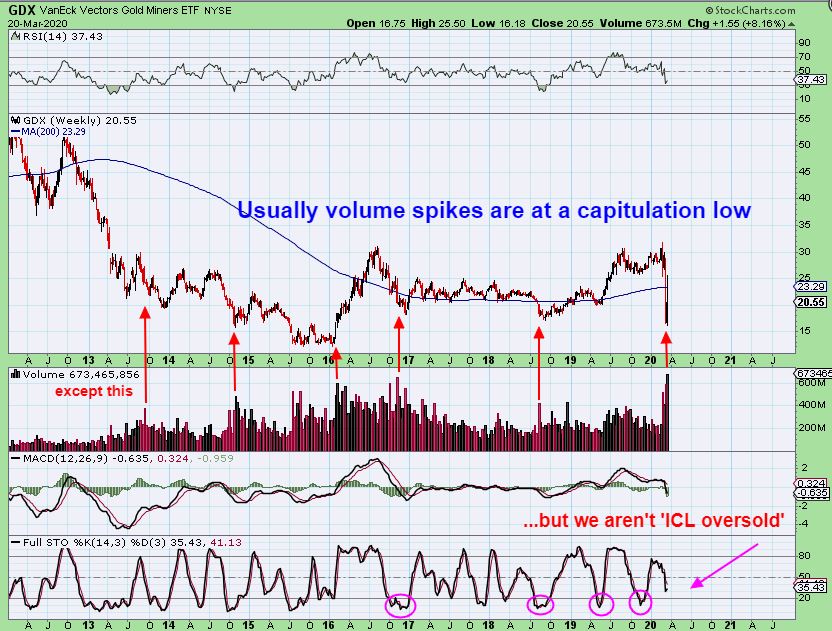
FROM THE WEEKEND REPORT: GDX – Miners crashed down over the past couple of weeks and broke the healthy chart patterns. We do have a high volume slam down, and that could be an indication of a low. I have pointed out past capitulation high volume lows as an example, and a Best Case Scenario would be an early ICL due to the sharpness & extremeness of the sell off. We could still see a quick drop to a new low and reversal back higher next week too.
.
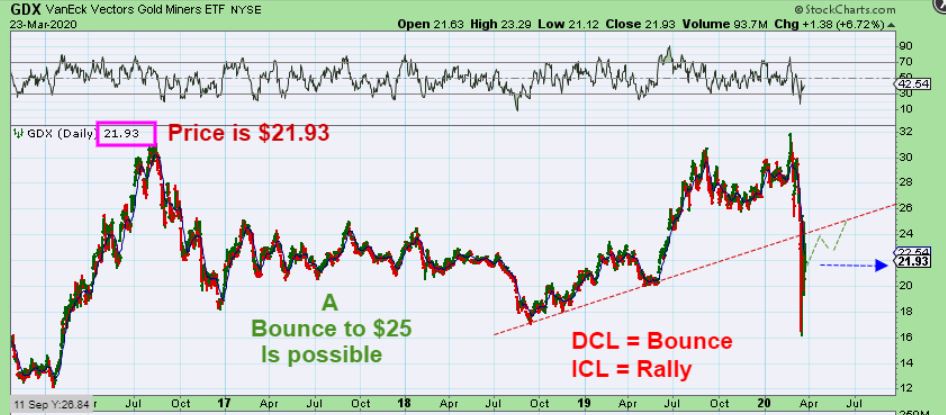
GDX – This is an example of a weaker bounce. IGNORE THE ‘timing’, we would get there WAY before July, I often just have to draw it so you could see it on the chart. If this is an ICL, GDX would probably break right through that red line as a recovery.
.
So Mondays trading gets us another day closer to finding a DCL in all sectors. It also may be an ICL, but we would need time to pass to be able to identify it as an ICL or just a dcl bounce. We always take things step – by – step, but GOLD did close above the 10 sma. That’s an important step for the precious metals sector. Lets see what Tuesday brings our way, enjoy your Tuesday trading!
.
~ALEX
.
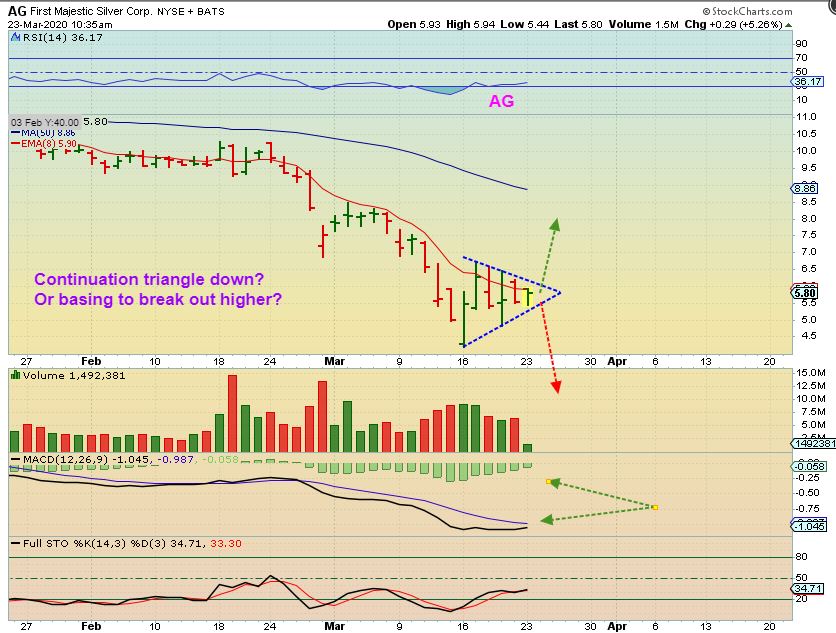
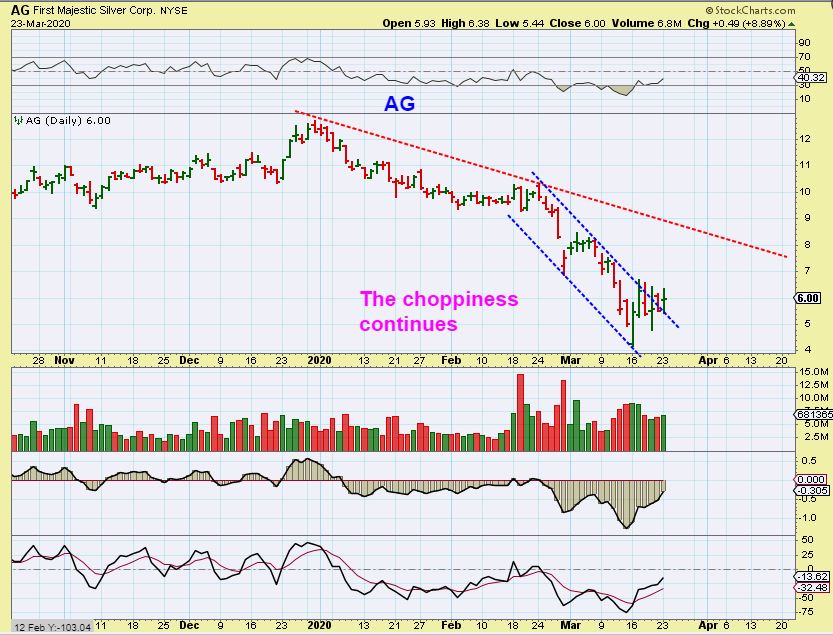
AG 10:30 a.m. Eastern – I used the same triangle after an hr of trading to show that AG ( I still own it) could be a reversal forming or a continuation pattern, so we look for a break one way or the other.
m
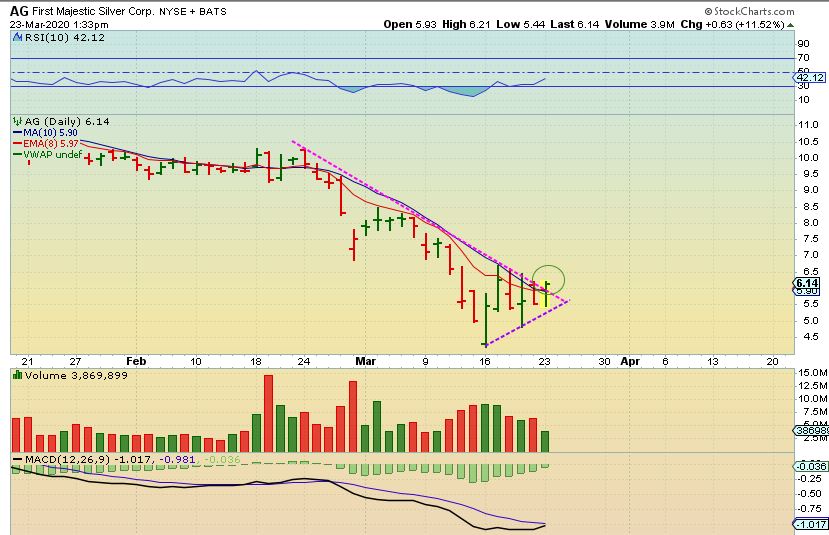
By midday AG was up 11% and seemed to be breaking out and the macd even moved higher from the morning chart.
.
AG CLOSE AG sold off. I do still have it breaking above a down trend channel, so I’m hoping to get some more upside follow through Tuesday, If Silver continues to climb. These are really still near the lows, so waiting for a close above the 10sma is fine.
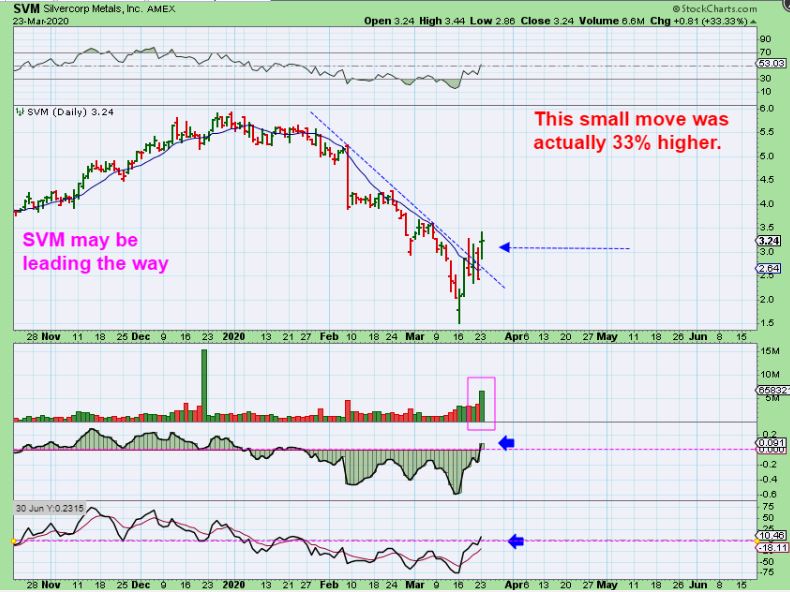
SVM was up over 40% at one point, so the moves are BIG. You can that this chop has happened all last week too, so really that could be a 20% up day and a 20% down day. Not an easy ride. That said …
1. I saw almost double the daily volume Monday
2. A down trend line is broken
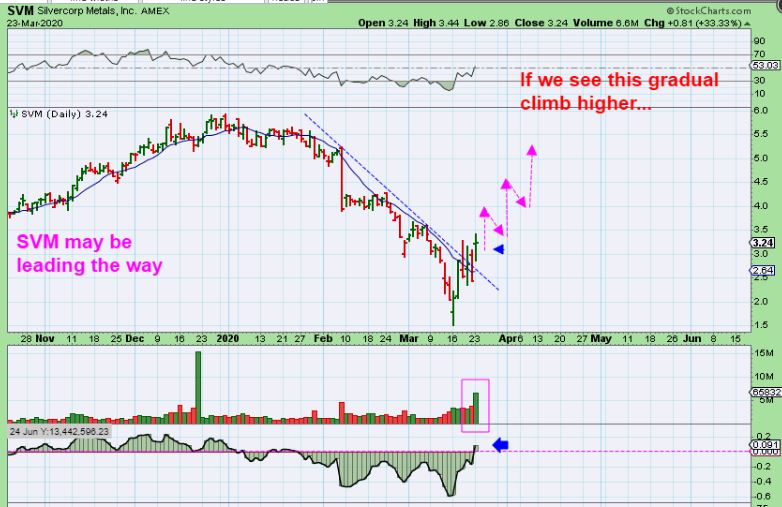
3. The indicators are showing bullishness, so this choppiness may be a bottoming process.
Even if this choppy action gradually allowed SVM to get back to the $5-$5.50 area …
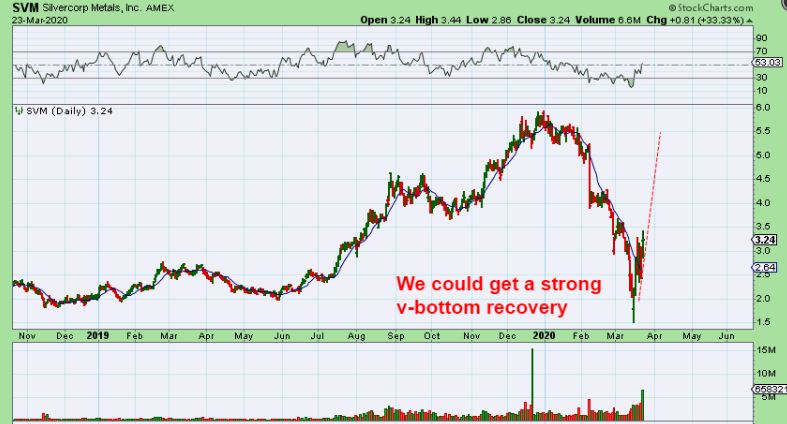
From a distance SVM may look like a V-Bottom, because it already looks to be starting out that way. We’ll see what Tuesday brings our way.
.
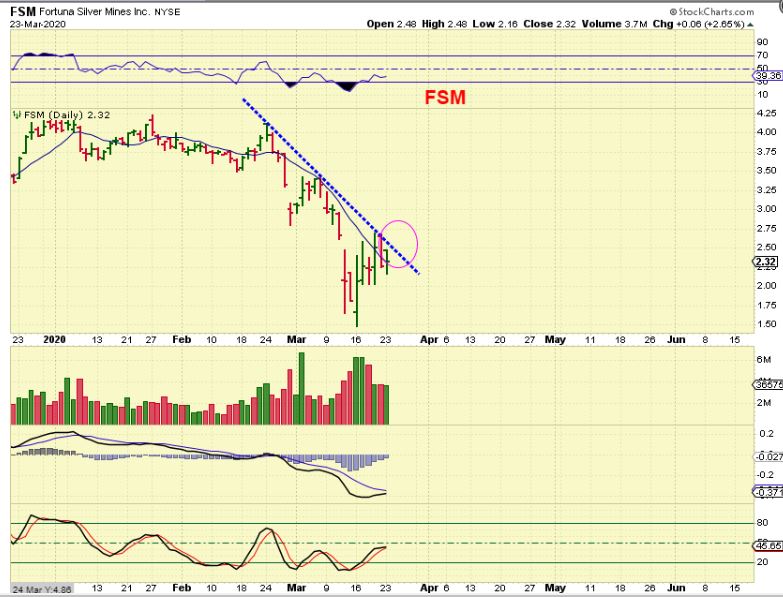
FSM – So you can make a list of what may be ‘laggards’, ones that are still below the trend line & 10sma, and if we do get follow through in the entire sector, you can enter on a break out ( Magenta circle). I will cover more stock picks once we get some confirmation that a low is in place and the Big Swings chop a bit less wildly.