March 7th Weekend Report
Another volatile week in the markets, but they are actually still playing out ‘as expected’ with a bounce in the General Markets that could be shorted. Oil was expected to go lower and it certainly has. We had a dcl in the Precious Metals, so they did move higher, but they are a very tricky set up (as you will see). Let’s get right to the market review and discuss what we’ve seen and what I expect going forward.
.
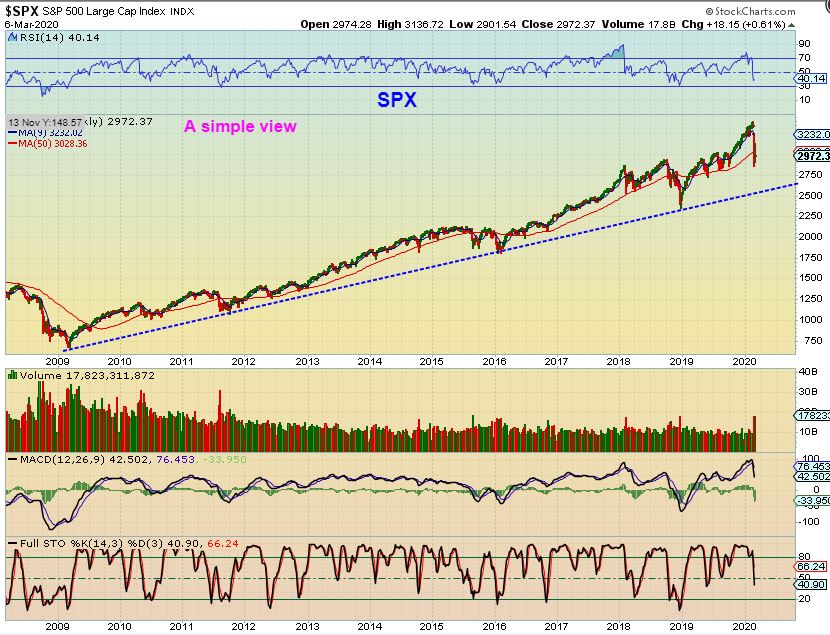
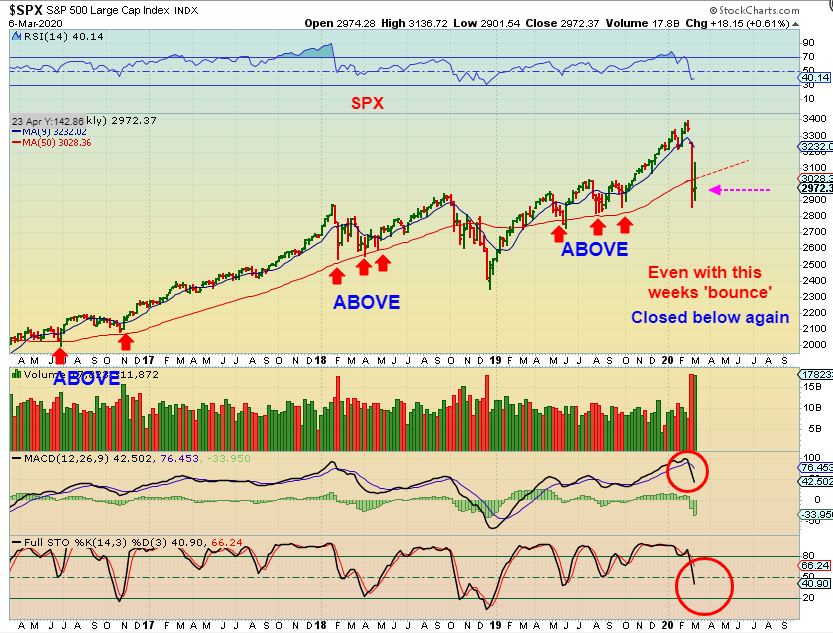
SPX WEEKLY – Let’s start with this very ‘simple view‘. I’ve been calling for a drop into an ICL, and a drop at least to the blue line should be expected, and you can see that we are not there yet.
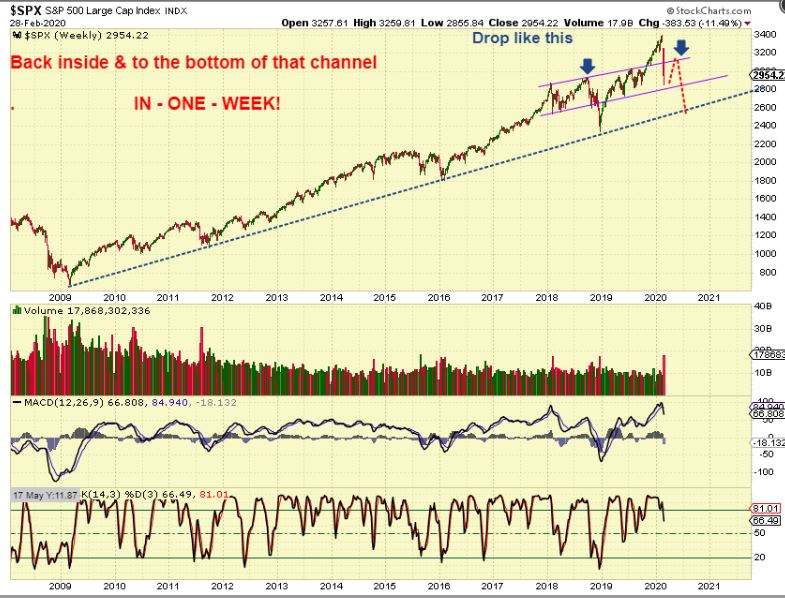
SPX WEEKLY – I drew this channel in a chart over a week ago, expecting the drop to end, we’d see a bounce & then a 2nd leg down.
.
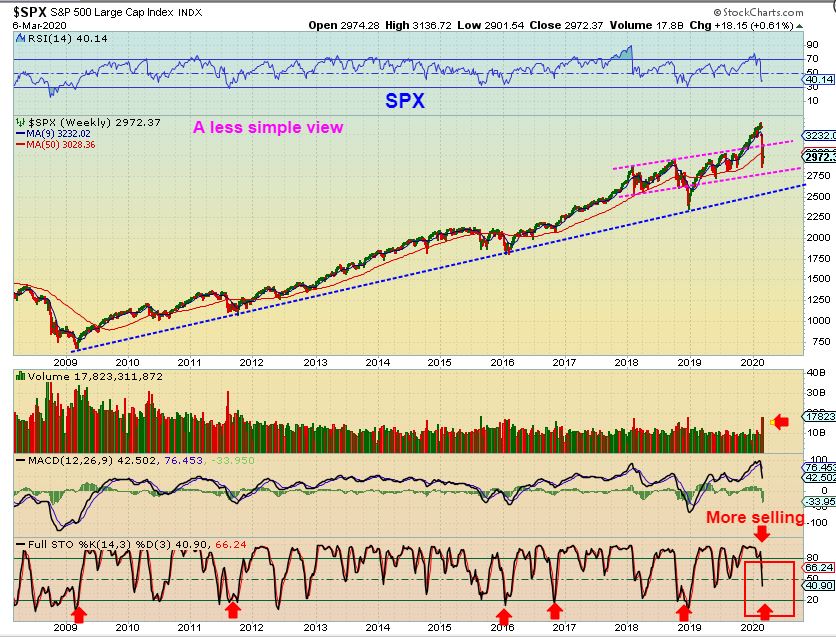
SPX WEEKLY – This week we bounced, and the next drop already looks to be starting. Volume spiked, there is still room to drop further. Now let’s zoom in.
,
SPX WEEKLY – Notice that prior deeper drops landed on the 50 week M.A., expcept for the deeper sell off in 2018. We sliced right through it on this recent drop, and we closed under it last week and this week (despite the bounce). I am still short here.
,
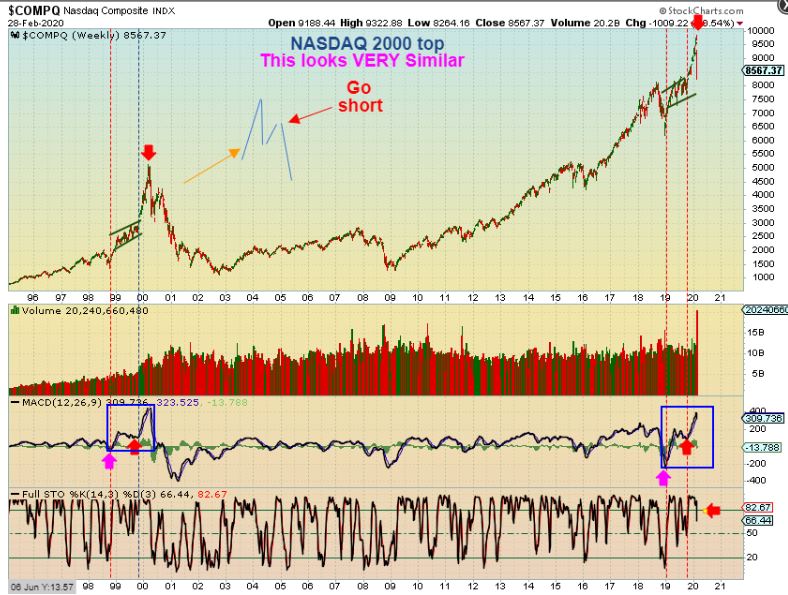
NASDAQ WEEKLY LAST WEEK – I posted this last weekend to point out that I would short the bounce, and this reminds me of the 2000 top. I shorted the bounce using SQQQ for the NASDAQ at the end of this week.
,
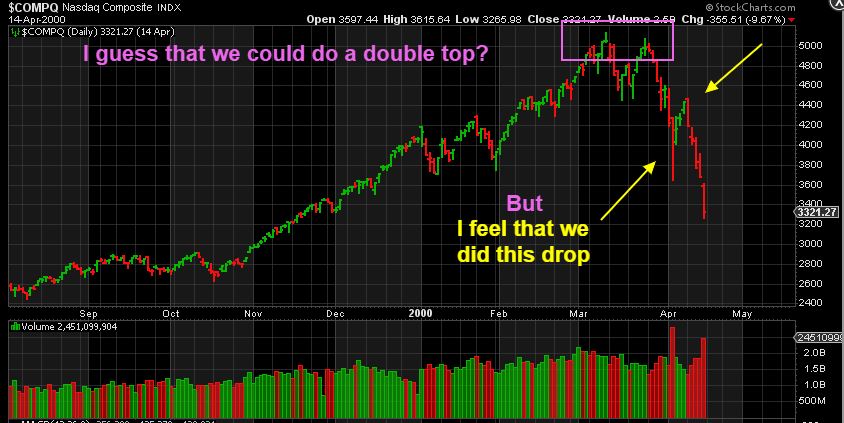
NASDAQ DAILY 2002 : As a reminder, I also POSTED THIS EARLIER THIS WEEK , YELLOW WORDS POINTING OUT THAT NAZ ONLY HAD A 3-4 DAY BOUNCE IN 2000. I am short the General Markets.
.
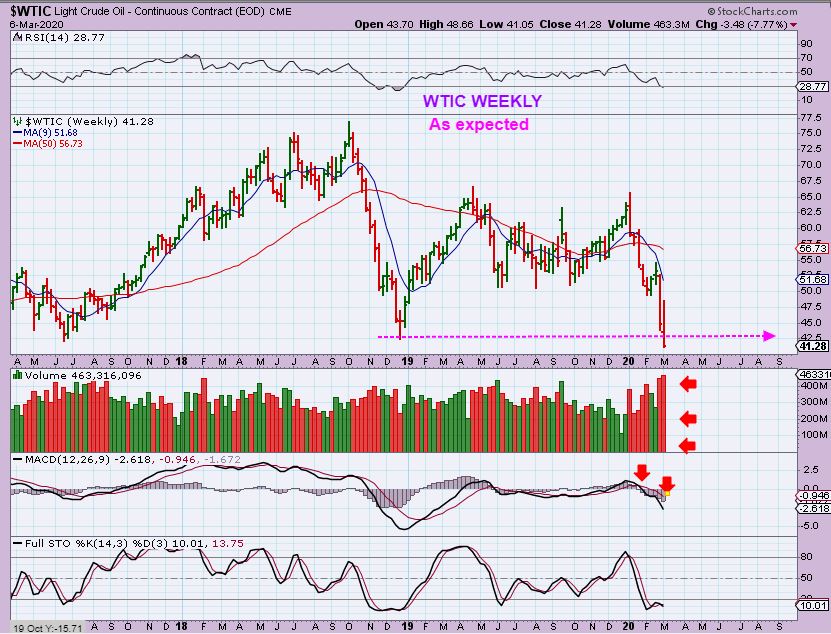
WTIC WEEKLY FEB 26 – Over a week ago I called for Oil to break down and drop to near $40 at first, and then a drop to prior lows is possible too. OIL IS WEAK.
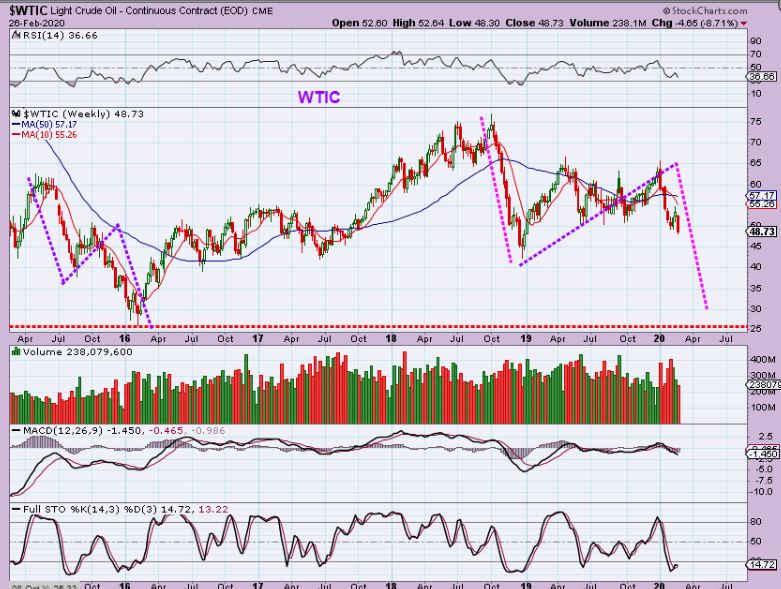
WTIC WEEKLY – Last week my first target area was reached with high volume & an accelerated drop.
,
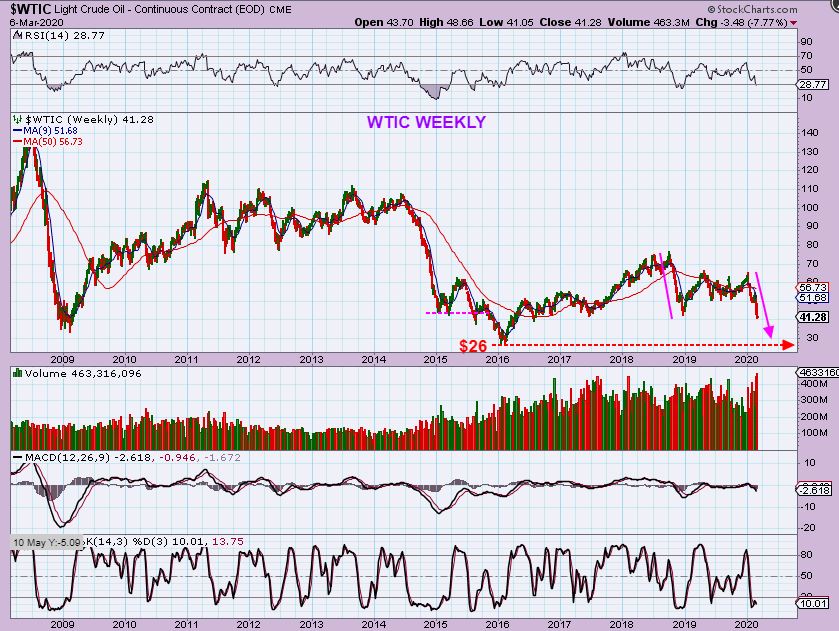
WTIC WEEKLY – Oil can bounce or chop around, similar to 2015 right above where I drew the red $26, but Oil actually still looks set up to drop to that 2016 target area ( $26, but it could stop short near $30), and that may just happen rather quickly. Why? As seen in the daily reports, this daily cycle has plenty of time left in it. Let me show you…
,
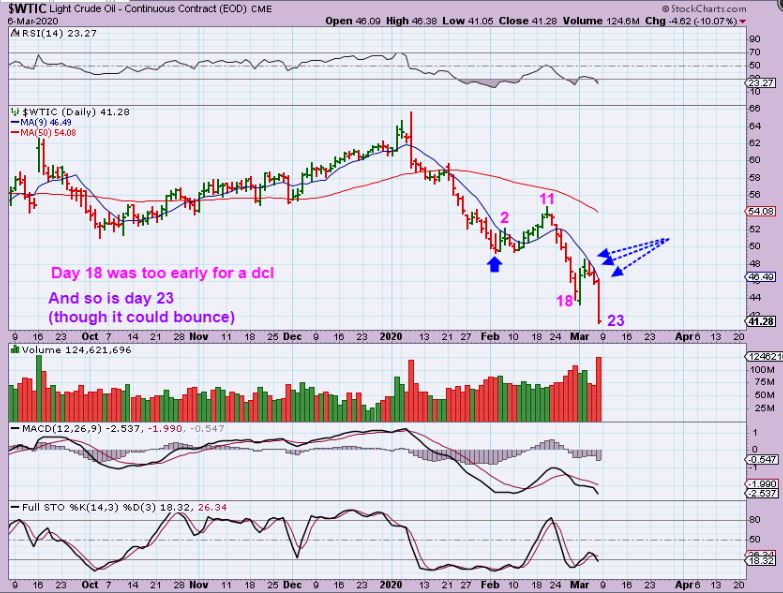
WTIC DAILY – It is only day 23, and Oil cannot get above that 10sma. I have been saying that Oil often does a daily cycle of 40-50 days. So this can bounce or chop like it did this week over to the 10 sma, , but it has weeks of time left for an even deeper drop.
,
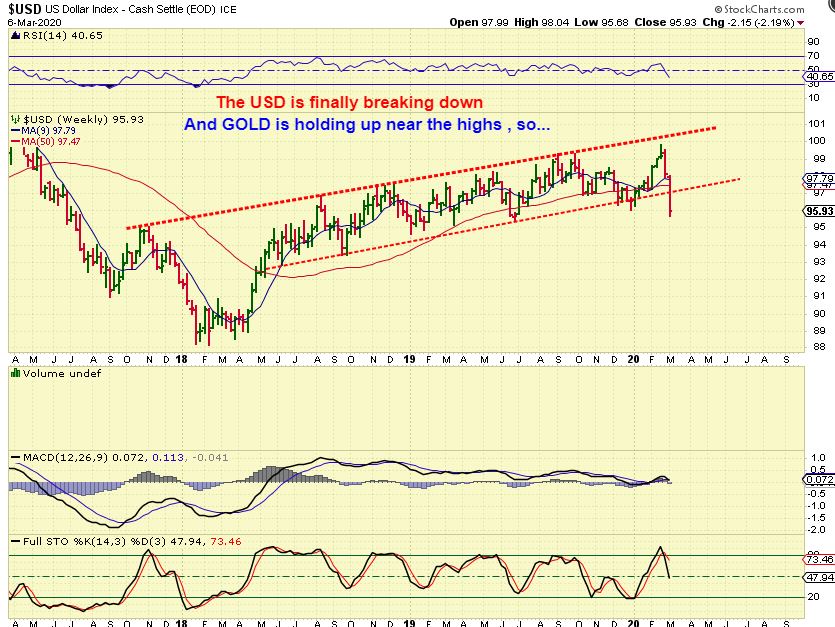
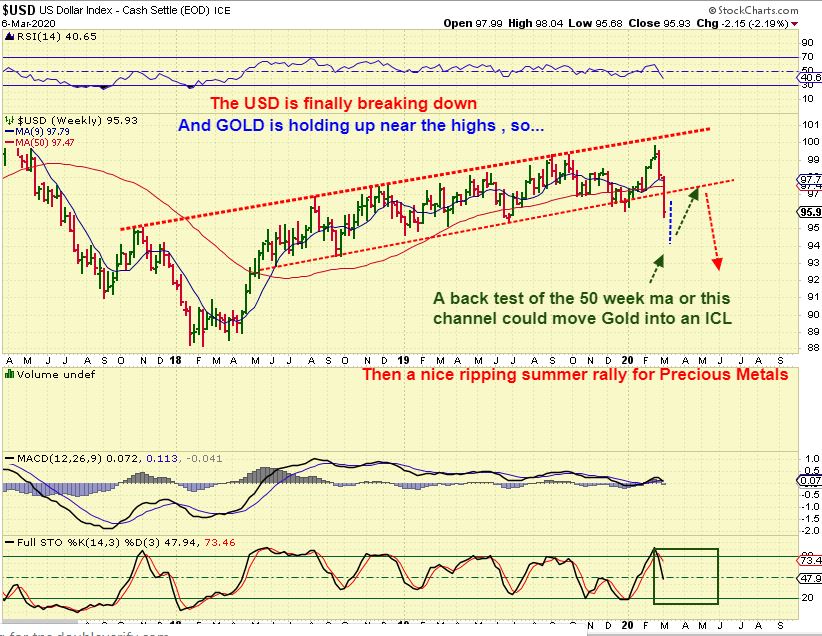
USD WEEKLY – The USD finally broke down, breaking below that slightly up sloping channel. Gold is up near the highs, but it is coming due for a dip relatively soon.
,
USD WEEKLY – We could see more downside followed by a gradual climb that back tests that channel. This could give us the eventual dip in Gold to an ICL.
,
NOTE: The last 3 dips into an ICL for GOLD have been choppy & frustrating time-wise, but at the same time they have been rather mild, as you will see.
.
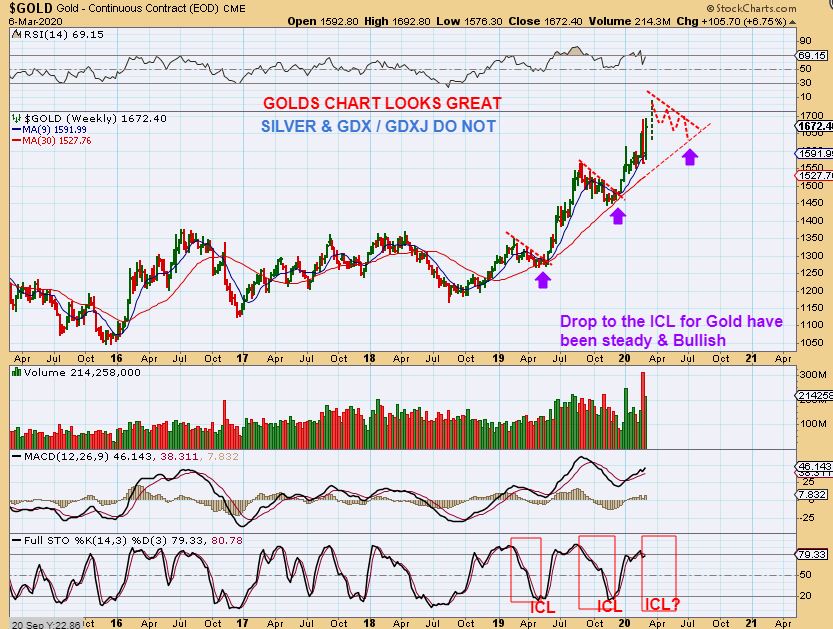
GOLD WEEKLY – Gold looks MUCH BETTER than Silver and the Miners. It is near the highs and as mentioned, coming due for a dip to an ICL, but it can continue higher first. I was expecting Gold to get to $1700+ before that dips start, and Friday was only day 5 of a new daily cycle. Even a L. T. (Left Translated) Daily cycle can peak on day 10? Or 12? Or 14? So we watch for a swing high to form & signal that dip.
,
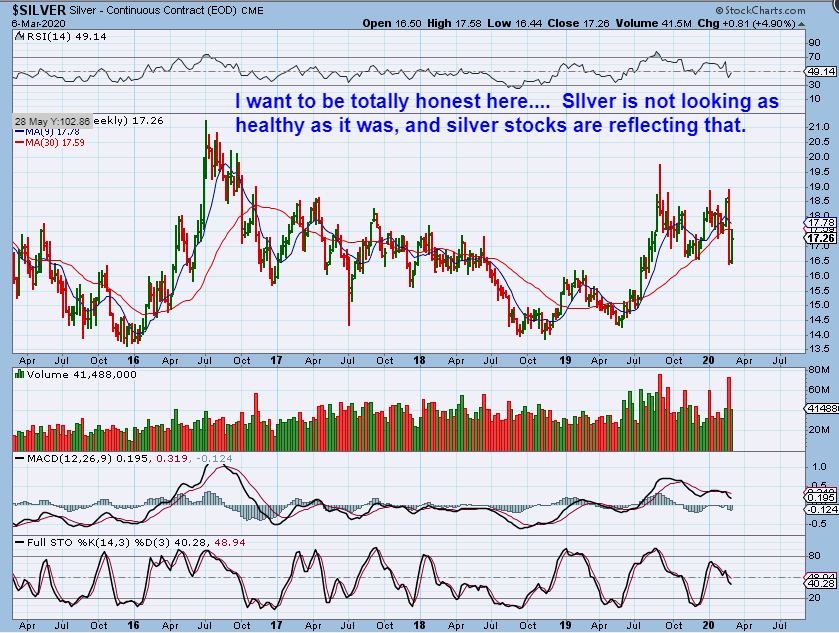
SILVER WEEKLY – With Gold at the highs, Silver does NOT look as pretty and many silver stocks are weak. Silver is actually still below the 30 week MA and that was a sharp drop 2 weeks ago…
,
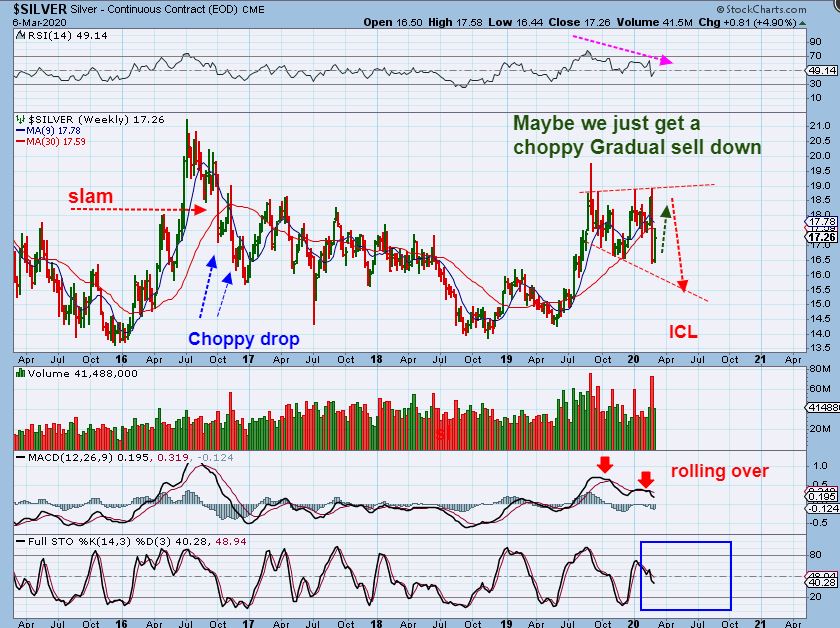
SILVER WEEKLY – The MACD is weak and the RSI has been choppy. Let’s face it- Silver itself has been Very Choppy and will likely remain that way. There is one thing that is outwardly confusing when I look at Silver vs Gold…
,
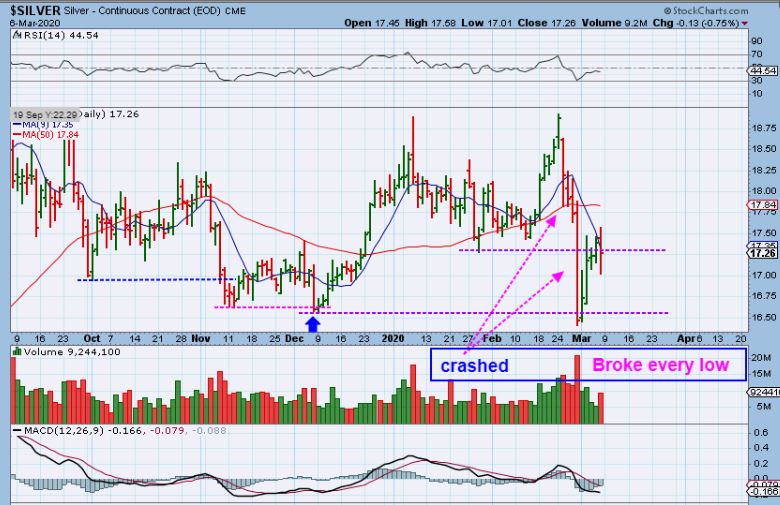
SILVER DAILY – With Gold at the highs, Silver crashed with the general Markets and broke right through all of the prior lows. Those lows go back to December, so it already broke what should have been an ICL? This is either a 1 time Big Flush down and a new ICL- or – Silver is very weak and will flush down again. At this point, we have no solid clues, but that was a drop that should not have happened with Gold at the highs, and it affected many Miners.
.
.
AT THE END OF THIS REPORT I WILL SHOW YOU ONE MORE VERY IMPORTANT IDEA TO CONSIDER WITH SILVER
.
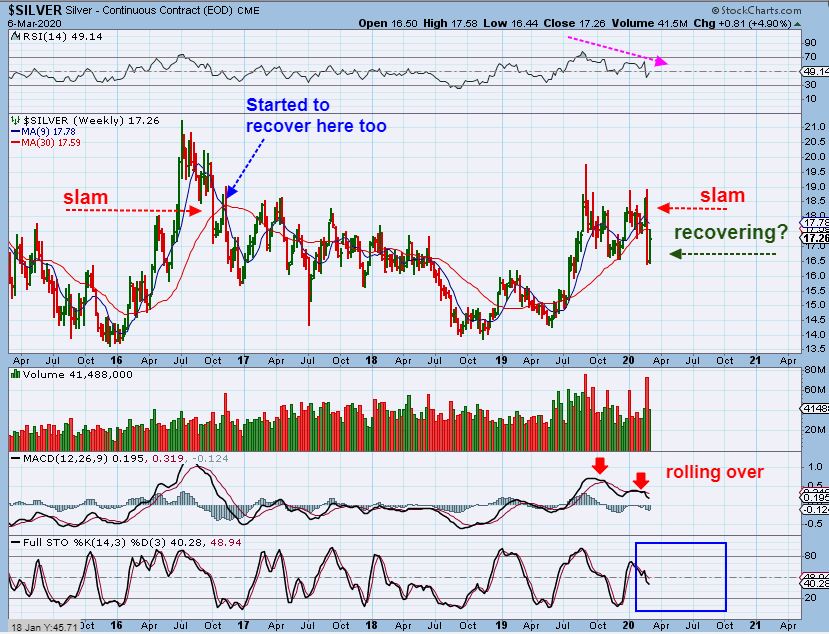
SILVER WEEKLY – I want to be honest , This leaves me unable to really ‘understand’ the sharp drop & therefore the future path of Silver. I feel like Silver flushed out & wants to rally, but silver stocks look weak. I also ask myself…
1. Was Silver viewed as industrial & joined the General Market?
2, If so, will that change & the flush is done & behind us?
3. Or another flush happen again, and we see another deeper drop take place in Silver?
THESE ARE THE UNKNOWNS, but if Gold drops into an ICL, I HAVE TO EXPECT THAT SILVER WILL NOT HOLD UP ON ITS OWN, RIGHT? The chart below is my best guess for chop & a drop, but I will know more as time moves forward and will discuss it often as clues develop. Look where I wrote “Choppy Drop” – that may repeat here.
,
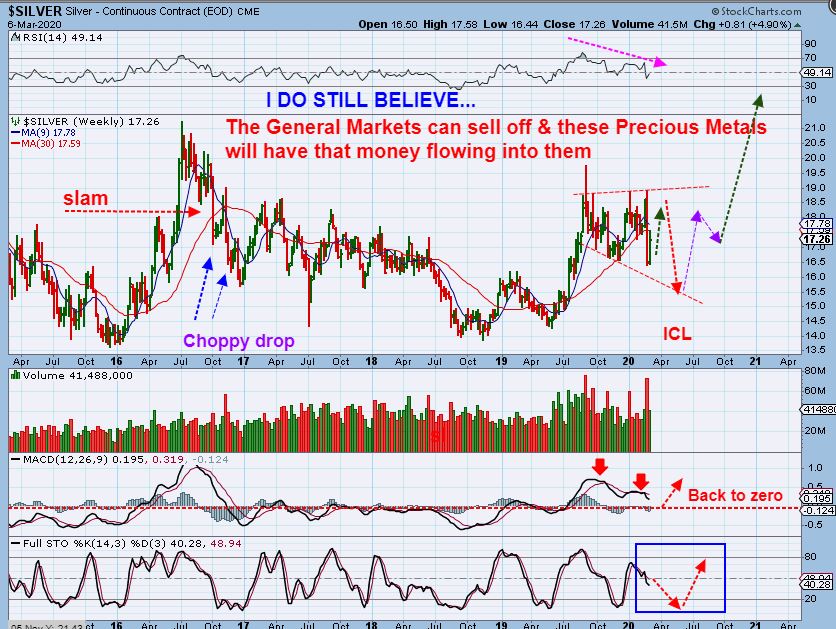
SILVER WEEKLY – That said, I also do expect that Silver WILL be viewed as a Precious Metal again, and it may even Lead Gold higher out of an earlier ICL. It may bottom first & start to move higher as Gold gradually chops lower. We saw and traded many Silver Miners last year that led the way higher and made excellent gains ( SVM, PAAS, SSRM, CDE, etc). We COULD see that again, but right now Silver stocks have joined Silver in the ‘Bogus’ zone.
,
SILVER MAY DROP & BOTTOM FIRST, however…
AT THE END OF THIS REPORT I WILL SHOW YOU ONE MORE VERY IMPORTANT IDEA TO CONSIDER WITH SILVER 🙂
.
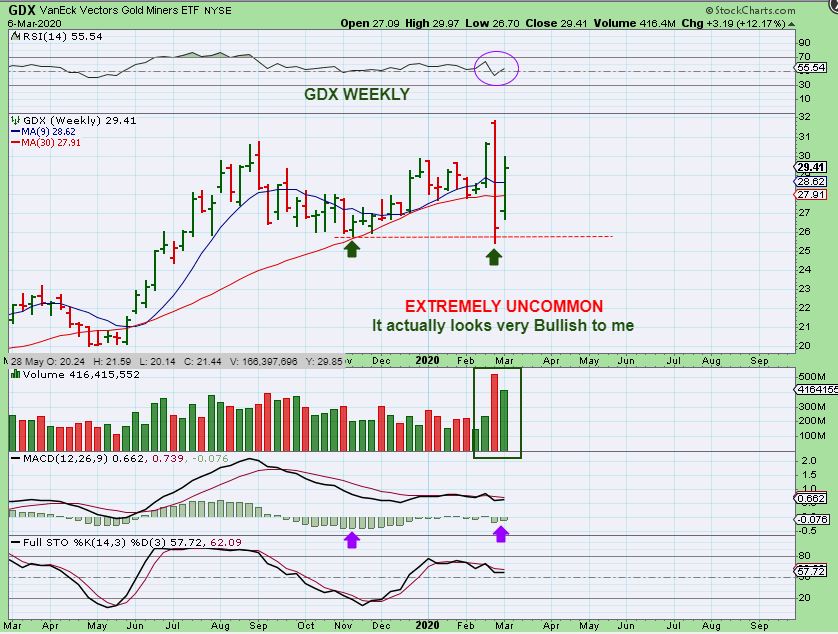
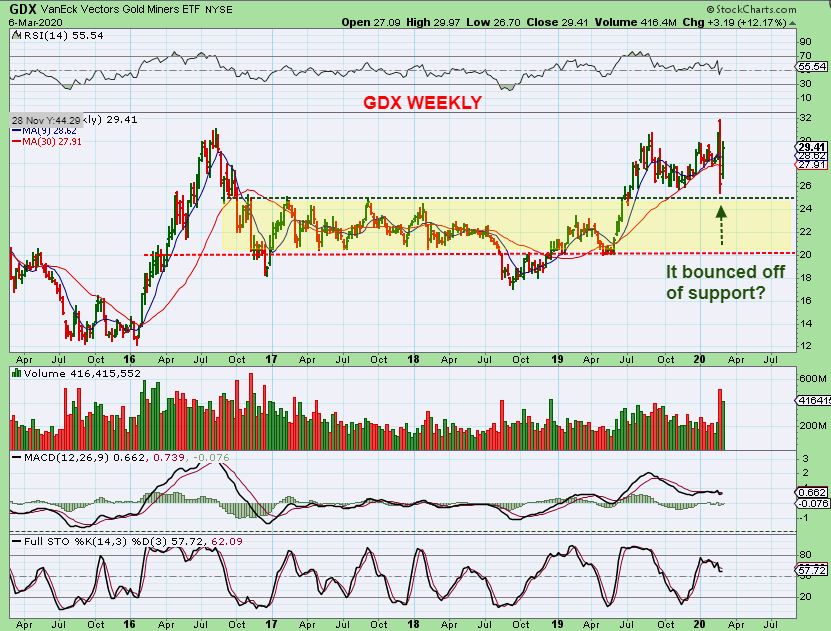
GDX WEEKLY – This drop last week was an extremely uncommon candle for GDX. It is a Giant engulfing candle that also broke the November lows. GDX then actually tried to recover very nicely this week, so this is a very puzzling set up now too. Why? This looks Bullish actually, but we have to be cautious with Gold & Silver saying that they want to dip to an ICL soon, like later in March and into April & maybe even May, right? So this was a “Bullish, yet demands caution” kind of reversal. Lets get another view…
.
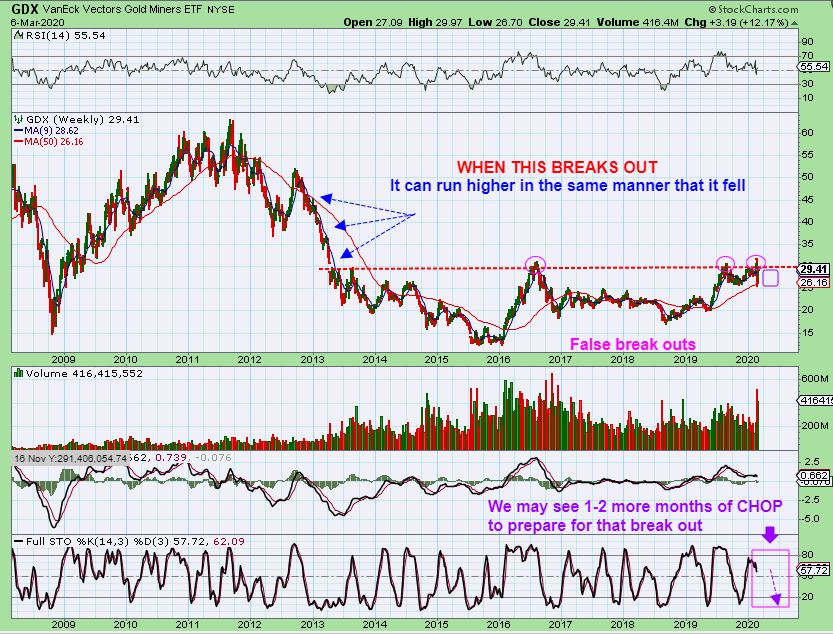
GDX WEEKLY – We see that Miners are at a long term resistance point and we keep getting slight break outs that fail to follow through. This may just get choppy and chop around sideways under that resistance area, building strength to break out later.
,
GDX WEEKLY – Interestingly, Miners had that sharp burst lower and it actually just about tagged support and bounced back. So this view shows me that we really did have an anomaly in price action. Think about this:
1. GDX BROKE OUT ABOVE that resistance area, and that was a Failed break out upside
2. Then it Broke down below prior lows ( Dcl & Icl) and onto support …
3. This happened All – In – One -Week? Then recovered the following week ?
,
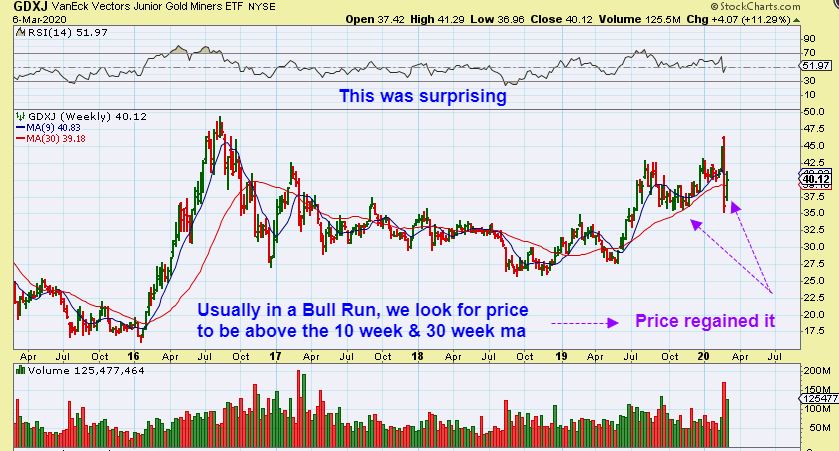
GDXJ WEEKLY – Here we see that Price sliced below the 30 week ma (Usually Bearish) and recovered (Usually Bullish). To be honest, this looks like ICL Price action, but it doesn’t fit Cycle timing and parameters. Let me show you a close up of GDXJ WEEKLY.
,
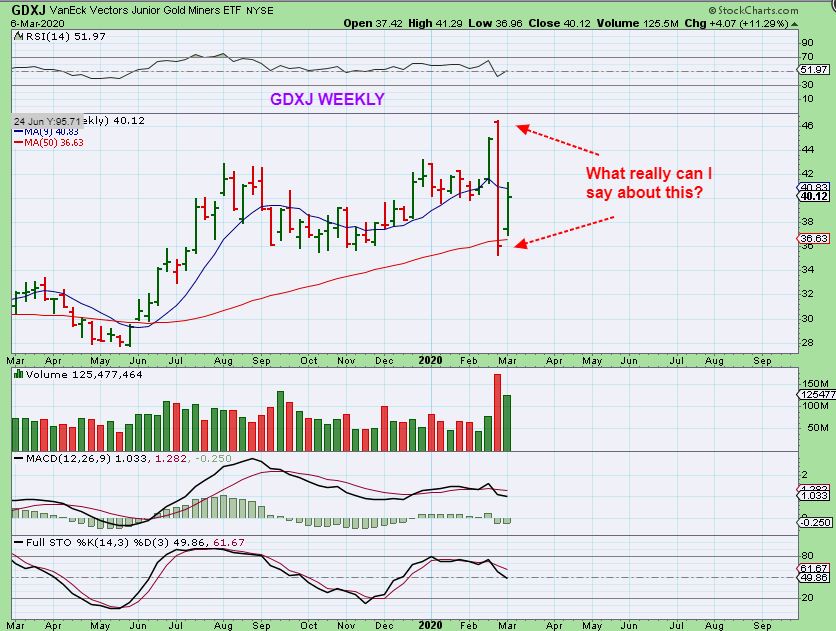
GDXJ WEEKLY – Read the chart, that pretty much sums it up. 🙂 It is an Anomaly. We got an extremely bearish looking drop for the last week of February that closed below the 50 week ma, but then it recovers? That looks bullish, but I just can’t trust that recovery fully at this point because of cycle counts. This may just get very choppy, we’ll have to take it day by day.
.
So let’s go back to this GDX CHART: Last week I said that this could be bought with a stop under the low, and this week I said you can raise stops to the 50 sma on a daily chart.
.
Obviously from this weekend review, you can see that we have had a LOT of price action in all sectors of the markets. Most of it was expected and continues to be predictable, with the General Markets selling down & Oil also selling off. Now the USD broke down & Gold made new highs, but Silver & GDX/GDXJ Flushed out? The Precious Metals sector is a very mixed picture, with price movement that was also very unexpected ( GDX break out & Down and recover in 2 weeks). I feel like SILVER & THE MINERS Flushed out, but GOLD is still at new highs. That is a bit confusing to say the least. If Gold drops gradually into an ICL, could SILVER & MINERS already have flushed out in an odd way and hold up better? Maybe they just get choppy and drift lower? It seems doubtful, but I will share one idea with you at the end of the report ( it is just something ‘less likely’, but something I will be watching for).
.
Enjoy your weekend and thanks for being a Chartfreak with me!
.
~ALEX
.
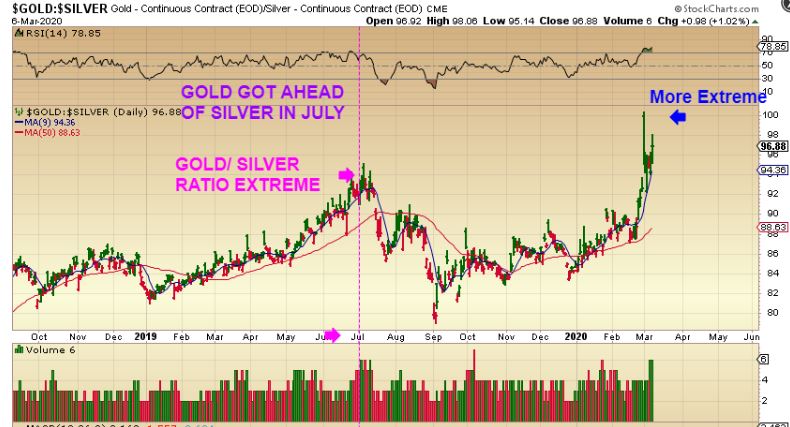
This is what I want to discuss about Silver (and it could affect Silver miners). What I see here must at least be in the back of my mind: This is the GOLD / SILVER RATIO AT AN EXTREME. It happened because Gold rallied and Silver flushed out. It was reading 100, and that is Big, Now take a look at this…
.
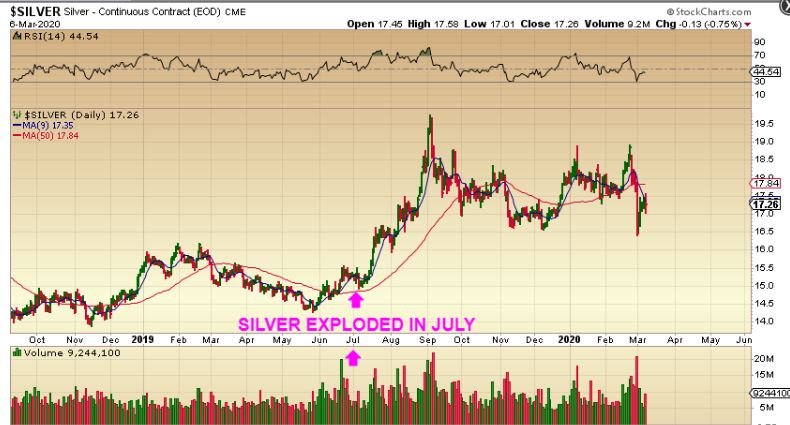
In July 2019 after the MAY ICL, the Gold Silver ratio was also at an extreme. With that, we expected Silver to PLAY CATCH UP. Gold was the leader, but what did Silver do after July with that extreme Gold Silver Ratio reading? Did Silver catch up in July?
m
SILVER RALLIED SHARPLY in July – September 2019. So again…
.
So again, we have an even larger Gold / Silver ratio now. Did silver flush out and is ready to rally & Catch up to gold? Or will it just viciously play catch up after the next ICL? I have to have this in the back of my mind, because of what we saw in July.
I will be keeping my eye on SILVER & The Miners since they did flush out once already. If they start to recover and run, then it may be possible that this anomaly Flush has somehow reset the timing for a rally.
I say that I have to keep that Idea secondary, or less likely, because it would not be normal market price action. Then again, the FLUSH experienced by Silver & Miners with Gold near the highs wasn’t exactly ‘normal price action’ either. I will be watching this going forward. It is an interesting set up indeed. A very mixed picture.
.
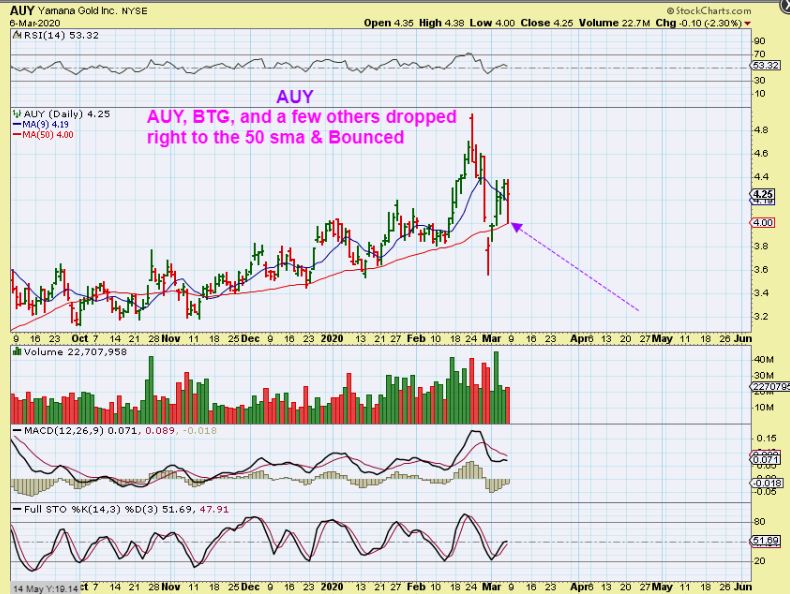
SIDENOTE: AUY, BTG , and a few other Miners dropped on Friday and then recovered. Most of you know that I have been in INO since around $4, I own MRNA, NVAX, BCX, SQQQ, and a few others too, and I also had added some AUY, BTG, a smaller JNUG position from the reversal lows. I wrote in the live commenting area ( below each daily chart) that I sold my Miners Friday. Why did I sell if this is above the 50sma? …
Why? I didn’t have to sell since it is only day 5 of the 3rd daily cycle, and there could be more upside. I sold them because I feel that I have too many positions open that move really quickly. As an active trader, I really need time watching and monitoring the charts intraday , especially with several fast moving biotechs that can get very active. I also try to answer emails, stay live in that live area, and I like to take a lunch break for an hour or so too, so it gets too ‘active’ when you own JNUG, MINERS, and several BIOTECHs . I wanted to lock in the positions gains in Miners (small gains really) and focus on those other stocks that are moving very quickly up & down. My position in INO started to move $1 to $2 intraday in both directions 🙂 , and the others are becoming very active too, so it is easier to hold less positions to keep watch & focus on a few active stocks.
.
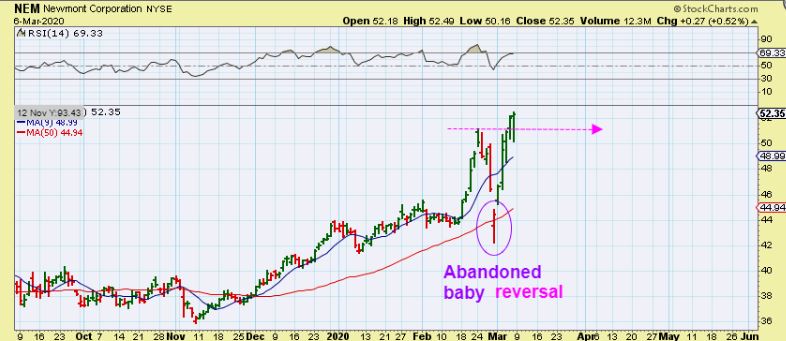
Having too many open positions is like trying to babysit 20 kittens, each running in a different direction. Sooner or later, a few are going to run away from you. AUY and BTG are still above the 50sma, they look good, and as pointed out recently NEM is at new highs. That said, some Miners are still fine to hold. I just needed to trim off some excess at this time.