
March 28th Weekend Wrap Up
As a review:
/
1. After being short during the crash ( I did close my short a bit early), I had been tracking the various sectors during that crash/sell off phase using cycle counts and anticipating eventual reversals.
2. These reversals could then produce a very trade-able bounce or rally, and that is where we find ourselves now.
3. We’ve flipped long with those lows in place in all sectors (except for OIL / Energy). These Lows should most likely be ICLs, and that would give us time to allow the long trades to play out, but we’ll always use stops in case they give way to more selling. I’ll explain that in the report.
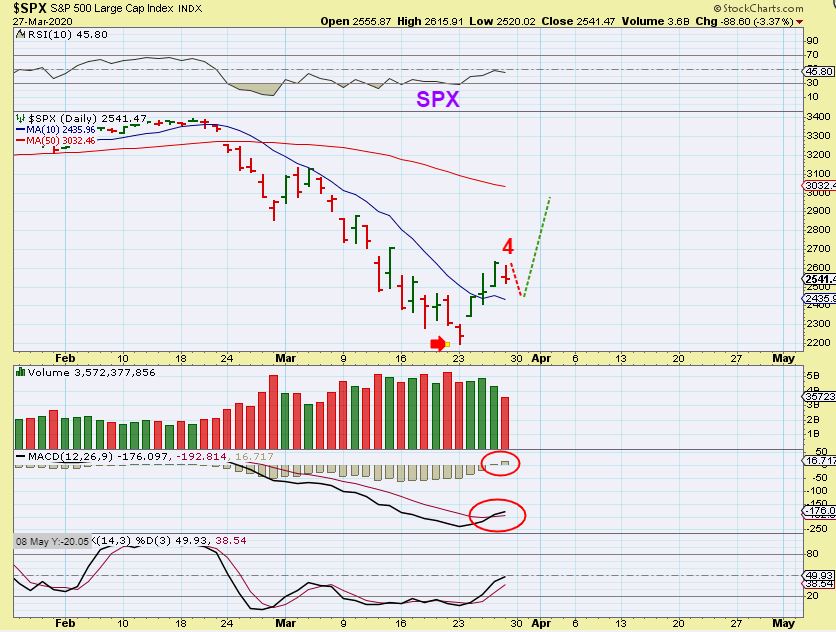
4. As usual, the daily reports will cover the day by day movement and trade ideas. So let’s get to the charts!…SPX
.
SPX – We bought the reversal day for SPX ( I used SOXL since it bottomed first and SPXL a day later). Now we are on day 4 of the SPX daily cycle( DCL), witch could be an intermediate cycle low (ICL). I also mentioned UDOW, UPRO, SPXL, and several individual trade ideas, since beaten down stocks can produce QUICK %-Gainers. We may just drop to the 10sma and then run higher again.
,
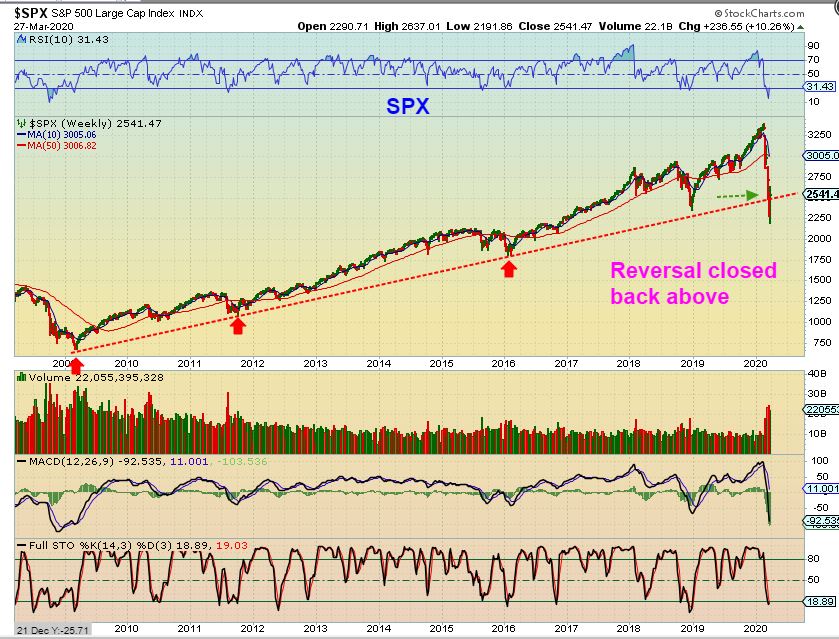
SPX Weekly Big Picture – I had been pointing out this break down, and now we see that it recovered. I have discussed a few possibilities going forward in past weekend report and will look for signs going forward too, but for now we are long. Let me show you 2 possibilities that I am thinking could happen from here.
n
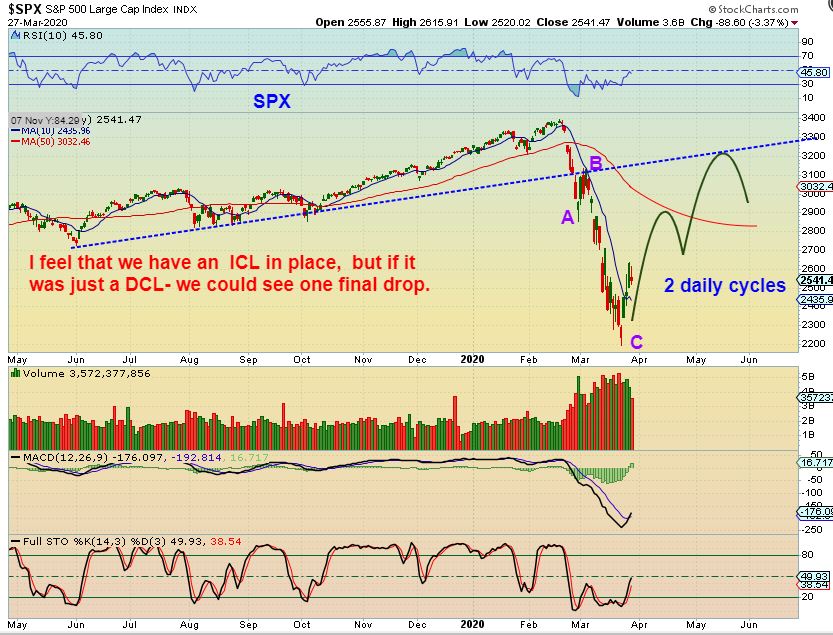
Let me show you 2 possibilities that I am thinking could happen from here.
.
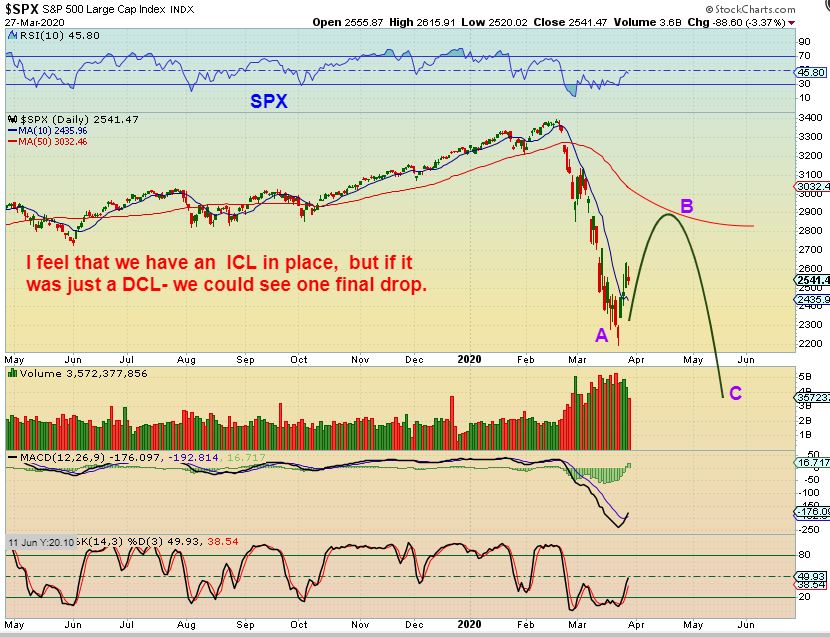
#1: I have been saying that we could go long expecting a good bounce soon, and I do think that we should have an ICL in place, so I can draw an a-b-c drop as shown. Then I’d expect 2 daily cycles as shown to back test the break down and from there I’ll look for more clues. Signs of weakness or does it look bullish. SO I am LONG, however
,
I want to have in the back of my mind this more bearish possibility ( so use stops). What if that drop was the ‘A’? We’d get a dcl there and a rally to ‘b’, with a final drop to the real ICL at point ‘c’. I can’t rule this out, but the rally would still be trade-able, so we took that trade. This would take places if the current low at ‘A’ was just a dcl.
.
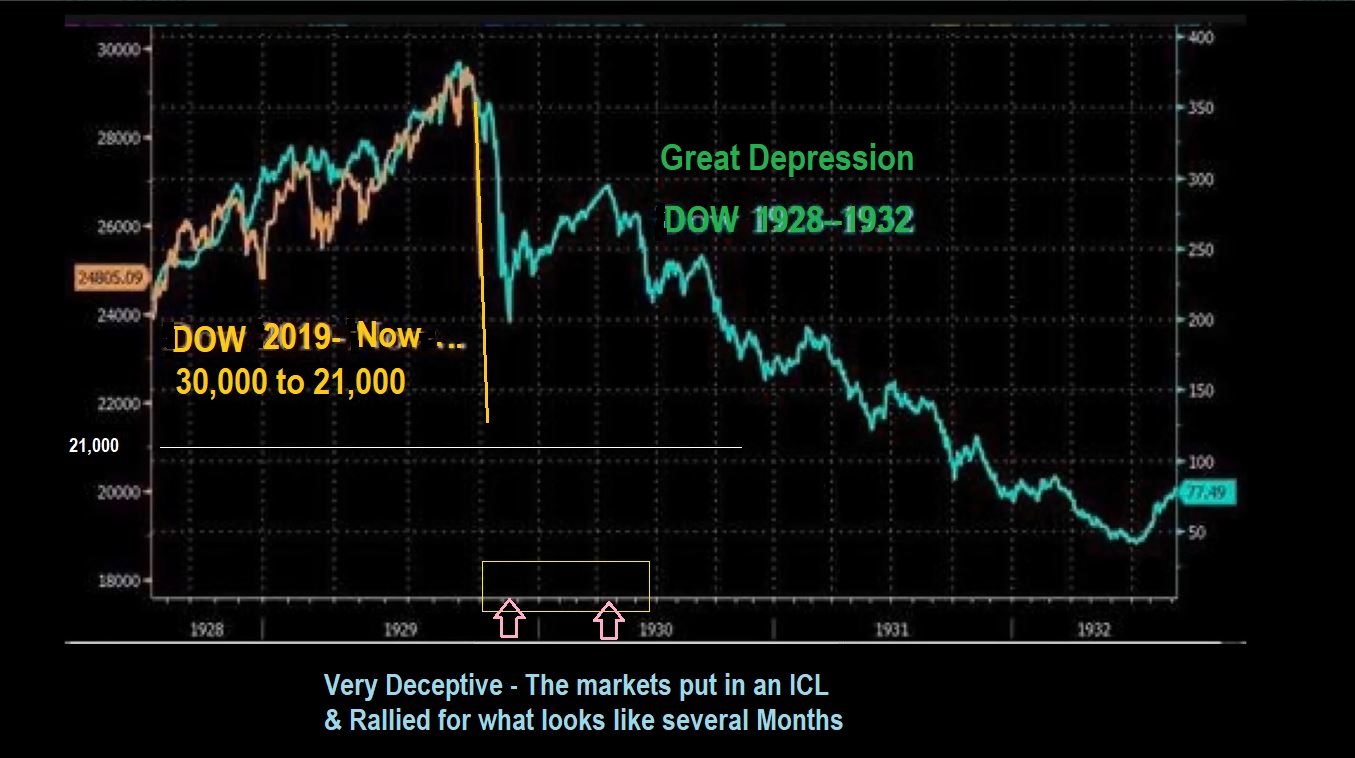
The 1928 crash vs the current one: I Used this chart to show how a pretty long rally can occur after a crash hits an ICL, sucking in the longs for another slaughter. This multi-month rally was followed by a bear market, so again, I’ll look for clues along the way. I do think that we could be here at the sharp sell off lows now ( Use stops just in case).
l
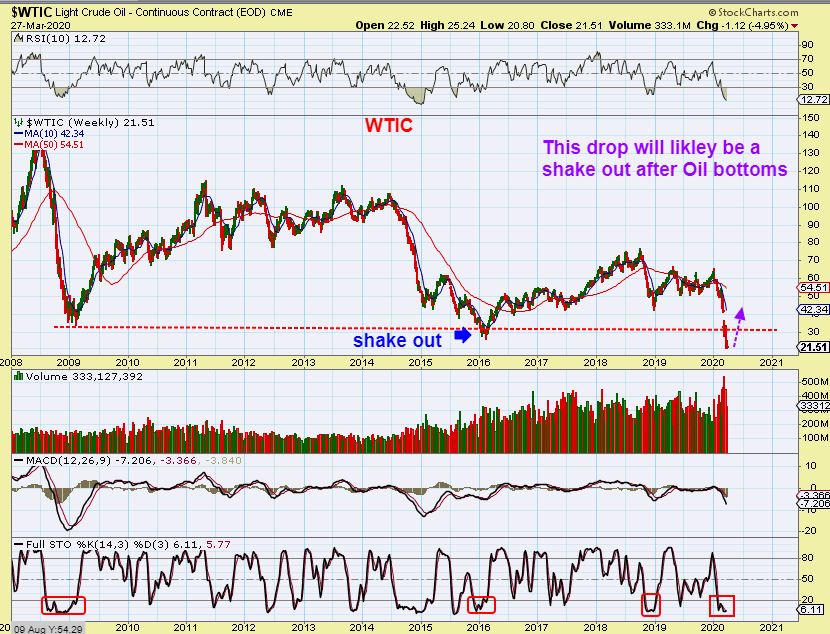
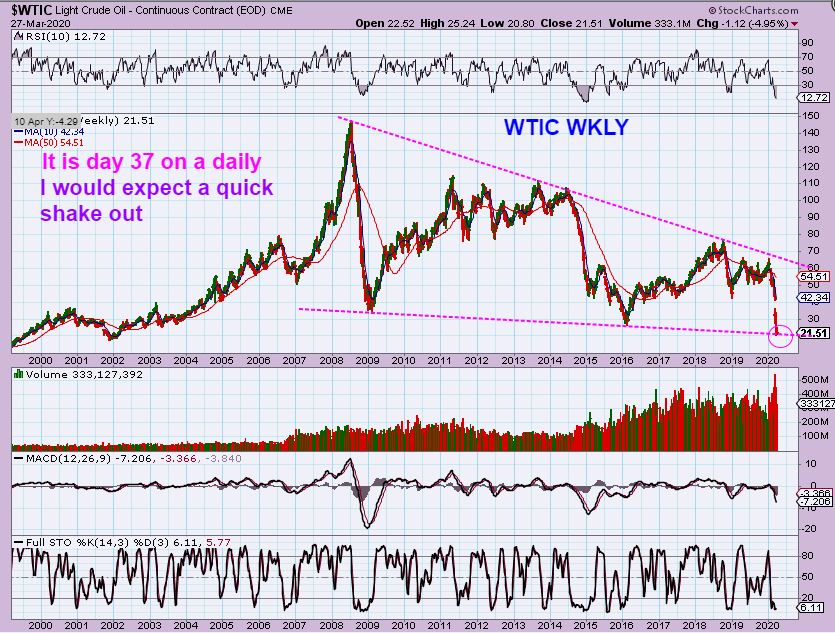
WTIC WEEKLY – Oil had a shake out in 2016 and then rallied out of the lows. We may be seeing a shake out now, we are just waiting for those lows & a reversal. Daily Cycle timing has us on day 37 Friday. Oils cycles are often around 40 or more days, so we are close.
,
WTIC BIG PICTURE – We are in what I would expect to be a support area. Oil can bottom at any time.
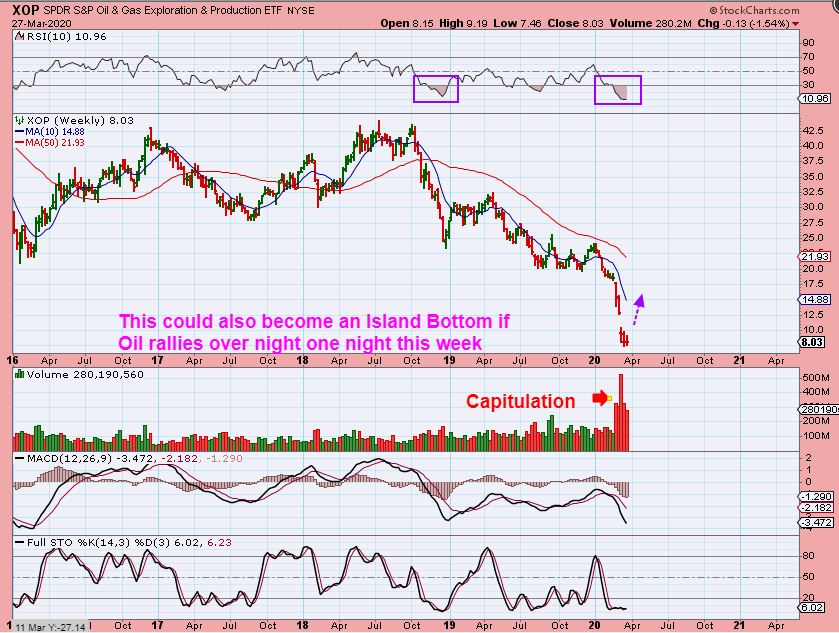
,
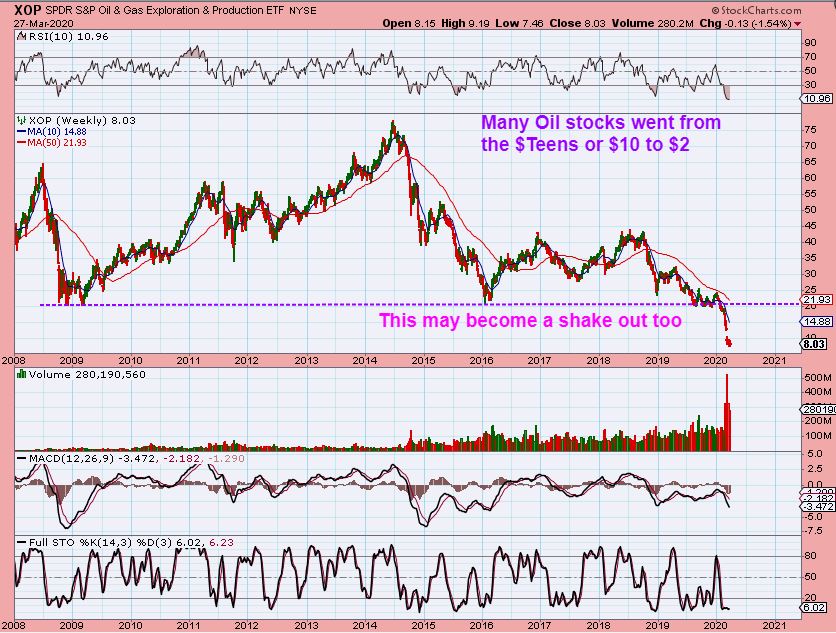
XOP WEEKLY – Many Oil stocks are at a fraction of their former prices and a nice snap back rally may happen in many of them when oil bottoms too. I already traded a few, and I both made money and lost money, so it just isn’t time yet for all of these. I do think that they will rally with oil. I traded TUSK, PUMP, OAS, LPI, WLL, WTI in small quick trades.
,
XOP WEEKLY – I do see what is probably capitulation type volume and I do expect a small rally when oil bottoms. many Gold/Silver Miners doubled out of theie lows, and these Oil stocks most likely will too ( In fact, Some already did Big %-Gains on dead cat bounces, like TUSK, OAS, WLL, PUMP, etc). See the charts.
,
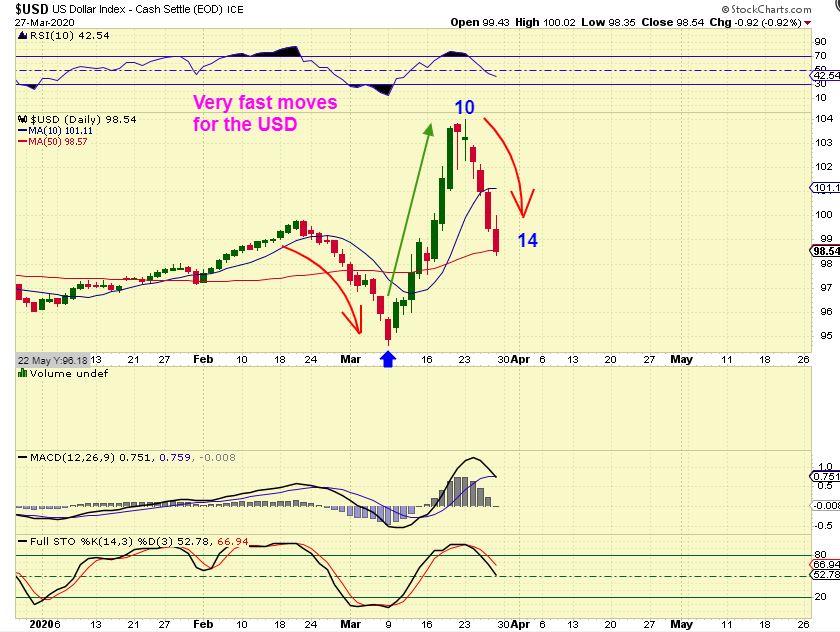
USD DAILY – There is something odd about this sharp drop, sharp rally, and now the sharp drop again. It might look normal at a glance, possibly finding support at the 50sma, however look what I found when I step back to a weekly.
,
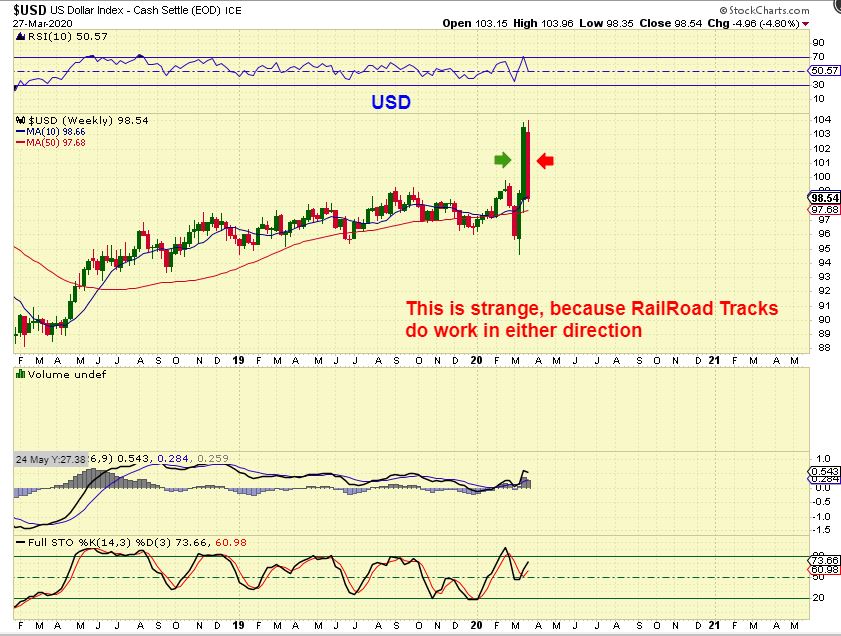
USD WEEKLY – These are Rail Road Track Highs, and they do work in both directions. IF THIS IS THE CASE, that means that we are seeing a top in the USD (though it can bounce) , and a low in Miners (though they can dip), which also showed Rail Road Track Lows. Very strange moves indeed. Once in a lifetime?
,
AS A REMINDER: On March 17th, I pointed out that R.R.Tracks are supposed to be as sign of extremes that leaves the low unbroken for a good period of time. Like an ICL. 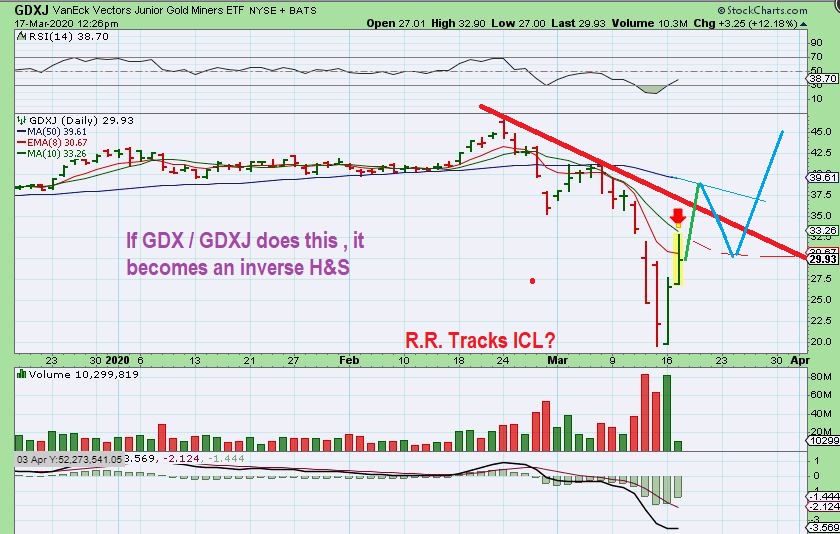
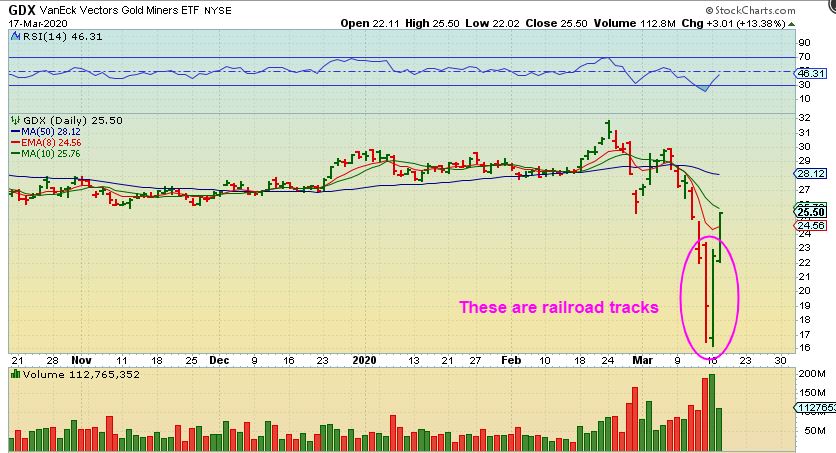
So now we have R.R.Tracks Lows in Miners and R.R.Track highs in the USD? That is interesting, since tracks of that size are pretty rare.
m
PRECIOUS METALS:
.
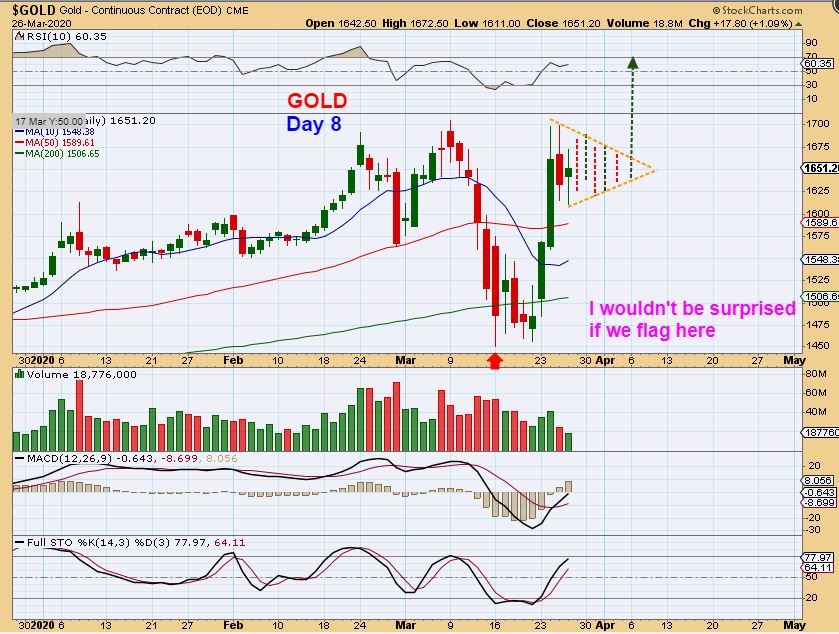
FROM THURSDAY – GOLD DAILY : Gold crashed down & recovered already. I mentioned that Gold may consolidate for a while, maybe even forming a bull flag. Gold continued trading in that area Friday, while Miners pulled back.
,
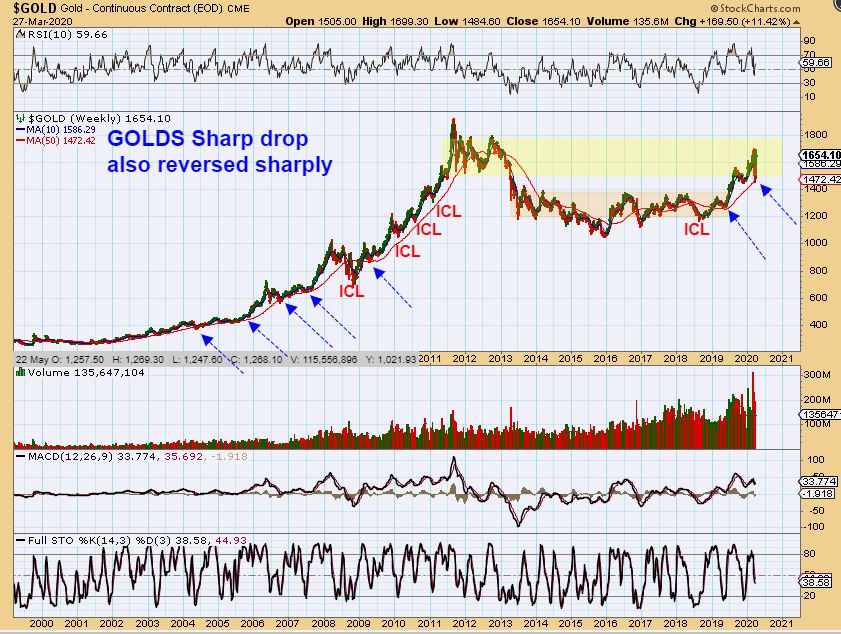
GOLD WEEKLY: Out of Gold, Silver, and the Miners, really only Gold acted correctly with the recent drop. Gold actually crashed down to support and recovered already. Silver & Miners broke violently below their support levels.
,
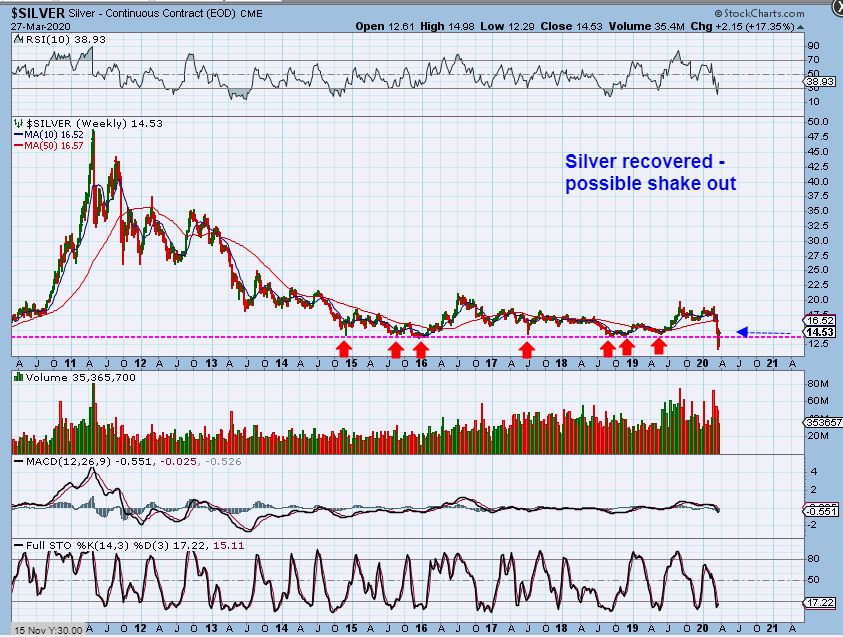
SILVER WEEKLY – Silver broke all of the recent lows and recovered. Talk about cleaning the slate! That’s the way to run the stops and get everyone out of Silver, and yet no one seemed to be able to buy much physical Silver during this crash. It seems that maybe the BIG BOYZ were loading up on the crash? Silver may now be ready to put in the run that we all want to see.
,
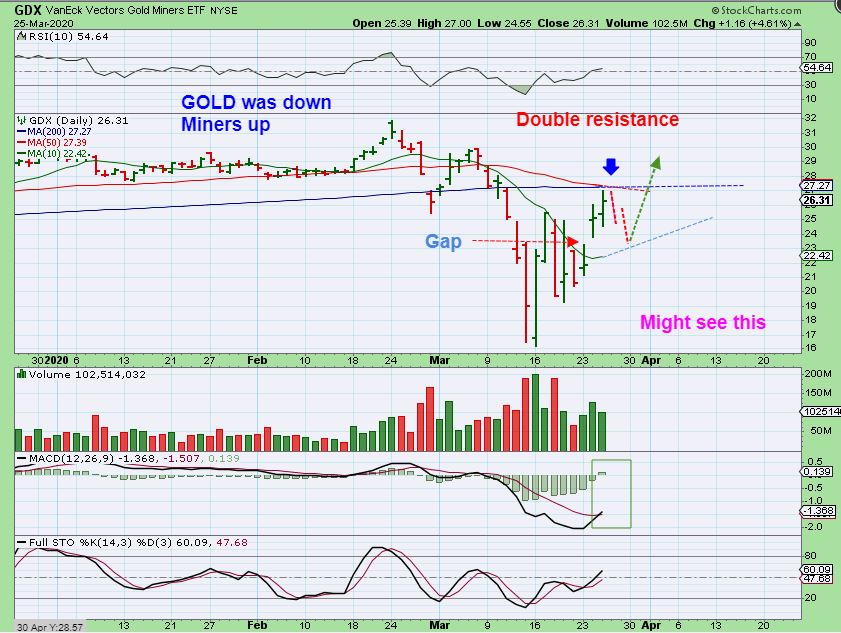
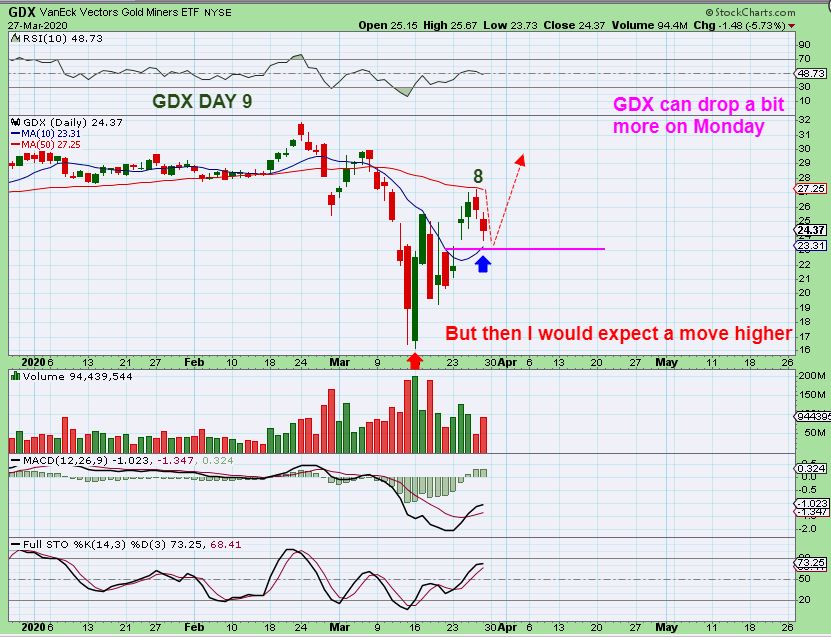
GDX DAILY – I mentioned on Wednesday that GDX may stall at resistance and we could see a normal pull back, even filling that gap at the 10sma.
.
GDX did just that: It hit resistance as expected on day 8 and pulled back Friday. I have been thinking that the 10sma may be an area where buyers step in. We’ll see next week.
,
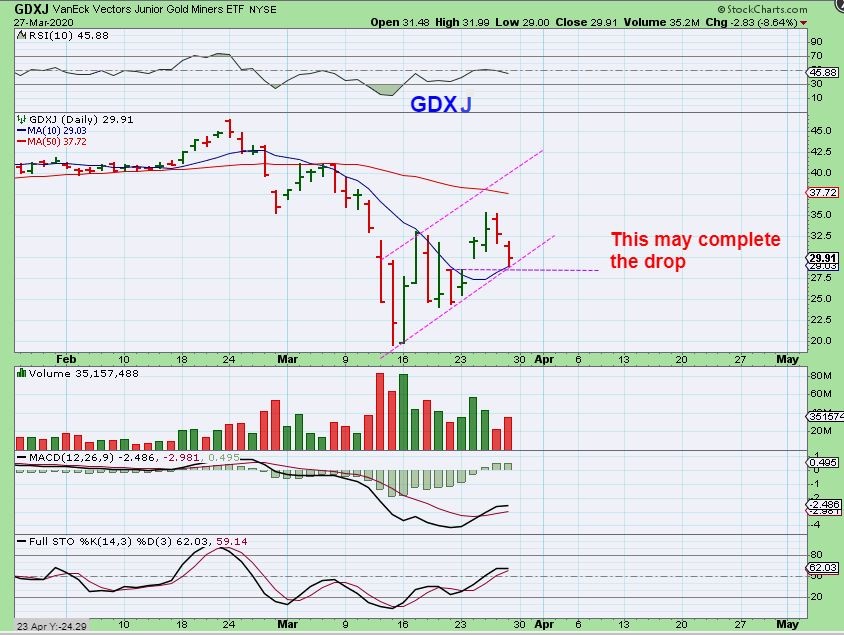
GDXJ also followed GDX down and bounced off of the 10sma for now. We may be starting a channel higher if the lower trend line holds. WHAT IF THE 10 SMA BREAKS? IS IT GAME OVER?
WHAT IF THE 10 SMA BREAKS? IS IT GAME OVER?
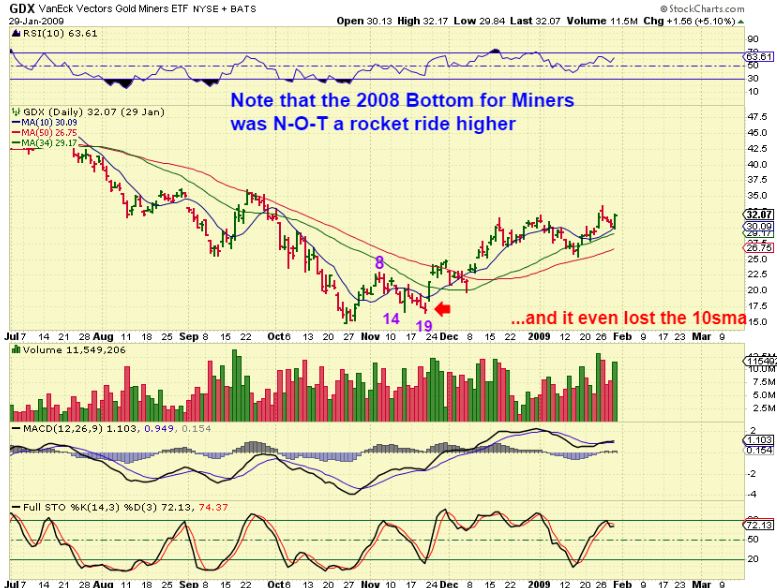
No, that would not necessarily be ‘game over’. I have already pointed out that Miners returned all the way back down to the lows in 2008 by day 14 & 19, and this panicked a lot of people out of their positions, but the lows were still in place.
.
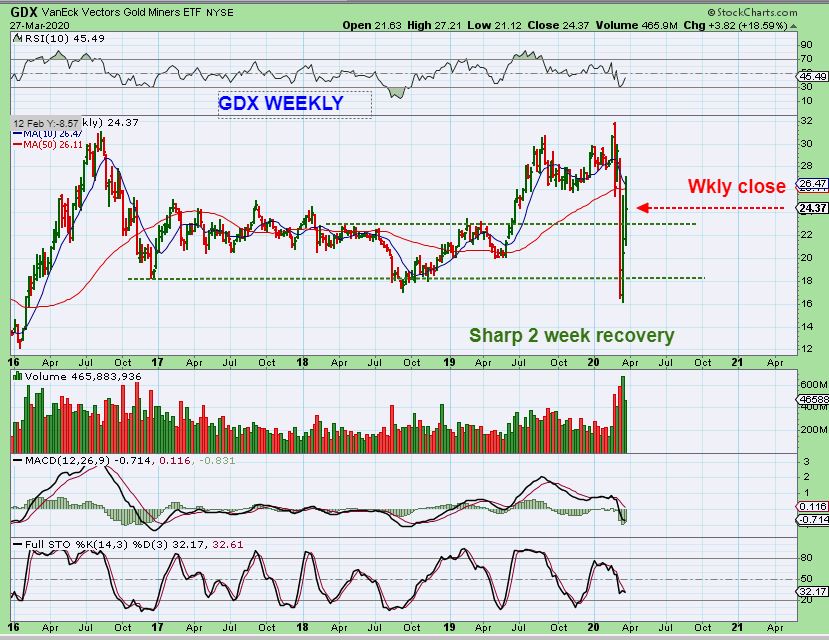
GDX WEEKLY – What a sharp sell off and recovery! Many people were stopped out of their position in Miners, and were no doubt too afraid to get back in. We bought visible reversals almost immediately and many of us enjoyed some great gains on this recovery already. For example: SVM tripled off of the lows already! Even getting in a bit late gave over 100% gains. These lows in Miners are probably THE LOWS going forward, with an ICL in place. What – A – Shake -Out!
,
We have seen some extreme selling in the month of March, but now the reversals out of those lows last week were very rewarding. The move off of the lows can often give you very large %-Gains as they snap back to where they belong. We saw that with many Miners and the trades out of the General Market Lows are going well too. Oil should be due for a low soon, and then we may see the same kind of snap back rallies in that sector too, so short term traders may want to be ready for that, and you can actually see stocks like MRO, VLO, TUSK, PUMP, BE, WTI, and more already in a bottoming process. This is a bit riskier, so it may not be advisable for the conservative traders.
,
It really looks like we have an opportunity to make some good money / gains by being long with the current trading set ups. I would think that the pull backs that started Friday in the General Markets and Miners should be short lived drops to support, and they should turn into buying opportunities too. I will continue to monitor and cover things in the daily reports going forward, but you can also check your charts on Monday and see if we get any reversals in areas like the miners.
I hope that everyone has a good weekend, stay safe, and I wish good health to all of you and your families. Thanks for being here at Chartfreak!
,

