
The Weekend Report – Walking The Tightrope
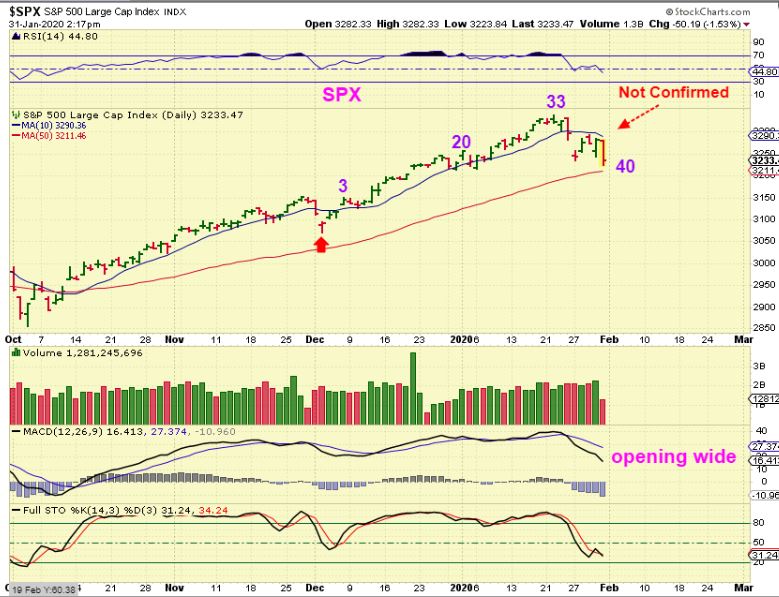
SPX DAILY– The daily cycle low was not confirmed by closing above the 10sma, so no buy signal was given. We should now be on day 40 and we are still due for a dcl, so I still expect a low to form soon. That MACD is opening wide, so this may then roll over as a left translated daily cycle & then fall into a deeper low as it drops into an ICL.
.
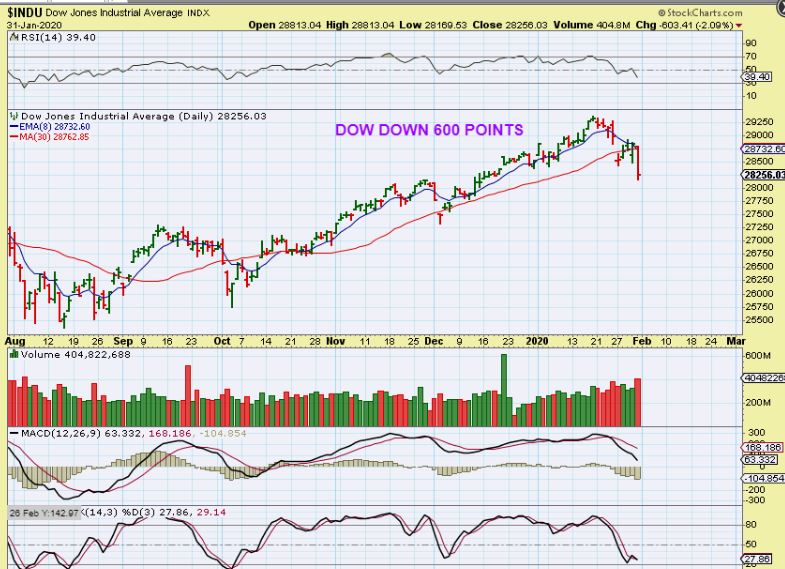
DOW DAILY – The DOW lost 600 points on Friday, also breaking below the day 36 low. This looks like a waterfall sell off is about to happen and it really could be, but I’m still expecting a swing low first and then it may roll over into a deeper low.
.
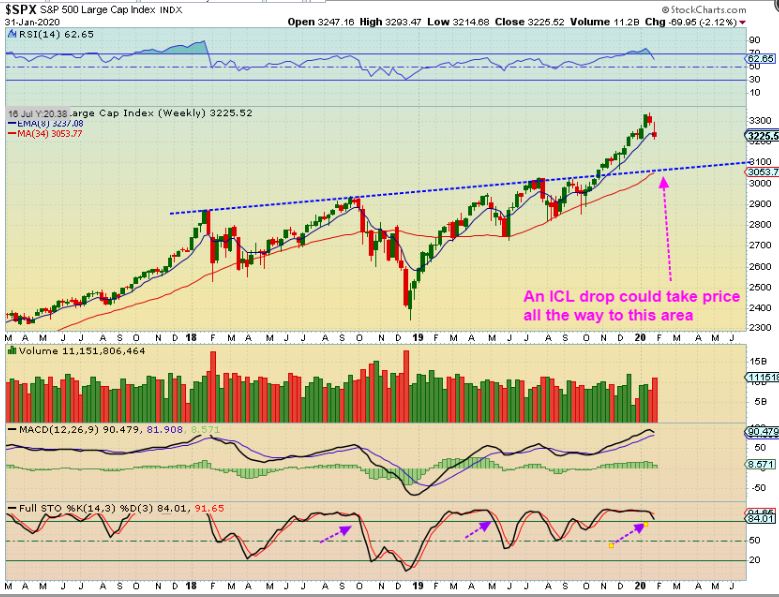
SPX WEEKLY– The Big picture makes me think that we could see a drop to back test the break out over time. I am not short or long, but if this plays out like I think it will, shorting the next bounce may be a profitable trade.
.
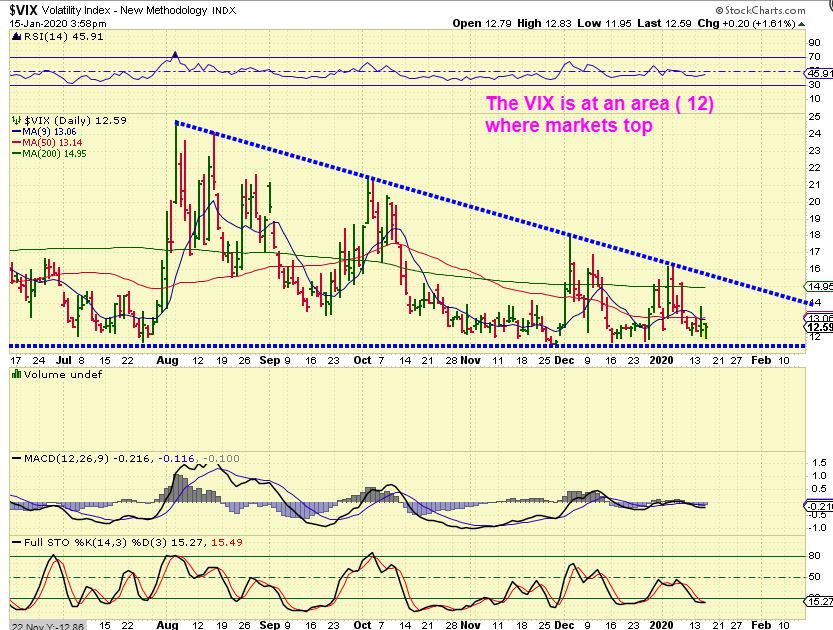
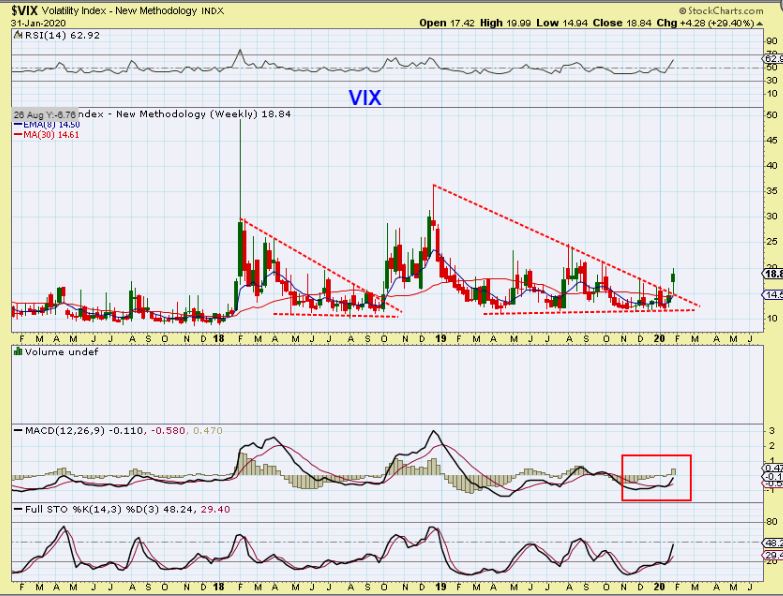
REMINDER: VIX ON JAN 16- I recently posted that a break out of this Vix could mean bigger downside for our markets.
,
VIX – The VIX did break out and this to me is a warning that the Markets really do want to fulfill a larger drop.
.
WARNING: Using Cycles, I would expect a dcl soon, a bounce, and then a bigger drop. When I saw that VIX & MACD, I thought to myself that we could also possibly just get a longer daily cycle & simply plunge for 3-5 more days or so. I may view that as less likely, but I just wanted to show you how the Markets can drop MUCH FASTER than they rise.
.
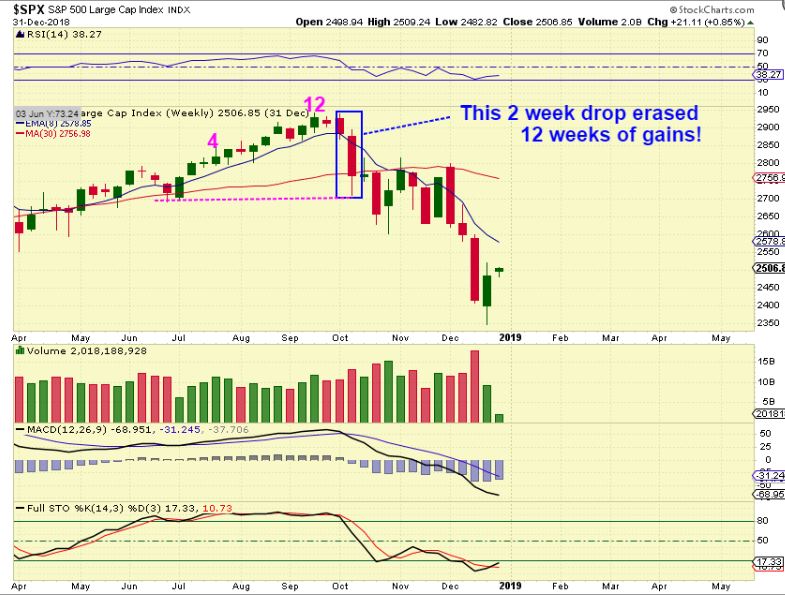
This is a chart of a major sell off in the S&P that happened in 2018. What I want to point out is this 2 week drop (blue box) erased the prior 12 weeks of gains. That means that next week could do something similar if it just crashes. So it is possible that next week could crash Big like that last candle in the blue box. Be careful, Stay Frosty!
.
WTIC WEEKLY– Oil has dropped and has been choppy in the big picture. It should also be due for a dcl soon. This is starting to look like a Giant H&S, but with the right shoulder higher, it may not play out in the long run.

.
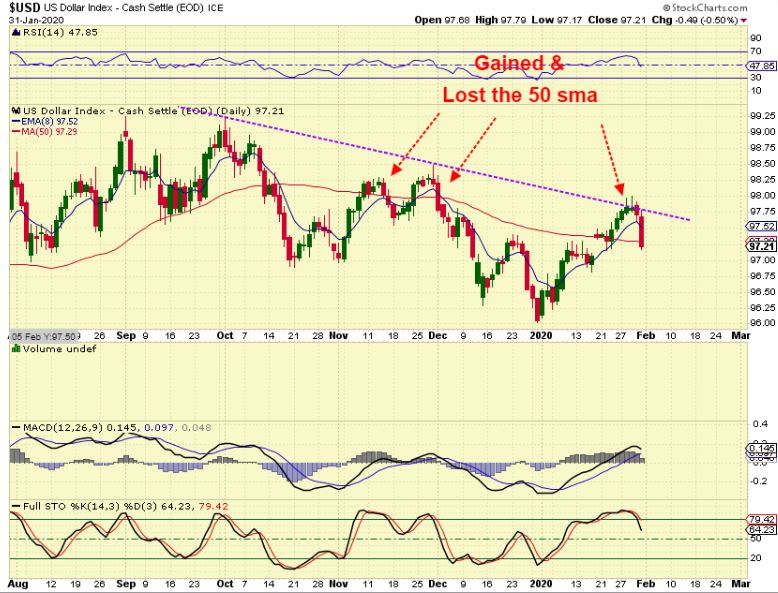
USD WEEKLY – The USD is showing signs of weakness lately, and this may help Gold, I’ll explain that later. The Dollar has been unable to hold above the 50 sma.
.
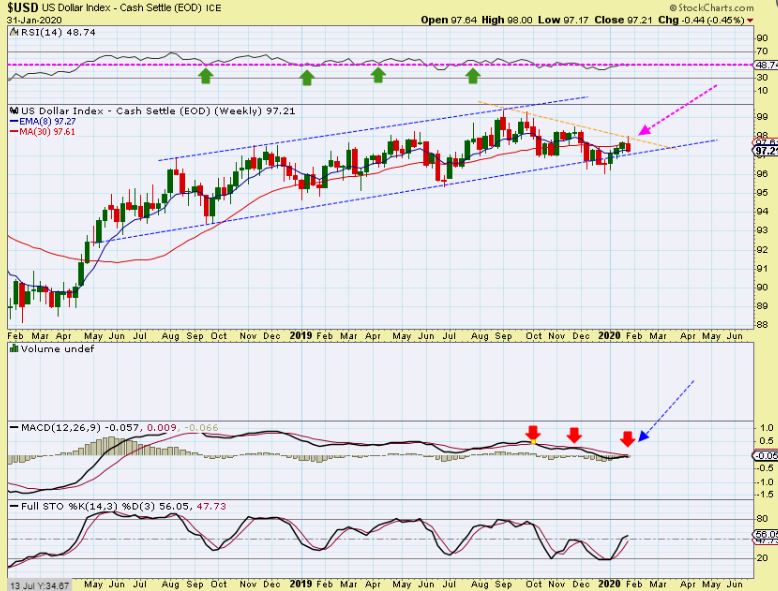
USD WEEKLY – The Weekly USD chart also appears to be weaker lately with lower highs forming from August onward. A break down should boost Gold through the resistance area that it is currently pressing on. I will show that resistance area with the Gold charts.
.
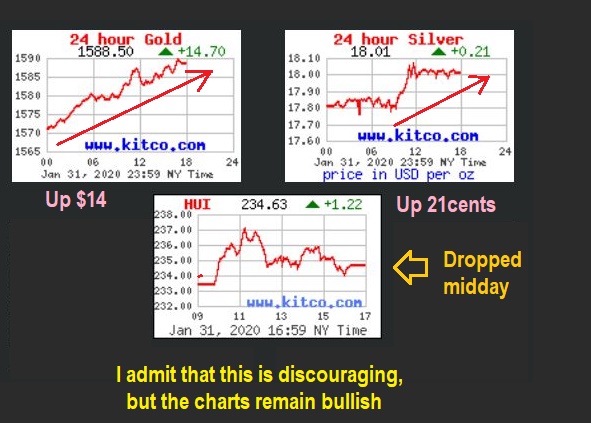
I AM GOING TO ADMIT THAT IT CAN BE DISCOURAGING WHEN GOLD & SILVER RISES INTO THE CLOSE, AND MINERS SELL DOWN. TODAY WE’LL JUST GO THROUGH OUR CHARTS OF GOLD, SILVER , AND THE MINERS AND SEE IF THEY ALL STILL LOOK BULLISH OR ARE THEY CONCERNING.
.
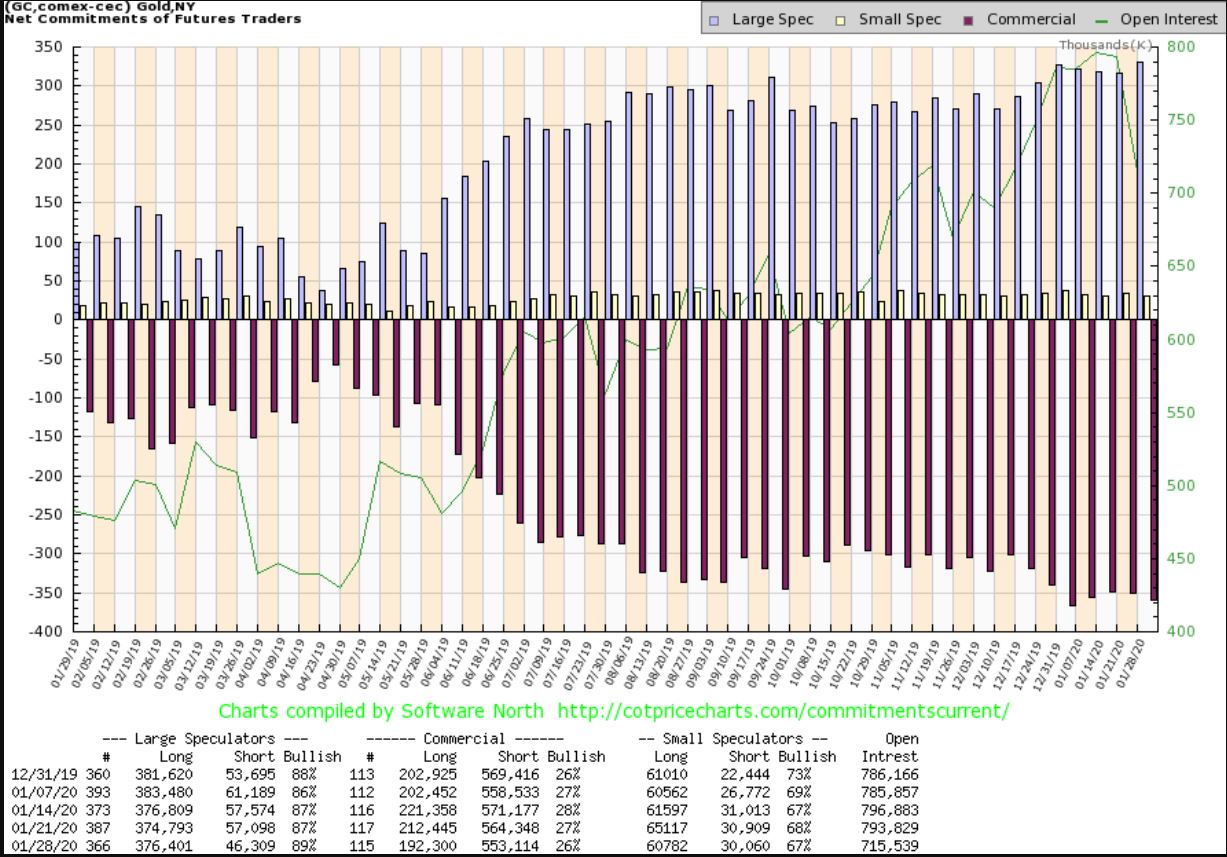
COT – The COT has not changed in any meaningful way.
.
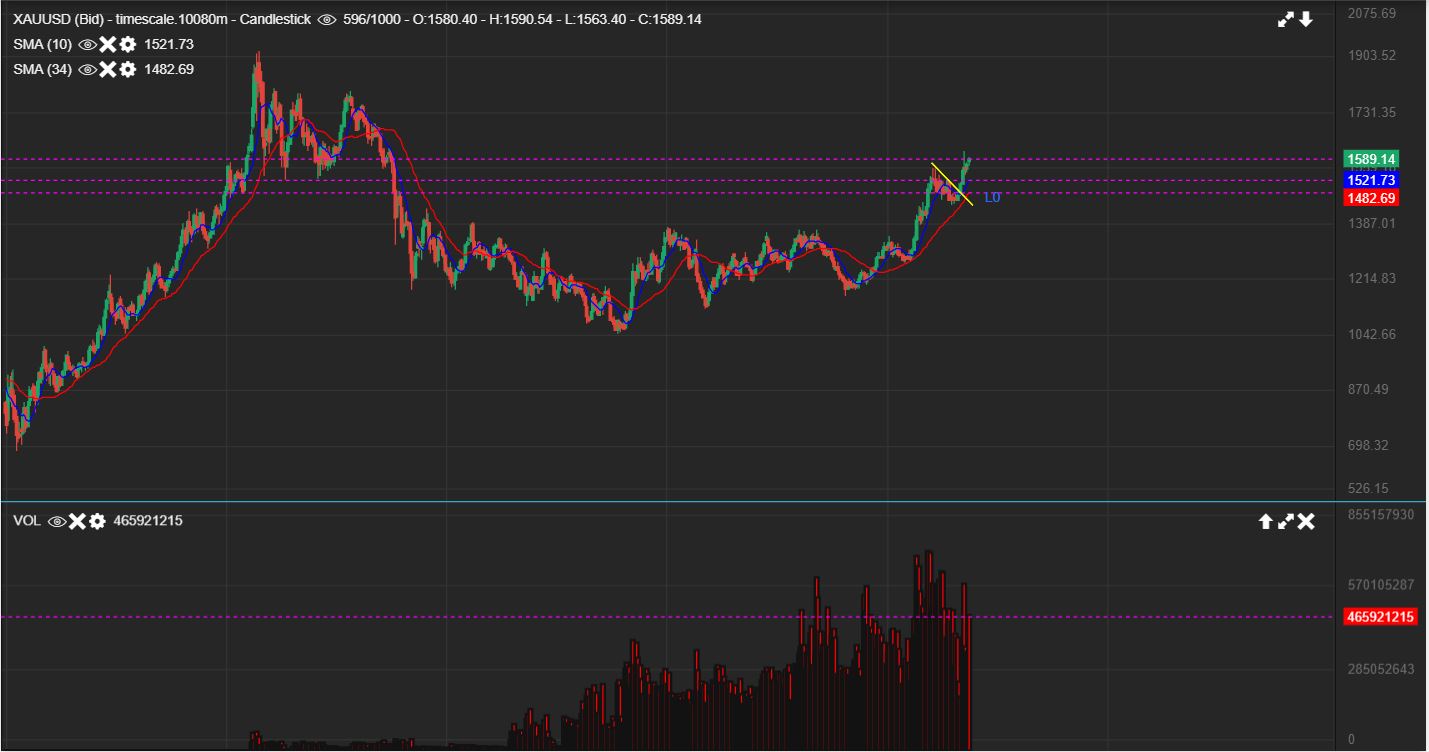
GOLD WEEKLY – This is a bullish chart as Gold broke out from that multiyear base, shot straight up into resistance, and then consolidated those gains as it dipped down into the last ICL . Gold is now continuing higher ( although it is Pushing against that resistance area again).
.
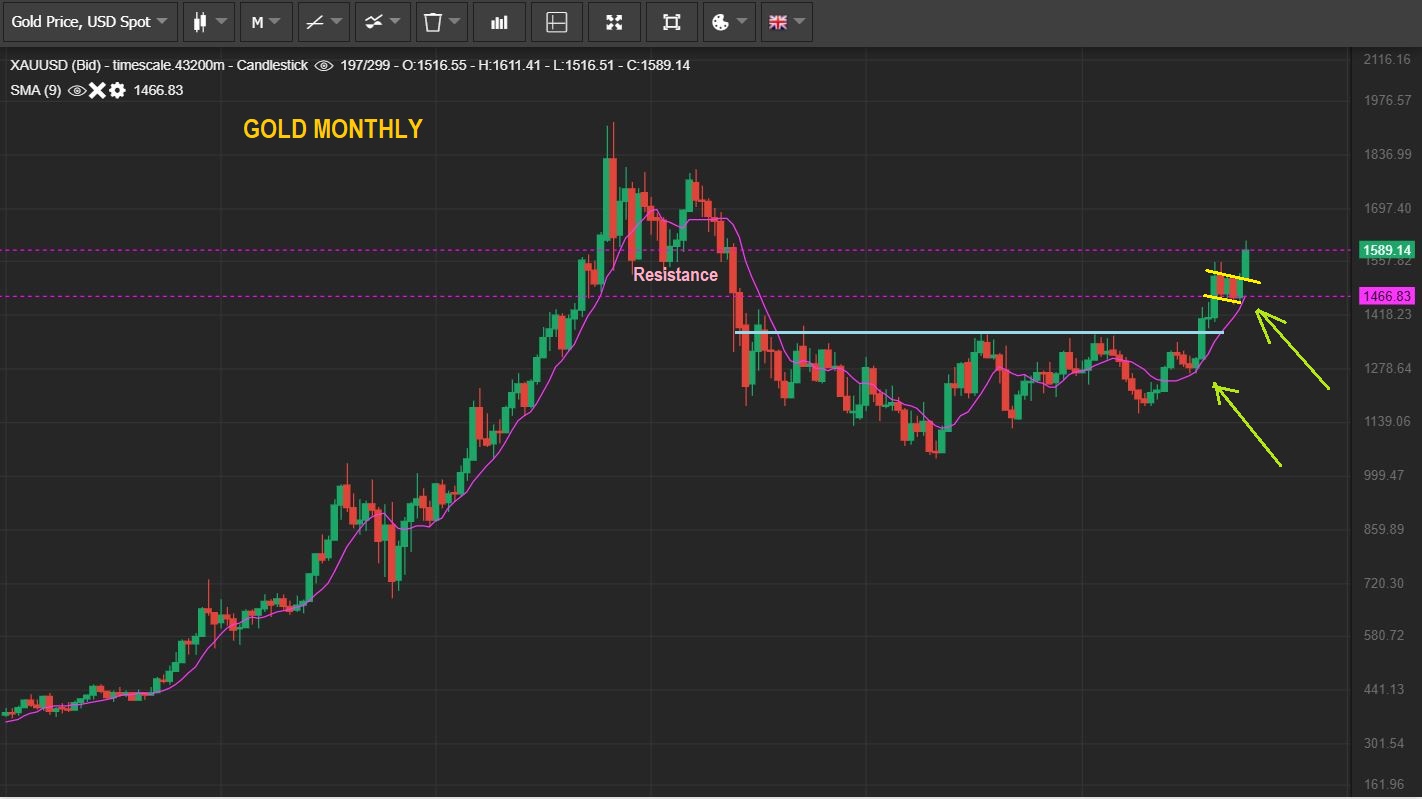
GOLD MONTHLY – The Monthly ( Now that January ended) is really a bullish chart set up. I expect Gold to eventually run to prior highs, so this is a very bullish set up. GOLD REMAINS BULLISH.
.
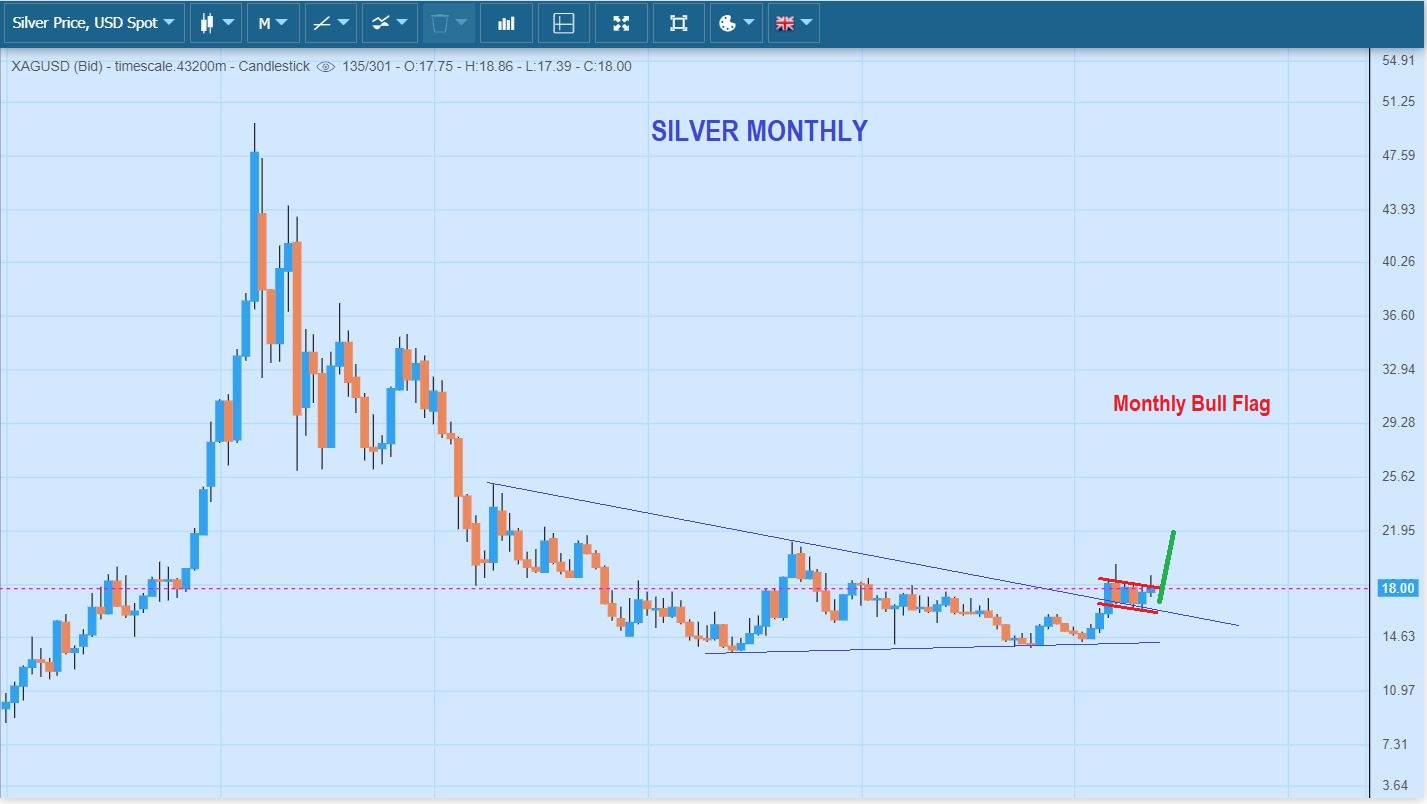
SILVER MONTHLY – This Monthly chart of Silver shows a break of the downtrend ( wedge) and then a bull flag. Since this is a Monthly chart, that Bull Flag lasted 5 months. When this breaks higher, I think that the Silver stocks will resume their run too. They have been a little sluggish over the past couple of weeks, maybe this explains why. SILVER REMAINS BULLISH.
.
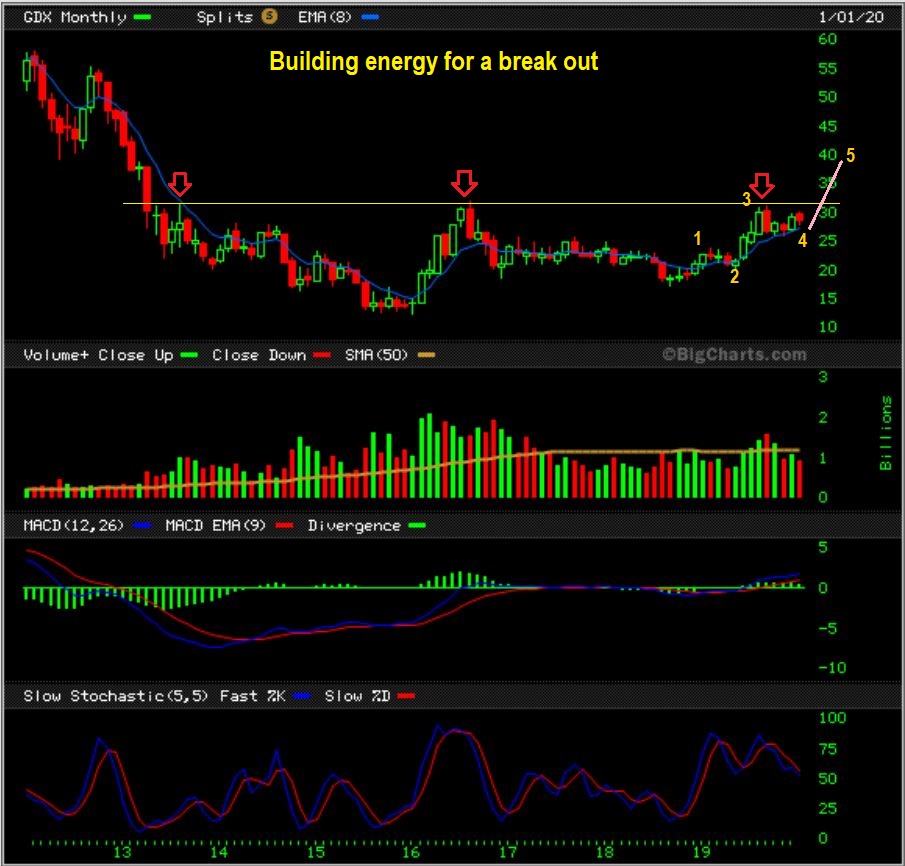
GDX MONTHLY – I posted this in Fridays report, because I was getting worrisome, even fearful feedback when Miners didn’t just take off an run higher after the Fed Mtg Wednesday. We see GDX is near 4 year highs and this is a bullish chart.
.
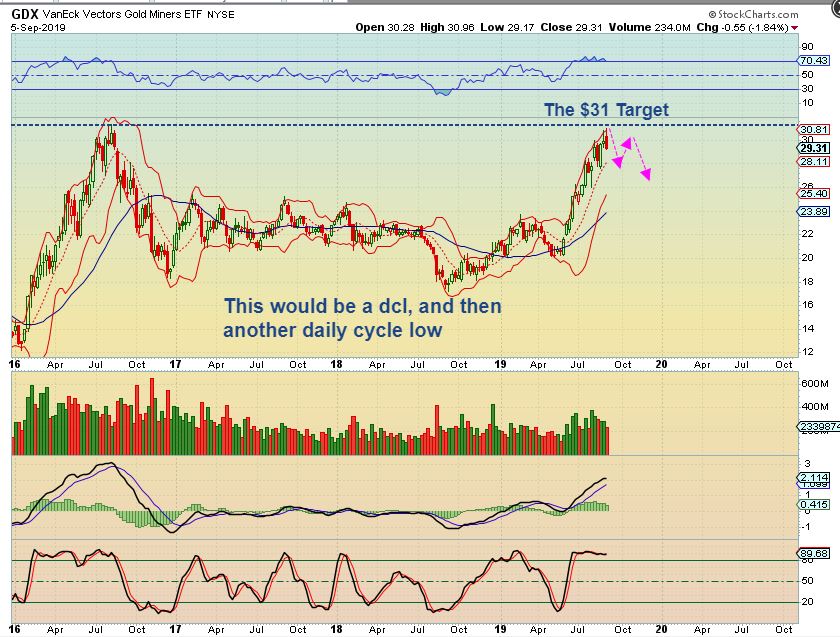
GDX – I want to post my September chart as a reminder. When GDX reached the 2016 highs, I said that we could see a handle form, and this would be a choppy resistance area. I posted this in September as 1 of MANY charts showing the possibility of choppy trade.
.
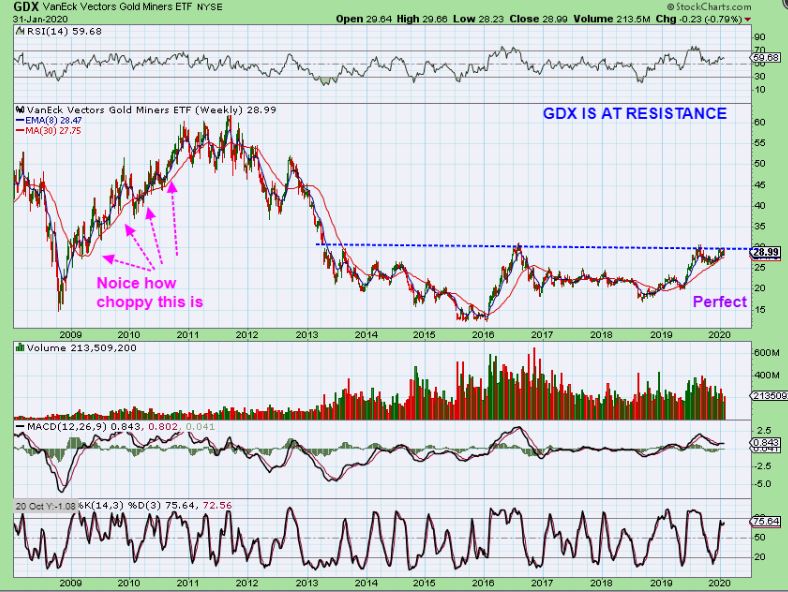
GDX WEEKLY #1– We can now see that we got exactly what I said we could – a choppy drop. When I look at the weekly chart, GDX is near the recent highs and this remains a bullish set up, but it can continue to chop since it is at resistance. 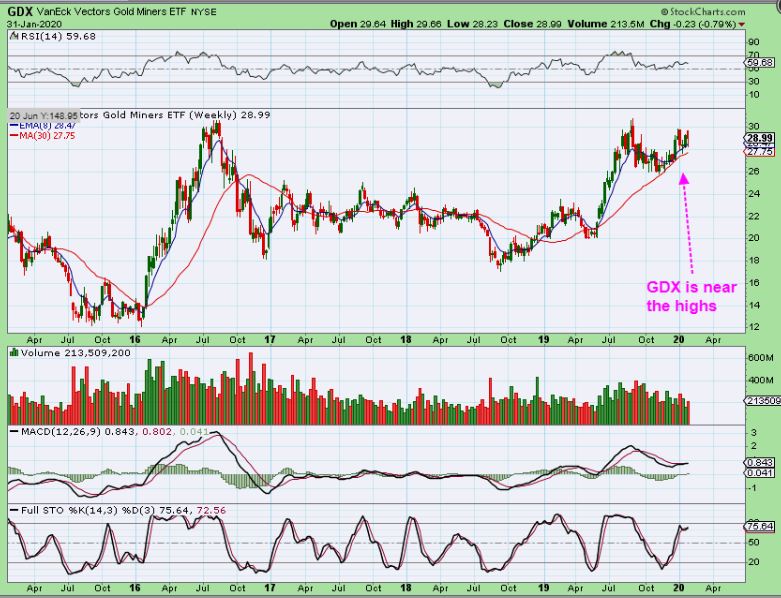
.
GDX WEEKLY #2 – GDX is a bullish set up at resistance, but yes, this can cause choppiness.
It is best not to let the day to day choppiness or wiggles cause oneself emotional anxiety. For some, it is normal market action that has been seen in the past, for others, it is day by day upsetting. If this upsets you, you always have choices. It may be best to just Step out of your trade if you cannot handle the chop, and get back in when it breaks out higher and begins to trend higher. I am long Miners with a stop & I am comfortable with the set up, but my leverage needs to me monitored due to possible decay.
.
– We have the General Markets looking vulnerable and I pointed out the VIX Pop and the SPX drop that erased weeks of gains in just 2 weekly candles. These markets COULD crash down next week before a dcl is put in place, and I am now avoiding it until the dust settles ( I do still own CGC or Miners listed on the exchange).
– Oil is near consolidation lows, but I am not trading oil at this point.
– The USD put in an ICL & Rallied, but that didn’t hinder golds progress. It continues to struggle at the 50 sma.
– The Precious Metals Sector is really pushing into a resistance area. GOLD and the Miners are at prior highs, and Silver is a bull flag also dealing with some resistance. I think that the USD will eventually roll over and that may be a catalyst that helps to push this sector though that resistance. Unfortunately, until then, we may have to deal with some pop & drop choppiness.
.
Enjoy the rest of your weekend, and thanks for being here with me at Chartfreak!
.
~ALEX
.
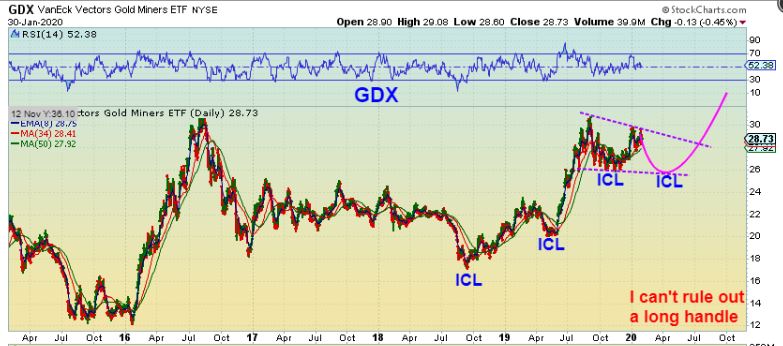
GDX – I hate to even post this, but I will. I think that we are going to break out & run soon, but I wanted to post this chart as a LESS LIKELY Scenario. I drew it as a u-shaped drop, but it would really be a choppy drop similar to the one we just saw. I view this as less likely. Why? I see NEM, FNV, DRD, AUY, BTG, NG, ELYGF, and other Miners up near the highs, and if the laggers play catch up, GDX & GDXJ would eventually push higher too. This is just something that I can’t rule out at a resistance area.
.
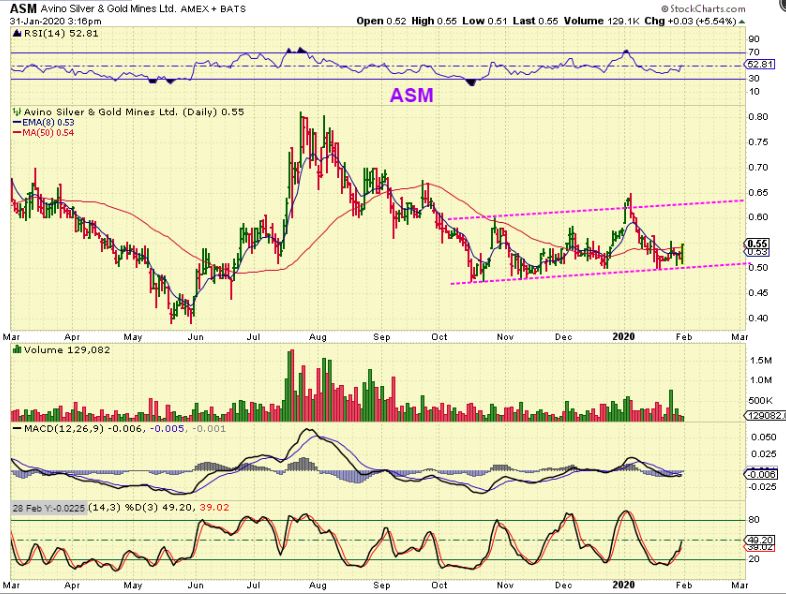
ASM – Recently I pointed out AGI & GPL as laggers that started to play catch up. They have continued slowly higher. ASM is reversing at the lows and may do the same. It could be bought with a tight stop if you wanted a lagging Miner ( it may be best to see when earnings are due first).
.
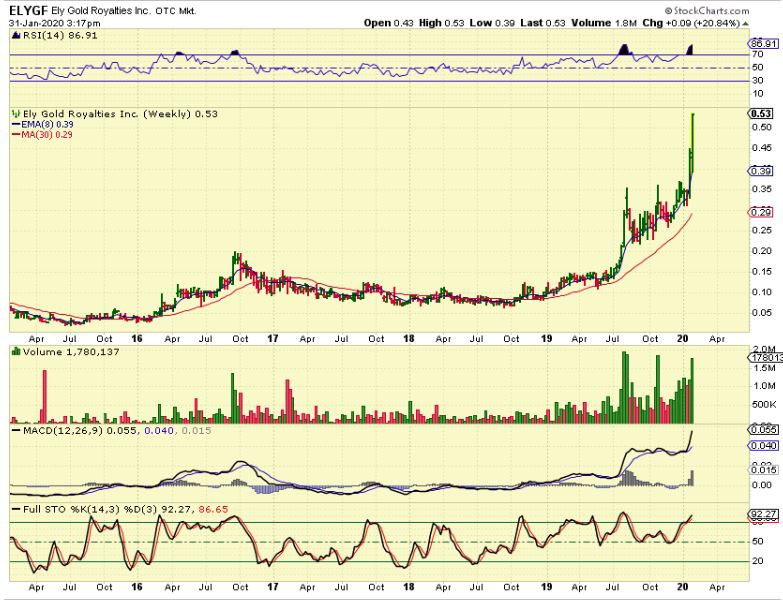
ELYGF – This was my BUY & HOLD pick, and over time I do expect this to run a lot higher. That said, whenever a stock gives me a move like this, especially when it is up 100% since October and most of it came in the last 2 weeks, I always lock some gains in and hope to re-buy on a pull back. That is just a personal rule of mine. The last 2 weeks have been straight up. I also put some of the gains into my longer term BUY & HOLD BALMF position.
.
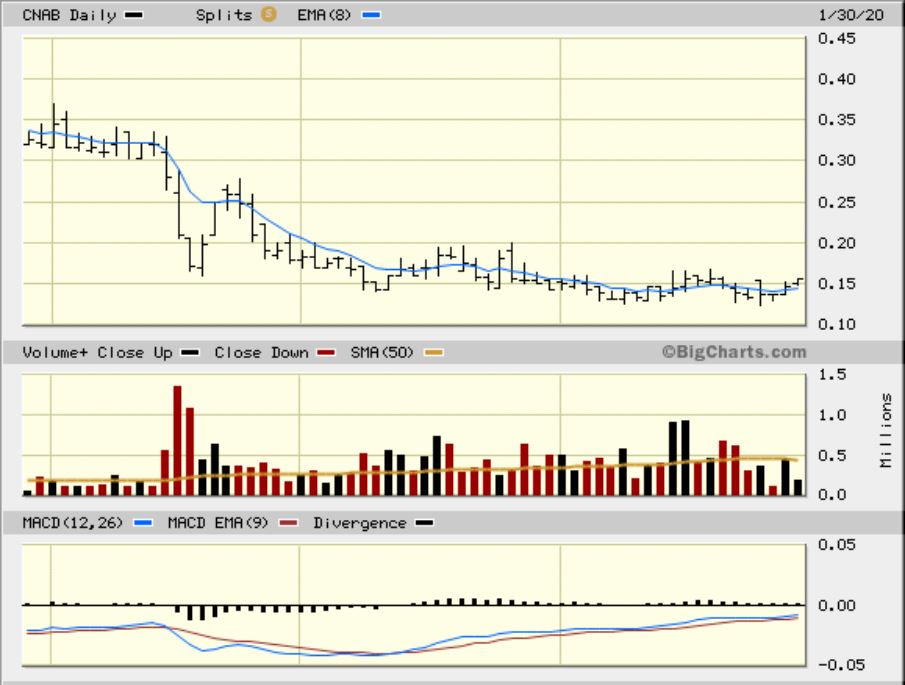
CNAB – I posted CNAB as one of those MJ Juniors that has that look that I like. We have been seeing amazing moves if the set up looks right, like NUGS, CNBX, CBDS, NXTTF, etc.
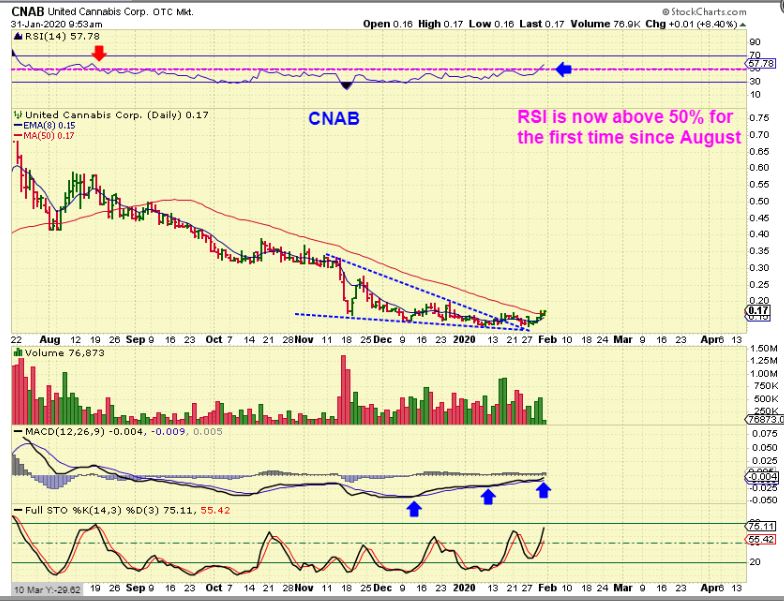
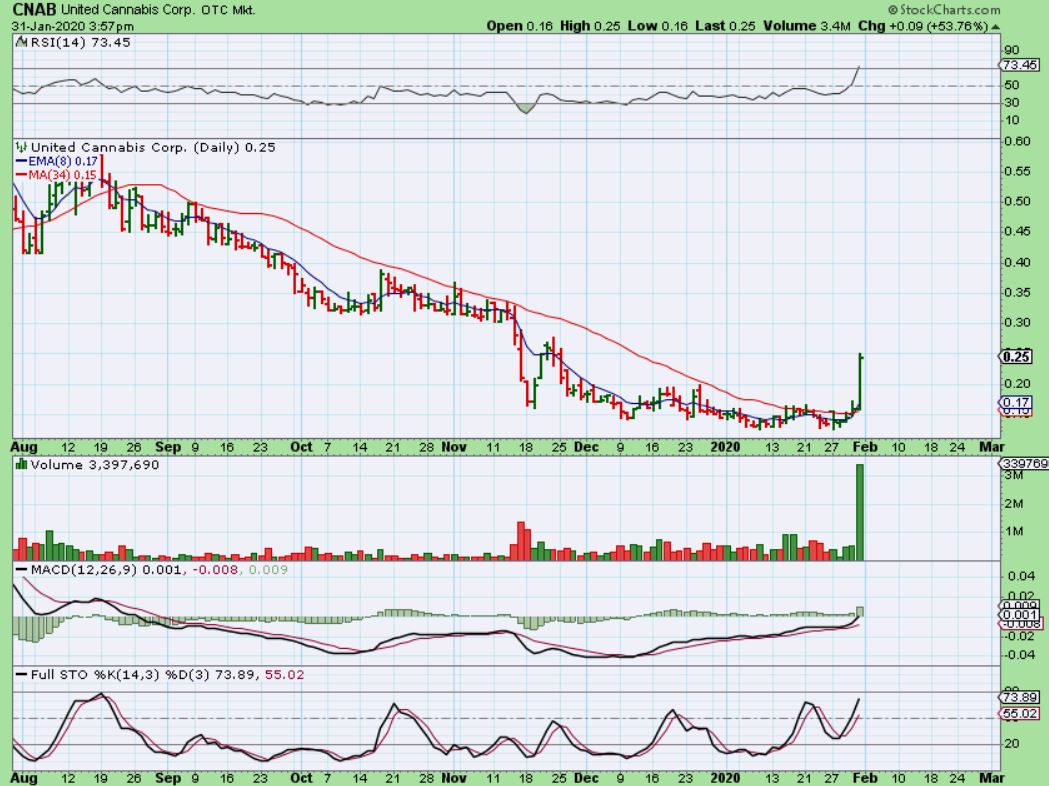
CNAB – It broke out and took off, up 54%.
.
As a reminder: Yes, I wish I put 1/2 of my account in these stocks 🙂 , BUT I DON’T! These are just trades that I am finding with special set ups, and when they Pop, they can be explosive. I am watching MMNFF, EDXC, MCOA, NXTTF, and a few others, so you can look at those charts in your spare time ( 1 yr daily & 6 month daily). I try not to get into them too early, since they can base out for weeks, so I use intraday charts and other factors to trigger the trade. CNAB broke a descending wedge and back tested it , so that was one additional sign that it might be ready to go.

