Thursday February 27
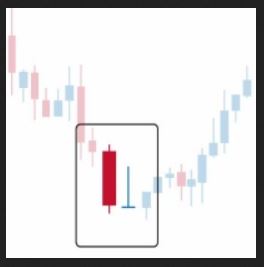
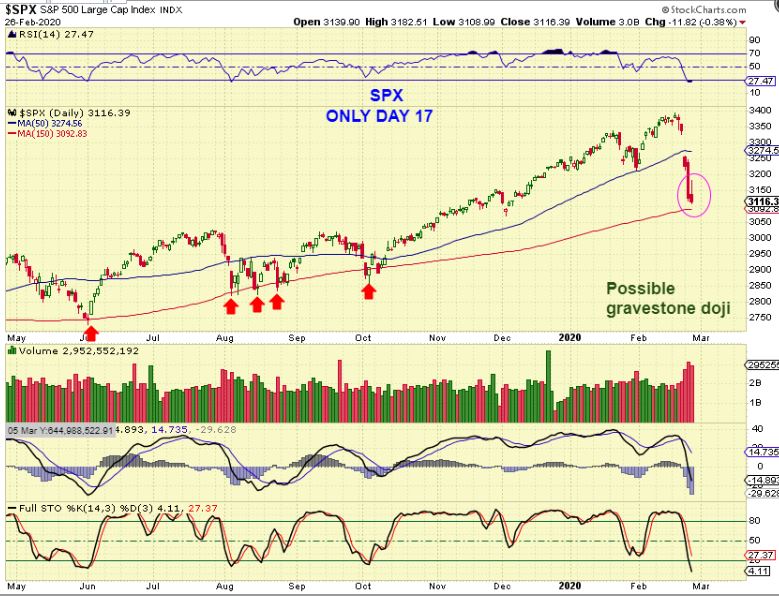
GRAVESTONE DOJI CANDLE – I have pointed these out in the past because they often look bearish by closing down at the days lows, but after a sell off, they often become reversal candles. This is what the candle looks like…
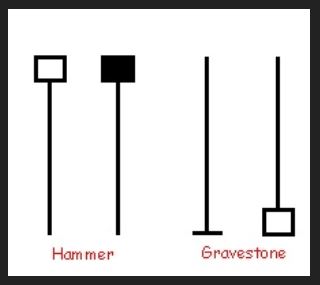
This is the reversal.
SPX – I see a gravestone doji here, so we could bounce higher, but I would only expect a bounce. Why? This is day 17 of possible 30-40 in a daily cycle, and it is a failed daily cycle. Look at AUGUST – I have said that we may see that drop & bounce to the 50 sma. It will draw in the Bulls, ‘buy the dip crowd’, they will get bullish again, and then the markets should drop again. How far?…
k
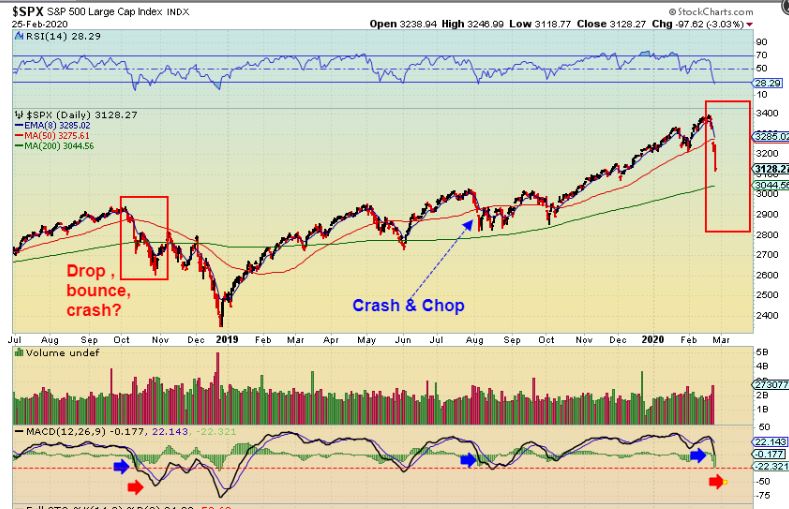
I POSTED THESE 2 POSSIBLE SCENARIOS YESTERDAY FOR WHEN A BOUNCE COMES – In OCT 2018 at the first red box, a similar drop crashed to the 200sma, bounced & dropped again.
.
BIG NEWS IN OIL
,
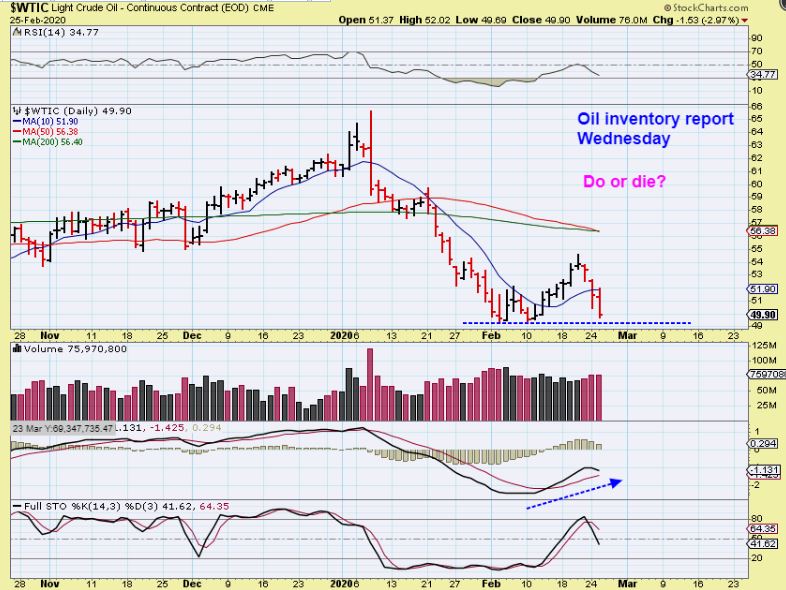
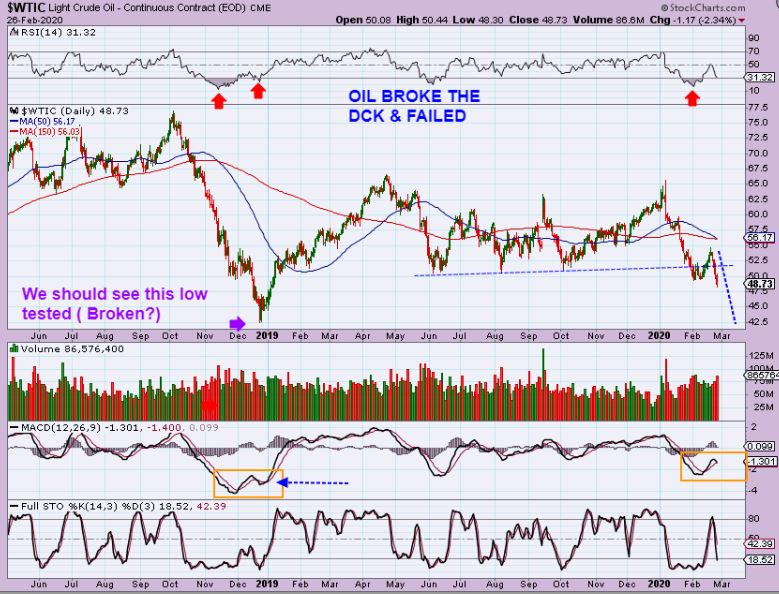
YESTERDAY I SAID: The Oil inventory report comes out Wednesday. This may break those lows, and that would be a failure. That would signal a deeper drop in a left translated daily cycle
.
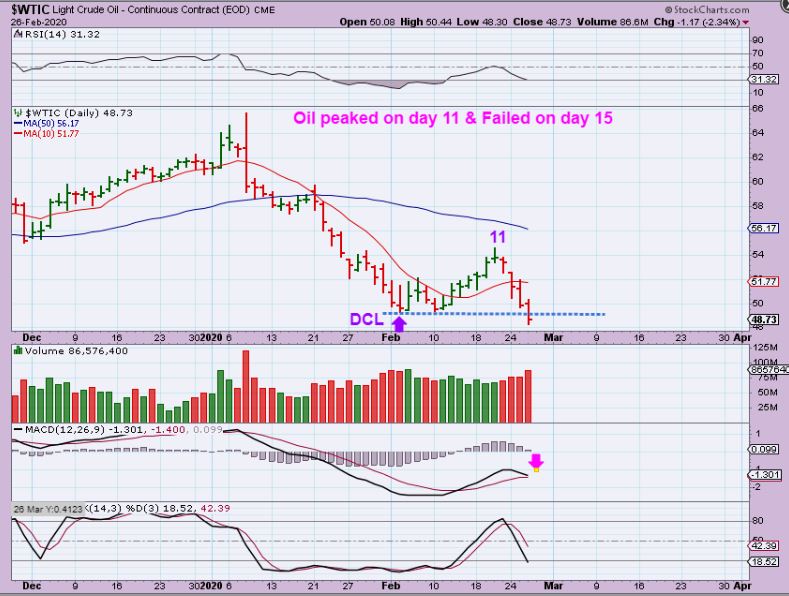
WTIC – Oil broke the lows on day 17! THAT is a failed daily cycle…
k
WTIC WEEKLY – Even with our 2 week bounce, that MACD is wide mouthed open down. Notice how the past bounces corrected it. What is a possible downside target?…
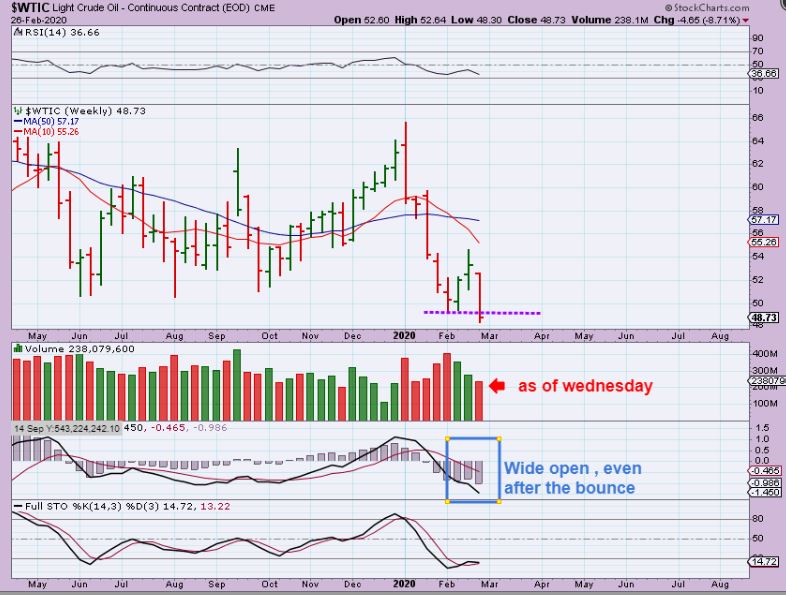
,
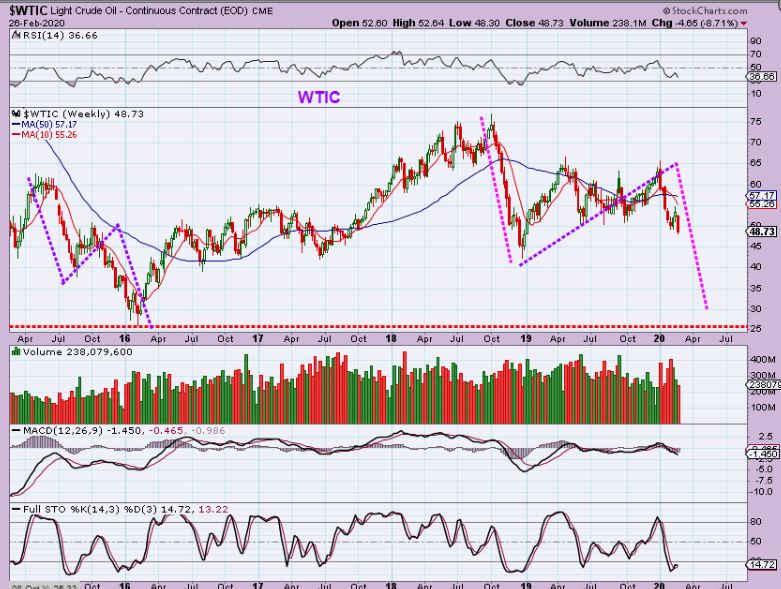
WTIC WEEKLY – $42? Hard to believe? Maybe, but with a failed daily cycle on day 17, it really does give us a sign that weeks of downside is the likely path. Along with $42, I am now also looking at …
l
g
WTIC WEEKLY – A much larger drop equal to the 2019 drop. THIS could bring us back to those 2016 lows if $42 breaks with conviction. Wow. I usually save this big picture view for weekend reports, but I thought I would just show you the implications of a break down longer term. WE HAVE SEEN IT HAPPEN BEFORE, so this is a valid possibility.
/
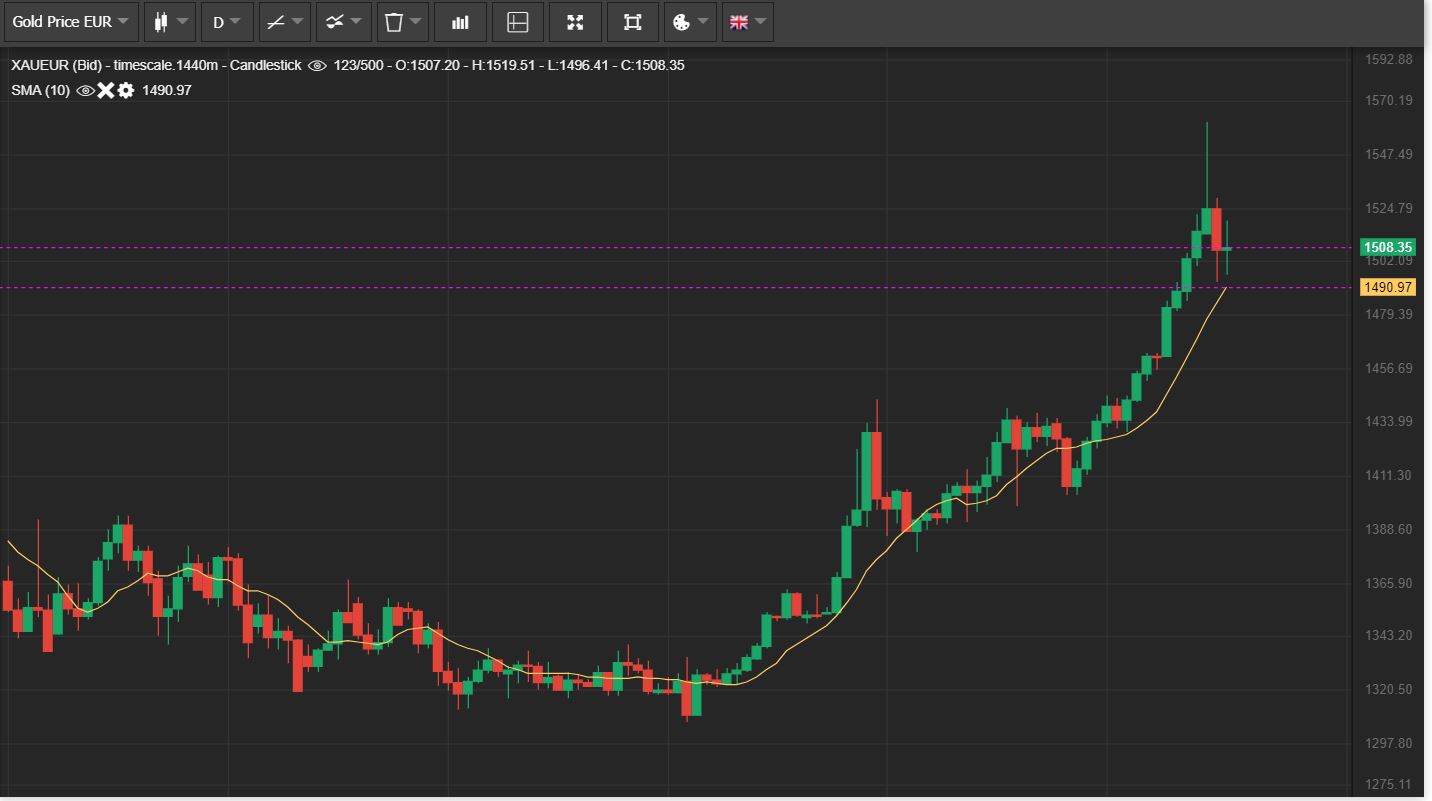
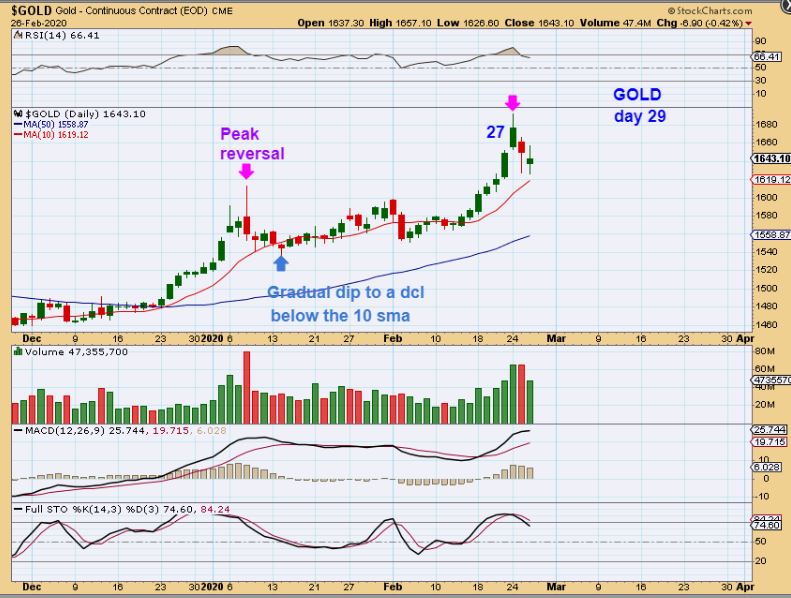
GOLD formed a DOJI. A candle of indecision. A battle of bulls & Bears that resolved equally. I am expecting a drop into a dcl, so lets discuss this…
,
GOLD #2 – I feel that we peaked on day 27, this was day 29. The last drop was a Gradual drop below the 10sma ( see the blue writing). DCL’s often form around day 33 or so lately, but we all know that they CAN come at any time in this area…
k
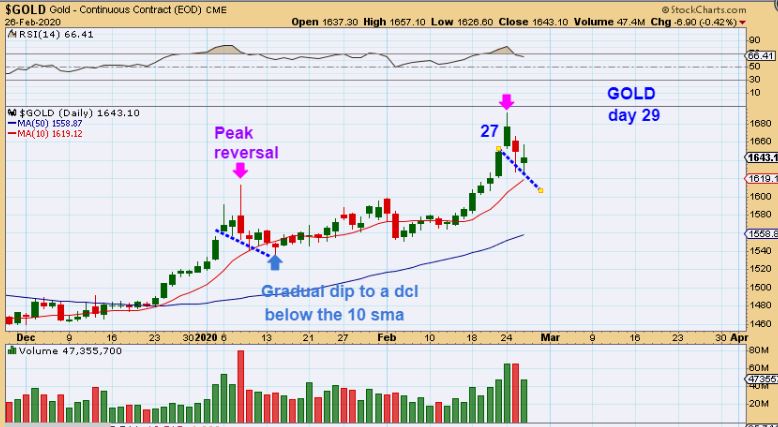
GOLD #3 – We look for a break of the 10 sma and it only lasted for one day here in January ( you will see soon that for Miners it was deeper). So we could slide down a bit more like January, or…
l
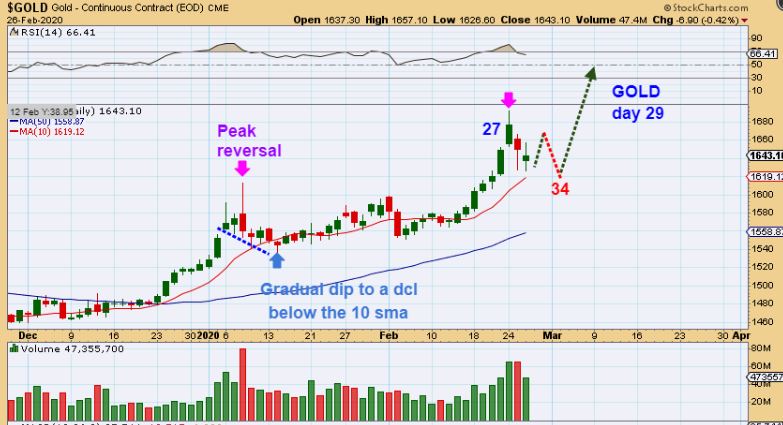
GOLD #4 – The doji can cause a bounce and an a-b-c down. I have pretty much been saying this from the start I am just repeating myself as it plays out 🙂
k
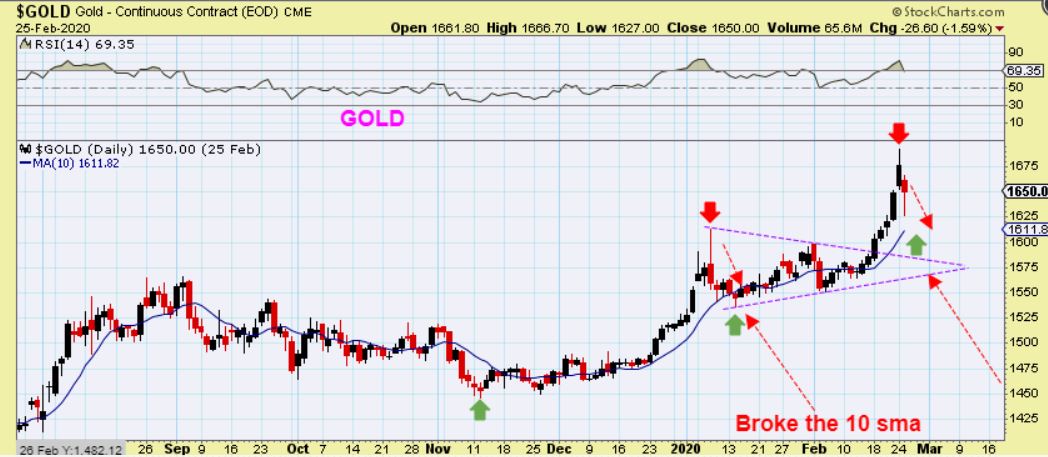
GOLD – We had a discussion in the live area about various possibilities, and I had drawn this, so I may as well post it here too. I am showing that triangle that started with a peak & drop on the first daily cycle to a quick dcl formation. This could mimic that.
k
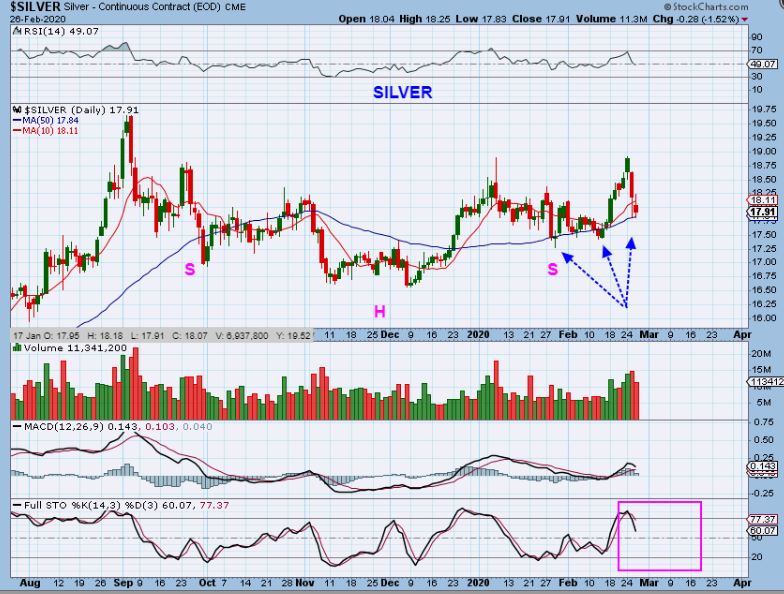
SILVER– Silver has held the 50 sma so far. I have pointed out an inverse H&S, but what if we get a shake out?…
k
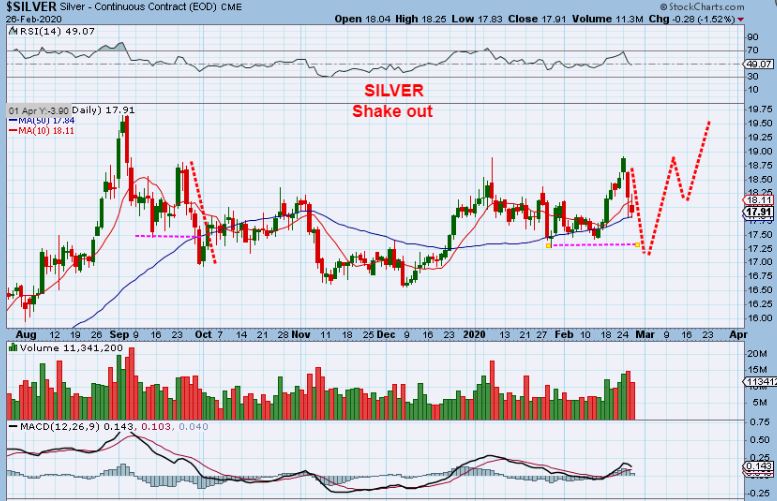
SILVER – It would still be an inverse H&S, but I find this LESS LIKELY. THIS would cause a failed daily cycle below that Jan low, and it wouldn’t make sense to the bullish side.
k
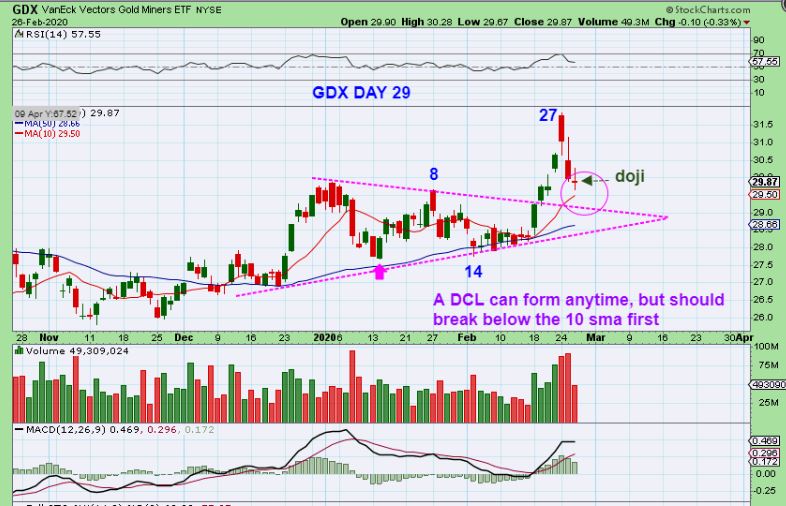
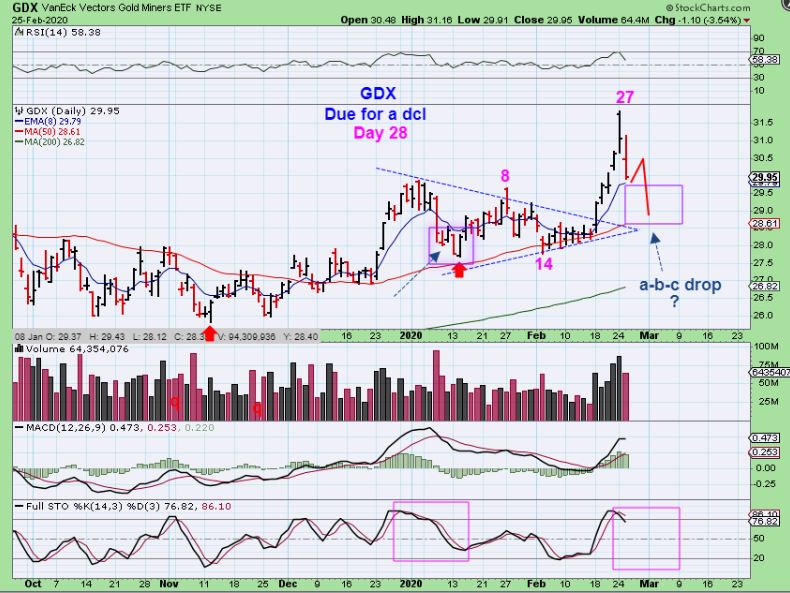
GDX – Day 29 closed with a doji too. That is Indecision, and I watched it go from Red to Green to Red to Green to Red as the day went on.
k
GDX – A dcl can form at anytime, yet we may even see a bounce first to draw in some Bulls and then shake them out. We should see a break of the 10sma ( a close under it is what we really should see) to indicate that a dcl is coming in. We don’t have that deep of a dip yet…
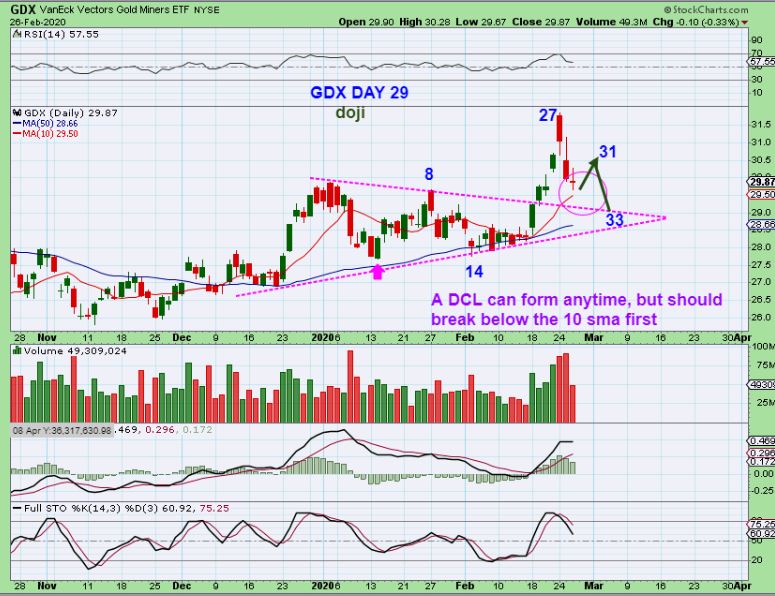
The good thing is that this is an extremely right translated daily cycle ( peak day 27), so this should rally to new highs easily after we get our low. A day 30 or 31 dcl would come in this week, but anything later would be next week, like this example of a day 33.
.
The idea of a possible bounce is nothing new. I pointed out an a-b-c type of drop yesterday too.
.
.
A note for those that reside in or read along with the live area below each report: I have to fast for 12 hrs tonight and then go and get some blood work done as part of a normal physical Thursday morning. A big part of my human weakness takes over whenever I go through this process of fasting, no coffee, etc for 12 hrs. I inevitably find myself inside of a quaint old greasy diner that I love, as I travel on my way back home. 🙂 I know I will be there tomorrow morning, so I will be late to the trading area, but I look forward to catching up on the comments when I get back. I am not really trading in this chop anyway, but if you are scalping day trades or checking out your charts – Enjoy your Thursday trading!
.
~ALEX
.
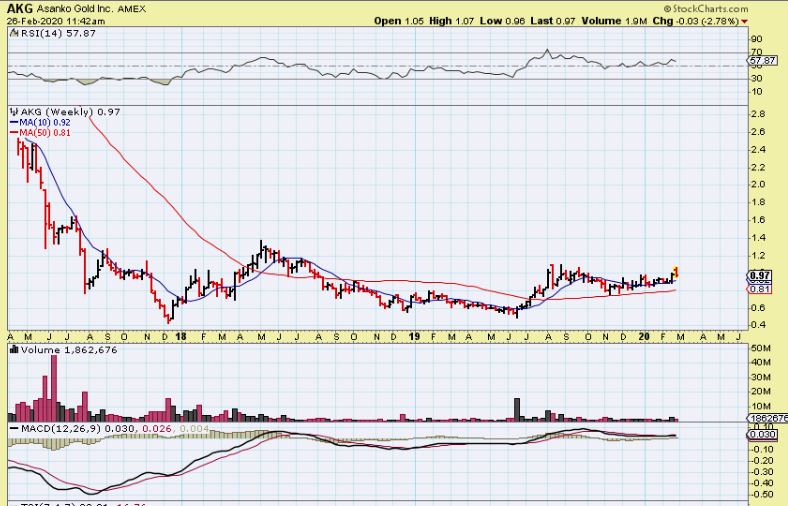
AKG – I am just posting this because I said I own it, and it is the Big Picture of AKG. It has basically been trading sideways but it looks ready to break higher soon. I do still own it because I feel that once the next DCL is in place, this may break out.
.
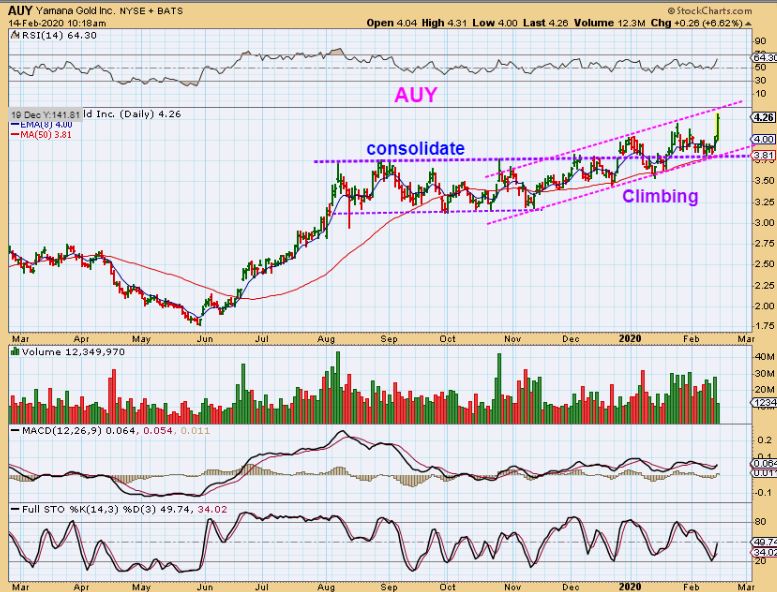
AUY – We have seen some Miners Lead The Way. AUY has really just been a series of higher lows and I pointed that out here over a week ago. These ones may not pull back as sharply as others, so how are AUY, BTG, NEM and the likes doing??
.
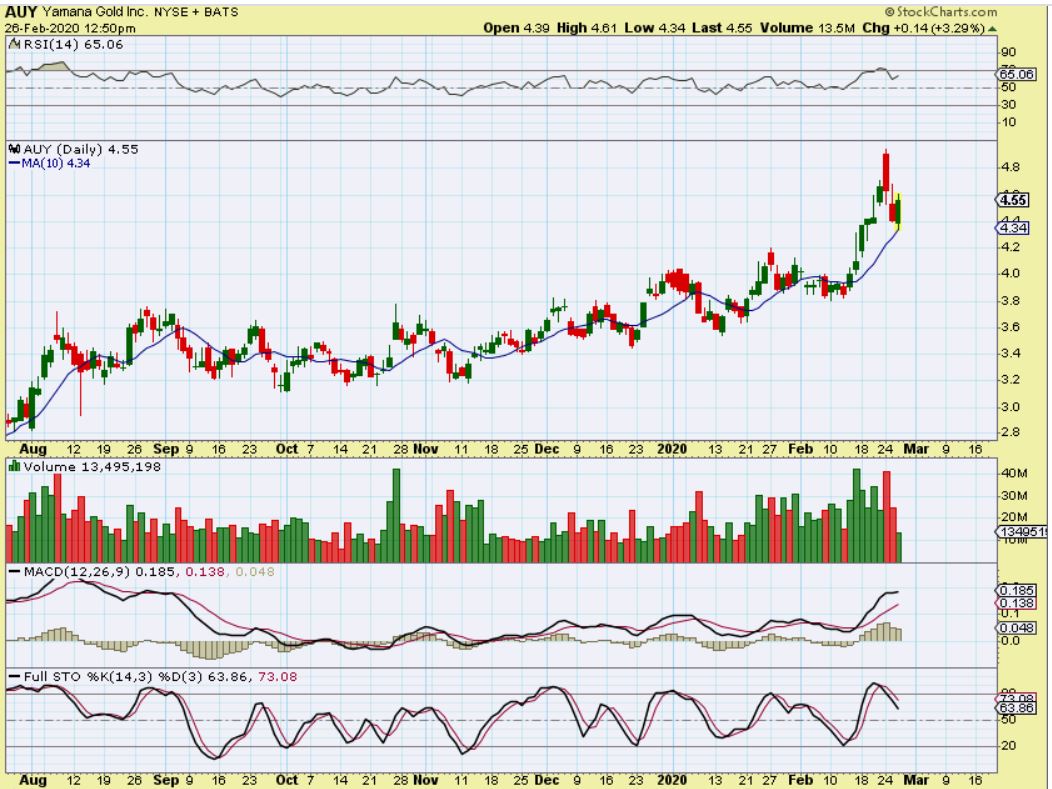
AUY – A mild pull back so far, and it may not pull back a whole lot deeper.
.
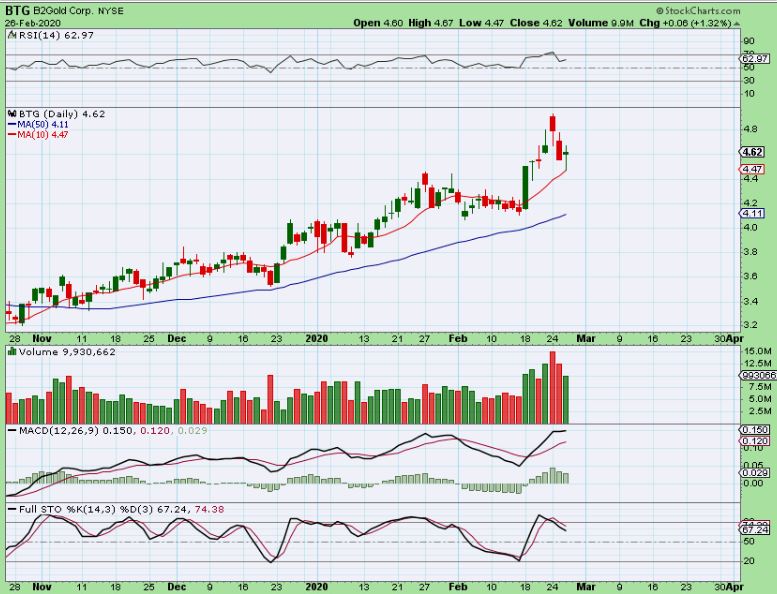
BTG -A mild pull back so far, and these MAY NOT pull back much more.
.
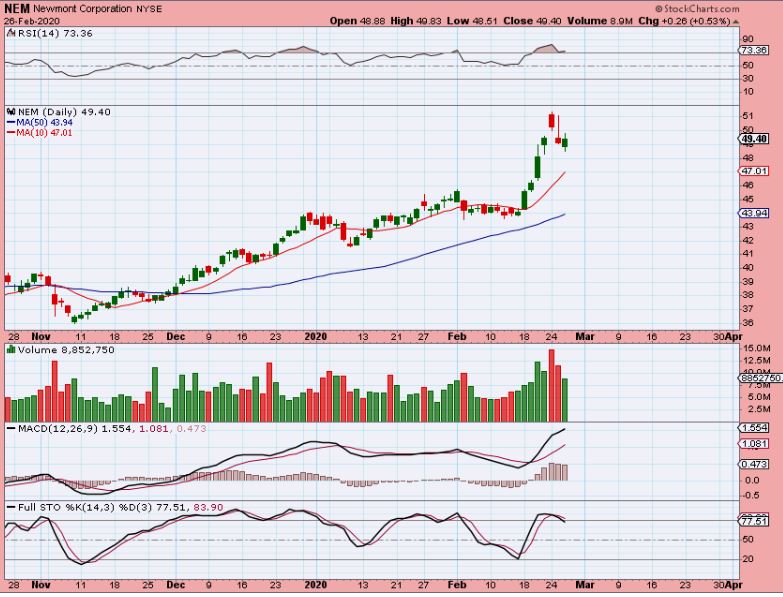
NEM – A mild pull back so far
.
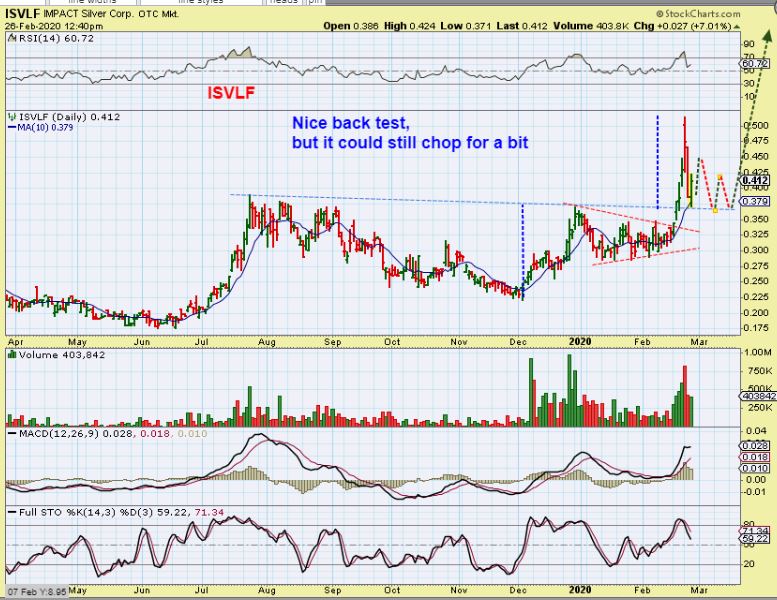
ISVLF – Others that got very extended may pull back deeper, and we see that in ISVLF for example.
.
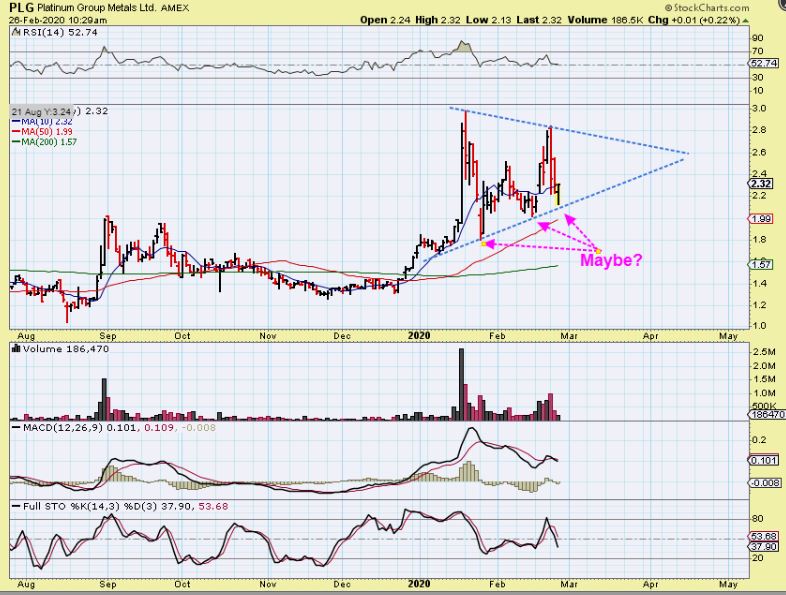
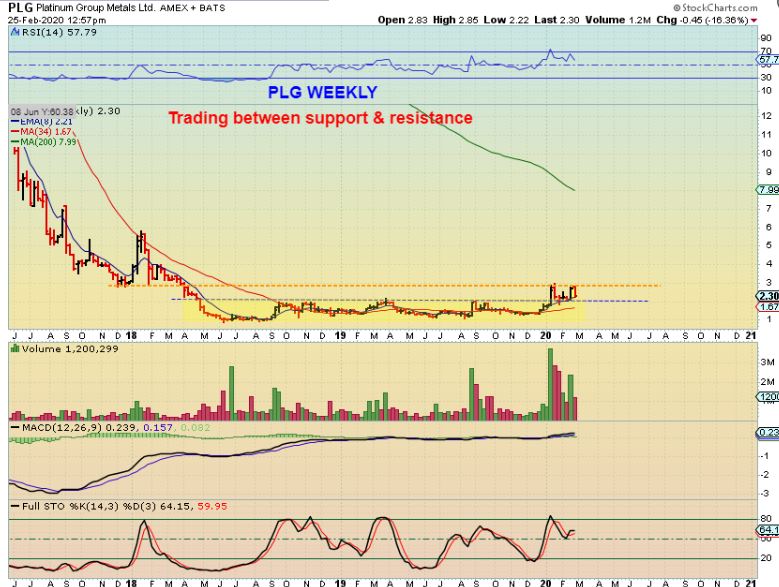
PLG – I have been discussing PLG as a Platinum miner trading between almost as high as $3, and currently the $2.30 area. It CAN drop to $2 on this chart, but so far…
.
PLG – There is the hope that Possibly / Maybe a triangle with higher lows will form? I do own it from $2 and added higher up than that too.